Review

A Review of Recent Spatial Accessibility Studies That Benefitted from Advanced Geospatial Information: Multimodal Transportation and Spatiotemporal Disaggregation

1
Department of Geography, Texas A&M University, 3147 TAMU, College Station, TX 77843-3147, USA
2
Department of Computer Science & Engineering, Texas A&M University, 3127 TAMU, College Station, TX 77843-3127, USA
*
Author to whom correspondence should be addressed.
ISPRS Int. J. Geo-Inf. 2021, 10(8), 532; https://doi.org/10.3390/ijgi10080532
Submission received: 1 June 2021 / Revised: 28 July 2021 / Accepted: 4 August 2021 / Published: 9 August 2021

Abstract

:
Spatial accessibility provides significant policy implications, describing the spatial disparity of access and supporting the decision-making process for placing additional infrastructure at adequate locations. Several previous reviews have covered spatial accessibility literature, focusing on empirical findings, distance decay functions, and threshold travel times. However, researchers have underexamined how spatial accessibility studies benefitted from the recently enhanced availability of dynamic variables, such as various travel times via different transportation modes and the finer temporal granularity of geospatial data in these studies. Therefore, in our review, we investigated methodological advancements in place-based accessibility measures and scrutinized two recent trends in spatial accessibility studies: multimodal spatial accessibility and temporal changes in spatial accessibility. Based on the critical review, we propose two research agendas: improving the accuracy of measurements with dynamic variable implementation and furnishing policy implications granted from the enhanced accuracy. These agendas particularly call for the action of geographers on the full implementation of dynamic variables and the strong linkage between accessibility and policymaking.

1. Introduction

Spatial accessibility explains the ease of access from a geographical unit to an infrastructure of interest [1]. The measures of spatial accessibility are calculated based on the interaction of three input variables [2,3]: supply (i.e., locations of infrastructure), demand (e.g., locations of people who are expected to utilize the infrastructure), and mobility (i.e., travel costs from demand locations to supply locations). Occasionally, supplementary variables, such as distance decay functions and threshold travel time, are incorporated into measurements to reflect the will of the people to visit infrastructure [4,5]. The measures provide an improved understanding of geographical issues in two aspects. The first is the illustration of the spatial disparity of accessibility [6,7] and examination of the relationship between socioeconomic conditions and accessibility. The second aspect is the identification of areas of poor accessibility, and with this, it is proposed that those locations should be supplemented with additional resources [8]. Therefore, measuring spatial accessibility may address the spatial mismatch between supply and demand and promote sufficient and equalized accessibility. Thanks to these insightful policy implications, much attention has been paid to spatial accessibility studies for various infrastructures, such as healthcare resources [2,9,10,11], job opportunities [3,12], food outlets [5,13], and other urban infrastructures [14,15,16].
In several reviews, the extensive number of accessibility-related studies were summarized focusing on empirical findings [17,18], methodological developments of metrics [19,20], and the impact of supplementary variables (i.e., distance decay or threshold travel time) [4,5,21]. As most reviews were conducted more than a decade ago [4,18,20], it was out of their scope to investigate how spatial accessibility measurements took advantage of the recent advancements in geospatial information. Recently, the enhanced availability of dynamic variables facilitated the implementation of multimodal transportation and the enhanced granularity of spatiotemporal information. In addition, it was suggested in some reviews that incorporating dynamic variables into measurements would increase accuracy and predictability [17,19]. Therefore, it is essential to follow up on how recent studies have adopted this suggestion and enhanced the performance of measurements.
In this decade, the availability of dynamic geospatial data has increased significantly through big-data analysis and open-data policy, particularly the implementation of multimodal transportation and spatial and temporal disaggregation. Specifically, the advent of sophisticated transportation databases, such as the general transit feed specification (GTFS) and Uber Movement (https://movement.uber.com/ (accessed on 1 August 2021)), enables the estimation of various travel times per different transportation modes (e.g., public transit, private car) and dynamic travel times under time-variant traffic conditions. In addition, the advent of GPS-equipped devices (e.g., smartphones) facilitates the tracing of anonymized movement of individuals [22] and enhances the space and temporal granularity of data [23]. With improved granularity, it is possible to further investigate the nonhomogeneous distribution of people within conventionally coarser geographical units (e.g., neighborhoods, census tracts) and to systematically estimate the time-variant distribution of floating populations.
Recently, dynamic variables, such as multimodal transportation and spatial and temporal disaggregation, have been incorporated into the measurements of spatial accessibility studies, which have benefitted from advancements in geospatial data. The studies were classified into two groups based on the dynamic variables they implemented. The first group was related to multimodal spatial accessibility measurements, in which investigations on the impact of various transportation modes on the disparity of spatial accessibility were developed. For instance, in a series of studies, researchers accounted for more than one alternative transportation mode (e.g., public transit, bicycles, or walks) besides private car travel, improving the predictability of the measures [24,25,26]. The second group was related to the examination of temporal changes in spatial accessibility. Given that the inputs of the measures are time variant, studies have measured spatial accessibility hourly within a day and examined how the measures changed over time. This form of advancement is aligned with “high-frequency cities” and indicates 24 h variations of urban phenomena repeated every day [27]. The big data analysis and real-time data mining facilitated the investigation of temporal changes. For example, Järv et al. [13] considered temporal dynamics of supply and demand from the opening hours of grocery stores and time-variant distribution of floating populations, illustrating temporal changes in food accessibility over 24 h. Hu and Downs [12] demonstrated how to employ census data (i.e., census transpiration planning products, CTPP) to populate temporal dynamics of the variables (i.e., supply and demand) and measured space–time job accessibility within a day.
In this review, we aimed to systematically scrutinize the methodological advancements and empirical findings of spatial accessibility measures. We took advantage of Web of Science Core Collection (https://webofknowledge.com/WOS (accessed on 1 August 2021)) as a literature database and searched for accessibility studies with the author keywords “accessibility” or “access”. Due to the fact that the initial result was voluminous (92,579), we refined the literature as articles published in geography and urban studies between 2011 and 2021 to focus on recent advancements in accessibility literature. Consequently, we obtained 1447 studies. By reading their abstracts, we investigated methodological improvements regarding accessibility measurements and recent trends in dynamic variable implementation (i.e., multimodal transportation and spatial and temporal disaggregation of measures). We assigned the reviewed studies to two sections to distinguish between conventional approaches and recent advancements. In the second section, we outline our investigation of methodological advances in traditional place-based accessibility. In the third section, we cover the recent dynamic spatial accessibility, focusing on their methodological improvements and the empirical findings. The advancements in dynamic spatial accessibility consist of multimodal accessibility and temporal changes of spatial accessibility. From the exhaustive reviews, in the fourth section, we propose a future research agenda and potential ways to promote the accuracy and predictability of measures, furnishing policy implications beyond the implementation of dynamic variables. In particular, this paper focused on place-based accessibility measures, which assess accessibility based on geographical units (e.g., census tracts, traffic analysis zones), and excluded people-based accessibility measures (i.e., accessibility of individual trajectories) [28,29].

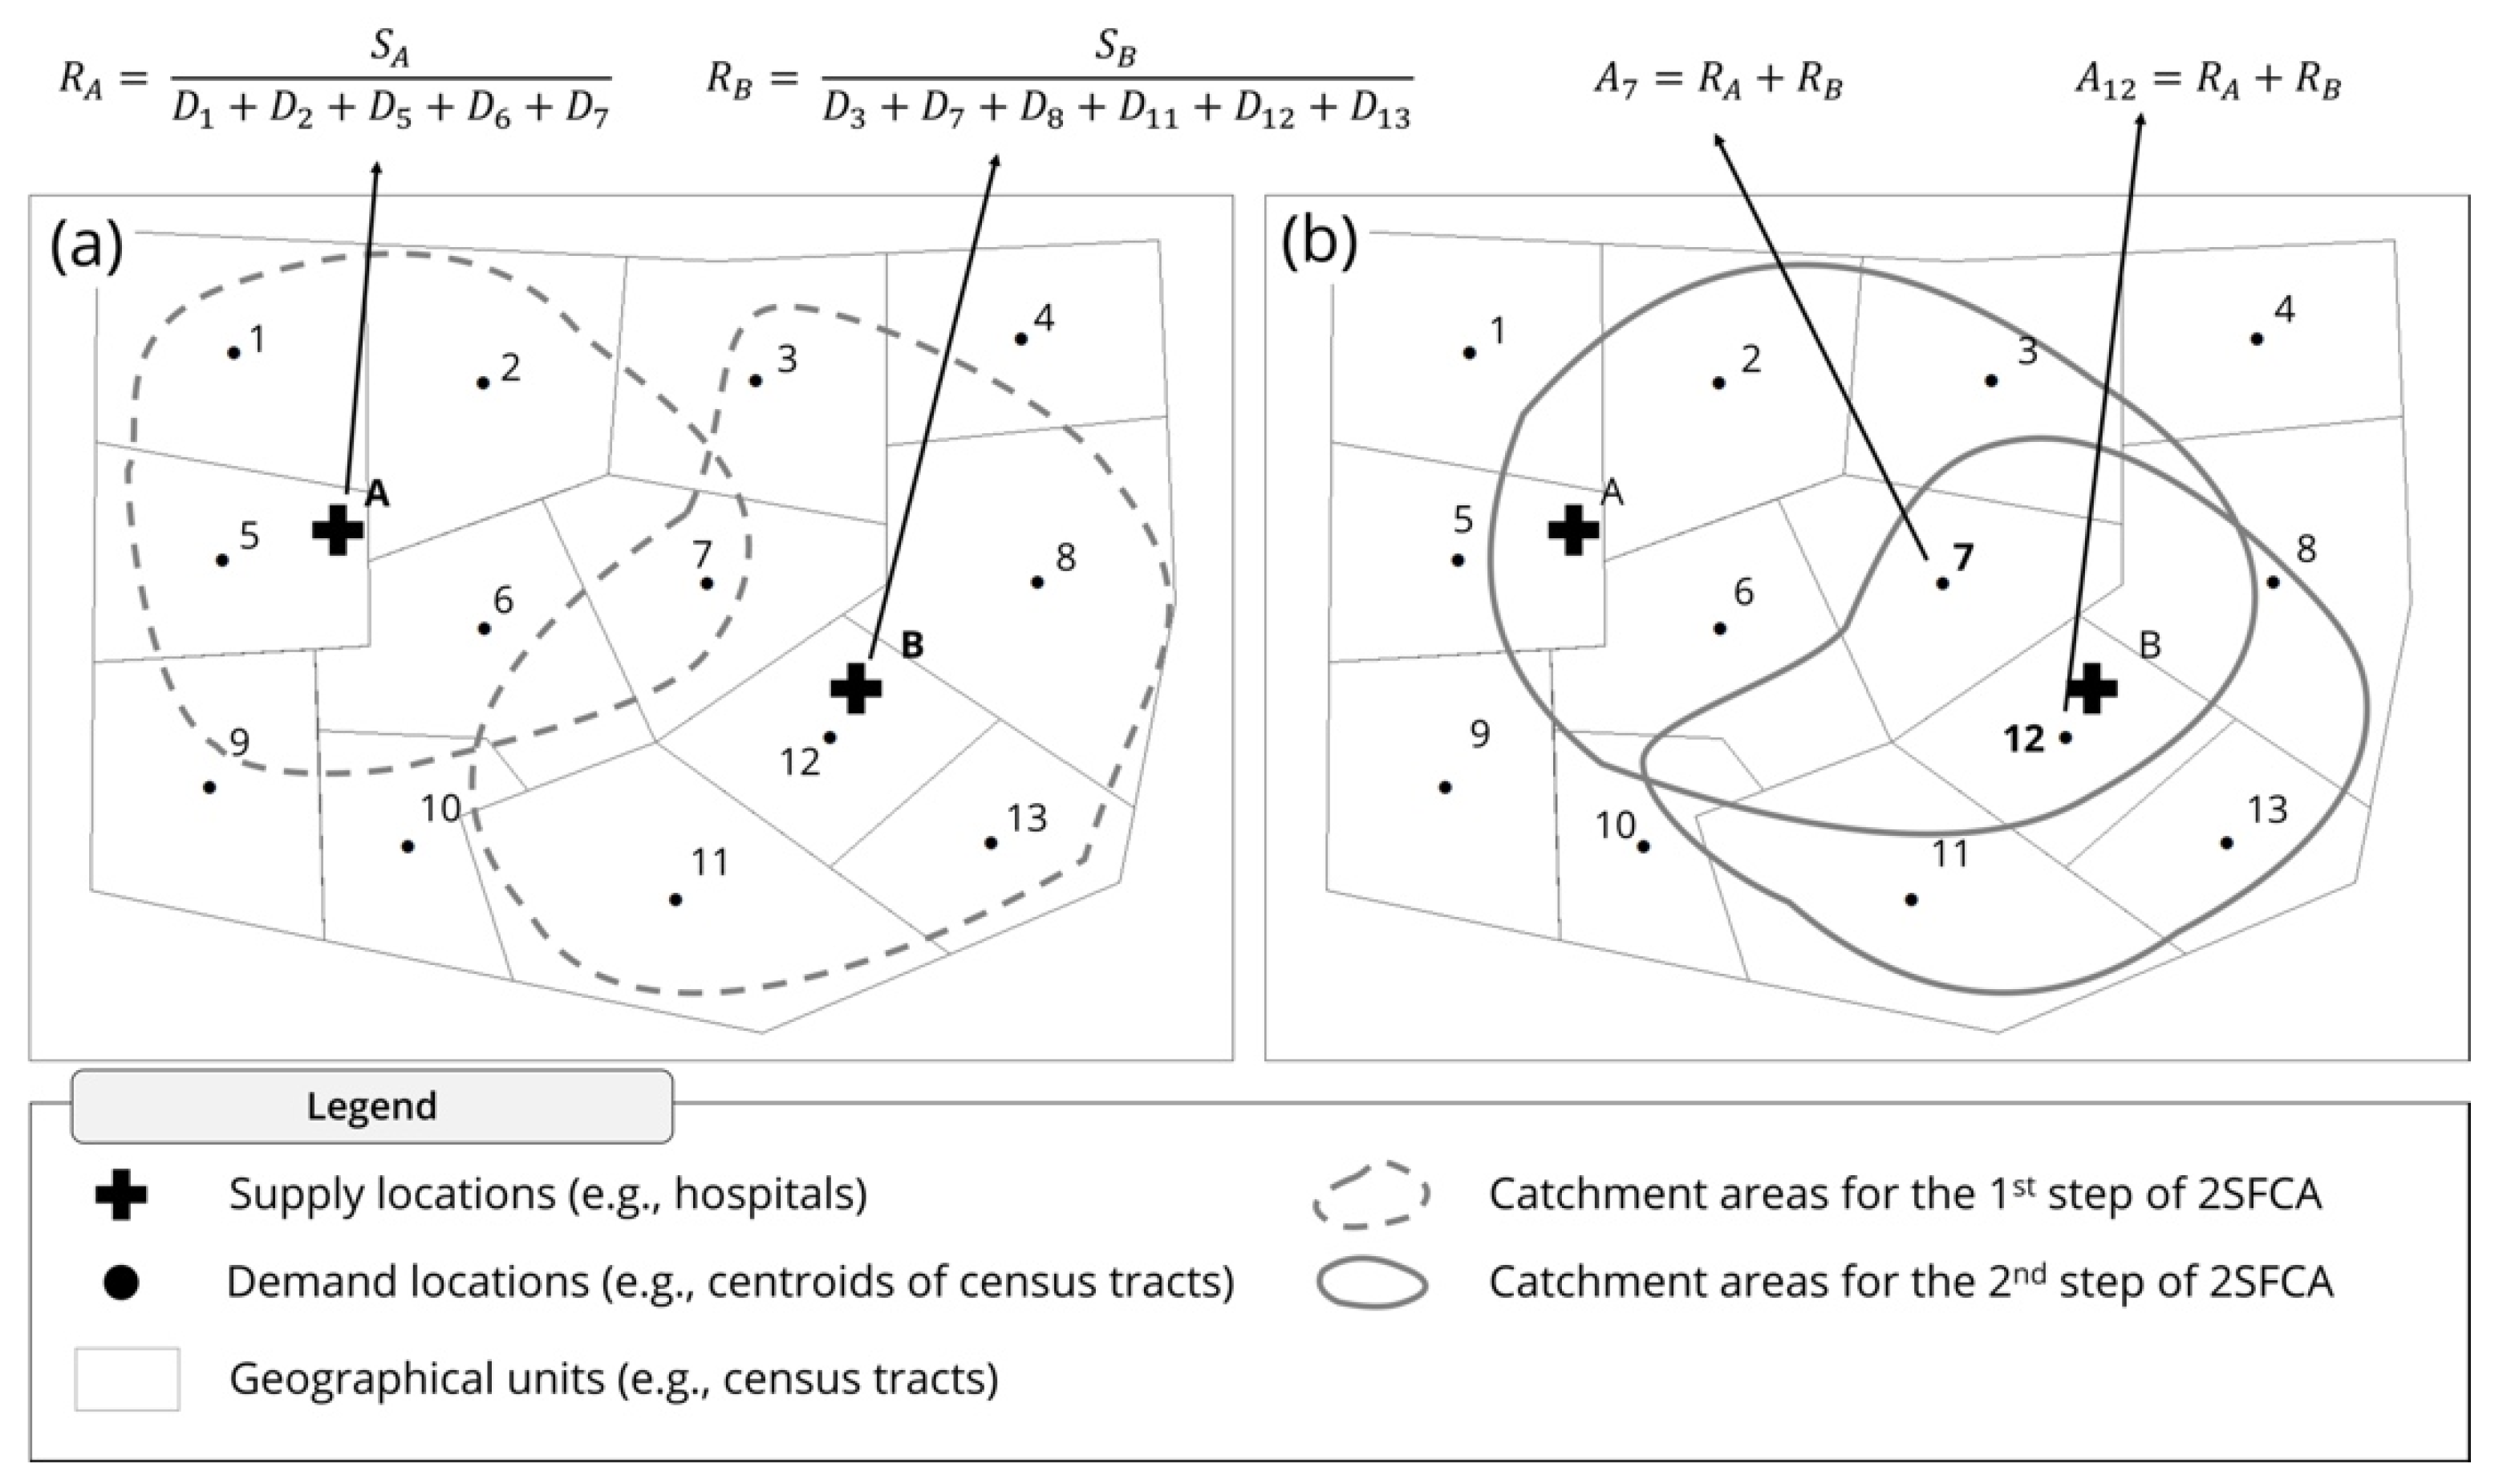
2. Methodological Advancements in Measuring Spatial Accessibility

Methodological advancements in spatial accessibility measurement have proceeded in three steps: the gravity model, Shen’s model, and the two-step floating catchment area (2SFCA) method. First, in the gravity model, also referred to as the cumulative opportunity model, the number of opportunities (i.e., supply facilities) accessible from a given location, considering spatial impedance, is measured [1]. The model is defined as follows:
O i = j S j f ( d i j )
where O i is the cumulative opportunity of location i, S j is the weight of supply facility (e.g., the number of physicians in the case of healthcare resources) at location j, d i j is the travel cost (i.e., time or distance) between location i and location j, and f ( ) is a distance decay function reflecting the spatial impedance of the travel cost (i.e., d i j ).
Second, Shen [3] improved the accuracy of spatial accessibility measurement by introducing an additional variable (i.e., demand), whereas a homogeneous distribution of people is assumed in the gravity model. He adopted the consideration of demand from the Huff model [30,31], in which the geographical units based on the probabilities of customers visiting a shopping center are delineated. Shen’s model [3] is defined as follows:
A i = j S j f ( d i j ) k D k f ( d k j )
where A i is the accessibility at location i, S j is the weight of supply facility at location j, d i j is the travel cost between location i and j, and f ( ) is an impedance function by which the travel cost is constrained. D k is the number of people (i.e., demand) at location k.
Finally, the limitation of Shen’s model, in which every supply facility is considered to provide service to every demand location in the case of an inappropriate distance decay function, is addressed in the 2SFCA method [2,32]. A threshold travel time is employed in the model to reflect the will of the customer and to define the locations accessible within the threshold travel time, such as a catchment area. In this method, spatial accessibility is measured in two steps using the following formulas:
R j = S j k { d k j d 0 } D k f ( d k j )
A i = j { d i j d 0 } R j f ( d i j ) = j { d i j d 0 } S j f ( d i j ) k { d k j d 0 } D k f ( d k j )
where R j is the supply-to-demand ratio of the supply facility at location j; S j is the weight of supply facility at location j; D k is the demand (e.g., population) in location k; d k j   o r   d i j is the travel cost from location k (or i) to location j; f ( ) is an impedance function by which the travel cost is constrained; d 0 is the threshold travel cost, by which the catchment area is created; and A i is the accessibility measure of location i.
As its name implies, the 2SFCA method consists of two steps (Figure 1). In the first step of the method (Equation (3)), the supply-to-demand ratio of each supply facility is calculated; the weight of the supply facility is divided by the sum of demand, through which locations fall into the catchment area (i.e., accessible within the threshold travel time). For instance, assume hospital A in Figure 1a has five census tracts accessible within a predefined threshold travel time. Therefore, the supply-to-demand ratio of hospital A (i.e., R A ) is obtained by dividing the weight of supply (i.e., S A ) by the sum of every accessible demand location (i.e., D 1 + D 2 + D 5 + D 6 + D 7 ). In the second step (Equation (4)), the supply-to-demand ratio of supply facilities is summed up, indicating the locations that are accessible within the threshold travel time from each demand location. For example, assume census tracts 7 and 12 in Figure 1b can access both hospitals in the area within the threshold travel time; therefore, the accessibility measures of the locations (i.e., A 7 and A 12 ) are the sum of the supply-to-demand ratio of both hospitals (i.e., R A + R B ).
With the 2SFCA method, significant insight into spatial accessibility studies is provided, considering spatial impedance and local competition (i.e., supply-to-demand ratio) within catchment areas. Thanks to its straightforward and compelling characteristics, not only has the method been predominantly adopted in spatial accessibility studies, but it also entailed numerous follow-ups (i.e., the 2SFCA family), complementing each other to improve accuracy. The methodological advancements in the descendants can be classified into three categories: various distance decay functions, various sizes of catchment areas, and reflection of the preference of the customer. In the first category, various types (e.g., discrete, continuous, or hybrid) of distance decay functions have been examined to address dichotomous measures of the original 2SFCA and enhance the prediction of the spatial impedance. As the spatial impedance differs by region and facility [33], researchers incorporated a diverse range of distance decay functions: Gaussian distribution [34,35], Kernel density [36], Log-logistic distribution [37], exponential function [38], and hybrid function [39]. The second category involves using different catchment sizes to reflect that rural residents travel further than city residents to offset the low density of infrastructures [40]. Given that an inappropriate catchment size may underestimate spatial accessibility measures, either diverse threshold travel time based on a spatial setting [10] or predefined supply-to-demand ratio [9] were implemented in studies. In studies associated with the third category, either an additional step [33] or an additional distance decay function [41] were introduced to consider the tendency of people to choose a closer one when multiple facilities are available.

3. Dynamic Spatial Accessibility: Incorporating Dynamic Variables into the Measurements

With the enhanced availability of dynamic variables, they were incorporated into the measurements in studies in two aspects: multimodal spatial accessibility and temporal changes of spatial accessibility. Studies adopted advancements in people-based accessibility measurements (e.g., space–time accessibility), taking advantage of the different velocities of movements and finer space and time granularities [28,29]. In the meantime, the downside of people-based accessibility has been addressed, which is that it is challenging to adopt for policymaking [19]. The measures of people-based accessibility vary by the trajectory of each person, which requires a substantial amount of information (e.g., trajectory data for each person) and entails a substantial computational intensity [28,42]. Besides, the enhanced granularity of space and time is subject to be compromised when the measures are generalized for geographical units, given that decision making is frequently made based on a place, not people [19].

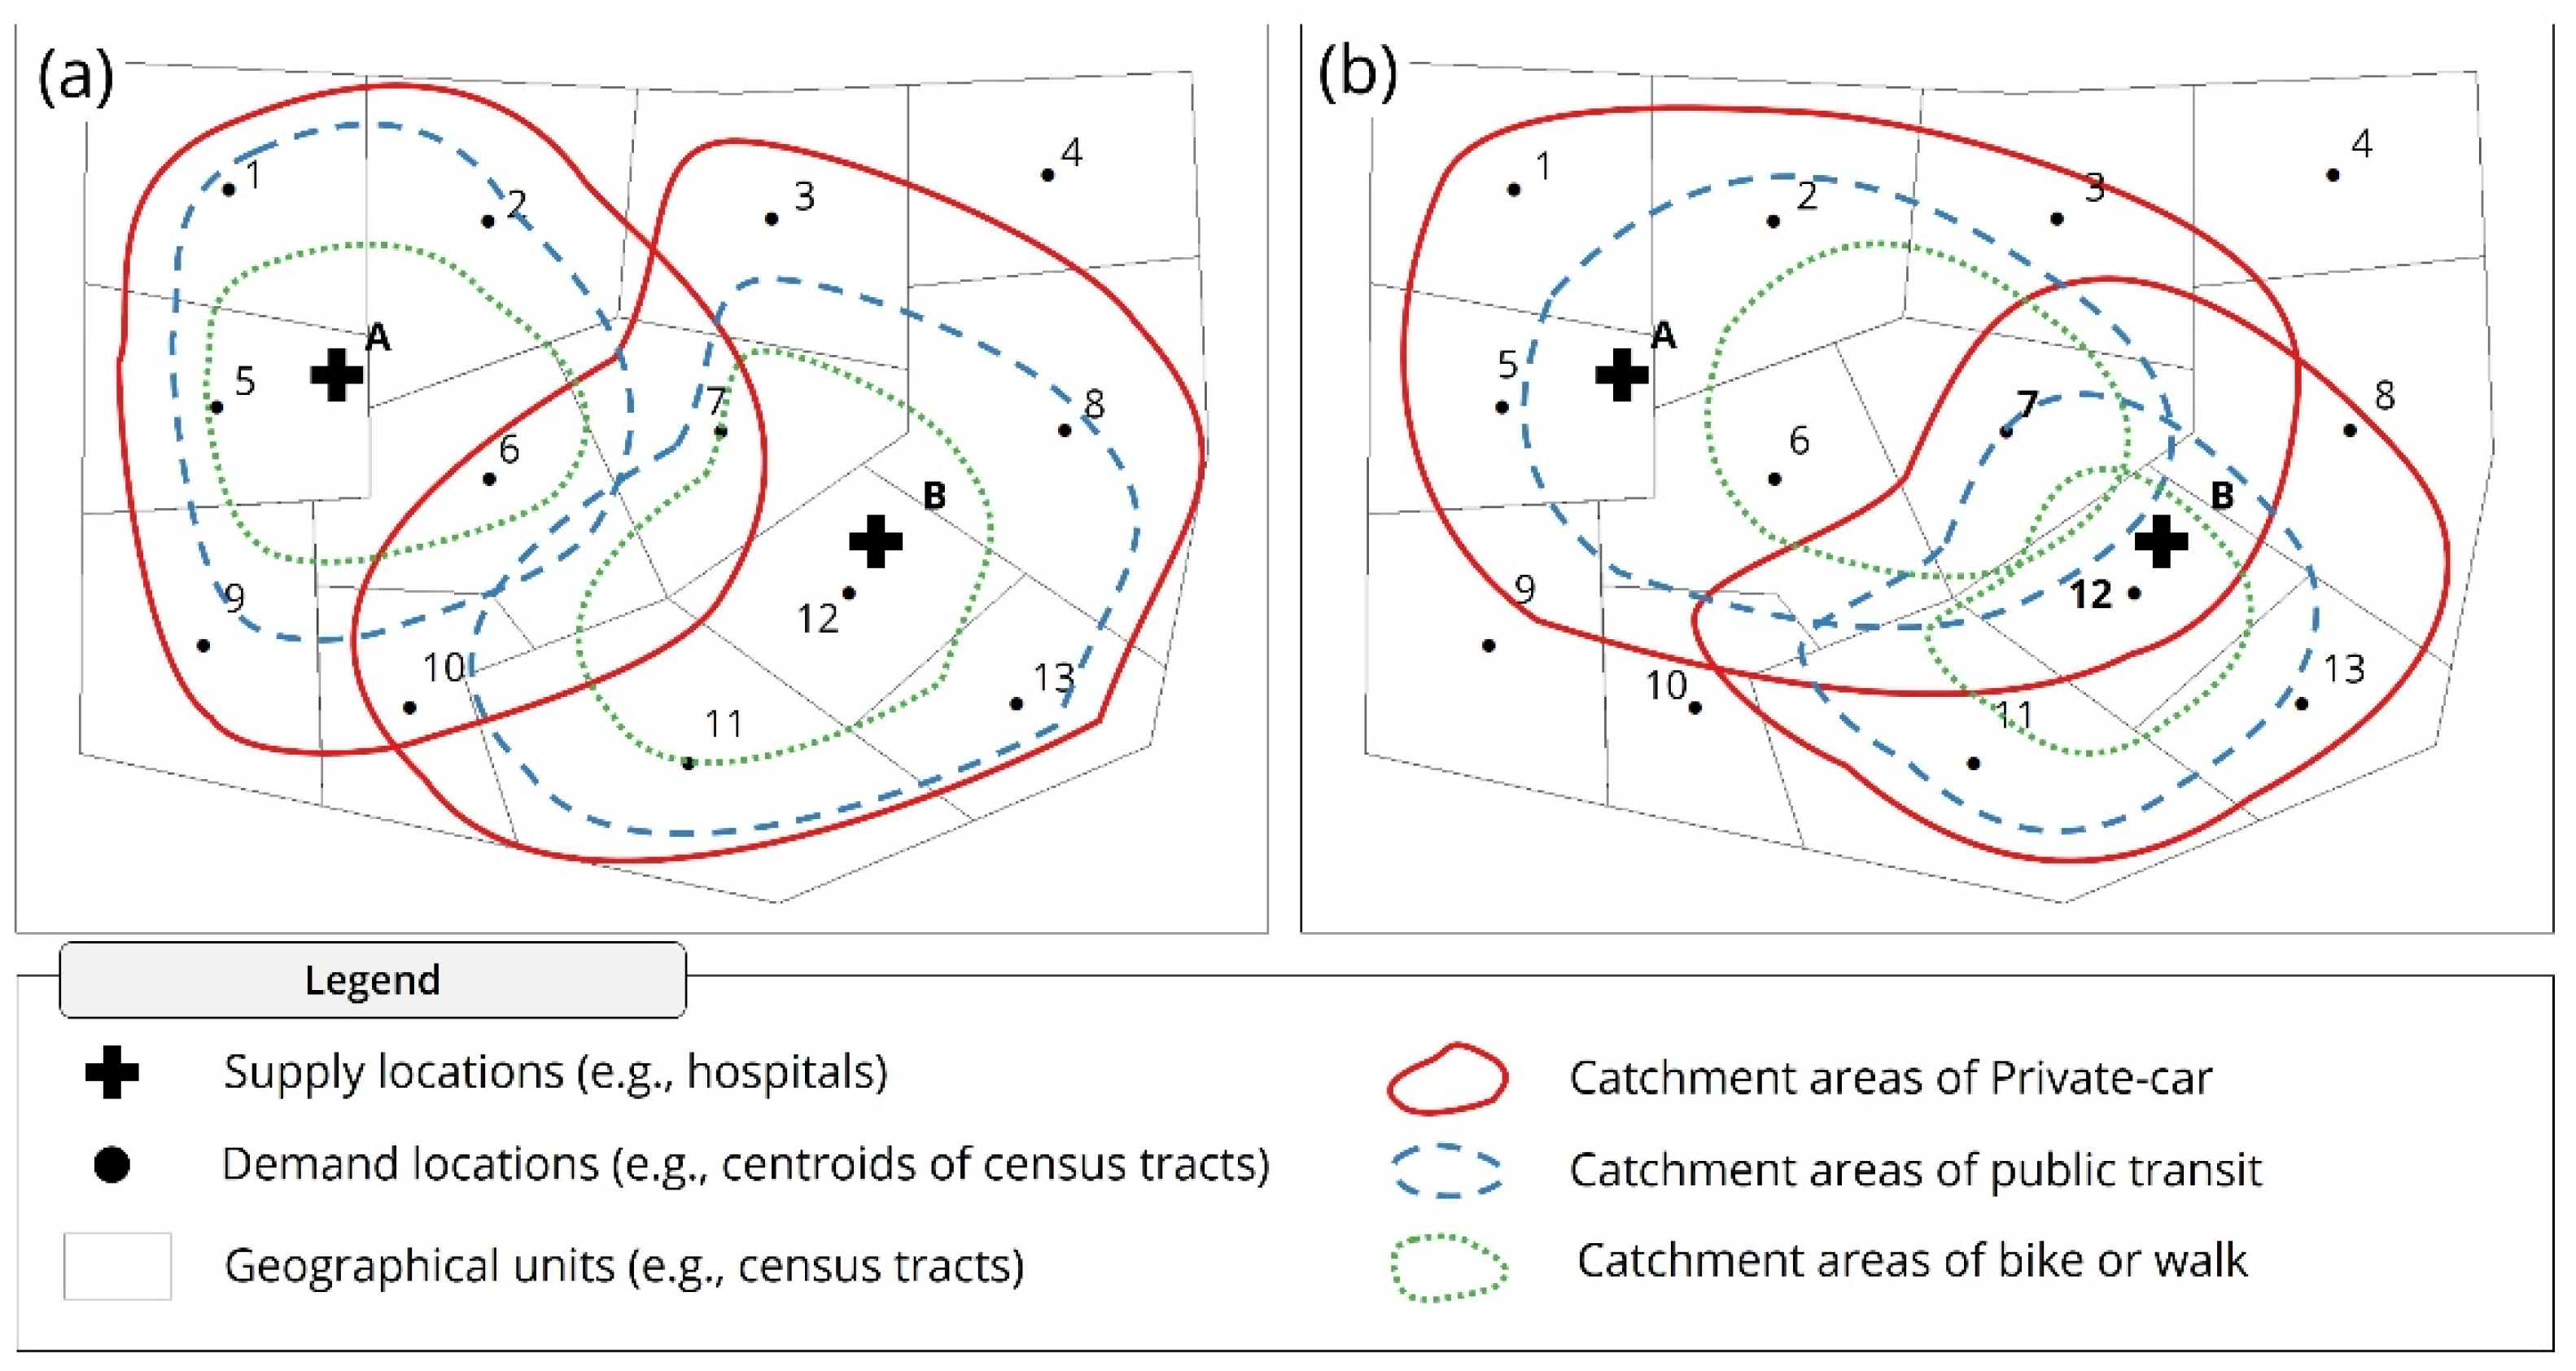
3.1. Multimodal Spatial Accessibility

The first group of dynamic spatial accessibility studies involved multimodal spatial accessibility measurements [24,25,43]. In previous studies, the use or preference of various kinds of transportation modes, such as public transit, bicycles, walks, and private cars, was considered (Figure 2). They aimed to reflect the different travel distances or speeds of each transportation mode and its impact on the measures. Specifically, Equations (5)–(7) estimate the number of people (i.e., D k m ) at a geographical location (i.e., k ) who are likely to take a type of transportation (i.e., m ) to access an infrastructure. In addition, separate threshold travel times and distance decay functions are implemented in each transportation mode. Consequently, the supply-to-demand ratio (i.e., R j m ) and accessibility measures (i.e., A i m ) of a location per mode are obtained. Equation (7) aggregates each accessibility measure per mode, based on the ratio of the riders utilizing each transportation mode to produce a synthesized accessibility measure. The equations of multimodal spatial accessibility are defined as follows:
R j m = S j k { d k j m d 0 m } m n D k m f ( d k j m )
A i m = j { d i j m d 0 m } m n R j m f ( d i j m ) = j { d i j m d 0 m } v n S j f ( d i j m ) k { d k j m d 0 m } m n D k m f ( d k j m )
A i = k m D k m A i m k v D k m
where m refers to transportation mode, R j m represents the supply-to-demand ratio of the supply facility j of the people who are likely to utilize a transportation mode m , A i m denotes the accessibility measures of location i with a transportation mode m , and A i is the integrated accessibility measures of every transportation mode at location i .
Multimodal spatial accessibility enhances the accuracy and predictability of measurements, reflecting real-world dynamics. Implementing multimodal transportation was proposed to address the limitation of conventional spatial accessibility measurements, which assumed only a single mode (i.e., car) for mobility. Alternative transportation modes (e.g., public transportation, bicycles, and walks) may be essential for people with poor socioeconomic conditions, given that they may not have access to private vehicles [24]. Additionally, a significant portion of travelers, particularly for big cities or the elderly, is accounted for in public transportation [44,45,46].
Since the initial proposal of multimodal spatial accessibility by Mao and Nekorchuk [24], the methodological advancements could be summarized into two groups: (i) a simple comparison of spatial accessibility between different transportation modes and (ii) synthesized measures of spatial accessibility considering multimodal transportation. In the first group of studies, it was demonstrated that the accessibility gap was attributed to different transportation modes. The characteristics of each transportation mode were incorporated into their measurements by assigning different travel speeds (e.g., 10 mph for a bus, 40–70 mph for a private car [24,47]) and allocating longer threshold travel times for alternative modes (e.g., 60 min for a bus, 30 min for a private car; [25]). Alternative transportation modes are frequently slower than private cars because public transit (e.g., bus or subway) travels along a designated route [43], whereas bicycles or walks are nonmotorized modes of transport [26]. To implement multimodal transportations, researchers either configured a separate layer for alternative transportations in addition to the generic transportation network for private car travel or employed a sophisticated database (i.e., general transit feed specification; GTFS) [48] or third-party web APIs (application programming interface) [49], such as Google [26,50,51]. This improved analysis accuracy, as they reflected door-to-door travel with walking from an origin, riding along a predefined route, and walking to a destination [25,43].
The multimodal spatial accessibility studies of the second group had their accuracy of measurements improved with synthesized measures of accessibility by considering several transportation modes. In these studies, either the ratio of travelers per transit mode per location [25,43,50,52] or the preference for a certain transit mode [53,54] were employed. In this feature, the competition between people using different transportation modes but sharing the same facility is reflected. The advantage of census data (e.g., car ownership) was considered, assuming that households without a car would only take public transportation [24,51,52]. It was also assumed in these studies that people would prefer to walk to green spaces over bicycling and driving when they could walk to a park within a given threshold travel time [53]. The partitioning of people with transportation modes is critical for a synthesized index of accessibility with various transportation modes [25,52] and intermodal competition for each transportation mode [43,50].
Multimodal spatial accessibility studies have resulted in several empirical findings, such as significant interregional and intermodal accessibility disparities. Whereas sufficient accessibility in downtown areas and insufficient accessibility in peripheral areas persisted [46,51], the most critical finding was that conventional single-mode (i.e., car) measurements would overestimate accessibility in rural or suburban regions [26,48,52]. Due to the disadvantages of alternative transportation modes (i.e., slower speed and predefined routes), only travel with cars allowed access from peripheral to downtown areas, where most infrastructures were located [43]. The accessibility by car provided a dispersed pattern of measures due to a larger catchment area, whereas the accessibility by the alternative methods produced only a few clustered regions with sufficient values [26,50]. Unfortunately, this interregional disparity would persist; many cities put efforts into providing additional public transportation for downtown areas, whereas they frequently disregard the demand in rural/suburban areas [44]. Therefore, the scholars emphasized that the inter-region disparity would be correlated to the socioeconomic conditions of regions [55], and policymakers should pay attention to public transit in peripheral regions [24,51].

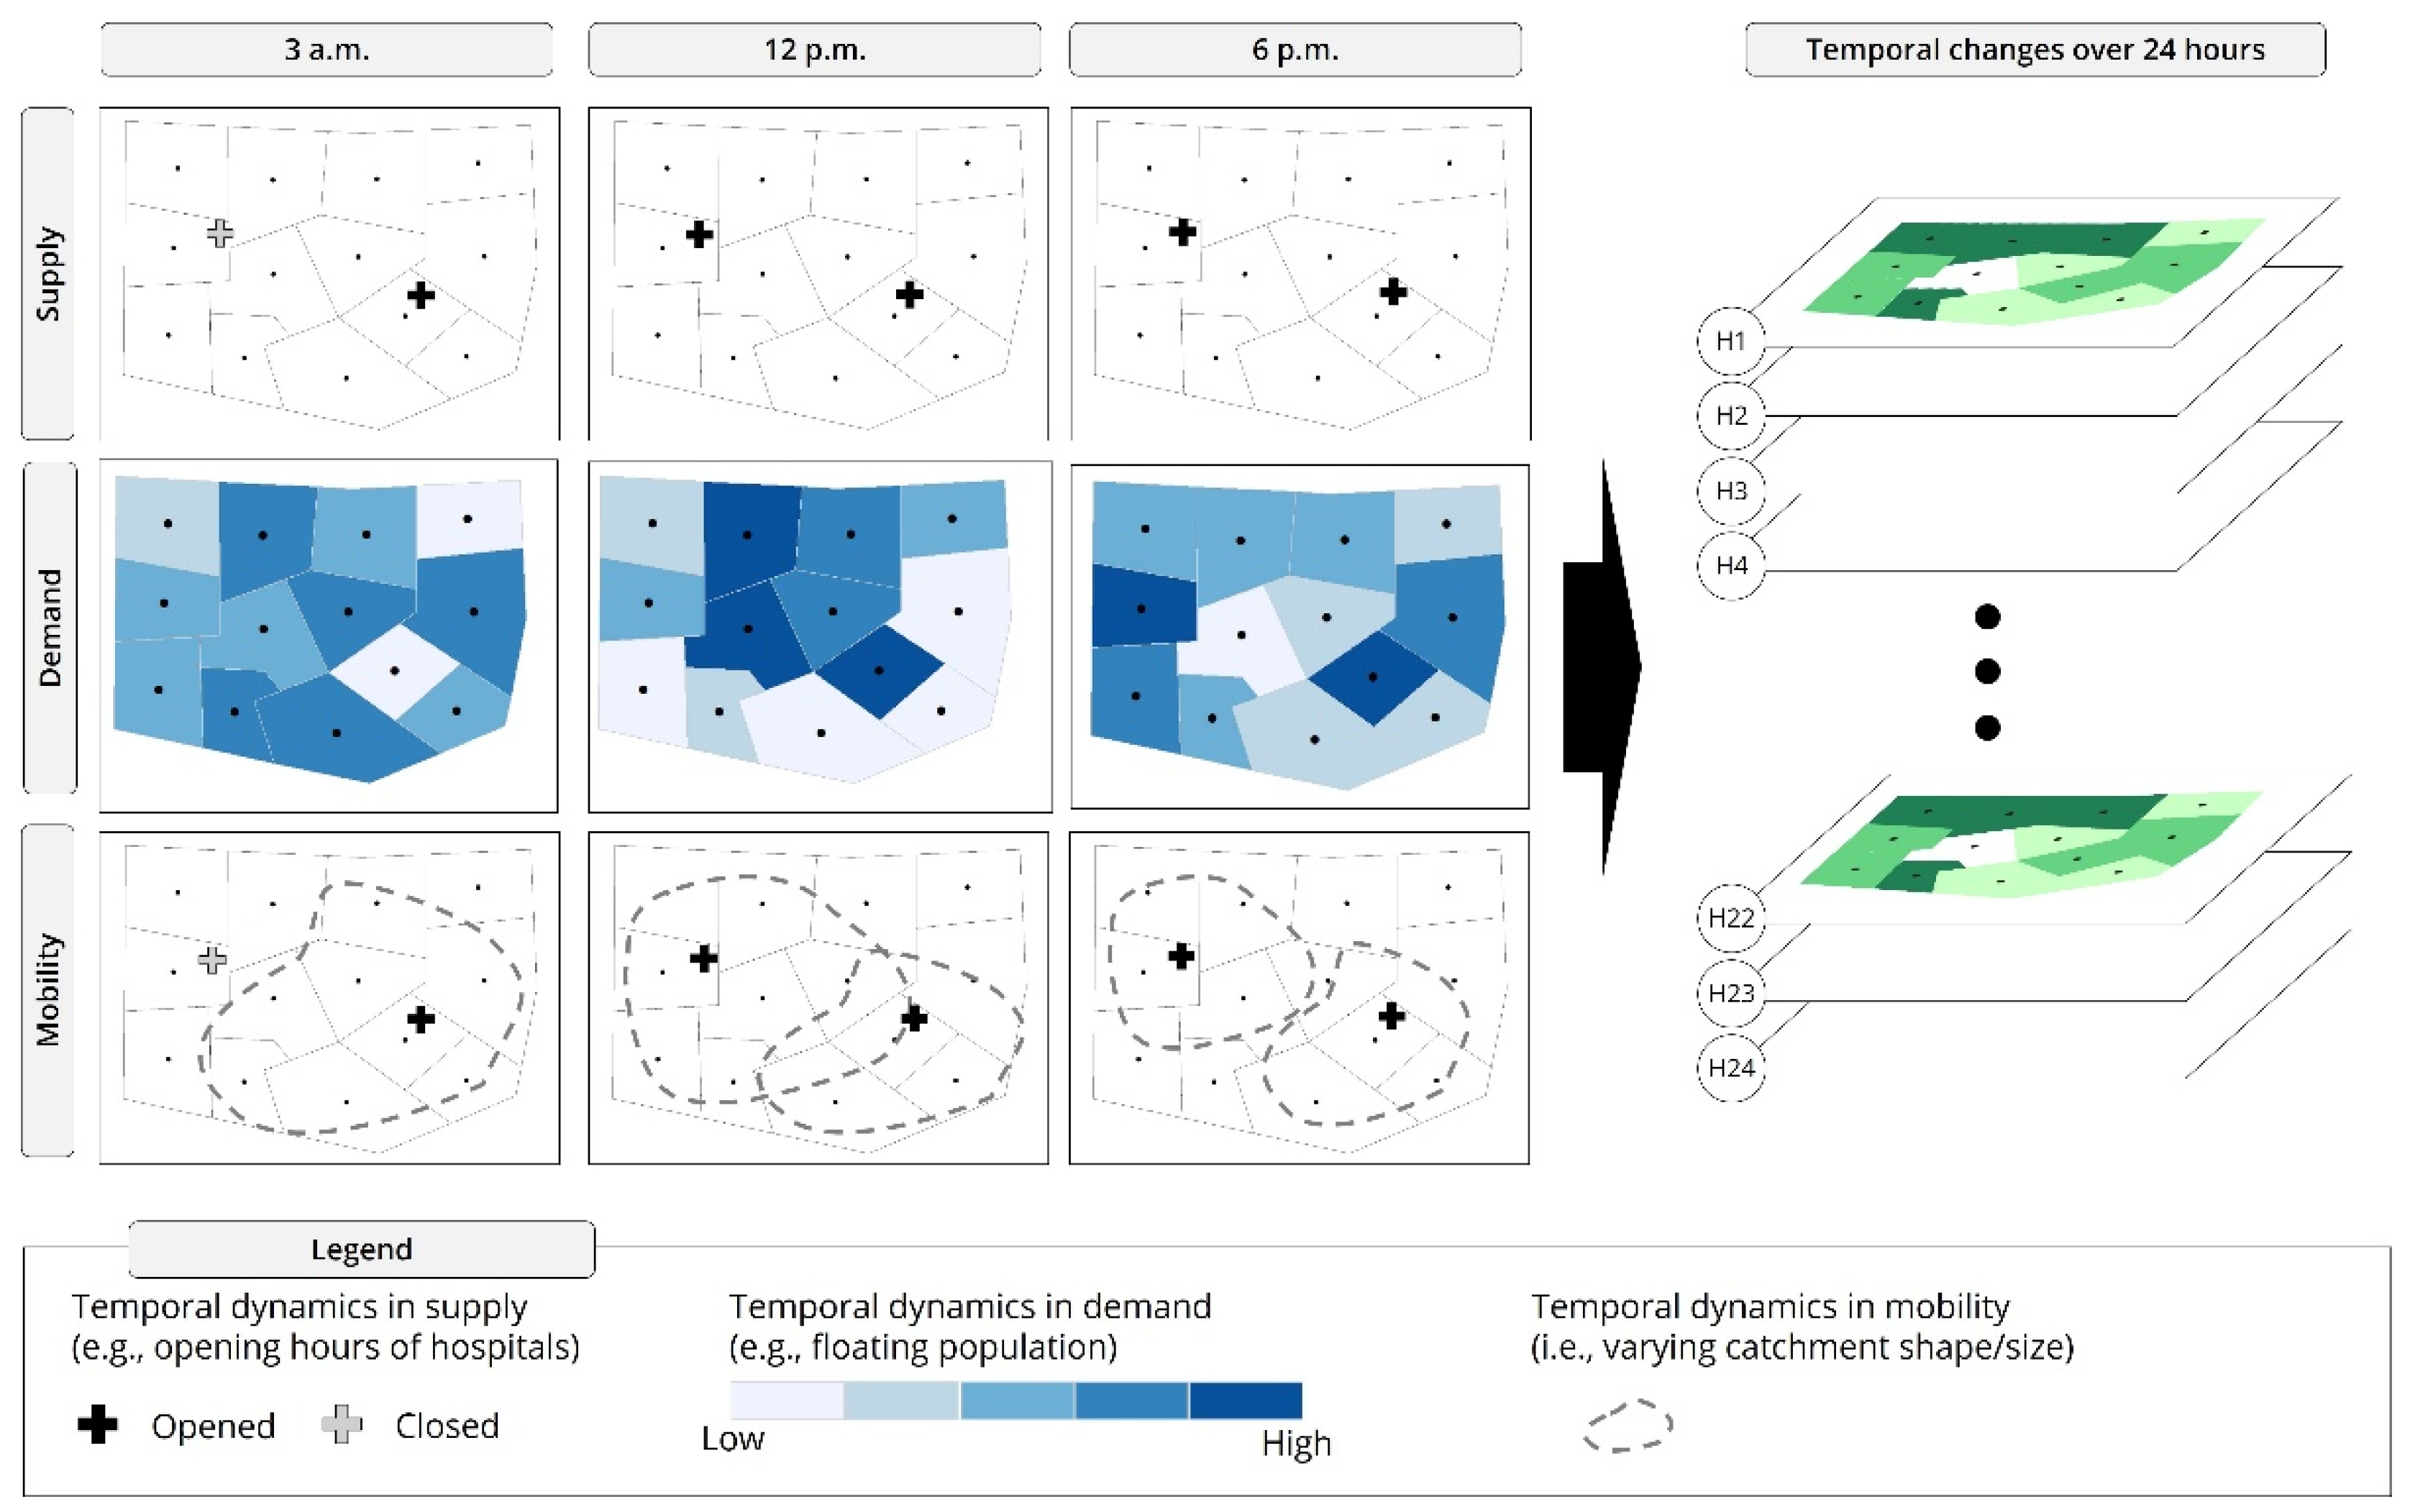
3.2. Temporal Changes in Spatial Accessibility

In the second group of dynamic spatial accessibility studies, the dynamics of temporal changes in spatial accessibility were centered (Figure 3). Whereas in a few studies the temporal differences (i.e., over the years) of spatial accessibility measures were investigated [56,57,58], in the majority of them, researchers took advantage of the enhanced granularity of space and time, examining how spatial accessibility changes over 24 h [12,15,59]. As the inputs of spatial accessibility measurements (i.e., supply, demand, and mobility) vary over time [60], temporal dynamics were populated from input attributes, such as operating hours, time-variant distribution of floating populations in the studies, and time-variant traffic conditions. They then measured the spatial accessibility of each hour with the 2SFCA method over 24 h with the following equations:
R j t = S j t k { d k j t d 0 } D k t f ( d k j t )
A i t = j { d i j t d 0 } R j t f ( d i j t ) = j { d i j t d 0 } S j t f ( d i j t ) k { d k j t d 0 } D k t f ( d k j t )
where t refers to an hour within a day, R j t represents the supply-to-demand ratio of the supply facility j at an hour t , and A i t denotes the accessibility measures of location i at hour t .
By considering temporal changes in spatial accessibility, researchers aimed to enhance the accuracy of the measurements by taking advantage of the enhanced resolution of space and time in geospatial data. Researchers utilized more than one time-dependent input variable (i.e., supply, demand, and mobility) and employed finer geographical units (Table 1). Although the targets are the same, this advanced form is referred to by various names, such as space-time accessibility [12], spatiotemporal accessibility [59], temporal variation of location-based accessibility [61], and dynamic location-based accessibility [13].
Researchers tackled the limitations of conventional approaches of spatial accessibility and enhanced resolutions in both space and time. Regarding temporal resolution, the conventional approach may fail to explain the temporal dynamics of accessibility, given that the generalized input does not reflect temporal variation within a day. However, the input variables change over time (e.g., operating hours, floating population, and time-variant traffic conditions), influencing spatial accessibility measures. The researchers also tried to address spatial resolution, which is strongly tied to the modifiable areal unit problem (MAUP), with the implementation of finer geographical units. As the 2SFCA method determines whether the location is accessible based on the inclusion of the centroids of geographical units, this may be affected by MAUP. In studies where dynamic spatial accessibility was assessed with micro-level geographic units, such as census tracts [62] or grids [12,13,61], this implementation increased accuracy of the measurements.
Given that the same objectives (i.e., temporal changes in spatial accessibility over 24 h) were shared in every study in this category, we investigated how temporal dynamics were populated in them, based on which attributes. We categorized the studies into three groups according to the three input measurement variables: supply, demand, and mobility. Firstly, we collated studies in which researchers populated temporal dynamics in supply based on the opening hours of facilities [13,61] or the work hours of job opportunities [12,62]. Due to the fact that people cannot access infrastructures outside their opening hours (e.g., 8 a.m.–5 p.m. or 24 h), the degree of available supply facilities is time-dependent [13,65]. Also, jobs have a specified time that employees are required to be at work. Secondly, floating population was utilized to estimate the time-variant distribution of the people [12,13,15,59]. The floating population is critical to improving the accuracy of measurements, as people access infrastructures not only from their residential locations, but also from work, school, or even while traveling. In other words, it reflects the nature of the daily activities of people who travel and conduct various activities across regions within a day. In these studies, researchers took advantage of census data [12,66] or GPS-enabled mobile phone usage data [13,15,59] to incorporate floating populations into the measurements. Thirdly, we grouped studies in which researchers furnished temporal dynamics in mobility from taxi trajectory data [61,63,64] or sophisticated transportation databases [13,62]. The advent of GPS-enabled devices (e.g., taxi trajectories or cell phones) has significantly facilitated the estimation of time-dependent mobility. It is possible to provide anonymized individual movements [22] and predict the mobility of a particular space and time based on historical travel time data [67]. Particularly, temporal dynamics in mobility are the most important variable for measuring temporal changes in spatial accessibility [45,63]. Although the locations of supply and demand are stationary, the longer travel time diminishes the sizes of catchment areas, prevents ease of access to supply facilities, and increases the disparity of measures between demand locations.

4. Research Agenda

Although it is acknowledged that implementing dynamic variables enhanced the accuracy of measurements, we found in the exhaustive review in the previous section that dynamic spatial accessibility has not been applied to its fullest. We propose two research agendas worthy of investigation beyond the current accomplishments: (i) enhancement of the predictability and accuracy of accessibility measurements and (ii) examination of temporal changes in spatial accessibility to furnish policy implications.

4.1. Improving the Predictability and Accuracy of Measurements with Dynamic Variables

This section provides three suggestions that could improve the predictability and accuracy of the measurement. Firstly, measurement accuracy is significantly enhanced when implementing a complete set of temporal dynamic inputs. Despite the significance of reflecting realistic temporal changes, in none of the previous studies was there the complete incorporation of a set of temporal dynamic inputs into the measurements (Table 1); They were limited to partially implementing time-dependent variables [12,15,59,61,62,63,64]. Employing a complete set of temporally dynamic variables would benefit from continuously enhancing high temporal granularity data [23]. For instance, dynamics in supply could be populated from operating hours, which are easily accessible through the websites of suppliers or third-party search engines. Time-dependent demand (i.e., floating population) is also published through municipal government or third-party companies. Mobility has the most vast amount of sources to populate dynamics: open street maps (OSM), GTFS, or map APIs. Voluntary geographic information systems, such as OSM, provide precise network datasets because many users constantly create road segments and reviews. The data are available via the Python package [68,69], meaning that the dataset can easily be combined with nonspatial traffic data and population traffic dynamics [8]. Additionally, GTFS is specifically designed for public transportation and consists of static GTFS and real-time GTFS [70,71]. Static GTFS calculates travel time via public transportation based on the schedule, whereas real-time GTFS provides the current position of vehicles and the delay information. Furthermore, commercial map services provide estimated travel times via their map APIs, but the temporal dynamics employed by the source have only been examined in a few studies [72]. As high-temporal-resolution data are widely available, it is straightforward but powerful to integrate the dynamics of the three inputs and to measure temporal changes in spatial accessibility. Besides the rich temporal data sources, the advancement of an open-source geocomputational framework would boost the implementation. Until now, many studies have relied on a commercial GIS platform (e.g., Esri ArcGIS). However, the advent of CyberGIS would be an alternative for analysis with computational intensity [73,74].
Secondly, the combination of time-dependent mobility and multimodal spatial accessibility measurements would advance the predictability of the measures [75]. In the current approaches of multimodal studies, researchers have taken advantage of predefined timetables of public transportation to estimate travel time and have compared accessibility with free-flow private car travel (i.e., no traffic congestion considered) [24,25,51]. This disparity may reduce the realistic projection of spatial accessibility, since people use public transit due to limited access to private vehicles and to avoid traffic congestion in big cities. As described above, the estimated travel time under traffic congestion for both car and public transit is available through various APIs, such as GTFS or Google [76]. Therefore, implementing sophisticated mobility data for both modes would increase the accuracy of measurements and provide an improved understanding of the spatial disparity in accessibility attributed to different transit modes.
Thirdly, it would be noteworthy to investigate resource availability uncertainties, as accessibility is meaningless if no resources are available at facilities. Whereas every spatial accessibility variable is uncertain, uncertainty in supply is the most critical. For example, in hospital accessibility, the number of beds is often implemented as the supply weight to predict the service capacity. However, every hospital has some beds already utilized for hospitalization, so the degree of service they provide is not static and fluctuates over time. For these cases, the Monte-Carlo simulation may be a solution, and it has been implemented in several studies to examine the stochastic distribution of on-time arrival, considering the traffic congestion and unexpected delays [45,64,77]. Lee and Miller [45] compared how the accessible area changed according to the risk preference of the traveler (i.e., risk-averse or risk-seeking) from the perspective of people-based accessibility. Chen et al. [64] measured place-based accessibility by incorporating the chance of on-time arrival. Given that they only focused on uncertainties in mobility, incorporating supply uncertainties would quantify accessibility reliability and delineate the region with robust accessibility.

4.2. Furnish Policy Implications from Temporal Changes in Spatial Accessibility

Due to the fact that the significance of spatial accessibility studies is rooted in their policy implications (i.e., identifying spatial inequality of access to urban infrastructure and proposing locations that require additional resources), it is crucial to provide policymakers with refined and summarized information for their understanding of problems [19]. In this context, the 24 h spatial accessibility measurements in previous studies [12,13,15,59,61] may be voluminous enough for stakeholders not to appreciate notable temporal changes in the accessibility measures. As soon as the temporal dynamics are fully incorporated into the measurements, this issue can be addressed in two ways: temporal clustering and sequence analysis.
The first suggestion is to group the 24 h measurements into a few temporal clusters with a homogenous distribution of measurements. Although the implementation of dynamic variables resulted in dynamic temporal changes in the measurements, the measures may have provided relatively similar patterns for some periods. For example, the accessibility of 2 p.m. may be more similar to 4 p.m., compared to that of 4 a.m. [13]. Researchers have subjectively picked hours in previous studies that tended to show distinctive patterns to demonstrate temporal changes [15,59], possibly resulting in a biased interpretation. However, temporal clustering could systematically summarize the temporal variation and provide only distinctive changes of the measures [78]. Therefore, temporally synthesized measures can produce an improved understanding of temporal changes by identifying which locations have limited access to infrastructure for a particular duration of time. In addition, the clustered measures would guide policymakers on where to provide additional resources if the expected usage time data were provided [79].
As a second suggestion, sequence analysis could be implemented to identify how the accessibility of each location changes over time and illustrate the trends of temporal changes in a study area. Compared to the first suggestion, in which spatiotemporal accessibility was temporally summarized, in this suggestion, the regions are spatially clustered based on their possible temporal changes (i.e., sequence) in the accessibility [80,81]. Therefore, the temporal sequence would facilitate the examination of the socioeconomic phenomenon related to accessibility [39,82] and propose how the spatial disparity of access can be addressed. For example, assume that the temporal changes in accessibility are summarized as follows: Region A has sufficient accessibility in the morning and limited accessibility during the day, Region B has consistent and sufficient accessibility, and Region C consistently has insufficient accessibility. These sequences would indicate that more attention is necessary for Regions A and C; furthermore, they enable investigation of what causes poor accessibility of Region A during the daytime. Consequently, with this approach, it would be possible to propose a way to provide better policy implications stemming from the enhanced temporal granularity of spatial accessibility.

5. Conclusions

We thoroughly examined the methodological advancements and empirical findings of dynamic spatial accessibility, incorporating dynamic variables into the measurements. Specifically, dynamic spatial accessibility is aimed at improving the accuracy of the assessments by taking advantage of the enhanced availability of dynamic variables. The topic has been developed in two different ways: multimodal accessibility and temporal changes of spatial accessibility. Multimodal accessibility incorporated alternative transit into conventional private car travel and examined the disparity in accessibility attributed to transit mode. Accessibility with alternative modes illustrated was limited compared to that with car travel, and the gap was more significant in peripheral regions due to insufficient public transportation infrastructure. On the other hand, time-dependent variables for the measurement inputs (i.e., supply, demand, and mobility) were used in studying spatial accessibility temporal changes, increasing the temporal granularity of measurements into an hour. It was demonstrated that accessibility changes depending on both space and time. Despite these advancements from dynamic variable employments, two research agendas are worthy of investigating. Considering the enhanced availability of high granularity spatiotemporal data, in this study, we highlighted the importance of dynamic variables in increasing the accuracy and predictability of measures and providing practical implications from sophisticated results, which are the critical merits of spatial accessibility.

Author Contributions

Conceptualization, Jinwoo Park and Daniel W. Goldberg; methodology, investigation, and writing-Original Draft Preparation, Jinwoo Park; writing-review and editing, Jinwoo Park and Daniel W. Goldberg; supervision: Daniel W. Goldberg. Both authors have read and agreed to the published version of the manuscript.

Funding

This research received no external funding.

Conflicts of Interest

The authors declare no conflict of interest.

References

  1. Hansen, W.G. How Accessibility Shapes Land Use. J. Am. Inst. Plann. 1959, 25, 73–76. [Google Scholar] [CrossRef]
  2. Luo, W.; Wang, F. Measures of spatial accessibility to health care in a GIS environment: Synthesis and a case study in the Chicago region. Environ. Plan. B Plan. Des. 2003, 30, 865–884. [Google Scholar] [CrossRef] [PubMed] [Green Version]
  3. Shen, Q. Location Characteristics of Inner-City Neighborhoods and Employment Accessibility of Low-Wage Workers. Environ. Plan. B Plan. Des. 1998, 25, 345–365. [Google Scholar] [CrossRef]
  4. Wang, F. Measurement, Optimization, and Impact of Health Care Accessibility: A Methodological Review. Ann. Assoc. Am. Geogr. 2012, 102, 1104–1112. [Google Scholar] [CrossRef] [PubMed] [Green Version]
  5. Chen, X.; Jia, P. A comparative analysis of accessibility measures by the two-step floating catchment area (2SFCA) method. Int. J. Geogr. Inf. Sci. 2019, 33, 1739–1758. [Google Scholar] [CrossRef]
  6. Weiss, D.J.; Nelson, A.; Gibson, H.S.; Temperley, W.; Peedell, S.; Lieber, A.; Hancher, M.; Poyart, E.; Belchior, S.; Fullman, N.; et al. A global map of travel time to cities to assess inequalities in accessibility in 2015. Nature 2018, 553, 333–336. [Google Scholar] [CrossRef]
  7. Weiss, D.J.; Nelson, A.; Vargas-Ruiz, C.A.; Gligorić, K.; Bavadekar, S.; Gabrilovich, E.; Bertozzi-Villa, A.; Rozier, J.; Gibson, H.S.; Shekel, T.; et al. Global maps of travel time to healthcare facilities. Nat. Med. 2020, 26, 1835–1838. [Google Scholar] [CrossRef] [PubMed]
  8. Kang, J.Y.; Michels, A.; Lyu, F.; Wang, S.; Agbodo, N.; Freeman, V.L.; Wang, S. Rapidly measuring spatial accessibility of COVID-19 healthcare resources: A case study of Illinois, USA. Int. J. Health Geogr. 2020, 19, 36. [Google Scholar] [CrossRef]
  9. Luo, W.; Whippo, T. Variable catchment sizes for the two-step floating catchment area (2SFCA) method. Health Place 2012, 18, 789–795. [Google Scholar] [CrossRef] [PubMed]
  10. McGrail, M.R.; Humphreys, J.S. Measuring spatial accessibility to primary health care services: Utilising dynamic catchment sizes. Appl. Geogr. 2014, 54, 182–188. [Google Scholar] [CrossRef]
  11. Tao, Z.; Cheng, Y.; Liu, J. Hierarchical two-step floating catchment area (2SFCA) method: Measuring the spatial accessibility to hierarchical healthcare facilities in Shenzhen, China. Int. J. Equity Health 2020, 19, 164. [Google Scholar] [CrossRef]
  12. Hu, Y.; Downs, J. Measuring and visualizing place-based space-time job accessibility. J. Transp. Geogr. 2019, 74, 278–288. [Google Scholar] [CrossRef]
  13. Järv, O.; Tenkanen, H.; Salonen, M.; Ahas, R.; Toivonen, T. Dynamic cities: Location-based accessibility modelling as a function of time. Appl. Geogr. 2018, 95, 101–110. [Google Scholar] [CrossRef]
  14. Delafontaine, M.; Neutens, T.; Van de Weghe, N. A GIS toolkit for measuring and mapping space–time accessibility from a place-based perspective. Int. J. Geogr. Inf. Sci. 2012, 26, 1131–1154. [Google Scholar] [CrossRef] [Green Version]
  15. Lee, W.K.; Sohn, S.Y.; Heo, J. Utilizing mobile phone-based floating population data to measure the spatial accessibility to public transit. Appl. Geogr. 2018, 92, 123–130. [Google Scholar] [CrossRef]
  16. Kelobonye, K.; Zhou, H.; McCarney, G.; Xia, J. (Cecilia) Measuring the accessibility and spatial equity of urban services under competition using the cumulative opportunities measure. J. Transp. Geogr. 2020, 85, 102706. [Google Scholar] [CrossRef]
  17. Shi, Y.; Blainey, S.; Sun, C.; Jing, P. A literature review on accessibility using bibliometric analysis techniques. J. Transp. Geogr. 2020, 87, 102810. [Google Scholar] [CrossRef]
  18. Handy, S.L.; Niemeier, D.A. Measuring Accessibility: An Exploration of Issues and Alternatives. Environ. Plan. A Econ. Sp. 1997, 29, 1175–1194. [Google Scholar] [CrossRef]
  19. Neutens, T. Accessibility, equity and health care: Review and research directions for transport geographers. J. Transp. Geogr. 2015, 43, 14–27. [Google Scholar] [CrossRef]
  20. Guagliardo, M.F. Spatial accessibility of primary care: Concepts, methods and challenges. Int. J. Health Geogr. 2004, 3, 1–13. [Google Scholar] [CrossRef] [Green Version]
  21. McGrail, M.R. Spatial accessibility of primary health care utilising the two step floating catchment area method: An assessment of recent improvements. Int. J. Health Geogr. 2012, 11, 50. [Google Scholar] [CrossRef] [Green Version]
  22. Yoo, E.H.; Roberts, J.E.; Eum, Y.; Shi, Y. Quality of hybrid location data drawn from GPS-enabled mobile phones: Does it matter? Trans. GIS 2020, 24, 462–482. [Google Scholar] [CrossRef]
  23. Benenson, I.; Ben-Elia, E.; Rofé, Y.; Geyzersky, D. The benefits of a high-resolution analysis of transit accessibility. Int. J. Geogr. Inf. Sci. 2017, 31, 213–236. [Google Scholar] [CrossRef]
  24. Mao, L.; Nekorchuk, D. Measuring spatial accessibility to healthcare for populations with multiple transportation modes. Health Place 2013, 24, 115–122. [Google Scholar] [CrossRef]
  25. Lin, Y.; Wan, N.; Sheets, S.; Gong, X.; Davies, A. A multi-modal relative spatial access assessment approach to measure spatial accessibility to primary care providers. Int. J. Health Geogr. 2018, 17, 33. [Google Scholar] [CrossRef] [PubMed]
  26. Dony, C.C.; Delmelle, E.M.; Delmelle, E.C. Re-conceptualizing accessibility to parks in multi-modal cities: A Variable-width Floating Catchment Area (VFCA) method. Landsc. Urban Plan. 2015, 143, 90–99. [Google Scholar] [CrossRef]
  27. Batty, M. Defining smart cities. In The Routledge Companion to Smart Cities; Routledge: London, UK, 2020; pp. 51–60. ISBN 9781315178387. [Google Scholar]
  28. Kwan, M.P. Space-time and integral measures of individual accessibility: A comparative analysis using a point-based framework. Geogr. Anal. 1998, 30, 191–216. [Google Scholar] [CrossRef]
  29. Miller, H. Modelling accessibility using space-time prism concepts within geographical information systems. Int. J. Geogr. Inf. Syst. 1991, 5, 287–301. [Google Scholar] [CrossRef]
  30. Huff, D.L. Defining and Estimating a Trading Area. J. Mark. 1964, 28, 34–38. [Google Scholar] [CrossRef]
  31. Huff, D.L. A Probabilistic Analysis of Shopping Center Trade Areas. Land Econ. 1963, 39, 81–90. [Google Scholar] [CrossRef]
  32. Wang, F. From 2SFCA to i2SFCA: Integration, derivation and validation. Int. J. Geogr. Inf. Sci. 2021, 35, 628–638. [Google Scholar] [CrossRef]
  33. Wan, N.; Zou, B.; Sternberg, T. A three-step floating catchment area method for analyzing spatial access to health services. Int. J. Geogr. Inf. Sci. 2012, 26, 1073–1089. [Google Scholar] [CrossRef]
  34. Dai, D. Black residential segregation, disparities in spatial access to health care facilities, and late-stage breast cancer diagnosis in metropolitan Detroit. Health Place 2010, 16, 1038–1052. [Google Scholar] [CrossRef]
  35. Luo, W.; Qi, Y. An enhanced two-step floating catchment area (E2SFCA) method for measuring spatial accessibility to primary care physicians. Health Place 2009, 15, 1100–1107. [Google Scholar] [CrossRef] [PubMed]
  36. Dai, D.; Wang, F. Geographic disparities in accessibility to food stores in southwest Mississippi. Environ. Plan. B Plan. Des. 2011, 38, 659–677. [Google Scholar] [CrossRef]
  37. Delamater, P.L.; Messina, J.P.; Grady, S.C.; WinklerPrins, V.; Shortridge, A.M. Do More Hospital Beds Lead to Higher Hospitalization Rates? A Spatial Examination of Roemer’s Law. PLoS ONE 2013, 8, e54900. [Google Scholar] [CrossRef] [PubMed] [Green Version]
  38. Tang, J.H.; Chiu, Y.H.; Chiang, P.H.; Su, M.D.; Chan, T.C. A flow-based statistical model integrating spatial and nonspatial dimensions to measure healthcare access. Health Place 2017, 47, 126–138. [Google Scholar] [CrossRef]
  39. Gong, S.; Gao, Y.; Zhang, F.; Mu, L.; Kang, C.; Liu, Y. Evaluating healthcare resource inequality in Beijing, China based on an improved spatial accessibility measurement. Trans. GIS 2021, 25, 1504–1521. [Google Scholar] [CrossRef]
  40. McGrail, M.R.; Humphreys, J.S. Measuring spatial accessibility to primary care in rural areas: Improving the effectiveness of the two-step floating catchment area method. Appl. Geogr. 2009, 29, 533–541. [Google Scholar] [CrossRef]
  41. Delamater, P.L. Spatial accessibility in suboptimally configured health care systems: A modified two-step floating catchment area (M2SFCA) metric. Health Place 2013, 24, 30–43. [Google Scholar] [CrossRef]
  42. O’Sullivan, D.; Morrison, A.; Shearer, J. Using desktop GIS for the investigation of accessibility by public transport: An isochrone approach. Int. J. Geogr. Inf. Sci. 2000, 14, 85–104. [Google Scholar] [CrossRef]
  43. Langford, M.; Higgs, G.; Fry, R. Multi-modal two-step floating catchment area analysis of primary health care accessibility. Health Place 2016, 38, 70–81. [Google Scholar] [CrossRef] [PubMed]
  44. Kawabata, M. Spatiotemporal Dimensions of Modal Accessibility Disparity in Boston and San Francisco. Environ. Plan. A Econ. Sp. 2009, 41, 183–198. [Google Scholar] [CrossRef]
  45. Lee, J.; Miller, H.J. Robust accessibility: Measuring accessibility based on travelers’ heterogeneous strategies for managing travel time uncertainty. J. Transp. Geogr. 2020, 86, 102747. [Google Scholar] [CrossRef]
  46. Tao, Z.; Cheng, Y. Modelling the spatial accessibility of the elderly to healthcare services in Beijing, China. Environ. Plan. B Urban Anal. City Sci. 2019, 46, 1132–1147. [Google Scholar] [CrossRef]
  47. Zhang, J.; Mao, L. Integrating multiple transportation modes into measures of spatial food accessibility. J. Transp. Health 2019, 13, 1–11. [Google Scholar] [CrossRef]
  48. Apparicio, P.; Gelb, J.; Dubé, A.S.; Kingham, S.; Gauvin, L.; Robitaille, É. The approaches to measuring the potential spatial access to urban health services revisited: Distance types and aggregation-error issues. Int. J. Health Geogr. 2017, 16, 32. [Google Scholar] [CrossRef]
  49. Zhou, X.; Yu, Z.; Yuan, L.; Wang, L.; Wu, C. Measuring accessibility of healthcare facilities for populations with multiple transportation modes considering residential transportation mode choice. ISPRS Int. J. Geo Inf. 2020, 9, 394. [Google Scholar] [CrossRef]
  50. Tao, Z.; Yao, Z.; Kong, H.; Duan, F.; Li, G. Spatial accessibility to healthcare services in Shenzhen, China: Improving the multi-modal two-step floating catchment area method by estimating travel time via online map APIs. BMC Health Serv. Res. 2018, 18, 345. [Google Scholar] [CrossRef] [Green Version]
  51. Tao, Z.; Zhou, J.; Lin, X.; Chao, H.; Li, G. Investigating the impacts of public transport on job accessibility in Shenzhen, China: A multi-modal approach. Land Use Policy 2020, 99, 105025. [Google Scholar] [CrossRef]
  52. Hu, S.; Song, W.; Li, C.; Lu, J. A multi-mode Gaussian-based two-step floating catchment area method for measuring accessibility of urban parks. Cities 2020, 105, 102815. [Google Scholar] [CrossRef]
  53. Xing, L.; Liu, Y.; Liu, X. Measuring spatial disparity in accessibility with a multi-mode method based on park green spaces classification in Wuhan, China. Appl. Geogr. 2018, 94, 251–261. [Google Scholar] [CrossRef]
  54. Xiao, W.; Wei, Y.D.; Wan, N. Modeling job accessibility using online map data: An extended two-step floating catchment area method with multiple travel modes. J. Transp. Geogr. 2021, 93, 103065. [Google Scholar] [CrossRef]
  55. Chang, Z.; Chen, J.; Li, W.; Li, X. Public transportation and the spatial inequality of urban park accessibility: New evidence from Hong Kong. Transp. Res. Part D Transp. Environ. 2019, 76, 111–122. [Google Scholar] [CrossRef]
  56. Jamtsho, S.; Corner, R.; Dewan, A. Spatio-Temporal Analysis of Spatial Accessibility to Primary Health Care in Bhutan. ISPRS Int. J. Geo Inf. 2015, 4, 1584–1604. [Google Scholar] [CrossRef] [Green Version]
  57. Yang, J.; Mao, L. Understanding temporal change of spatial accessibility to healthcare: An analytic framework for local factor impacts. Health Place 2018, 51, 118–124. [Google Scholar] [CrossRef]
  58. Moya-Gómez, B.; Geurs, K.T. The spatial–temporal dynamics in job accessibility by car in the Netherlands during the crisis. Reg. Stud. 2020, 54, 527–538. [Google Scholar] [CrossRef]
  59. Xia, T.; Song, X.; Zhang, H.; Song, X.; Kanasugi, H.; Shibasaki, R. Measuring spatio-temporal accessibility to emergency medical services through big GPS data. Health Place 2019, 56, 53–62. [Google Scholar] [CrossRef] [PubMed]
  60. Xu, W.A.; Ding, Y.; Zhou, J.; Li, Y. Transit accessibility measures incorporating the temporal dimension. Cities 2015, 46, 55–66. [Google Scholar] [CrossRef]
  61. Wang, Y.; Chen, B.Y.; Yuan, H.; Wang, D.; Lam, W.H.K.; Li, Q. Measuring temporal variation of location-based accessibility using space-time utility perspective. J. Transp. Geogr. 2018, 73, 13–24. [Google Scholar] [CrossRef]
  62. Boisjoly, G.; El-Geneidy, A. Daily fluctuations in transit and job availability: A comparative assessment of time-sensitive accessibility measures. J. Transp. Geogr. 2016, 52, 73–81. [Google Scholar] [CrossRef]
  63. Chen, B.Y.; Yuan, H.; Li, Q.; Wang, D.; Shaw, S.-L.; Chen, H.-P.; Lam, W.H.K. Measuring place-based accessibility under travel time uncertainty. Int. J. Geogr. Inf. Sci. 2017, 31, 783–804. [Google Scholar] [CrossRef]
  64. Chen, B.Y.; Cheng, X.P.; Kwan, M.P.; Schwanen, T. Evaluating spatial accessibility to healthcare services under travel time uncertainty: A reliability-based floating catchment area approach. J. Transp. Geogr. 2020, 87, 102794. [Google Scholar] [CrossRef]
  65. Widener, M.J.; Shannon, J. When are food deserts? Integrating time into research on food accessibility. Health Place 2014, 30, 1–3. [Google Scholar] [CrossRef] [PubMed]
  66. Kobayashi, T.; Medina, R.M.; Cova, T.J. Visualizing diurnal population change in urban areas for emergency management. Prof. Geogr. 2011, 63, 113–130. [Google Scholar] [CrossRef] [PubMed]
  67. Gong, S.; Cartlidge, J.; Bai, R.; Yue, Y.; Li, Q.; Qiu, G. Extracting activity patterns from taxi trajectory data: A two-layer framework using spatio-temporal clustering, Bayesian probability and Monte Carlo simulation. Int. J. Geogr. Inf. Sci. 2020, 34, 1210–1234. [Google Scholar] [CrossRef] [Green Version]
  68. Boeing, G. OSMnx: New methods for acquiring, constructing, analyzing, and visualizing complex street networks. Comput. Environ. Urban Syst. 2017, 65, 126–139. [Google Scholar] [CrossRef] [Green Version]
  69. Boeing, G. The right tools for the job: The case for spatial science tool-building. Trans. GIS 2020, 24, 1299–1314. [Google Scholar] [CrossRef]
  70. GTFS Static Overview. Available online: https://developers.google.com/transit/gtfs (accessed on 1 August 2021).
  71. GTFS: Making Public Transit Data Universally Accessible. Available online: https://gtfs.org/ (accessed on 1 August 2021).
  72. Rong, P.; Zheng, Z.; Kwan, M.P.; Qin, Y. Evaluation of the spatial equity of medical facilities based on improved potential model and map service API: A case study in Zhengzhou, China. Appl. Geogr. 2020, 119, 102192. [Google Scholar] [CrossRef]
  73. Kang, J.-Y.; Aldstadt, J.; Vandewalle, R.; Yin, D.; Wang, S. A CyberGIS Approach to Spatiotemporally Explicit Uncertainty and Global Sensitivity Analysis for Agent-Based Modeling of Vector-Borne Disease Transmission. Ann. Am. Assoc. Geogr. 2020, 110, 1855–1873. [Google Scholar] [CrossRef]
  74. Wang, S. A CyberGIS Framework for the Synthesis of Cyberinfrastructure, GIS, and Spatial Analysis. Ann. Assoc. Am. Geogr. 2010, 100, 535–557. [Google Scholar] [CrossRef]
  75. Stępniak, M.; Pritchard, J.P.; Geurs, K.T.; Goliszek, S. The impact of temporal resolution on public transport accessibility measurement: Review and case study in Poland. J. Transp. Geogr. 2019, 75, 8–24. [Google Scholar] [CrossRef]
  76. Lee, J.; Miller, H.J. Measuring the impacts of new public transit services on space-time accessibility: An analysis of transit system redesign and new bus rapid transit in Columbus, Ohio, USA. Appl. Geogr. 2018, 93, 47–63. [Google Scholar] [CrossRef]
  77. Ertugay, K.; Duzgun, S. GIS-based stochastic modeling of physical accessibility using GPS-based floating car data and Monte Carlo simulation. Int. J. Geogr. Inf. Sci. 2011, 25, 1491–1506. [Google Scholar] [CrossRef]
  78. Rogerson, P.; Yamada, I. Statistical Detection and Surveillance of Geographic Clusters; CRC Press: Boca Raton, FL, USA, 2008; ISBN 9781584889366. [Google Scholar]
  79. Widener, M.J.; Farber, S.; Neutens, T.; Horner, M. Spatiotemporal accessibility to supermarkets using public transit: An interaction potential approach in Cincinnati, Ohio. J. Transp. Geogr. 2015, 42, 72–83. [Google Scholar] [CrossRef] [Green Version]
  80. Delmelle, E.C. Mapping the DNA of urban neighborhoods: Clustering longitudinal sequences of neighborhood socioeconomic change. Ann. Am. Assoc. Geogr. 2016, 106, 36–56. [Google Scholar] [CrossRef]
  81. Delmelle, E.C. Five decades of neighborhood classifications and their transitions: A comparison of four US cities, 1970–2010. Appl. Geogr. 2015, 57, 1–11. [Google Scholar] [CrossRef]
  82. Liu, D.; Kwan, M.-P.; Kan, Z. Analysis of Urban Green Space Accessibility and Distribution Inequity in the City of Chicago. Urban For. Urban Green. 2021, 59, 127029. [Google Scholar] [CrossRef]
Figure 1. Conceptual diagram of the two-step floating catchment area (2SFCA) method: (a) the first step of 2SFCA—calculating a supply-to-demand ratio of each supply facility accessible within the threshold travel time; (b) the second step of the 2SFCA method—summing up the supply-to-demand ratio of all supply facilities accessible from each demand location within the threshold travel time.
Ijgi 10 00532 g001
Figure 2. Conceptual diagram of the multimodal spatial accessibility: (a) the first step of the multimodal 2SFCA, calculating the supply-to-demand ratio of each supply facility to each transportation mode; (b) the second step of multimodal 2SFCA method, summing up the supply-to-demand ratio of all supply facilities to each transportation mode.
Ijgi 10 00532 g002
Figure 3. Conceptual diagram of temporal changes in spatial accessibility: temporal dynamics in the input variables (i.e., supply, demand, and mobility) and hourly spatial accessibility measurements over 24 h.
Ijgi 10 00532 g003
Table 1. Studies in which temporal changes in spatial accessibility were investigated.
CitationMethodTargetSupply
(Variable; Source)
Demand
(Variable; Source)
Mobility
(Variable; Source)
Geographical Unit
Boisjoly & El-Geneidy [62]GravityJobDynamic
(number of jobs;
census data)
N/ADynamic (estimated travel time via public transportation; GTFS)Census tracts
B. Y. Chen et al. [63]GravityFood
(restaurants)
StaticN/ADynamic (estimated travel time via road network; taxi trajectory data)Not
specified
W. K. Lee et al. [15]2SFCA + HuffBus stopsStaticDynamic
(floating population; mobile phone usage data)
StaticGrids
Järv et al. [13]Not specifiedFood
(grocery)
Dynamic
(operating hours;
website of supplier)
Dynamic
(floating population; mobile phone usage data)
Dynamic (estimated travel time via public transportation; GTFS)Grids
Y. Wang et al. [61]GravityFood
(restaurants)
Dynamic
(operating hours;
map API)
N/ADynamic (estimated travel time via road network; taxi trajectory data)Grids
Hu & Downs [12]2SFCAJobDynamic
(number of jobs;
CTPP)
Dynamic
(number of job seekers;
CTPP)
StaticGrids
Xia et al. [59]2SFCAHealthcare
(emergency services)
StaticDynamic
(floating population; GPS-enabled mobile phone)
StaticGrids
B. Y. Chen et al. [64]2SFCAHealthcare
(hospitals)
StaticStaticDynamic (estimated travel time via road network; taxi trajectory data)Thiessen polygon (cellular tower coverage)
Publisher’s Note: MDPI stays neutral with regard to jurisdictional claims in published maps and institutional affiliations.

