Article

Differencing the Risk of Reiterative Spatial Incidence of COVID-19 Using Space–Time 3D Bins of Geocoded Daily Cases

1
Department of Geography, Urban Planning and Land Planning, University of Cantabria, 39005 Santander, Spain
2
Research Group on Health Economics and Health Services Management–Marqués de Valdecilla Research Institute (IDIVAL), 39011 Santander, Spain
3
Department of Economics, University of Cantabria, 39005 Santander, Spain
*
Author to whom correspondence should be addressed.
ISPRS Int. J. Geo-Inf. 2021, 10(4), 261; https://doi.org/10.3390/ijgi10040261
Submission received: 25 February 2021 / Revised: 7 April 2021 / Accepted: 11 April 2021 / Published: 13 April 2021

Abstract

:
The space–time behaviour of COVID-19 needs to be analysed from microdata to understand the spread of the virus. Hence, 3D space–time bins and analysis of associated emerging hotspots are useful methods for revealing the areas most at risk from the pandemic. To implement these methods, we have developed the SITAR Fast Action Territorial Information System using ESRI technologies. We first modelled emerging hotspots of COVID-19 geocoded cases for the region of Cantabria (Spain), then tested the predictive potential of the method with the accumulated cases for two months ahead. The results reveal the difference in risk associated with areas with COVID-19 cases. The study not only distinguishes whether a bin is statistically significant, but also identifies temporal trends: a reiterative pattern is detected in 58.31% of statistically significant bins (most with oscillating behaviour over the period). In the testing method phase, with positive cases for two months ahead, we found that only 7.37% of cases were located outside the initial 3D bins. Furthermore, 83.02% of new cases were in statistically significant previous emerging hotspots. To our knowledge, this is the first study to show the usefulness of the 3D bins and GIS emerging hotspots model of COVID-19 microdata in revealing strategic patterns of the pandemic for geoprevention plans.

1. Introduction

Spain has suffered its third wave of the COVID-19 pandemic, in the post-Christmas period. Management of the pandemic was decentralised from national government to regional health policy makers at the end of the strict lockdown from March to June 2020. Since then, each region in the country has set different rules and restrictions in place to overcome each wave of the pandemic. In this context, with a population close to 47.5 million and with a second state of emergency declared for constitutional redress to the regions (known as “autonomous communities”), Spain reached 3,000,000 COVID-19 cases in February 2021. Regional perimeter lockdowns, working from home and reduced hours, among others, have proved insufficient to stop the spread of the pandemic. There are not enough diagnostic studies of these solutions.
In this context, this research is set within the collaboration framework established by the University of Cantabria, the Valdecilla Hospital Research Institute (IDIVAL) and the Department of Health of the Regional Government of Cantabria. It uses methods based on geographic information systems (GIS) and the main goal is to analyse and model the space–time trend of COVID-19 cases from an integrated perspective. Daily datasets of cases, heat maps and animated maps of pandemic spread are not enough to quantify the spatial pattern of COVID-19 and to differentiate the level of risk in many areas with similar cumulative incidence rates at a given time. The large amount of data and the high temporal resolution (daily) can hinder the obtaining of strategic knowledge about the spatial pattern of the virus and, more importantly, its expected spatial behaviour. This research therefore seeks to apply GIS and location intelligence to COVID-19 pandemic cases, and more specifically to test the potential of space–time 3D bins and emerging hotspots for providing an understanding and plotting the spatial pattern of COVID-19.
In line with our research collaboration framework, the study area is the Autonomous Community of Cantabria (Northern Spain). Our research results are presented in the form of internal reports to the regional government health authorities.
Our methodological contribution has two main pillars: geocoding a daily microdata record of COVID-19 cases and implementing a Fast Action Territorial Information System (desktop and cloud) called SITAR, using ESRI technologies [1].
The contribution of GIS analysis to spatial understanding and control of diseases is a wide research field. In this sense, the review by E.K. Cromley [2] on the use of GIS to address epidemiological research questions highlights its value in geocoding and analysing local patterns of health conditions, where autocorrelation and space–time clustering are two extended approaches. Factually, the perspective of location intelligence has been highlighted as an important approach for quantifying disease occurrence and designing disease control actions [3]. GIS and the geographic perspective can thus help to ensure prompt detection and control the spread of COVID-19 at the risk mitigation stage [4].
There is a large body of literature on spatial analysis and the application of geostatistical methods to the study of spatial patterns and cluster detection of diseases. Part of this scientific background is significant from the partial viewpoint of contributing to software and methods (although these studies are applied to diseases other than COVID-19). Examples include the study using the SaTScan software package to identify incident disease clusters based on space–time trends to adjust practical surveillance [5,6] and the application of space–time clusters combining SaTScan for Poisson probability with GIS software (ArcGIS) to determine Moran’s autocorrelation index and analyse patterns of tuberculosis [7]. Dengue virus has also been analysed by autocorrelation and Kulldorff’s SaTScan statistics, with high autocorrelation and a movement of virus clustering over time being found [8]. Related to this, there are many research papers on processes for the spread of epidemics that use space–time clusters, and even some studies tracking possible sources of contagion [9].
Related to the objective of modelling spatiotemporal clusters in health issues, we consider that the 3D bins and emerging hotspots methodology has comparative advantages in Section 1. These are: the absence of conditioning of the data by starting administrative units (which in any case avoids problems derived from the modifiable spatial unit for diachronic analysis), the possibility of scalable applications from intraurban to regional and higher levels and, finally, spatial precision incorporated from the initial method stages, since it starts from the occurrence of cases from point features of geocoded microdata. A significant number of studies of clusters with a spatiotemporal perspective are based on aggregated cases for provinces, municipalities or other units [10], which in origin would condition the results of disease patterns to base units that are not representative depending on the health issue being addressed. On the other hand, the temporal variable of the cluster is often relegated to the background, understood as an accumulation of cases in a time period rather than as an internal differentiation of what is happening in a given space over time intervals (slides). Thus, 3D bins can be understood as integrating cluster models of spatial (bin size) and temporal perspectives (vertical timeline) to conclude with revealing trend patterns, as we will expose in the Section 2 and Section 3.
Even in comparison with cluster studies that are based on geocoded data, such as the research collected in this paper, it is useful to consider the possibilities of the 3D bins methodology to synthesise spatial and temporal trends, providing a strategic vision regarding specific analysis in that several details make it difficult to reach clear spatial pattern conclusions, beyond the definition of circular window areas and measurements of spatial dispersion through ellipses by year [11] or expressive heat maps [12]. Nevertheless, each bin acts as a synthetic space–time trend unit for which other environment variables (buildings, density, social content, etc.) are estimated and the pattern results obtained can be explored in depth, with a scalable spatial and temporal approach. In this regard, the proposed method responds to the approach advocated by Greenough and Nelson [13] that holds the importance of geospatial analysis to identify hotspots as a way to understand spatial patterns and improve programmatic success related to secure environments and health issues.
Focusing on health studies on the spatial distribution of COVID-19, some studies show COVID-19 spatial patterns using GIS. There are interesting papers that relate COVID-19 and external environment factors, such as mobility in urban areas [14]. Other papers seek to analyse the spread of the virus indirectly using the characteristics of the main affected areas in terms of incomes, economic activities and population density, among others [15,16,17,18,19]. Projects that apply geographically weighted regression to the spatial patterns of COVID-19 find that scale effects are essential and sociodemographic factors and their effects on COVID-19 spread produce different effects depending on scale [20]. However, the 3D bins methodology has some interesting references based on point events analysis in the safety field (crime patterns [21] and traffic accidents [22]), or even in the health field, more specifically in other respiratory diseases, such as pulmonary tuberculosis cases [23], that we will refer in Section 4.
In this context, the project reported here is based on extensive field research, as mentioned above, but it includes novel approaches related to two main characteristics: the COVID-19 dataset and a scalable methodological proposal. These details could not be considered novel individually, but there are no previous papers on the application of space–time clustering using 3D bins and emerging hotspots for microdata on reported cases of COVID-19.
With a broader focus, there are very few publications on the application of 3D bin analysis to the pandemic. There is one project that considers the spatiotemporal pattern in China based on 3D bins, but the source dataset refers to cities and the authors conclude in their paper that this large scale is a limitation [24].
The originality of our approach is based on the potential of using microdata on COVID-19 (each reported case is a point) as the main source for designing scalable methodologies and making significant progress in understanding the spatial behaviour of the virus. Other authors have previously seen the need to use a point layer with COVID-19 cases to analyse the virus spread. Some of them have also proposed original methods for identifying proxy locations to overcome the lack of availability of official microdata [25].
Finally, we introduce a third original approach related to our research. The testing phase demonstrates the short-time predictive potential of emerging hotspots analysis using GIS: about 83% of new cases for the following two months were located in a statistically significant previous emerging hotspot. As the challenges posed by the third and potential fourth waves of the pandemic are addressed, the space–time evolution of the focus used must be prioritised. In this context, the use of geotechnologies from an interdisciplinary perspective is an interesting way to tackle COVID-19, the global pandemic of the early 21st century [26,27].

2. Materials and Methods

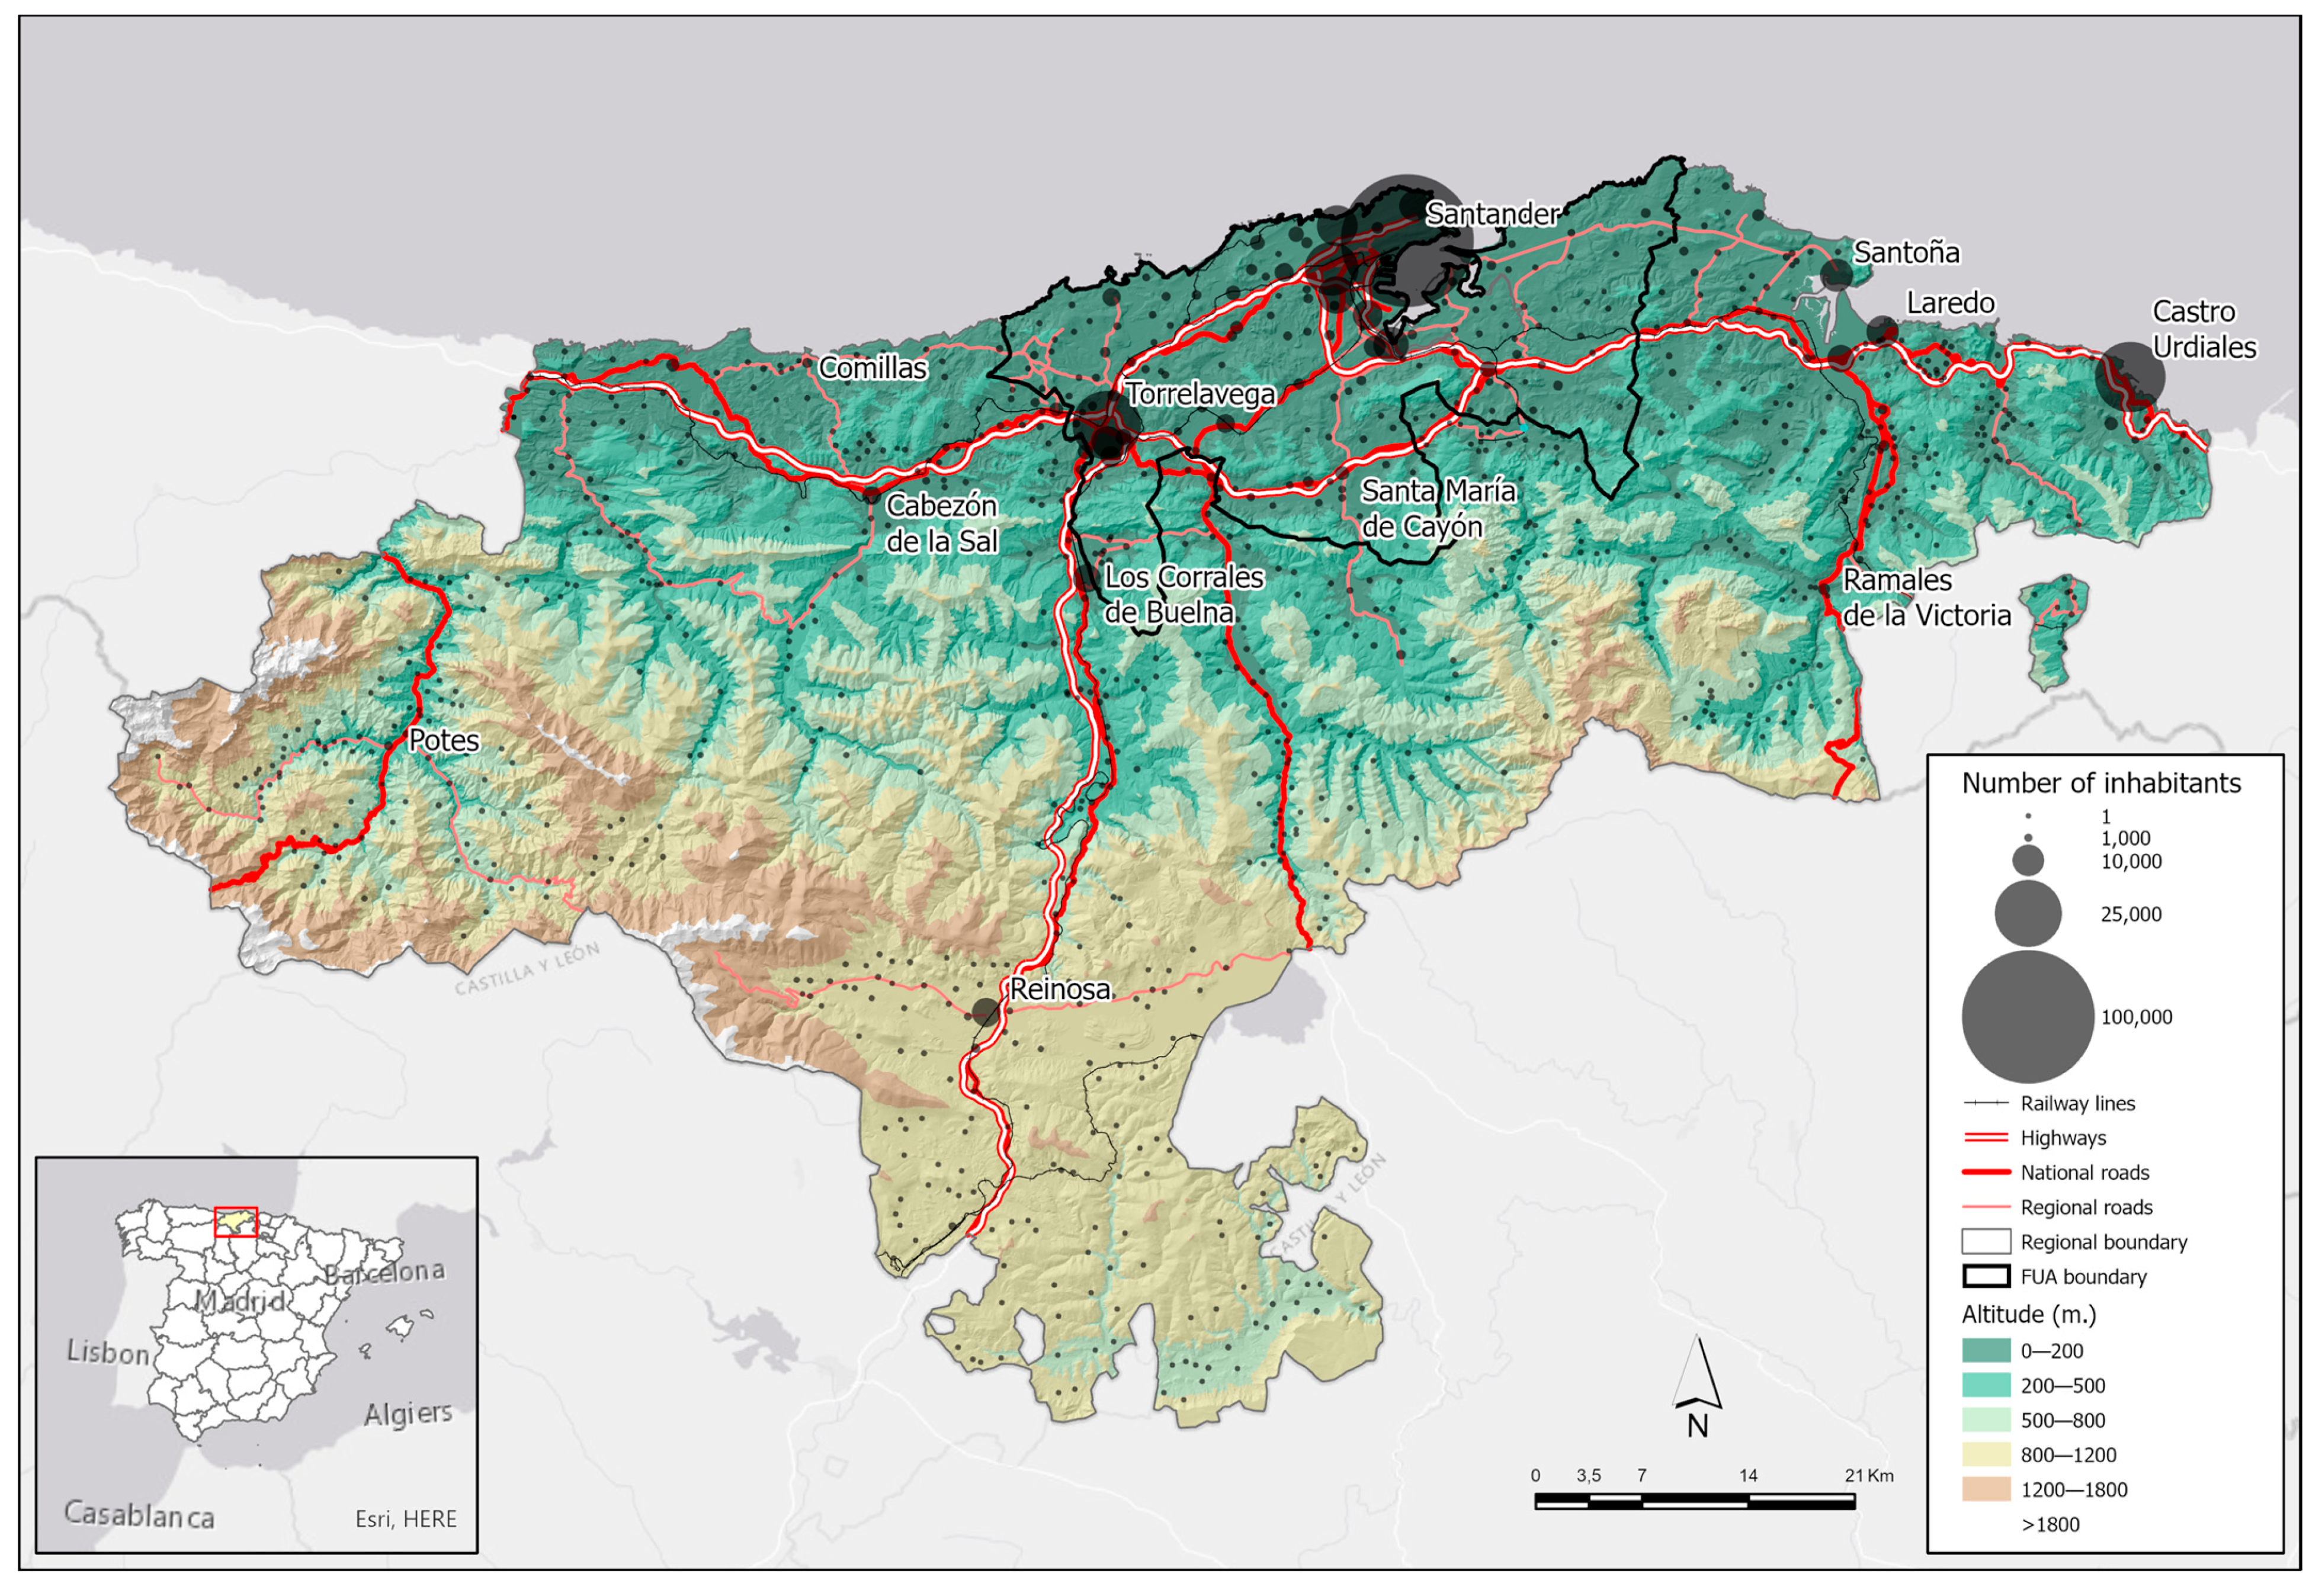
2.1. Overview of the Study Area

This research focuses on the Autonomous Community of Cantabria (a northern region of Spain). Cantabria has just over 580,000 inhabitants and a surface area of 5300 km2 (2055 square miles). This gives an average population density of close to 110/km2 (285 square mile). However, the population is distributed unevenly between the coastal municipalities and the inland valleys (Figure 1).
The capital city, Santander, is located mid-way along the coast and has 172,000 inhabitants. It is the biggest city in the Community of Cantabria and the chief city of a functional urban area (FUA, identified at the European level) that includes Torrelavega, the second biggest city. The Santander FUA comprises 25 municipalities with a total population of 380,000 (just over 65% of the total for the region). The polycentric hinterland around Santander–Torrelavega stands out for several factors, including number of inhabitants, population density, concentration of activities, main transport infrastructures and a prominent role in daily commutes between central and outlying areas [28].
Our research into the general evolution of the pandemic in Cantabria focuses on two periods: the first method stage, from the beginning of officially reported data on the pandemic (March 2020) until the onset of the second wave (November 2020) and the second method stage, based on cases reported for two months from November 2020 to January 2021, coinciding with the third wave. As Figure 2 shows, the cumulative data show that cases exceeded 15,000 in November 2020 (the end of the first stage analysed here). At that time, the cumulative incidence rate was very high, at more than 500 cases per 100,000 inhabitants.

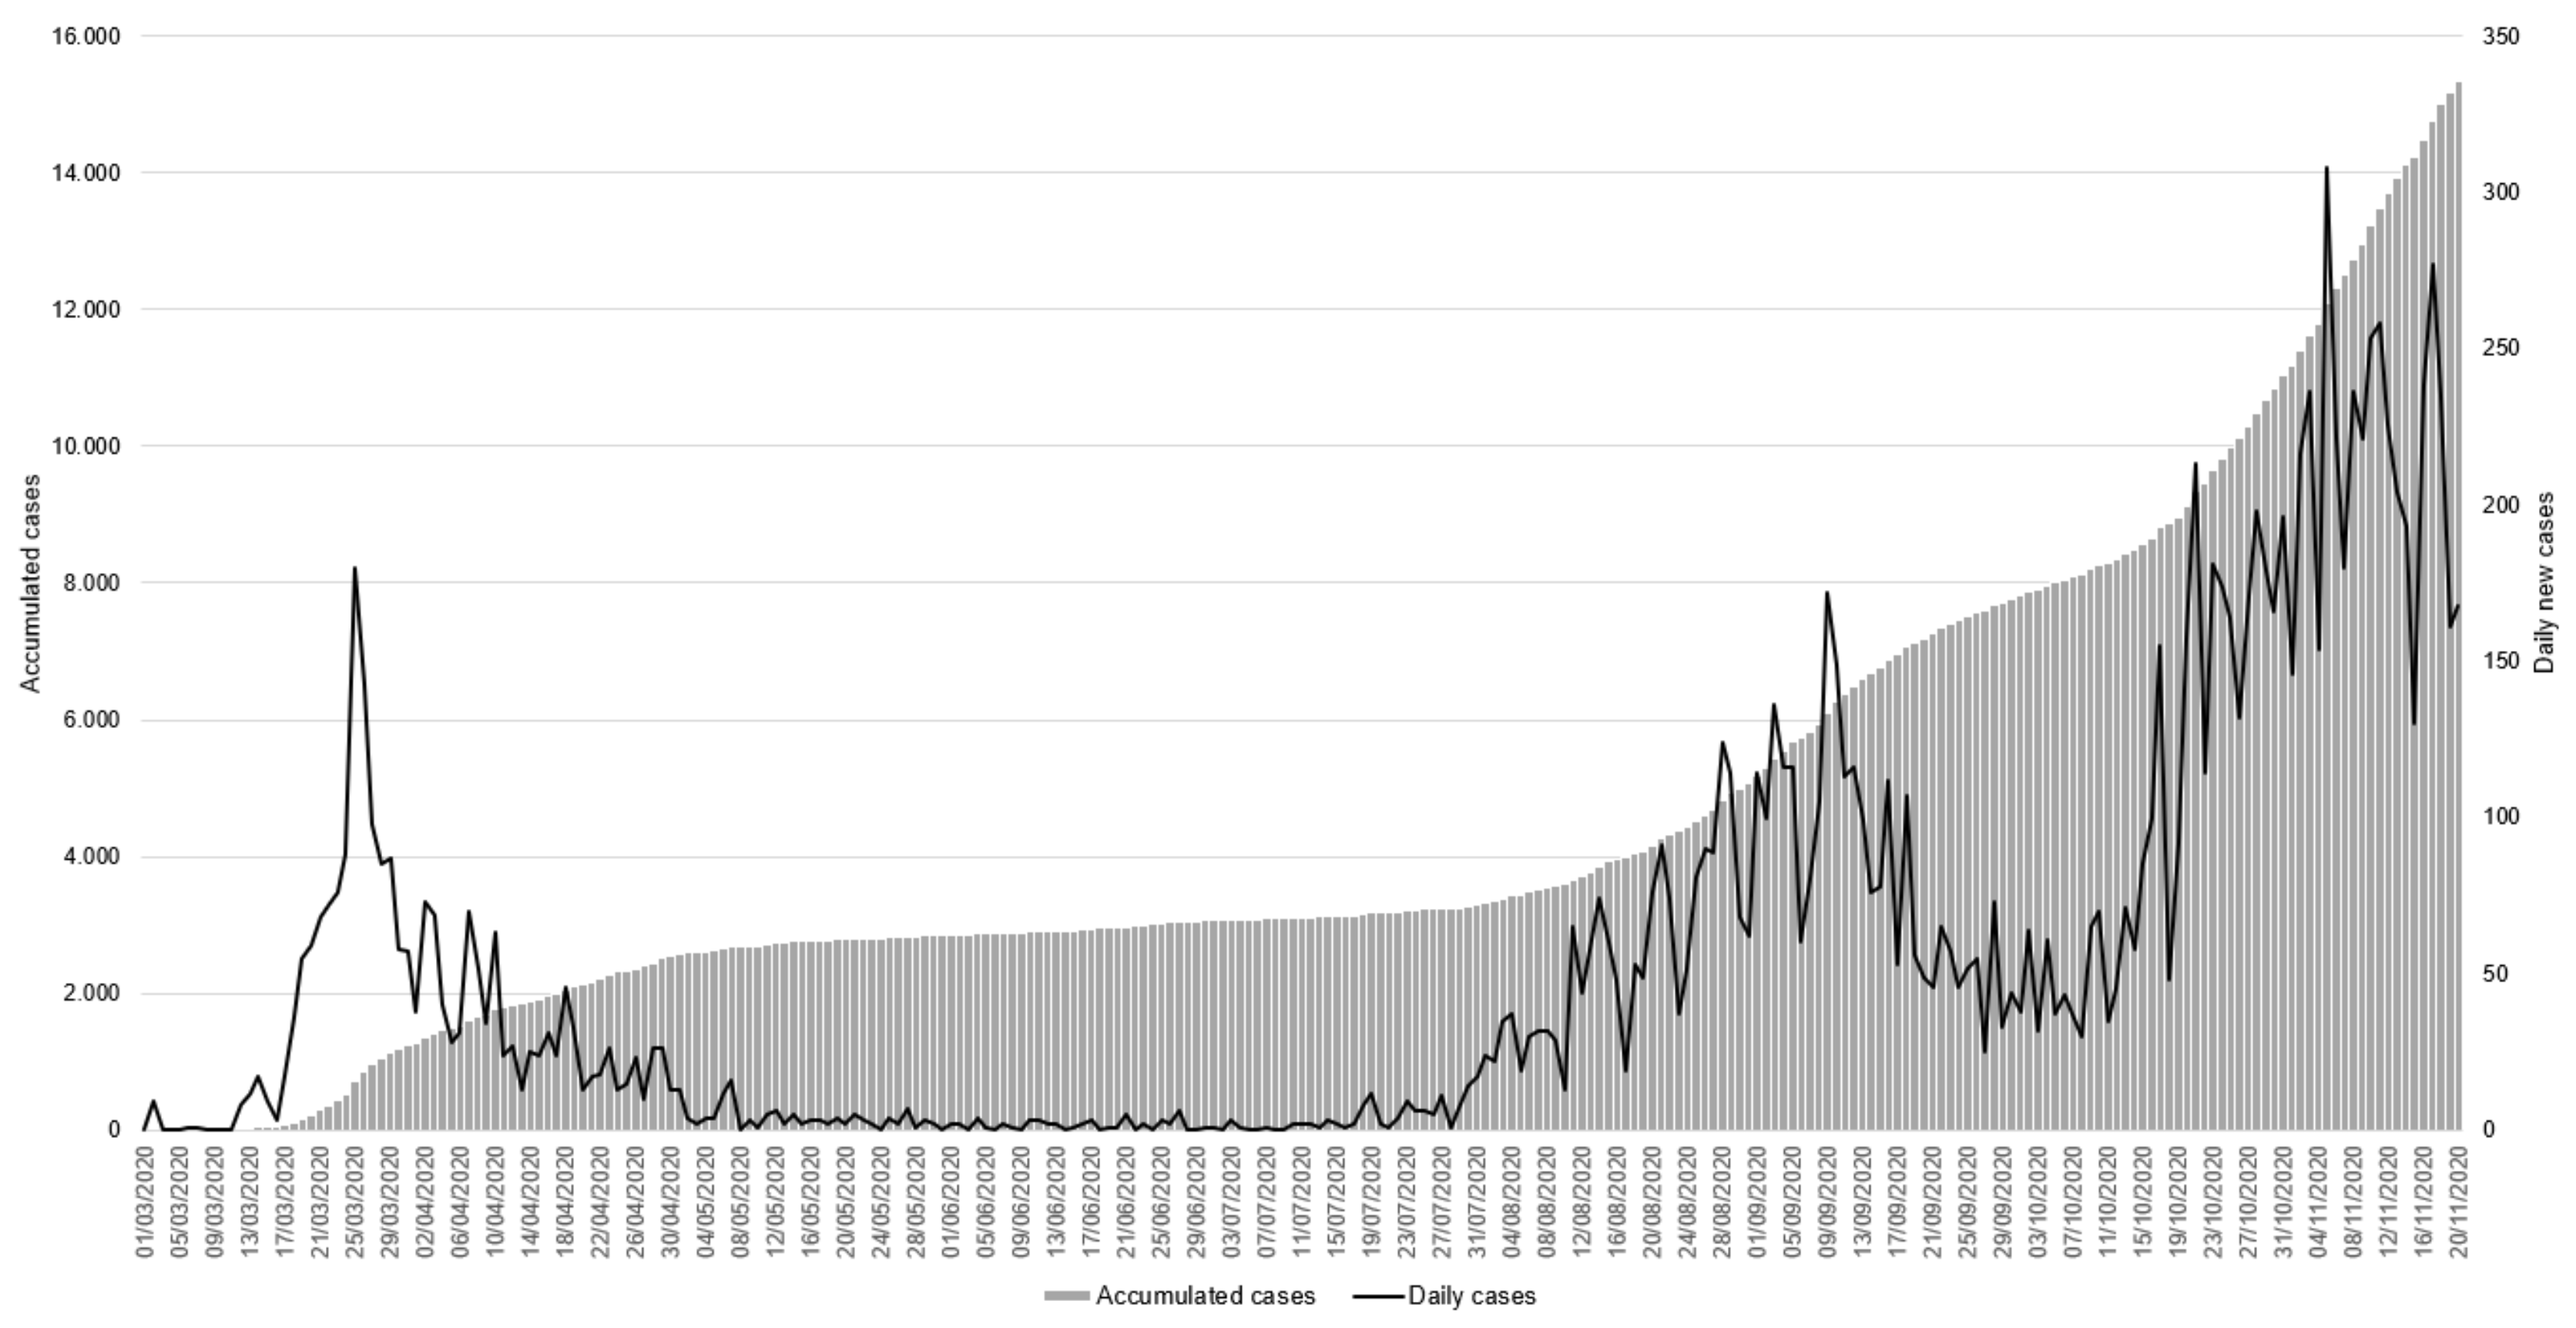
2.2. The Main Source: Daily Microdata on Reported Cases

This research is based on daily microdata in the form of positive cases of COVID-19 reported by the Government of Cantabria (Spain). Permission to report data only in the context of our research line was granted by the Medical Research Ethics Committee of Cantabria (CEIm) in June 2020 (ID: 2020.238). The authors wish to clarify that the microdata record is anonymous, due to data protection rules at the international level (European Union Regulation 2016/679 of the European Parliament and of the Council of 27 April 2016) and also at the domestic level (Framework Act 3/2018 on the Protection of Personal Data and Guarantee of Digital Rights of 5 December 2018).
These daily files have a tabular structure with data on all individuals who have tested positive for COVID-19 in Cantabria. The microdata also include many fields related to different thematic areas: location (address, town, municipality and post code), demographic profile (gender, age and occupational category in the case of healthcare personnel) and, finally, health structure and virus details (start and end dates, allocated health area, COVID-19 status (positive if the virus is active, cured or deceased), test type, binary fields related to hospitalisation, intensive care unit and residential care homes (if the infected person lives in such a home)). Apart from the necessary fields for each COVID-19 case, some characteristics are related to circumstances specific to the pandemic in Spain: the data on occupational category for infected individuals who work in healthcare is connected to the high incidence of the virus among healthcare providers (more than 83,000 infected, i.e., around 5% of all COVID-19 patients in Spain); and the field of residential care homes for the elderly is related to the high incidence of the first wave of the virus in Spain in such homes. In our research, COVID-19 cases among residents of homes for the elderly are separated out because the geoprevention strategies in such circumstances differ from the others: if they were included in our methodology, they could result in statistical and cartographic results being misread.
Related to the main figures and general data from a time-based perspective, the daily microdata record by the end of the first stage of this research (November 2020) shows more than 15,000 cases (rows in the microdata table) from the outset (March 2020) and nearly 21,000 by the end of the second research stage (with more than 5000 new cases from November 2020 to January 2021). Looking at the total number of records in the study (Table 1), it must be clarified that in both stages of analysis, we got the corresponding geocoded data from the initial cases reported in tabular format for over 97% of the records. The records missing can be attributed to various circumstances such as positive cases from other regions that were detected while the patients were visiting Cantabria or the absence of specific addresses in the data. Additionally, taking into account that it could be misleading to consider location for cases in homes for the elderly, such cases were filtered out of the base layer, so the final study focused largely on geocoded cases of persons who did not live in homes for the elderly.

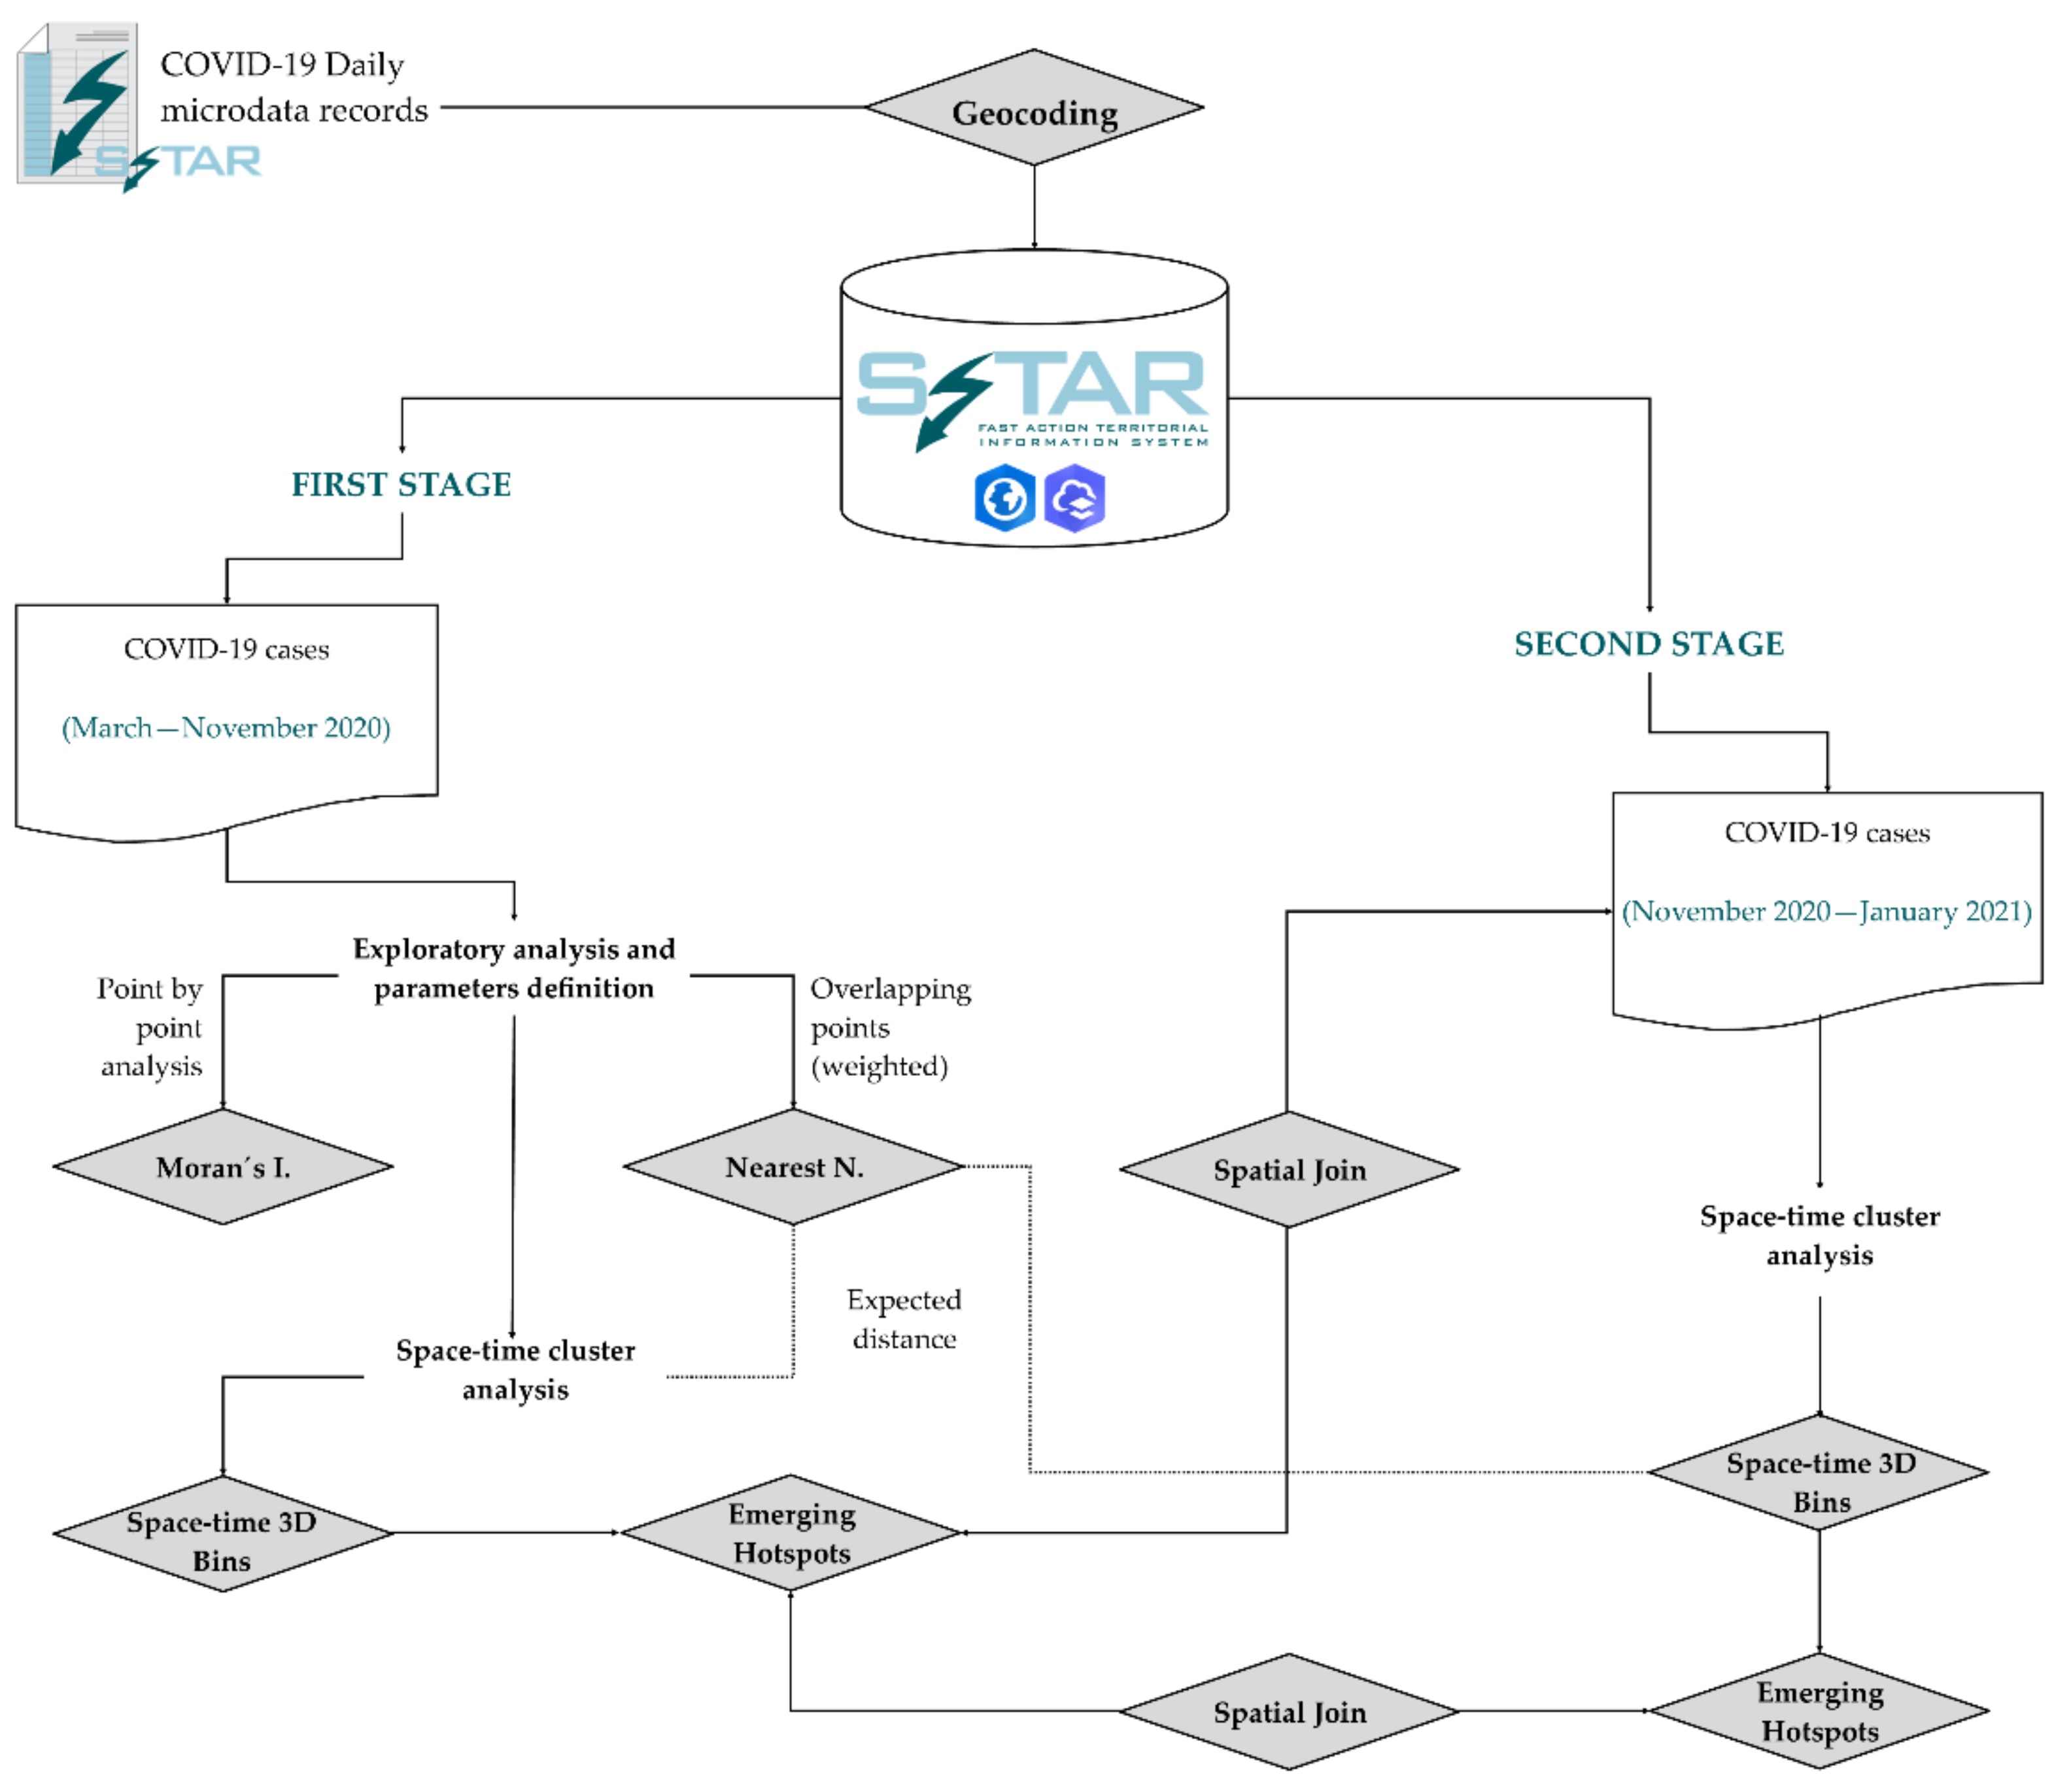
2.3. Research Methods

The proposed methodology is based on geographical information technologies and spatial analysis functions. We implement the SITAR Fast Action Territorial Information System using two environments from the ESRI Technologies Ecosystem, accessed by the user license held by the University of Cantabria.
More specifically, we use ArcGIS Pro as a desktop geographic information system (GIS) and ArcGIS Online as a GIS cloud with an operations dashboard for ArcGIS, Web AppBuilder and Experience Builder. The main advantage of SITAR is the normalisation and integration of geodatabases that include data from many different sources. Aside from sources provided by official institutions, SITAR includes geographic, demographic and socioeconomic data from the ESRI COVID-19 GIS Hub [30], the ArcGIS GeoEnrichment Service based on big data technologies [31] and, finally, Web Map Services to connect to global cartography (satellite images or similar). Our territorial information system also has a multi-scalar perspective on a detailed scale from buildings (cadastral layer) and point dataset COVID-19 cases up to municipalities and the whole Autonomous Community of Cantabria. This multi-scalar GIS structure is essential in proposing a valid methodology, because knowledge of COVID-19 spatial patterns suggests that scale is fundamental [32]. A factor or theory which is valid at the country level may not be so if it is desegregated at the departmental entity level or even at the neighbourhood level (detailed scales). Therefore, it is useful to implement a GIS structure, such as SITAR, with detailed data that could be aggregated into higher levels or entities if necessary.
The methodological workflow is organised in two stages (Figure 3). Both use the same COVID-19 microdata, geocoded by multiple fields to produce vector point datasets. The tabular micro data provided by the health authorities of the Government of Cantabria are included in SITAR, where they are geocoded from various fields related to location: street and portal number, postal code, name of town, village or city and municipality. However, the data entries for the two phases are from two consecutive periods and pursue different goals: the first stage focuses on the analysis of the space–time pattern of COVID-19 from the beginning to the second wave and the second seeks to test the predictive potential of the first stage model using new cases for a period of two consecutive months.

2.3.1. First Stage, from March to November 2020: 3D Bins and Emerging Hotspots Analysis

This part of the proposed method focuses on identifying COVID-19 trends in space and time. Accordingly, taking into account that our main source is a highly detailed record of locations of positive cases of COVID-19, we opted for a methodological plan that highlights the high spatial and temporal granularity of the initial dataset and, in parallel, is able to produce an expressive model to identify risk areas which is not conditioned by polygonal administrative entities. This is the main reason why we designed a methodology based on 3D bins and emerging hotspots analysis. These GIS analyses have been applied by researchers to other diseases, with interesting results, because they can reveal the detailed areas that are most at risk from the pandemic during the period under consideration [33]. Indeed, emergency hotspots can be useful (depending on spatial and temporal granularity) not only for analysing but also for predicting the spatial pattern of the virus with a multi-scale perspective [34]. However, as mentioned in the Introduction, our method is innovative in the specific study of COVID-19 spatial patterns.
Before we present the method details, we must point out that 3D bin analysis includes parameters (for time or temporal slides and distance or cube size) that could modify the results. Many authors warn that the method could hide recently emerging clusters, especially if the research includes a long time period [35].
The first stage methodology begins with an exploratory analysis that enables us to confirm the statistical significance of spatial patterns of the pandemic. This exploratory work also gives us the distance parameter for the 3D bins model.
The spatial autocorrelation analysis of COVID-19 reveals that the distribution of the 13,907 cases is not random. Moreover, Moran’s index confirms that the spatial pattern of COVID-19 cases is statistically significant and shows a clustered distribution. Indeed, the Z score of 6.56 (up to 2.58) implies a probability of less than 1% of random distribution of COVID-19 cases.
It is worth mentioning that we explored Moran’s index including cases in homes for the elderly and found that although the spatial pattern was not random, the p value increased from 0 to 0.19 and the probability of non-random distribution was less clear (under 5% instead of under 1% without cases in homes for the elderly). These comparative results (with and without residential home cases) confirm the importance of excluding such cases to avoid distorting the statistical results. Moreover, in the cases of homes for the elderly, COVID-19 outbreaks and the spatial focus are joined or linked, while in the rest of the cases there is no such spatial association.
Additionally, the nearest neighbour distance confirms the non-random spatial pattern of COVID-19, which matches a clustered distribution. As shown in Table 2, in the nearest neighbour analysis, the average observed distance between cases is 38.7 metres (0.02 miles) and the Z score (standard deviation) is −201.58 (under −2.58), so the spatial pattern is clustered and non-random once again with a confidence level of more than 99%.
The preliminary geostatistical analysis is fundamental in providing support for the following research steps. The fact that the COVID-19 spatial pattern is statistically significant enables a deeper analysis to be run based on 3D space–time bins and emerging hotspots. Furthermore, in the absence of established standard thresholds of time and distance (size of the cubes) for the creation of 3D COVID-19 bins, we set time periods of 4 weeks and base distance on preliminary statistical analysis, considering as a reference an expected distance threshold of 538.5 m (334.6 miles) derived from exploratory spatial average nearest neighbour analyses (as indicated in Table 2). This distance dimension is suitable since it starts from the consideration of points in which there have been COVID cases (located in street address and number) and considers as weight the number of cases that have occurred in the same position over time. Therefore, our tool statistically simulates the distances based on unique locations where there have been COVID-19 cases without losing intensity of occurrence from the weight (count of cases in the same pair of geographical coordinates). Nevertheless, the exploratory analysis based on Moran’s I would have some distortion since they decrease observed and expected distances when considering unique locations, although these locations correspond exactly to the same pair of geographical coordinates.
  • The organisation of time intervals starts from three basic principles. The first are the temporal references used by health authorities, which frequently handle terms close to two weeks (for example, for confining close contacts and for estimating accumulated incidents of 14 or, where appropriate, 7 days to follow the trend). Secondly, we must consider the methodological restriction of the 3D bins creation tool that requires a minimum of ten time intervals and, finally, an adjusted number of intervals close to 10 as the excess of intervals in the tests performed created too many cube moments with no cases or very low counts. The effect of excessive time compartmentalisation tends to disconnect emerging countries from the general pattern of the pandemic wave. As a result of the three criteria described, the 4-week interval is suitable since it includes 2 periods of the usual reference time for the study of accumulated incidents (i.e., 14 days) and meets the condition for the method to be applied that establishes a minimum of 10 moments in time for the development of bins. As we mentioned before, exploratory analysis of slides based on 1 period (2 weeks instead of 4) produced too many bins (many of them with 0 cases) and the results were not adequate.
  • The bin size is a metric based on expected distance (nearest neighbour analysis) from layer of points with COVID-19 cases and a weight field of location counts equivalent to number of positive cases in the same geographical coordinate. It is an objective size that improves the results for observed distance (bins too small and with 0 cases or only 1 case) and gives an objective parameter for reproducing this method at other times and elsewhere, with the nearest neighbour analysis needing to be calculated first. The size of the cubes based on the expected distance avoids distortions derived from cube sizes that are too small (which do not provide a spatial pattern with respect to the geocoded point layer) and also the possible cancellation or concealment of spatial differences if the cubes that are generated were too big. The tests carried out at both the municipal and regional levels support the value of the expected distance as a distance parameter of the bins of COVID-19.
Using these parameters, the method includes the creation of space–time 3D bins in a Network Common Data Form (NetCDF) layer where points are accumulated into a bigger, more regular, constant structure with the aforementioned spatial and temporal dimensions (ESRI). Each bin represents a regular location (with a specific area and volume) where cases are counted and aggregated over time in a 3D structure, so the number of cases is not lost in the method. In each bin location (spatial component), it includes the number of cases over time-steps as slides (temporal component). Therefore, the space–time 3D bins model overcomes the excessive detail of each location to reveal a simplified crosstab model that integrates spatial and temporal components. This new data model is essential to the next stage, where we introduce an emerging hotspots analysis to identify trends. The tool is based on Getis-Ord Gi* statistics to identify hotspots and Mann–Kendall statistics to determine trends [36]. The method is based on the key field count (aggregated cases) of each bin recorded over time.
Pairwise comparisons of each bin value with the subsequent time-step value are essential to identify a trend as incrementing, decrementing or unchanging. Related to this, the method includes other parameters to examine current trends (expected and observed sum of cases, Z score to learn the trend sign and p value to check for statistical significance) [26]. On this basis, the Mann–Kendall method produces an interesting trend type for decreasing bins (cold spots) and increasing bins (hotspots), with eight categorised results based on trends (both increasing and decreasing).

2.3.2. Second Stage, from November 2020 to January 2021: Checking the Predictive Potential of Emerging Hotspots

One of the hypotheses of the method proposed is the potential for using emerging hotspots as a predictive model. The second stage of the method thus seeks to check the relative location of new COVID-19 cases against the types of emerging hotspots. This stage consists of recoding a consecutive period of two months and analysing the distribution of these cases in comparison with the emerging results.
To that end it is necessary to join point or new geocoded COVID-19 cases spatially into polygons or bins. In line with the expected results, the reports include these possible circumstances:
  • New cases outside the emerging hotspots modelled.
  • New cases inside previous emerging hotspots, where there are two possible combinations: one corresponding to “no pattern detected” because statistical significance is not reached, and the other consisting of emerging hotspots with statistical significance.
Additionally, as mentioned above, the proposed method can be replicated on other spatial scales and in other periods of time. In regard to the replicable method, in the second stage, we introduce 3D bins and emerging hotspots analysis from November 2020 to January 2021. This is calculated with the same distance parameter (expected distance from nearest neighbour analysis) and more detailed temporal slides due to the methodological constraint of ten time intervals (in this case calculated for five days over two months).
The new emerging hotspot for the second stage is compared with the first one by spatial joining. It is useful to analyse the evolution of certain typologies from the first model.
It is important to see this stage as strategic because it helps to test the usefulness of the method as regards a geoprevention framework in a near short-time period.

3. Results

This section presents the analysis of 3D bins and emerging hotspots for the Autonomous Community of Cantabria over two periods (stages), as presented in the methodology section.

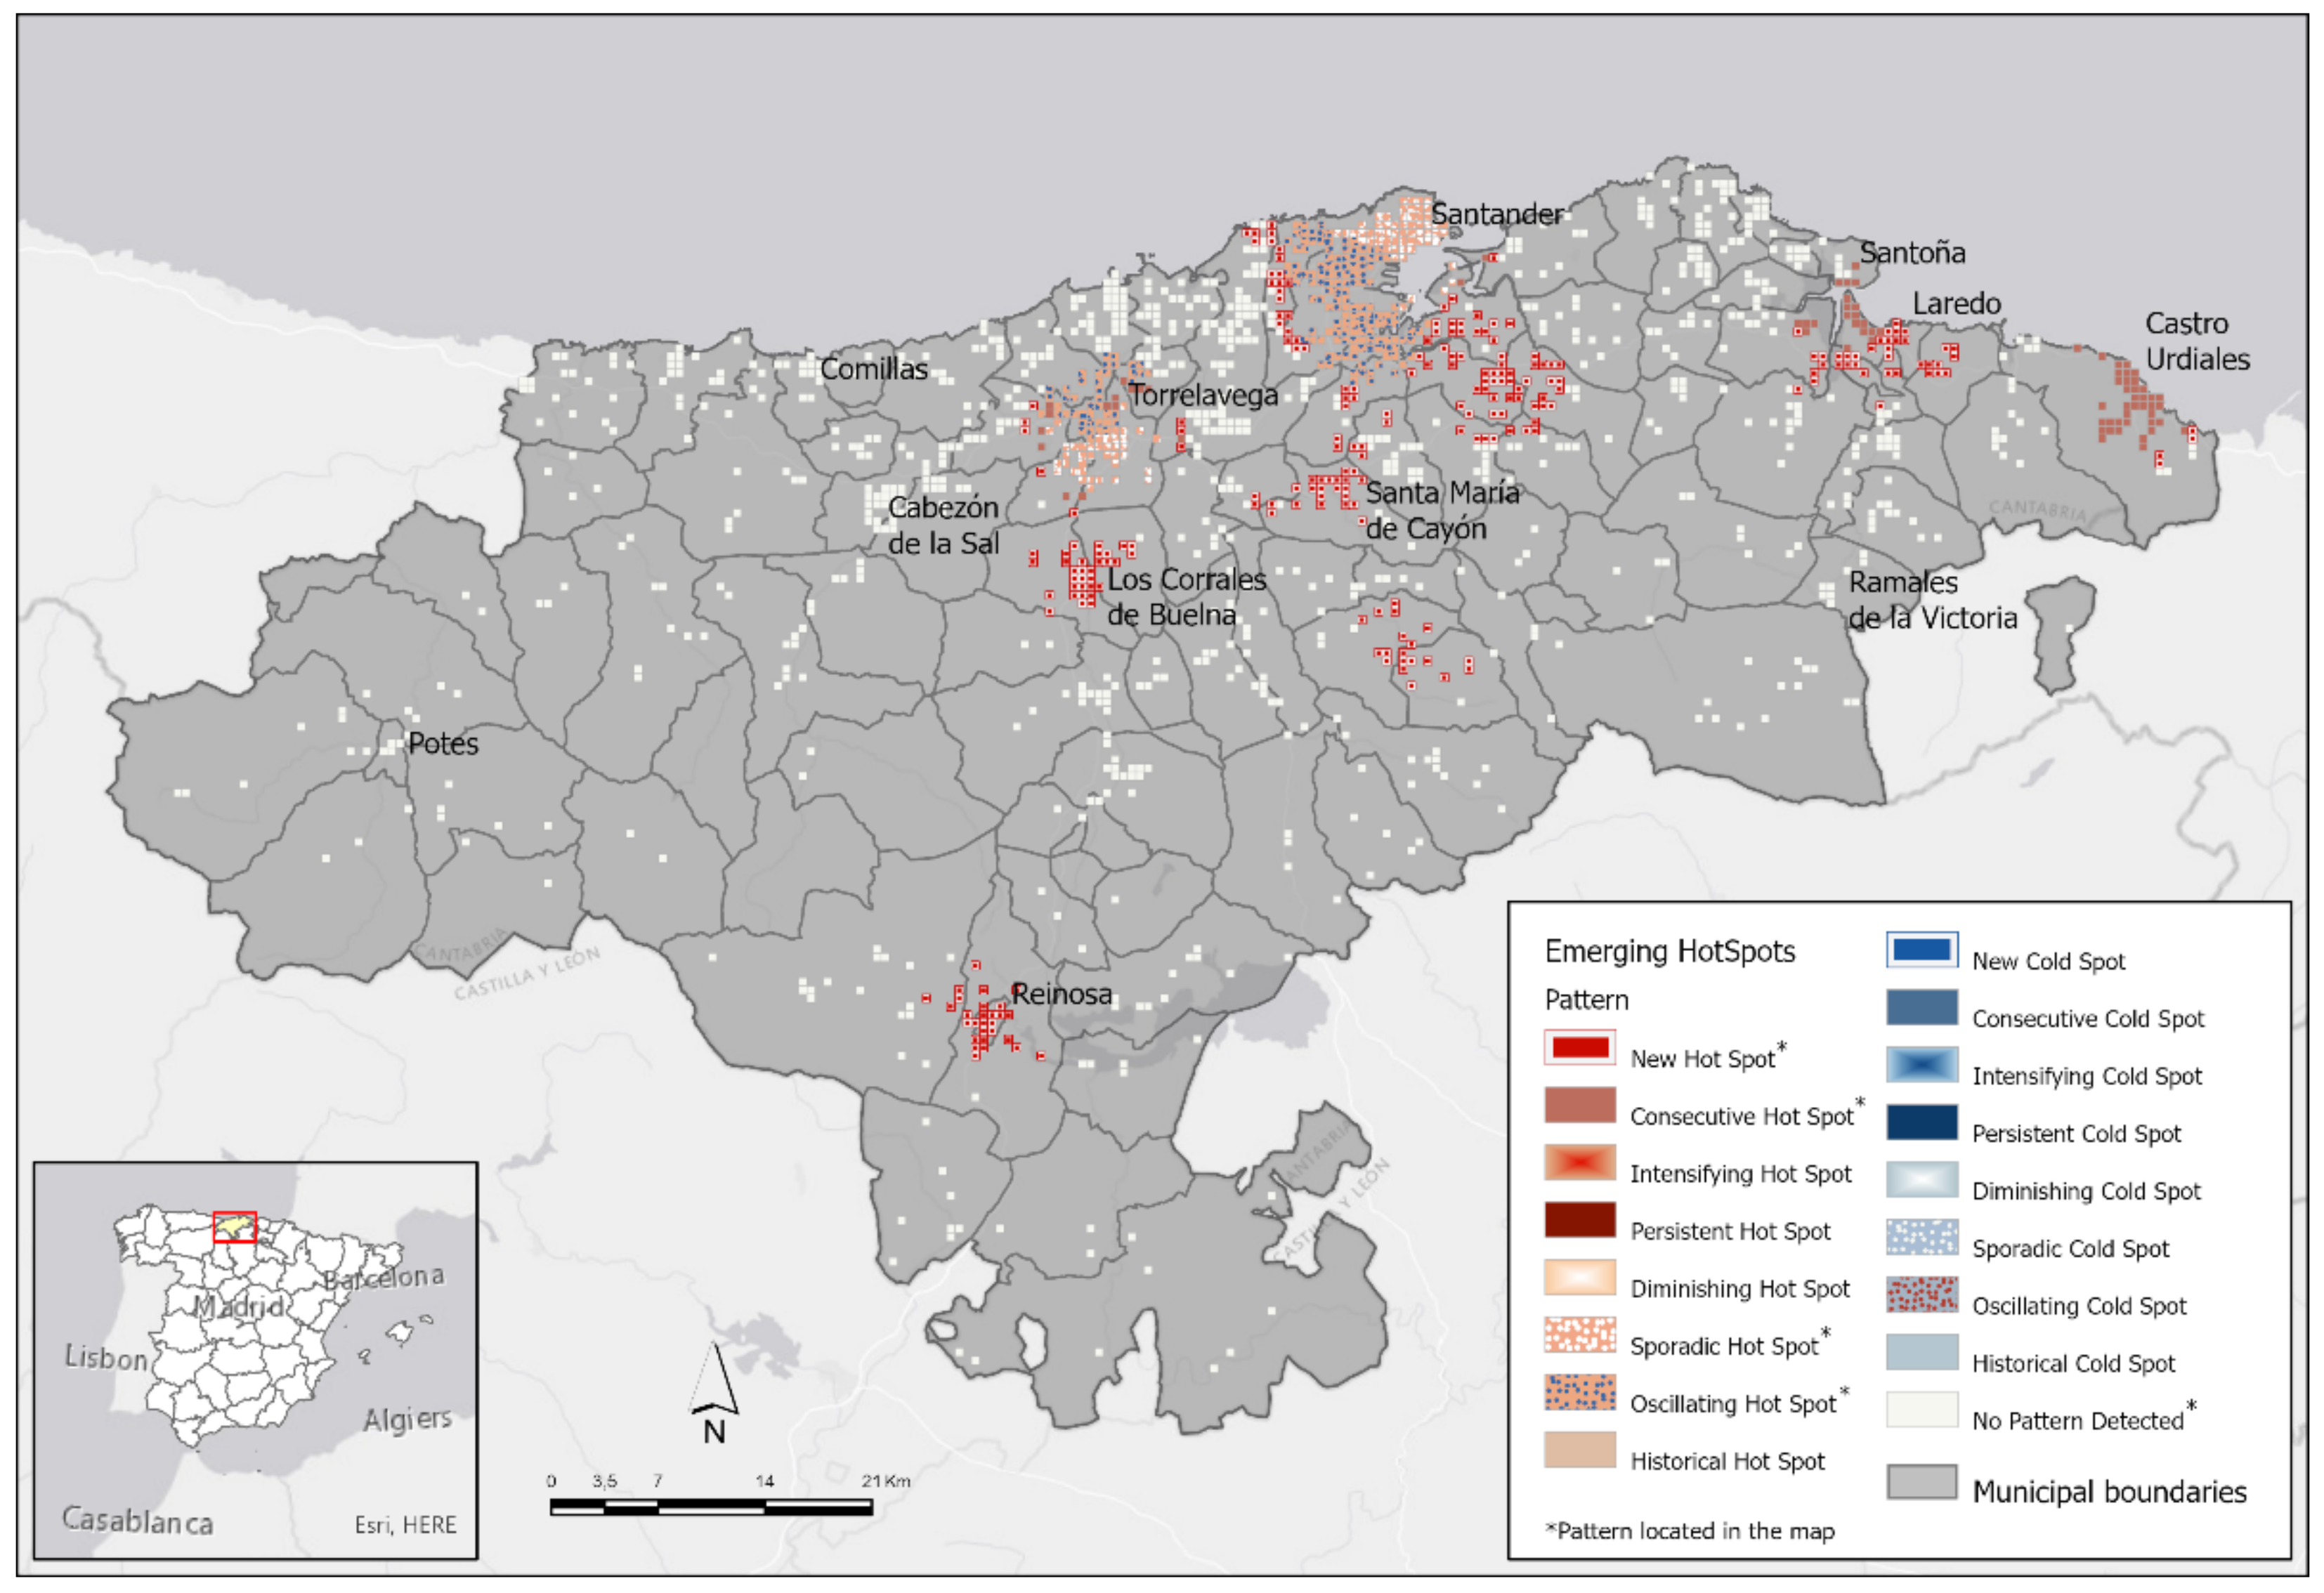
3.1. First Stage: 3D Bins and Emerging Hotspots in Cantabria from March to November 2020

The period considered in this analysis runs from the beginning of the recording of COVID-19 microdata (1 March 2020) to the second wave in continuous daily records that stop temporarily in the analysis on 20 November 2020. Hence, the sequence includes the COVID-19 cases (13,907 records) from the first and second waves and the run-up to the third.
The result provided by the 3D bins model is revealing in that it simplifies the information from the starting points and their corresponding heat map and brings to the fore the hierarchies of the effects of the pandemic in the territory analysed (Figure 4). COVID-19 cases in Cantabria are represented in 1414 bins with different intensities and distributions. The bins show two stand-out levels of spatial segregation: the first is the difference between inland and coastal areas, with a clear articulation in the coastal municipalities, and the second is the concentration in areas of high population density and mobility such as the Santander–Torrelavega hinterland in the Santander FUA and especially the western arc of Santander Bay, which is where the city of Santander is currently expanding most intensely.
The cubes in the eastern coastal area are much larger than in the western coastal area. The main reason for this west–east disparity is the proximity of Bilbao, the tenth biggest city in Spain (the population of the city itself is almost 350,000 but that of its metropolitan area is over 1 million). Bilbao is 100 km (62 miles) from Santander and has an important role as a pole of economic attraction in the north of Spain, exerting influence on the eastern part of Cantabria. The large-scale flow of people between the neighbouring communities is another factor to take into account in these results. At the European level, the FUA of Bilbao extends beyond the borders of the Autonomous Community of the Basque Country and includes the eastern part of Cantabria. This is an important sign of the intensity of relations between the eastern part of Cantabria and Bilbao.
By contrast, inland Cantabria has a layout based on small cubes over most of its territory, except for the regional headwaters of the inland valleys.
The first significant result for emerging hotspots is that of the 1414 cubes identified in the region, 812 (57.43%) show no statistically significant pattern that could be associated with a specific hot or cold spot (Table 3). In fact, from the COVID-19 distribution and the consideration of its spatial pattern over time, no cold spots can be derived.
The emerging hotspots analysis is revealing from the point of view of geoprevention in that it significantly reduces the territory where it is important to focus the analysis and therefore policy making. In fact, despite the said large number of cubes with no pattern detected, it should be noted that only 24.89% of COVID-19 cases occurred in these areas.
The statistical significance of the cubes refers to the spatial and temporal neighbourhood simultaneously. The absence of a clear pattern would imply that areas that have had COVID-19 cases in one or more moments of time throughout the period considered were not significant either temporally with respect to the preceding interval or spatially related to nearby areas. Regarding heat maps and animated cartography, we can observe a way to disentangle which spots on a pandemic heat map should be understood as problem areas and, on the contrary, which areas covered by the colour gamut in a heat map should go into the background from the point of view of the spatial behaviour of COVID-19. In summary, the statistical significance of the cube is a way to catch a glimpse of which areas should not be the focus of policy makers against those that we will comment upon, which present spatial–temporal statistical significance and contribute to emerging patterns.
A look at the 602 cubes with statistical significance (new, oscillating, sporadic and consecutive patterns) reveals that they all correspond to the hotspot pattern. Depending on the numbers of cases, the results are as follows:
  • Two hundred and fifty-one bins (41.69%) are new hotspots, i.e., these are hotspots with statistical significance only in the final part of the period analysed (October–November). These bins contain 2190 cases (15.75% of the series analysed, 20.96% of cases in hotspots with statistical significance).
  • One hundred and seventy-eight bins (29.57%) are oscillating hotspots. These are hotspots which are significant towards the end of the period (October–November) but show a previous trend in which they were significant cold spots. Less than 90% of the time intervals in these cases have shown significant hotspots. In Cantabria, this type is ranked second not only in number of bins but also in number of cases, with 3163 reported positive cases of COVID-19 (22.74% of the series analysed, 30.28% of cases in hotspots with statistical significance). This type is also where the lowest mean age of cases is detected (41.7 years).
  • Ninety-eight bins (16.28%) are sporadic hotspots. This type corresponds to locations that switch from hotspot to non-hotspot status several times in the period considered. They show up as significant hotspots in less than 90% of the time intervals and never as significant cold spots. This type is striking in that in 16.28% of statistically significant cubes, it is the one with the most COVID-19 cases, with a total of 3988 cases (28.68% of the series analysed, 38.18% of cases in hotspots with statistical significance). Furthermore, possibly related to the large number of cases, it is in this hotspot pattern where most deaths are found when those in residential homes are excluded (42 deaths, equivalent to 31%).
  • Seventy-five bins (12.46%) are consecutive hotspots. These are areas with significant hotspots in a single run without interruption in the final time intervals considered. These cubes were not significant hotspots before the last run. These hotspots are also the least common in terms of number of cases, accounting for 1105 cases (7.95% of the series analysed, 10.58% of cases in hotspots with statistical significance) in all.
Therefore, it is important to highlight that the study not only distinguishes whether a bin is statistically significant, but also identifies temporal trends: a reiterative pattern is detected in 58.31% of statistically significant bins (most with oscillating behaviour (29.57%) and 16.28% sporadic over the period and 12.46% consecutive at the end of the period).
In addition to the general statistical guidelines, the spatial pattern is also very interesting (Figure 5). The new hotspots establish areas of new cases which, in urban areas already hit by the first wave of the pandemic, have a peripheral configuration in the form of rings around areas that previously had a high concentration of cases. This seems to reflect the spatial process of COVID-19 spread in the central and eastern coastal area. By contrast, in rural areas, most hotspots correspond to new locations in the main towns within rural areas of the region.
The types with alternating cases over time are concentrated in the municipal areas of the two main cities, Santander and Torrelavega, and on the edges of Santander on the metropolitan arc of the bay. It is noteworthy that these types do not intermingle but rather are segregated in an east–west direction in Santander and north–south in Torrelavega, with sporadic hotspots coinciding with more affluent areas and oscillating hotspots with more modest areas.
Hence, according to the spatial patterns obtained, we emphasise that 3D space–time bins and analysis of associated emerging hotspots are useful methods for revealing the areas most at risk from the pandemic.

3.2. Testing the Predictive Potential of the Emerging Initial Model: The Spread of the Pandemic Two Months Later

The period considered at this checking stage starts after the end of the first stage, and uses the record of COVID-19 microdata for two months (from 21 November 2020 to 21 January 2021). We analyse the distribution of 5766 new COVID-19 cases in relation to the emerging hotspots model previously presented.
As explained in the methodology section, the second stage of this research involves two approaches: the relative locations of new COVID-19 cases outside/inside emerging hotspots from stage one; and then a new 3D bins and emerging hotspots model applied only to cases from this period. We obtained interesting results, which are reported below.

3.2.1. The Predictive Power of Analytics of Emerging Hotspots Is Confirmed

The locations of new COVID-19 cases in relation to emerging hotspots from the first stage demonstrate that 92.63% of new cases (that correspond to the third wave) are located inside a previous bin, which means that only 7.37% of cases were located outside the initial 3D bins, as we highlighted in the Abstract. Furthermore, 83.02% of new cases were in statistically significant previous emerging hotspots. These results confirm the spatial repetition factor and the value of the emerging hotspots map (based on first and second wave cases) as a prelude to the third wave. Indeed, an analysis of the Euclidean distance of new cases outside emerging hotspots demonstrates that most are very near areas in our model (the median is 250 m, 0.16 miles).
In relation to the distribution of new cases inside previous emerging hotspots (Table 4), it is important to mention the secondary role of areas where no pattern is detected: they are the largest in terms of area (57.43%) but account for only 16.98% of new cases. This is the second main result of our checking stage: 83.02% of new cases inside previous emerging hotspots coincide with significant emerging patterns.
The emerging types that involved temporary reiterative hotspots in the first stage account for 55.48% of new cases (25.37% in oscillating and 30.11 in sporadic bins). Again, a repetition pattern is shown, and types that showed up in trends as significant hotspots (new and consecutive) host 27.54% of new third wave COVID-19 cases.

3.2.2. Emerging Patterns Detected Two Months Later

Applying the new 3D bins and emerging hotspots model only to cases from November 2020 to January 2021 results in 900 3D bins and an interesting emerging pattern, where a new type of intensifying hotspot appears. We presume that this is an effect of considering a shorter period, with which the results show more detailed specific trends.
However, in the checking stage, we seek to analyse relevant changes in emerging patterns from the point of view of geoprevention. To that end, we use the spatial join to cross-analyse new emerging hotspots with the model from stage one and obtain 27 combinations (Table 5). One-third of bins do not change their types.
Focusing on the changes, we suggest focusing on the most risky patterns related to geoprevention, i.e., those areas where the last trend indicates intensifying patterns or new areas of COVID-19. These types are marked in Table 5 with **. Areas that were previously sporadic but have changed to intensifying hotspots in stage two are of particular interest. They are located mainly in the city centre of Santander, where more than 1400 new cases in these last two months are located. This demonstrates a process of consolidation of emerging hotspots in relation to the recent time trend.
By contrast, 651 new cases are located in hotspots that have switched from oscillating to intensifying (326 cases) or consecutive (325 cases). Their distribution is associated with less affluent areas near the main cities of Cantabria (Santander and Torrelavega).
To conclude, we highlight that the distribution of the second type in terms of the number of cases (1013), i.e., that in which no pattern is detected in either stage, in Cantabria is associated with low-density areas (peri-urban and rural coastal and interior valleys with a residential model based on single-family homes).

4. Discussion

Our findings reveal that COVID-19 microdata provide a useful way of interpreting trends behind emerging hotspots with a multi-scalar perspective. Moreover, the method based on space–time bins has a high potential for obtaining significant spatial patterns of hotspots with both space and time perspectives.
This is essential since COVID-19 data with a high level of spatial disaggregation (points such as coordinates after geocoding) and with high granularity (daily) must be properly analysed so that they can be transformed into strategic spatial information. In other words, the optimal data sequences could be useless (other than as expressive heat maps or cumulative incidence rates for districts or health areas) if they are not analysed using expressive geostatistical analysis.
In this regard, the first stage of our study demonstrates the diagnostic contribution provided by the combination of exploratory analysis of statistical significance, calculations of space–time bins and emerging hotspots. There is recursive filtering from the cubes that are not statistically significant to those that are and, within the latter, a type that may reveal the specific areas where it would be useful to act. We therefore confirm the high potential of such analysis for planning periodic geoprevention actions in affected areas.
These results are important to reduce spread and distinguish a problematic focus from others, answering the key question “where?” as the main aim according to Kamel and Geraghty [37]. In relation to this, geospatial sciences play a strategic role in shortening response times for social management [38].
There is considerable scientific support for spatial cluster methods applied to health research, as mentioned in the Introduction. However, we realise that one limitation of our research is that we cannot compare our results with those from other studies at similar scales for the same subject, COVID-19, as has already happened in the case of other authors with the patterns detected in other respiratory diseases such as pulmonary TB cases, where the authors use about 1000 records as a key study for implementing proper prevention programmes [23]. However, it is possible to identify thematic affinity insofar as similarities are observed in the approach of applying 3D space–time bins in other investigations that, like ours, seek to contribute to geoprevention plans. This concept goes beyond health research and could be extended to other topics of interest such as safety [21,22], where there are similarities with the methodology used by us for point layer analysis, in our case with a novel approach to geoprevention in health and more precisely in relation to a priority research object: COVID-19.
It is true that the usefulness of our results is limited in time and that they could undergo modifications as a function of trends over time and parameters linked to the spatial scale of analysis. Indeed, when long periods of time are used (which with daily series and with the COVID-19 virus fully active could be considered to mean more than a month) there are certain types of hotspot that are omitted or masked in periods within the set of time periods considered, as highlighted by Kulldorff [34] in his research with different temporal granularity for series of years. This is what happens with intensifying hotspots in our study: they do not appear in the nine months of stage one but are found in the second stage of the research in the emerging hotspots for the last two months, corresponding to the third wave. Such categories, which are of great interest for geoprevention actions, could be hidden in the first stage due to the long period considered. This crucial aspect is pointed out at a methodological level for future research, but it does not invalidate or lead us to question the results obtained. We simply propose the opportunity to use this method continuously over time and at shorter intervals or time-steps as a follow-up measure for policy makers in terms of geoprevention. This concept, which was born in the field of environmental criminology [39] is applicable to the health field and more specifically to the design of public health measures to face the pandemic. Therefore, it must be pointed out that in Spain, currently, the management of the pandemic corresponds to the regional governments, coordinated at the national level by the inter-territorial council and that there are no levels of administration with powers below the autonomous community. However, where statistically significant hotspots with patterns of repetition are detected, it would be interesting to coordinate the regional authorities with the municipal ones so that the latter help in the implementation of geoprevention strategies related to cleaning (disinfection of public spaces and buildings in areas of special risk according to emerging hotspots models) and vigilance (for example, compliance with social distancing rules, use of masks, compliance with night hours, etc.). Moreover, health authorities at the regional level could also use the spatial patterns resulting from 3D bins and emerging hotspots to identify areas in which to carry out preventive actions, such as massive screening to identify asymptomatic cases, or inspections of buildings (systems of air circulation in indoor bathrooms, for example) in emerging hotspots where a large number of infections happen in short periods of time and repeatedly over time (oscillating and sporadic patterns, for instance).
Back to the results discussion, we must consider the difficulty of the hotspot relationship with outbreaks. In some cases, new hotspots are identified with outbreaks (as occurs in homes for the elderly, where the causal location and the place of residence of the infected people are the same). However, in most cases, outbreaks have a spatial incidence in many locations (because of the different places of residence of the infected people). There is also a high proportion of positive cases where the origin of the contagion is unknown. In this regard, 3D bins analysis is crucial for identifying and assessing the different levels of risk associated with the active hotspot and for analysing the role of neighbourhoods in the spread of the pandemic from a historical perspective.
In regard to the risk of subjectivity, we must clarify that although the method has parameters that have to be established by the researcher, in our study, we have opted to use distance thresholds based on nearest neighbour analysis. This enables the methodological design to be objectified and acts as a standard element that can be extended for the replication of the method in other case studies using other time periods or different scales of analysis.
Indeed, the second stage of our methodological framework enables us to compare the new emerging model from the first stage due to the use of the same parameter of distance thresholds. We believe that the fact that 92.63% of the 5341 new cases are located within a previous emerging hotspot is a revealing result in terms of addressing the next wave of the pandemic and helping policy makers to design strategies adapted to the particular features of each territory. Moreover, discipline-based knowledge about each territory, sociodemographic content and health advances could help take advantage of the geotechnology-related opportunities to overcome the effects of COVID-19 on society [40].
This line of research is likely to be linked with other approaches addressed in publications cited in the bibliography, and especially with those that seek to analyse the socioeconomic, demographic and functional frameworks of the areas where COVID-19 cases are found. We thus intend to work to study the conditions and environment variables that arise in the different kinds of hotspot in order to find social patterns that can be correlated and ultimately explain the spatial patterns presented in this paper.

5. Conclusions

To the best of our knowledge, this is the first study that demonstrates the usefulness of 3D space–time bins for COVID-19 and emerging hotspots analysis based on geocoded microdata in engaging the geoprevention measures proposed by policy makers. Thus, it provides support for decision makers in matters of geoprevention, from the perspective of the necessary link between measures and the particularities of the spatial pattern of COVID-19 in each territory.
Indeed, considering the eight types of trend, different levels of importance can be distinguished: the most worrying are new, consecutive, intensifying persistent and oscillating hotspots, followed at a second level of importance by diminishing, sporadic and historical hotspots. In this regard, the SITAR GIS system implemented enables us to analyse the spatial patterns of COVID-19 over time at detailed scales and to produce reports in real time related to sources of contagion that may arise at a certain time.
It should be remembered that the method requires at least 10 moments in time to analyse emerging points. With a daily series of COVID-19 cases, we believe that it could be applied as a diagnosis every 20 or 30 days at the intraurban level. It could also help in decision making with strategic information as it highlights a diagnosis of emerging points, which may be of special interest when hotspots are identified in situations associated with extreme levels of danger and dynamism (new, growing or persistent hotspots, among others).
The research confirms the predictive potential of this methodology and the possibility of it being replicated elsewhere from a multi-scale (space and time) perspective. Accordingly, researchers need to collaborate with health authorities to access microdata records, which are the essential source for applying this methodology.
Finally, our results report significant space–time trends. This can serve as support due to their short-term predictive nature in that when intensity changes due both to the accumulation of cases and their trend and to associated spatial diffusion processes, the types of emerging hotspot can be interpreted as a prelude to what will happen in the coming days and weeks.

Author Contributions

Conceptualisation and methodology, Olga De Cos; visualisation and publishing (graphs and maps), Valentín Castillo; writing—original draft preparation, Olga De Cos and David Cantarero; writing—review and editing, Olga De Cos and David Cantarero; supervision, Olga De Cos; securing of funding, David Cantarero. All authors have read and agreed to the published version of the manuscript.

Funding

This research was funded by the Regional Government of Cantabria (Spain) under grant number UC: 10.3834.64001 (“Asistencia en la adecuación de Cantabria al plan para la transición hacia una nueva normalidad en tiempos del Covid-19: aportaciones socioeconómicas”) by the University of Cantabria-IDIVAL Valdecilla-Government of Cantabria (Spain). The APC was funded by the project Test de estrés o resistencia en el Sistema Cantabro de Salud, desarrollo de tecnologias innovadoras digitales para modelizar escenarios de mayor utilización sanitaria y soluciones de impacto socioeconómico y humano frente a la COVID-19. INNVAL20/03 (IDIVAL).

Institutional Review Board Statement

Not applicable.

Informed Consent Statement

Not applicable.

Data Availability Statement

The permission to use COVID-19 microdata given by the CEIm in June 2020 (ID: 2020.238) prevents us from sharing or publishing the original data.

Conflicts of Interest

The authors declare that they have no conflicts of interest.

References

  1. De Cos, O.; Castillo, V.; Cantarero, D. Facing a Second Wave from a Regional View: Spatial Patterns of COVID-19 as a Key Determinant for Public Health and Geoprevention Plans. Int. J. Environ. Res. Public Health 2020, 17, 8468. [Google Scholar]
  2. Cromley, E.K. Using GIS to address epidemiologic research questions. Curr. Epidemiol. Rep. 2019, 6, 162–173. [Google Scholar] [CrossRef]
  3. Gerber, T.D.; Ping, D.; Armstrong-Brown, J.; McNutt, L.A.; Cole, F.B. Charting a path to location intelligence for STD control. Public Health Rep. 2009, 124, 49–57. [Google Scholar] [CrossRef] [Green Version]
  4. Jindal, C.; Kumar, S.; Sharma, S.; Choi, Y.M.; Efird, J.T. The Prevention and Management of COVID-19: Seeking a Practical and Timely Solution. Int. J. Environ. Res. Public Health 2020, 17, 3986. [Google Scholar] [CrossRef] [PubMed]
  5. Kleinman, K.P.; Abrams, A.M.; Kulldorff, M.; Platt, R. A model-adjusted space-time scan statistic with an application to syndromic surveillance. Epidemio. Infect. 2005, 133, 409–419. [Google Scholar] [CrossRef] [PubMed] [Green Version]
  6. Kulldorff, M.; Heffernan, R.; Hartman, J.; Assuncao, R.; Mostashari, F. A space-time permutation scan statistic for disease outbreak detection. PLoS Med. 2005, 2, e59. [Google Scholar] [CrossRef] [PubMed] [Green Version]
  7. Zhao, F.; Cheng, S.; He, G.; Huang, F.; Zhang, H.; Xu, B.; Murimwa, T.C.; Cheng, J.; Hu, D.; Wang, L. Space-Time Clustering Characteristics of Tuberculosis in China, 2005–2011. PLoS ONE 2013, 8, e83605. [Google Scholar] [CrossRef] [PubMed]
  8. Pangilinan, M.A.; Gonzalez, D.P.; Leong, R.N.; Co, F.F. Spatial analysis of the distribution of report dengue incidence in the National Capital Region, Philippines. Acta Med. Philipp. 2017, 51, 126–132. [Google Scholar] [CrossRef]
  9. Tzai-Hung, W. Analyzing the patterns of space-time distances of tracking the diffusion of an epidemic. In Book Space-Time Integration in Geography and GIScience; Mei-Po, K., Douglas, R., Donggen, W., Chenghu, Z., Eds.; Springer: Dordrecht, The Netherlands, 2015; pp. 269–282. [Google Scholar] [CrossRef]
  10. Al-Ahmadi, K.; Alahmadi, S.; Al-Zahrani, A. Spatiotemporal Clustering of Middle East Resparatory Syndorme Coronavirus (MERS-CoV) Incidence in Saudi Arabia, 2012–2019. Int. J. Environ. Res. Public Health 2019, 16, 2520. [Google Scholar] [CrossRef] [Green Version]
  11. Mala, S.; Jat, M.K. Geographic information system based spatio-temporal dengue fever cluster analysis and mapping. Egypt. J. Remote Sens. Space Sci. 2019, 22, 297–304. [Google Scholar] [CrossRef]
  12. Hughey, S.M.; Kaczynski, A.T.; Porter, D.E.; Hibbert, J.; Turner-McGrievy, G.; Liu, J. Spatial clustering patterns of child weight status in a southeastern US county. Appl. Geogr. 2018, 99, 12–21. [Google Scholar] [CrossRef]
  13. Greenough, P.G.; Nelson, E.L. Beyond mapping: A case for geospatial analytics in humanitarian health. Conflict Health 2019, 13, 50. [Google Scholar] [CrossRef] [PubMed]
  14. Niu, X.; Yue, Y.; Zhou, X.; Zhang, X. How urban factors affect to spatiotemporal distribution of infectious diseases in addition to intercity population movement in China. ISPRS Int. J. Geo Inf. 2020, 9, 615. [Google Scholar] [CrossRef]
  15. Whittle, R.S.; Díaz-Artiles, A. An ecological study of socioeconomic predictors of detection of COVID-19 cases across neighborhoods in New York City. BMC Med. 2020, 18, 271. [Google Scholar] [CrossRef] [PubMed]
  16. Dhaval, D.D. Urban Densities and the COVID-19 Pandemic: Upending the Sustainability Myth of Global Megacities. ORF Occas. Pap. 2020, 244, 1–42. [Google Scholar]
  17. Hamidi, S.; Sabouri, S.; Ewing, R. Does density aggravate the COVID-19 Pandemic? Early findings and lessons for planners. J. Am. Plan. Assoc. 2020. [Google Scholar] [CrossRef]
  18. Bamweyana, I.; Okello, D.A.; Ssengendo, R. Socio-Economic Vulnerability to COVID-19: The spatial case of Greater Kampala Metropolitan Area (GKMA). J. GIS 2020, 12, 302–318. [Google Scholar] [CrossRef]
  19. Borjas, G.J. Demographic Determinants of Testing Incidence and COVID-19 Infections in New York City Neighborhoods; Working Paper: 26952; National Bureau of Economic Research: Cambridge, MA, USA, 2020. [Google Scholar]
  20. Liu, Y.; He, Y.; Xia, Z. Space-time variation and spatial differentiation of COVID-19 confirmed cases in Hubei province based on extended GWR. ISPRS Int. J. Geo Inf. 2020, 9, 536. [Google Scholar] [CrossRef]
  21. Hashim, H.; Wan-Mohd, W.M.N.; Sadek, E.S.S.M.; Dimyati, K.M. Modeling urban crime patterns using spatial space time and regression analysis. Int. Arch. Photogramm. Remote Sens. Spatial Inf. Sci. 2019, XLII-4/W16, 247–254. [Google Scholar] [CrossRef] [Green Version]
  22. Kang, Y.; Cho, N.; Son, S. Spatiotemporal characteristics of elderly population´s traffic accidents in Seoul using space-time cube and space-time kernel density estimation. PLoS ONE 2018, 13, e0196845. [Google Scholar] [CrossRef] [Green Version]
  23. Sayed, M.H.; Masoud, P.; Masoud, B.; Manoochehr, K.; Meysam, O. Pattern mining analysis of pulmonary TB cases in Hamadan province: Using space-time cube. Int. J. Epidemil. Res. 2017, 4, 111–117. [Google Scholar]
  24. Chunbao, M.; Dechan, T.; Tingyu, M.; Chunhua, B.; Jian, Q.; Weiyi, P.; Zhiyong, Z. An analysis of spatiotemporal pattern for COVID-19 in China based on space-time cube. J. Med. Virol. 2020, 92, 1587–1595. [Google Scholar]
  25. Thakar, V. Unfolding events in space and time: Geospatial insights into COVID-19 diffusion in Washington State during the initial stage of the outbreak. ISPRS Int. J. Geo Inf. 2020, 9, 382. [Google Scholar] [CrossRef]
  26. Franch-Pardo, I.; Napoletano, B.M.; Rosete-Verges, F.; Billa, L. Spatial analysis and GIS in the study of COVID-19. A review. Sci. Total Environ. 2020, 739, 140033. [Google Scholar] [CrossRef] [PubMed]
  27. Hemant, B.; Anjum, S.; Kumar, S.; Gautam, S.; Gupta, A.; Kumbhare, H.; Anshul, A.; Kumar, R. Understanding COVID-19 transmission through Bayesian probabilistic modeling and GIS-based Voronoi approach a policy perspective. Environ. Dev. Sustain. 2020. [Google Scholar] [CrossRef]
  28. Batista, F.; Poelman, H. Mapping Population Density in Functional Urban Areas. A Method to Downscale Population Statistics to Urban Atlas Polygons; JRC Technical Reports; European Commission: Luxembourg, 2016; Available online: https://tinyurl.com/y9r2mbkt (accessed on 10 May 2020).
  29. De Cos, O.; Castillo, V.; Cantarero, D. Scalable Analysis of COVID-19 Spatiotemporal Patterns Based on Data Mining Tools: Using 3D Bins to Predict Short-time Focus Locations. Res. Sq. Prepr. 2020. [Google Scholar] [CrossRef]
  30. ESRI COVID-19 GIS Hub. Available online: https://coronavirus-resources.esri.com/ (accessed on 15 June 2020).
  31. The Geoenrichment Service. ArcGIS REST API. Available online: https://developers.arcgis.com/rest/geoenrichment/api-reference/geoenrichment-service-overview.htm (accessed on 10 August 2020).
  32. Mollalo, A.; Vahedi, B.; Rivera, K.M. GIS-based spatial modeling of COVID-19 incidence rate in the continental United States. Sci. Total Environ. 2020, 728, 138884. [Google Scholar] [CrossRef]
  33. Abdrakhmanov, S.K.; Mukhanbetkaliyev, Y.Y.; Korennoy, F.I.; Karatayev, B.S.; Mukhanbetkaliyeva, A.A.; Abdrakhmanova, A.S. Spatio-temporal analysis and visualization of the anthrax epidemic situation in livestock in Kazakhstan over the period 1933–2016. Geospat. Health 2017, 12, 316–329. [Google Scholar]
  34. Zhao, Y.; Ge, L.; Liu, J.; Liu, H.; Yu, L.; Wang, N.; Zhou, Y.; Ding, X. Anaylzing hemorrhagic fever with renal syndrome in Hubei Province, China: A space-time cube-based approach. J. Int. Med. Res. 2019, 47, 3371–3388. [Google Scholar] [CrossRef] [Green Version]
  35. Kulldorff, M. Prospective time periodic geographical disease surveillance using scan statistic. J. R. Statist. Soc. A 2001, 164 Pt 1, 61–72. [Google Scholar] [CrossRef]
  36. Ogneva-Himmelberger, Y. Spatial analysis of drug poisoning deaths and Access to substance-use disorder treatment in the United States. In Proceedings of the 5th International Conference on Geographical Information Systems Theory, Applications and Management (GISTAM), Crete, Greece, 3–5 May 2019; pp. 315–321. [Google Scholar] [CrossRef]
  37. Kamel, M.N.; Geraghty, E.M. Geographical tracking and mapping of coronavirus disease COVID-19/severe acute respiratory syndrome coronavirus 2 (SARS-CoV-2) epidemic and associated events around the world: How 21st century GIS technologies are supporting the global fight against outbreaks and epidemics. Int. J. Health Geogr. 2020, 19, 8. [Google Scholar] [CrossRef] [Green Version]
  38. Zhou, C.; Su, F.; Pei, T.; Zhang, A.; Du, Y.; Luo, B.; Cao, Z.; Wang, J.; Yuan, W.; Zhu, Y.; et al. COVID-19: Challenges to GIS with Big Data. Geogr. Sustain. 2020, 1, 77–87. [Google Scholar] [CrossRef]
  39. Hernando, F. La seguridad en las ciudades: El nuevo enfoque de la geoprevención. Scr. Nova 2008, 12, 270. [Google Scholar]
  40. Sarwar, S.; Waheed, R.; Sarwar, S.; Khan, A. COVID-19 challenges to Pakistan: Is GIS analysis useful to draw solutions? Sci. Total Environ. 2020, 730, 139089. [Google Scholar] [CrossRef] [PubMed]
Figure 1. The study area of Cantabria in the national context: settlements, functional urban area (FUA) and main communication infrastructures. Source: Own work based on ESRI (administrative base map), National Geographic Institute (National Cartographic Base 200) and Government of Cantabria (digital elevation model).
Ijgi 10 00261 g001
Figure 2. Daily and cumulative trend in COVID-19 cases in the Community of Cantabria (first method stage: March–November 2020). Scheme 19 [29]. in Cantabria (open data from the Government of Cantabria).
Ijgi 10 00261 g002
Figure 3. Methodological design of the research based on two stages.
Ijgi 10 00261 g003
Figure 4. Space–time 3D bins of COVID-19 in the Autonomous Community of Cantabria (March–November 2020). Source: Own work based on COVID-19 microdata daily records from the health authorities (Government of Cantabria, Spain).
Ijgi 10 00261 g004
Figure 5. Emerging hotspots for COVID-19 in the Autonomous Community of Cantabria (March–November 2020). Scheme 22 [29]. Source: Own work based on COVID-19 microdata daily records from the health authorities (Government of Cantabria, Spain).
Ijgi 10 00261 g005
Table 1. Number of records in the study detailed by research stages.
Cases (COVID-19 Records)First Stage (March 2020 to November 2020)Second Stage (November 2020 to January 2021)
Cases initially reported 15,1686530
Total geocoded cases14,9386200
Geocoded cases studied13,9075766
Source: Own work based on COVID-19 microdata daily records from the health authorities (Government of Cantabria, Spain).
Table 2. The spatial average nearest neighbour: COVID-19 cases and COVID-19 location counts (number of COVID-19 cases overlapped in the same points because of same address: street and number).
Nearest Neighbour ResultsLayer of Cases (Points)Layer of Location Counts
Observed distance38.7 m126.5 m
Expected distance408.2 m538.5 m
Nearest neighbour ratio0.0950.217
Z Score−201.58−122.07
p value<0.01<0.01
Source: Own work based on COVID-19 microdata daily records from the health authorities (Government of Cantabria, Spain).
Table 3. Emerging hotspot statistics: bins and number of COVID-19 cases.
Emerging PatternNumber of Bins% BinsNumber of Cases% Cases
No pattern detected81257.433,46124.89
Pattern detected:
New hotspots25117.75 *
41.69 **
219015.75 *
20.96 **
Oscillating hotspots17812.59 *
29.57 **
316322.74 *
30.28 **
Sporadic hotspots986.93 *
16.28 **
398828.68 *
38.18 **
Consecutive hotspots755.30 *
12.46 **
11057.95 *
10.58 **
Total pattern detected60242,5710,44675.11
Total emerging1414100.0013,907100.00
* Percentage of total emerging hotspots. ** Percentage of emerging hotspots with a pattern of statistical significance.
Table 4. Location of new COVID-19 cases in relation to the emerging hotspot model from stage 1.
Emerging PatternPrevious Pattern (Stage 1)New Cases (Stage 2)
Area% AreaCOVID-19 Cases% Cases
Outside previous emerging hotspot4257.37
Total inside previous emerging hotspot410.79 *
158.61 **
100.00534192.63
No pattern detected235.90 *
91.08 **
57.4390716.98
Pattern detected:174.89 *
67.53 **
42.574,43483.02
New hotspots72.92 *
28.15 **
17.7598718.48
Oscillating hotspots51.71 *
19.97 **
12.591,35525.37
Sporadic hotspots28.47 *
10.99 **
6.931,60830.11
Consecutive hotspots21.79 *
8.41 **
5.304849.06
* Area in square kilometres. ** Area in square miles.
Table 5. Cross-analysis of types of emerging hotspots (stage 1–stage 2), in decreasing order of number of COVID-19 cases.
Cross Emerging Patterns: Stage One–Stage Two *Number of BinsAverage % Time HotAverage % Time ColdNumber of Cases
Sporadic–Intensifying **5798.920.001433
No Pattern–No Pattern3310.495.321013
New–No Pattern1335.442.37662
Oscillating–Sporadic5851.190.00632
Consecutive–Sporadic4035.000.00354
Oscillating–Intensifying **2092.690.00326
Oscillating–Consecutive **4629.930.00325
New–Consecutive **3123.820.00298
Sporadic–Consecutive **2430.770.00224
Not previous–No pattern960.322.32168
Consecutive–Consecutive1529.230.00141
Oscillating–New107.692.3136
No Pattern–Consecutive **238.460.0030
New–Sporadic **242.310.0021
Oscillating–Oscillating226.927.6919
No Pattern–New **37.690.0013
No Pattern–Oscillating **415.387.6913
Oscillating–No Pattern60.0020.5110
New–Oscillating **315.387.699
Not previous–Consecutive **428.850.007
New–New **27.697.696
Sporadic–Sporadic280.770.006
Consecutive–No Pattern115.380.005
Not previous–Oscillating **215.387.694
Consecutive–New37.690.004
Consecutive–Oscillating123.087.694
Not previous–Sporadic230.770.003
Total9005766
* All these are hotspots, so the name is omitted. ** Interesting cross-typology from the point of view of geoprevention.
Publisher’s Note: MDPI stays neutral with regard to jurisdictional claims in published maps and institutional affiliations.

