
Factors Affecting Masticatory Performance of Older Adults Are Sex-Dependent: A Cross-Sectional Study
Abstract
:1. Introduction
2. Materials and Methods
2.1. Ethical Approval
2.2. Participants
2.3. General Evaluation
2.4. Skeletal Muscle Mass Index Measurement
2.5. Oral Health-Related Factor Test
2.6. Assessment of Masticatory Performance
2.7. Statistical Analyses
3. Results
4. Discussion
5. Conclusions
Supplementary Materials
Author Contributions
Funding
Institutional Review Board Statement
Informed Consent Statement
Data Availability Statement
Conflicts of Interest
References
- Kanasi, E.; Ayilavarapu, S.; Jones, J. The aging population: Demographics and the biology of aging. Periodontology 2000 2016, 72, 13–18. [Google Scholar] [CrossRef]
- Patel, J.; Wallace, J.; Doshi, M.; Gadanya, M.; Ben Yahya, I.; Roseman, J.; Srisilapanan, P. Oral Health for healthy ageing. Lancet Healthy Longevi. 2021, 2, e521–e527. [Google Scholar] [CrossRef] [PubMed]
- Gil-Montoya, J.A.; de Mello, A.L.F.; Barrios, R.; Gonzalez-Moles, M.A.; Bravo, M. Oral Health in the elderly patient and its impact on general well-being: A nonsystematic review. Clin. Interv. Aging 2015, 10, 461–467. [Google Scholar] [CrossRef] [Green Version]
- Bidlack, W.R. Interrelationships of food, nutrition, diet and health: The National Association of State Universities and Land Grant Colleges White Paper [The National Association of State Universities and Land-Grant Colleges white paper]. J. Am. Coll. Nutr. 1996, 15, 422–433. [Google Scholar] [CrossRef] [PubMed]
- Felton, D.A. Complete edentulism and comorbid diseases: An update. J. Prosthodont. 2016, 25, 5–20. [Google Scholar] [CrossRef]
- Rémond, D.; Machebeuf, M.; Yven, C.; Buffière, C.; Mioche, L.; Mosoni, L.; Mirand, P.P. Postprandial whole-body protein metabolism after a meat meal is influenced by chewing efficiency in elderly subjects. Am. J. Clin. Nutr. 2007, 85, 1286–1292. [Google Scholar] [CrossRef] [Green Version]
- Zhu, Y.; Hollis, J.H. Tooth loss and its association with dietary intake and diet quality in American adults. J. Dent. 2014, 42, 1428–1435. [Google Scholar] [CrossRef]
- Samnieng, P.; Ueno, M.; Shinada, K.; Zaitsu, T.; Wright, F.A.C.; Kawaguchi, Y. Oral Health status and chewing ability is related to mini-nutritional assessment results in an older adult population in Thailand. J. Nutr. Gerontol. Geriatr. 2011, 30, 291–304. [Google Scholar] [CrossRef] [PubMed]
- Ueno, M.; Yanagisawa, T.; Shinada, K.; Ohara, S.; Kawaguchi, Y. Category of functional tooth units in relation to the number of teeth and masticatory ability in Japanese adults. Clin. Oral Investig. 2010, 14, 113–119. [Google Scholar] [CrossRef]
- Ikebe, K.; Matsuda, K.-I.; Kagawa, R.; Enoki, K.; Yoshida, M.; Maeda, Y.; Nokubi, T. Association of masticatory performance with age, gender, number of teeth, occlusal force and salivary flow in Japanese older adults: Is ageing a risk factor for masticatory dysfunction? Arch. Oral Biol. 2011, 56, 991–996. [Google Scholar] [CrossRef]
- Kim, H.E.; Lee, H. Factors affecting subjective and objective masticatory function in older adults: Importance of an integrated approach. J. Dent. 2021, 113, 103787. [Google Scholar] [CrossRef]
- Takahashi, M.; Satoh, Y. Effects of gum chewing training on oral function in normal adults: Part 1 investigation of perioral muscle pressure. J. Dent. Sci. 2019, 14, 38–46. [Google Scholar] [CrossRef]
- Özsürekci, C.; Kara, M.; Güngör, A.E.; Ayçiçek, G.Ş.; Çalışkan, H.; Doğu, B.B.; Cankurtaran, M.; Halil, M.G. Relationship between chewing ability and malnutrition, sarcopenia, and frailty in older adults. Nutr. Clin. Pract. 2022, 37, 1409–1417. [Google Scholar] [CrossRef]
- Bawadi, H.A.; Khader, Y.S.; Haroun, T.F.; Al-Omari, M.; Tayyem, R.F. The association between periodontal disease, physical activity and healthy diet among adults in Jordan. J. Periodont. Res. 2011, 46, 74–81. [Google Scholar] [CrossRef] [PubMed]
- Shiraishi, A.; Yoshimura, Y.; Wakabayashi, H.; Tsuji, Y. Prevalence of stroke-related sarcopenia and its association with poor oral status in post-acute stroke patients: Implications for oral sarcopenia. Clin. Nutr. 2018, 37, 204–207. [Google Scholar] [CrossRef]
- Azzolino, D.; Passarelli, P.C.; De Angelis, P.; Piccirillo, G.B.; D’addona, A.; Cesari, M. Poor oral health as a determinant of malnutrition and sarcopenia. Nutrients 2019, 11, 2898. [Google Scholar] [CrossRef] [PubMed] [Green Version]
- Lee, D.-W.; Yoo, J.-I. Association between masticatory function and sarcopenia in elderly people: A systematic review and meta-analysis. Int. J. Gerontol. 2020, 14, 238–244. [Google Scholar]
- Santilli, V.; Bernetti, A.; Mangone, M.; Paoloni, M. Clinical definition of sarcopenia. Clin. Cases Miner. Bone Metab. 2014, 11, 177–180. [Google Scholar] [CrossRef]
- Beckwée, D.; Delaere, A.; Aelbrecht, S.; Baert, V.; Beaudart, C.; Bruyere, O.; Saint-Hubert, M.d.; Bautmans, I. Exercise interventions for the prevention and treatment of sarcopenia. A systematic umbrella review. J. Nutr. Health Aging 2019, 23, 494–502. [Google Scholar] [CrossRef]
- Murakami, M.; Hirano, H.; Watanabe, Y.; Sakai, K.; Kim, H.; Katakura, A. Relationship between chewing ability and sarcopenia in J apanese community-dwelling older adults. Geriatr. Gerontol. Int. 2015, 15, 1007–1012. [Google Scholar] [CrossRef] [PubMed] [Green Version]
- Von Elm, E.; Altman, D.G.; Egger, M.; Pocock, S.J.; Gøtzsche, P.C.; Vandenbroucke, J.P.; STROBE Initiative. The Strengthening the Reporting of Observational Studies in Epidemiology (STROBE) statement: Guidelines for reporting observational studies. PLoS Med. 2007, 4, e296. [Google Scholar] [CrossRef]
- Kim, H.E. Influential factors of masticatory performance in older adults: A cross-sectional study. Int. J. Environ. Res. Public Health 2021, 18, 4286. [Google Scholar] [CrossRef]
- World Health Organization IOTF. The Asian-Pacific Perspective: Redefining Obesity and Its Treatment; WHO Western Pacific Region: Geneva, Switzerland, 2000; Available online: https://apps.who.int/iris/bitstream/handle/10665/206936/0957708211_eng.pdf (accessed on 8 November 2022).
- Chen, L.K.; Woo, J.; Assantachai, P.; Auyeung, T.W.; Chou, M.Y.; Iijima, K.; Jang, H.C.; Kang, L.; Kim, M.; Kim, S.; et al. Asian Working Group for Sarcopenia: 2019 consensus update on sarcopenia diagnosis and treatment. J. Am. Med. Dir. Assoc. 2020, 21, 300–307.e2. [Google Scholar] [CrossRef]
- Ueno, M.; Yanagisawa, T.; Shinada, K.; Ohara, S.; Kawaguchi, Y. Masticatory ability and functional tooth units in Japanese adults. J. Oral Rehabil. 2008, 35, 337–344. [Google Scholar] [CrossRef]
- Hwang, H.Y.; Choi, J.S.; Kim, H.E. Masticatory efficiency contributing to the improved dynamic postural balance: A cross-sectional study. Gerodontology 2018, 35, 254–259. [Google Scholar] [CrossRef] [PubMed]
- Jeong, S.H.; Kang, S.M.; Ryu, J.H.; Kwon, H.K.; Kim, B.I. Subjective food intake ability in relation to the Mixing Ability Index in Korean adults. J. Oral Rehabil. 2010, 37, 242–247. [Google Scholar] [CrossRef] [PubMed]
- Jung, H.J.; Min, Y.G.; Kim, H.J.; Lee, J.Y.; Lee, E.S.; Kim, B.I.; Ahn, H.J. Factors affecting objective and subjective masticatory ability assessment of Korean elderly people. J. Korean Acad. Oral Health 2018, 42, 216–223. [Google Scholar] [CrossRef]
- Yoshida, M.; Tsuga, K. Sarcopenia and mastication. Curr. Oral Health Rep. 2020, 7, 179–187. [Google Scholar] [CrossRef]
- Tanaka, T.; Takahashi, K.; Hirano, H.; Kikutani, T.; Watanabe, Y.; Ohara, Y.; Furuya, H.; Tetsuo, T.; Akishita, M.; Iijima, K. Oral frailty as a risk factor for physical frailty and mortality in community-dwelling elderly. J. Gerontol. A Biol. Sci. Med. Sci. 2018, 73, 1661–1667. [Google Scholar] [CrossRef] [Green Version]
- Amrhein, V.; Greenland, S.; McShane, B. Scientists Rise up against Statistical Significance; Nature Publishing Group: Berlin, Germany, 2019; pp. 305–307. [Google Scholar]
- Ioannidis, J.P.A. The importance of predefined rules and prespecified statistical analyses: Do not abandon significance. JAMA 2019, 321, 2067–2068. [Google Scholar] [CrossRef] [PubMed]
- Yamaguchi, K.; Tohara, H.; Hara, K.; Nakane, A.; Kajisa, E.; Yoshimi, K.; Minakuchi, S. Relationship of aging, skeletal muscle mass, and tooth loss with masseter muscle thickness. BMC Geriatr. 2018, 18, 67. [Google Scholar] [CrossRef] [PubMed]


| Variables | Total | Men | Women | p-Values † |
|---|---|---|---|---|
| (N = 84) | (N = 38) | (N = 46) | ||
| Age (years) | 71.40 ± 5.15 | 72.95 ± 5.62 | 70.13 ± 4.40 | 0.014 |
| 65–69 | 38 (45.2) | 14 (36.8) | 24 (52.2) | 0.247 |
| 70–74 | 22 (26.2) | 9 (23.7) | 13 (28.3) | |
| 75–79 | 15 (17.9) | 9 (23.7) | 6 (13.0) | |
| 80–85 | 9 (10.7) | 6 (15.8) | 3 (6.5) | |
| Height (cm) | 161.65 ± 8.81 | 169.29 ± 4.98 | 155.35 ± 5.75 | <0.001 |
| Weight (kg) | 63.78 ± 10.34 | 71.05 ± 8.67 | 57.77 ± 7.34 | <0.001 |
| Body mass index (kg/m2) | 24.34 ± 2.88 | 24.79 ± 2.80 | 23.96 ± 2.92 | 0.194 |
| Normal | 47 (56.0) | 19 (50.0) | 28 (60.9) | 0.437 |
| Obesity | 37 (44.0) | 19 (50.0) | 18 (39.1) | |
| Smoking | ||||
| Yes | 4 (4.8) | 4 (10.5) | 0 (0.0) | 0.082 |
| No | 80 (95.2) | 34 (89.5) | 46 (100.0) | |
| Number of drinks (per week) | ||||
| 0 | 61 (72.6) | 18 (47.4) | 43 (93.5) | <0.001 |
| 1–2 | 16 (19.0) | 13 (34.2) | 3 (6.5) | |
| 3–4 | 7 (8.3) | 7 (18.4) | 0 (0.0) | |
| Strength training | ||||
| Yes | 6 (7.1) | 4 (10.5) | 2 (4.3) | 0.504 |
| No | 78 (92.9) | 34 (89.5) | 44 (95.7) | |
| Hypertension | ||||
| Yes | 32 (38.1) | 14 (36.8) | 18 (39.1) | 1.000 |
| No | 52 (61.9) | 24 (63.2) | 28 (60.9) | |
| Diabetes | ||||
| Yes | 18 (21.4) | 7 (18.4) | 11 (23.9) | 0.731 |
| No | 66 (78.6) | 31 (81.6) | 31 (76.1) | |
| Dyslipidemia | ||||
| Yes | 7 (8.3) | 1 (2.6) | 6 (13.0) | 0.186 |
| No | 77 (91.7) | 37 (97.4) | 40 (87.0) | |
| Osteoporosis | ||||
| Yes | 3 (3.6) | 0 (0.0) | 3 (6.5) | 0.311 |
| No | 81 (96.4) | 38 (100.0) | 43 (93.5) | |
| Appendicular skeletal muscle mass (kg) | 18.59 ± 4.54 | 22.59 ± 2.39 | 15.28 ± 2.94 | <0.001 |
| Skeletal muscle mass index (kg/m2) | 7.02 ± 1.21 | 7.88 ± 0.76 | 6.31 ± 1.04 | <0.001 |
| Normal | 66 (78.6) | 34 (89.5) | 32 (69.6) | 0.052 |
| Abnormal | 18 (21.4) | 4 (10.5) | 14 (30.4) | |
| Stimulated saliva secretion rate (mL/min) | 2.00 (1.40–2.40) | 2.20 (2.00–3.00) | 1.60 (1.00–2.00) | <0.001 |
| Functional tooth units | 10.00 (9.00–10.00) | 10.00 (9.00–10.00) | 9.50 (8.00–10.00) | 0.174 |
| Mixing ability index | 68.08 (51.78–75.87) | 70.72 (64.51–77.15) | 63.93 (41.30–74.18) | 0.023 |
| Variables | N | Mixing Ability Index | p-Values † |
|---|---|---|---|
| Sex | |||
| Male | 38 | 70.72 (64.51–77.15) | 0.023 |
| Female | 46 | 63.93 (41.30–74.18) | |
| Age (years) | |||
| 65–69 | 38 | 65.52 (51.24–74.51) | 0.865 |
| 70–74 | 22 | 68.38 (59.10–81.80) | |
| 75–79 | 15 | 70.35 (47.86–75.89) | |
| 80–85 | 9 | 73.42 (65.53–74.08) | |
| Body mass index (kg/m2) | |||
| Normal | 47 | 67.75 (53.44–75.52) | 0.838 |
| Obesity | 37 | 68.41 (49.29–74.68) | |
| Smoking | |||
| Yes | 4 | 69.36 (68.89–84.62) | 0.322 |
| No | 80 | 67.43 (51.47–75.47) | |
| Number of drinks (per week) | |||
| 0 | 61 | 67.38 (45.59–74.68) | 0.269 |
| 1–2 | 16 | 72.60 (64.78–76.43) | |
| 3–4 | 7 | 69.36 (66.61–77.67) | |
| Exercise | |||
| Yes | 6 | 74.08 (29.88–74.68) | 0.976 |
| No | 78 | 67.62 (52.00–76.26) | |
| Hypertension | |||
| Yes | 32 | 69.86 (53.21–75.47) | 0.951 |
| No | 52 | 67.43 (51.47–75.52) | |
| Diabetes | |||
| Yes | 18 | 63.42 (40.61–72.07) | 0.059 |
| No | 66 | 69.36 (54.41–76.53) | |
| Dyslipidemia | |||
| Yes | 7 | 49.29 (45.30–64.61) | 0.156 |
| No | 77 | 69.00 (54.41–76.26) | |
| Osteoporosis | |||
| Yes | 3 | 61.57 (56.64–72.48) | 0.910 |
| No | 81 | 68.41 (52.00–74.68) |
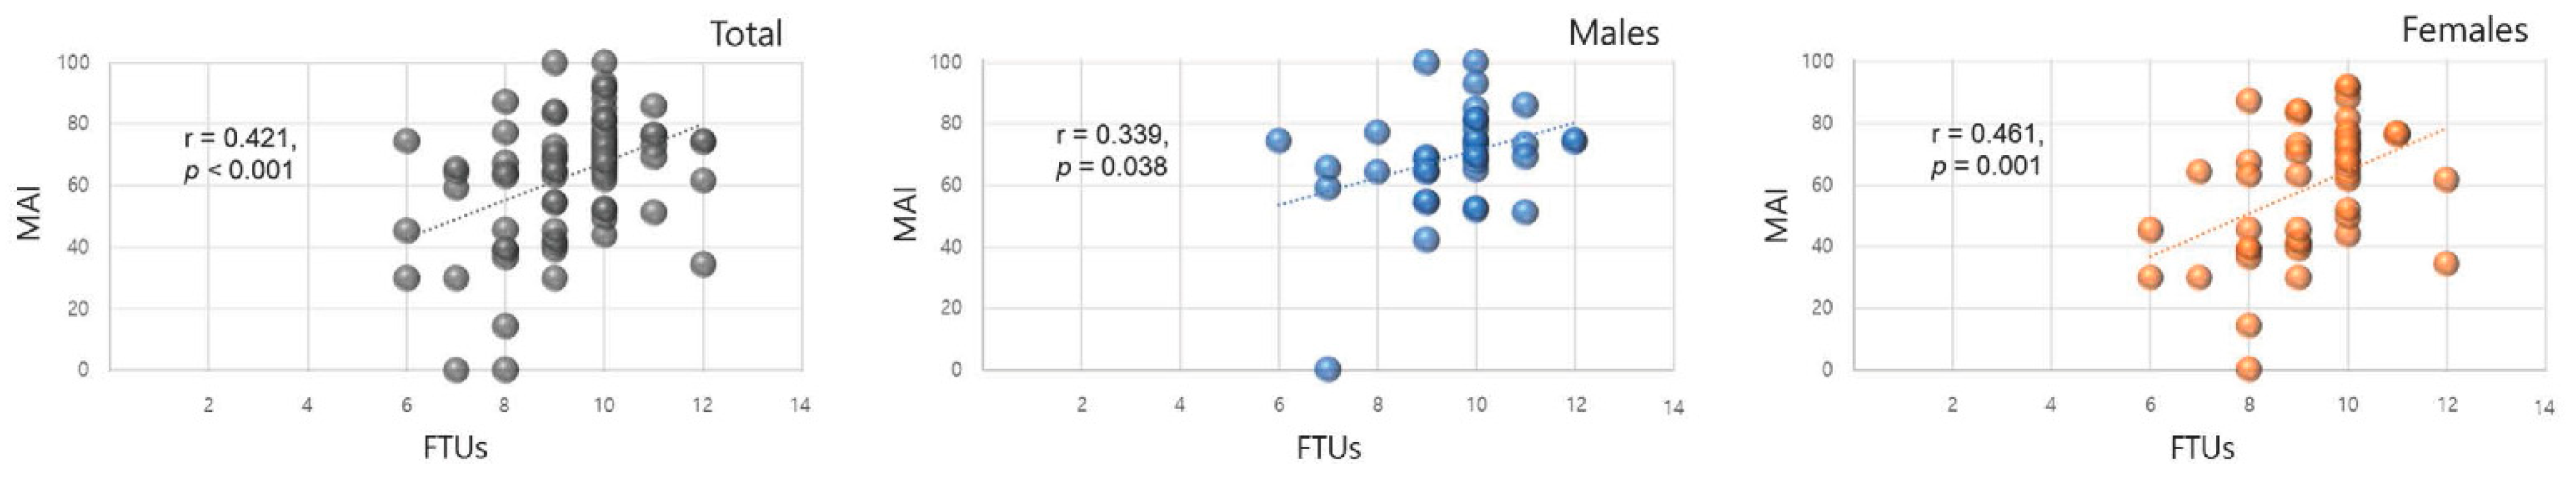
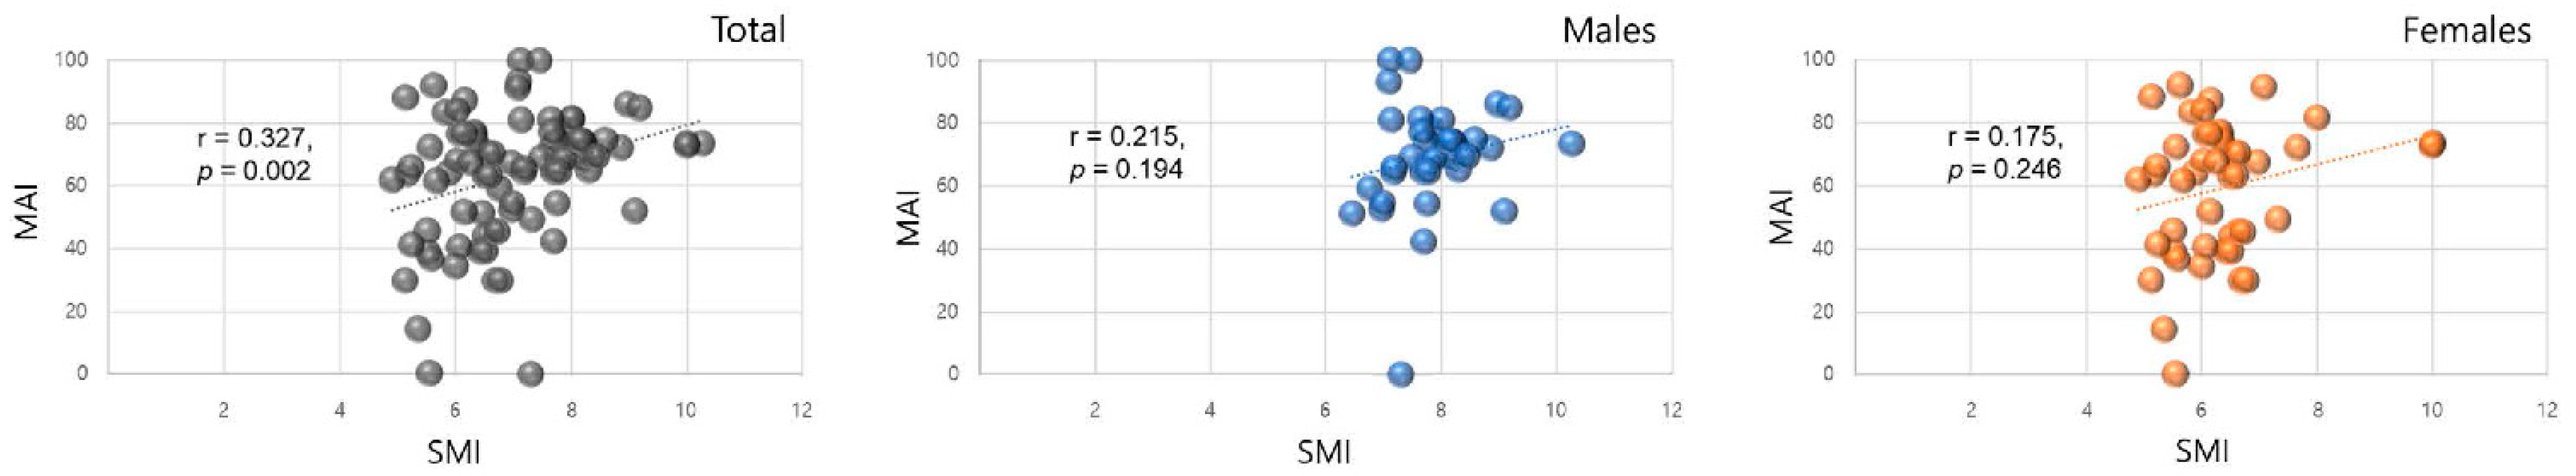
| Variables | r | p-Values † |
|---|---|---|
| Functional tooth units | 0.421 | <0.001 |
| Skeletal muscle mass index (kg/m2) | 0.327 | 0.002 |
| Stimulated saliva secretion rate (mL/min) | 0.108 | 0.327 |
| Body mass index (kg/m2) | 0.037 | 0.739 |
| Predictor Variables | Model 1 | Model 2 | Model 3 | ||||||||
|---|---|---|---|---|---|---|---|---|---|---|---|
| Unstandardized B | 95% CI for B | p-Values | Unstandardized B | Standardized β | 95% CI for B | p-Values | Unstandardized B | Standardized β | 95% CI for B | p-Values | |
| FTUs | 6.189 | 3.142–9.237 | <0.001 | 5.388 | 0.355 | 2.355–8.421 | 0.001 | 5.405 | 0.356 | 2.360–8.450 | 0.001 |
| SMI | 4.016 | 0.244 | 0.728–7.304 | 0.017 | 3.123 | 0.190 | −1.189–7.436 | 0.153 | |||
| Sex | 3.308 | 0.083 | −6.977–13.593 | 0.524 | |||||||
| Predictor Variables | Men | Women | ||||||||||||
|---|---|---|---|---|---|---|---|---|---|---|---|---|---|---|
| Model 1 | Model 2 | Model 1 | Model 2 | |||||||||||
| Unstandardized B | 95% CI for B | p-Values | Unstandardized B | Standardized β | 95% CI for B | p-Values | Unstandardized B | 95% CI for B | p-Values | Unstandardized B | Standardized β | 95% CI for B | p-Values | |
| FTUs | 4.442 | 0.290–8.594 | 0.037 | 4.083 | 0.313 | −0.436–8.601 | 0.075 | 6.898 | 2.473–11.324 | 0.003 | 6.685 | 0.415 | 2.303–11.067 | 0.004 |
| SMI | 1.686 | 0.075 | −6.098–9.470 | 0.663 | 4.005 | 0.197 | −1.514–9.525 | 0.151 | ||||||
Publisher’s Note: MDPI stays neutral with regard to jurisdictional claims in published maps and institutional affiliations. |
© 2022 by the authors. Licensee MDPI, Basel, Switzerland. This article is an open access article distributed under the terms and conditions of the Creative Commons Attribution (CC BY) license (https://creativecommons.org/licenses/by/4.0/).
Share and Cite
Kim, H.-E.; Wallace, J.; Sohn, W. Factors Affecting Masticatory Performance of Older Adults Are Sex-Dependent: A Cross-Sectional Study. Int. J. Environ. Res. Public Health 2022, 19, 15742. https://doi.org/10.3390/ijerph192315742
Kim H-E, Wallace J, Sohn W. Factors Affecting Masticatory Performance of Older Adults Are Sex-Dependent: A Cross-Sectional Study. International Journal of Environmental Research and Public Health. 2022; 19(23):15742. https://doi.org/10.3390/ijerph192315742
Chicago/Turabian StyleKim, Hee-Eun, Janet Wallace, and Woosung Sohn. 2022. "Factors Affecting Masticatory Performance of Older Adults Are Sex-Dependent: A Cross-Sectional Study" International Journal of Environmental Research and Public Health 19, no. 23: 15742. https://doi.org/10.3390/ijerph192315742