
Impact on Prevalence of the Application of NAFLD/MAFLD Criteria in Overweight and Normal Weight Patients
 , , and
Abstract
:1. Introduction
2. Materials and Methods
2.1. Patient Population
2.2. Liver Steatosis Assessment
2.3. NAFLD and MAFLD Definitions
2.4. Statistical Analysis
3. Results
4. Discussion
5. Conclusions
Author Contributions
Funding
Institutional Review Board Statement
Informed Consent Statement
Acknowledgments
Conflicts of Interest
References
- Marchesini, G.; Day, C.P.; Dufour, J.F.; Canbay, A.; Nobili, V.; Ratziu, V.; Tilg, H.; Roden, M.; Gastaldelli, A.; Yki-Jarvinen, H.; et al. EASL-EASD-EASO Clinical Practice Guidelines for the Management of Non-Alcoholic Fatty Liver Disease. J. Hepatol. 2016, 64, 1388–1402. [Google Scholar] [CrossRef] [PubMed]
- Kaufmann, B.; Reca, A.; Wang, B.; Friess, H.; Feldstein, A.E.; Hartmann, D. Mechanisms of Nonalcoholic Fatty Liver Disease and Implications for Surgery. Langenbeck’s Arch. Surg. 2021, 406, 1–17. [Google Scholar] [CrossRef] [PubMed]
- Watt, M.J.; Miotto, P.M.; De Nardo, W.; Montgomery, M.K. The Liver as an Endocrine Organ—Linking NAFLD and Insulin Resistance. Endocr. Rev. 2019, 40, 1367–1393. [Google Scholar] [CrossRef]
- Chen, J.; Vitetta, L. Gut Microbiota Metabolites in NAFLD Pathogenesis and Therapeutic Implications. Int. J. Mol. Sci. 2020, 21, 5214. [Google Scholar] [CrossRef] [PubMed]
- Lau, L.H.S.; Wong, S.H. Microbiota, Obesity and NAFLD. Adv. Exp. Med. Biol. 2018, 1061, 111–125. [Google Scholar]
- Aron-Wisnewsky, J.; Clément, K. The Gut Microbiome, Diet, and Links to Cardiometabolic and Chronic Disorders. Nat. Rev. Nephrol. 2015, 123, 169–181. [Google Scholar] [CrossRef]
- Kuchay, M.S.; Choudhary, N.S.; Mishra, S.K. Pathophysiological Mechanisms Underlying MAFLD. Diabetes Metab. Syndr. Clin. Res. Rev. 2020, 14, 1875–1887. [Google Scholar] [CrossRef]
- Ganguli, S.; DeLeeuw, P.; Satapathy, S.K. A Review Of Current And Upcoming Treatment Modalities In Non-Alcoholic Fatty Liver Disease And Non-Alcoholic Steatohepatitis. Hepat. Med. 2019, 11, 159–178. [Google Scholar] [CrossRef]
- Anania, C.; Massimo Perla, F.; Olivero, F.; Pacifico, L.; Chiesa, C. Mediterranean Diet and Nonalcoholic Fatty Liver Disease. World J. Gastroenterol. 2018, 24, 2083–2094. [Google Scholar] [CrossRef]
- Torres, M.C.P.; Aghemo, A.; Lleo, A.; Bodini, G.; Furnari, M.; Marabotto, E.; Miele, L.; Giannini, E.G. Mediterranean Diet and NAFLD: What We Know and Questions That Still Need to Be Answered. Nutrients 2019, 11, 2971. [Google Scholar] [CrossRef]
- Eslam, M.; Newsome, P.N.; Sarin, S.K.; Anstee, Q.M.; Targher, G.; Romero-Gomez, M.; Zelber-Sagi, S.; Wai-Sun Wong, V.; Dufour, J.F.; Schattenberg, J.M.; et al. A New Definition for Metabolic Dysfunction-Associated Fatty Liver Disease: An International Expert Consensus Statement. J. Hepatol. 2020, 73, 202–209. [Google Scholar] [CrossRef]
- Wong, V.W.S.; Lazarus, J.V. Prognosis of MAFLD vs. NAFLD and Implications for a Nomenclature Change. J. Hepatol. 2021, 75, 1267–1270. [Google Scholar] [CrossRef] [PubMed]
- Alam, S.; Eslam, M.; SKM Hasan, N.; Anam, K.; Chowdhury, M.A.B.; Khan, M.A.S.; Hasan, M.J.; Mohamed, R. Risk Factors of Nonalcoholic Fatty Liver Disease in Lean Body Mass Population: A Systematic Review and Meta-Analysis. J. Gastroenterol. Hepatol. 2021, 5, 1236–1249. [Google Scholar] [CrossRef] [PubMed]
- Chen, F.; Esmaili, S.; Rogers, G.B.; Bugianesi, E.; Petta, S.; Marchesini, G.; Bayoumi, A.; Metwally, M.; Azardaryany, M.K.; Coulter, S.; et al. Lean NAFLD: A Distinct Entity Shaped by Differential Metabolic Adaptation. Hepatology 2020, 71, 1213–1227. [Google Scholar] [CrossRef] [PubMed]
- Ye, Q.; Zou, B.; Yeo, Y.H.; Li, J.; Huang, D.Q.; Wu, Y.; Yang, H.; Liu, C.; Kam, L.Y.; Tan, X.X.E.; et al. Global Prevalence, Incidence, and Outcomes of Non-Obese or Lean Non-Alcoholic Fatty Liver Disease: A Systematic Review and Meta-Analysis. Lancet Gastroenterol. Hepatol. 2020, 5, 739–752. [Google Scholar] [CrossRef]
- Wong, V.W.S.; Wong, G.L.H.; Woo, J.; Abrigo, J.M.; Chan, C.K.M.; Shu, S.S.T.; Leung, J.K.Y.; Chim, A.M.L.; Kong, A.P.S.; Lui, G.C.Y.; et al. Impact of the New Definition of Metabolic Associated Fatty Liver Disease on the Epidemiology of the Disease. Clin. Gastroenterol. Hepatol. 2021, 19, 2161–2171. [Google Scholar] [CrossRef]
- Sirli, R.; Sporea, I. Controlled Attenuation Parameter for Quantification of Steatosis: Which Cut-Offs to Use? Can. J. Gastroenterol. Hepatol. 2021, 2021, 6662760. [Google Scholar] [CrossRef]
- Chinchilla-López, P.; Ramírez-Pérez, O.; Cruz-Ramón, V.; Canizales-Quinteros, S.; Domínguez-López, A.; Ponciano-Rodríguez, G.; Sánchez-Muñoz, F.; Méndez-Sánchez, N. More Evidence for the Genetic Susceptibility of Mexican Population to Nonalcoholic Fatty Liver Disease through PNPLA3. Ann. Hepatol. 2018, 17, 250–255. [Google Scholar] [CrossRef]
- Lin, S.; Huang, J.; Wang, M.; Kumar, R.; Liu, Y.; Liu, S.; Wu, Y.; Wang, X.; Zhu, Y. Comparison of MAFLD and NAFLD Diagnostic Criteria in Real World. Liver Int. 2020, 40, 2082–2089. [Google Scholar] [CrossRef]
- Lu, F.B.; Zheng, K.I.; Rios, R.S.; Targher, G.; Byrne, C.D.; Zheng, M.H. Global Epidemiology of Lean Non-Alcoholic Fatty Liver Disease: A Systematic Review and Meta-Analysis. J. Gastroenterol. Hepatol. 2020, 35, 2041–2050. [Google Scholar] [CrossRef]
- Kim, D.; Konyn, P.; Sandhu, K.K.; Dennis, B.B.; Cheung, A.C.; Ahmed, A. Metabolic Dysfunction-Associated Fatty Liver Disease Is Associated with Increased All-Cause Mortality in the United States. J. Hepatol. 2021, 75, 1284–1291. [Google Scholar] [CrossRef] [PubMed]
- Cheng, Y.M.; Kao, J.H.; Wang, C.C. The Metabolic Profiles and Body Composition of Lean Metabolic Associated Fatty Liver Disease. Hepatol. Int. 2021, 15, 405–412. [Google Scholar] [CrossRef] [PubMed]
- Fouad, Y.; Elwakil, R.; Elsahhar, M.; Said, E.; Bazeed, S.; Ali Gomaa, A.; Hashim, A.; Kamal, E.; Mehrez, M.; Attia, D. The NAFLD-MAFLD Debate: Eminence vs. Evidence. Liver Int. 2021, 41, 255–260. [Google Scholar] [CrossRef] [PubMed]


| Characteristic | % (n)/μ ± SD |
|---|---|
| Male | 59.4 (2287) |
| Age (years) | 50±11 |
| DM | 6.2 (240) |
| HBP | 13.5 (521) |
| BMI (kg/m2) | 26.4 ± 4.0 |
| BMI ≥ 25 kg/m2 | 61.1 (2351) |
| Glucose (g/dL) | 94.7 ± 22.4 |
| HbA1c (%) | 5.4 ± 0.7 |
| SBP (mmHg) | 112.4 ± 11.15.2 |
| DBP (mmHg) | 73.4 ± 9.4 |
| Triglycerides (mg/dL) | 133.1 ± 85.3 |
| HDL (mg/dL) | 49.2 ± 16.4 |
| CRP (mg/L) | 2.6 ± 7.5 |
| WC (cm) | 92.3 ± 11.6 |
| CAP (dB/m) | 258 ± 56.5 |
| Steatosis by CAP > 263 db/m | 46 (1769) |
| S1 | 12.4 (478) |
| S2 | 7.3 (279) |
| S3 | 25.5 (982) |
| kPa | 4.2 ± 1.5 |
| Significant Fibrosis 7–10 kPa | 0.9 (33) |
| Advanced fibrosis > 10 kPa | 0.6 (23) |
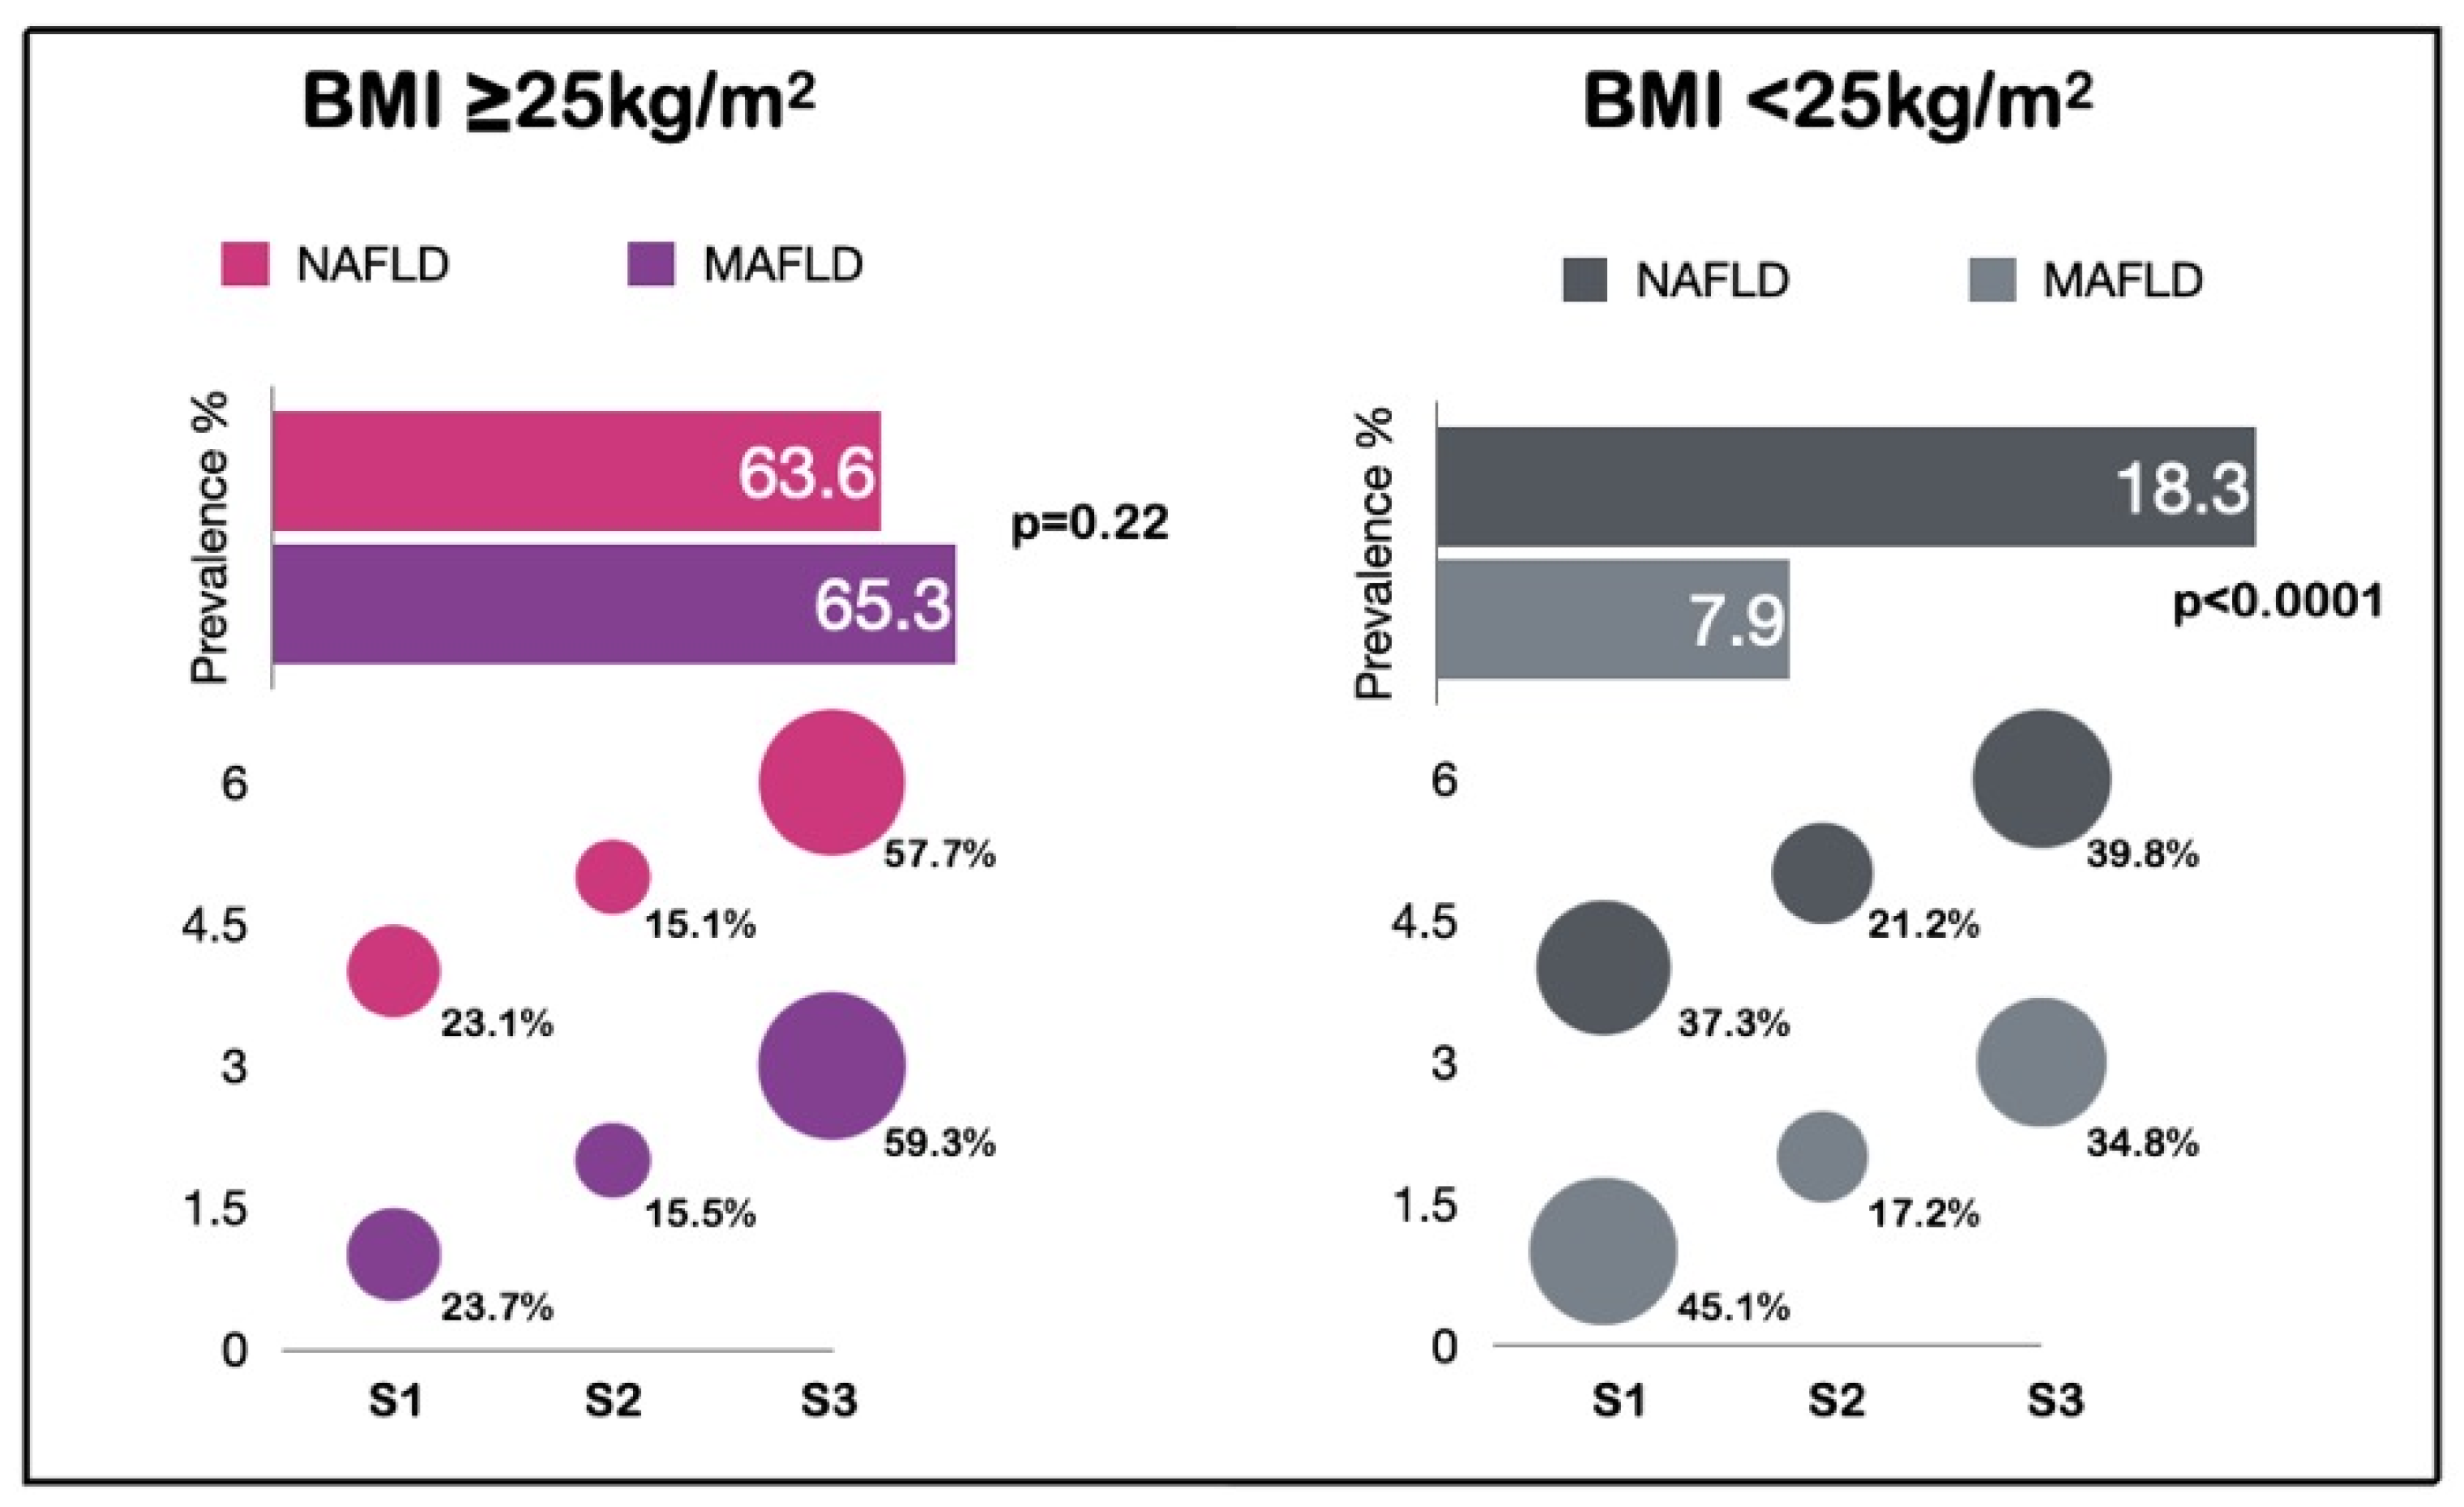
| Characteristic | NAFLD (n = 1495) % (n)/μ ± SD | MAFLD (n = 1536) % (n)/μ ± SD | p | Effect Size (Cohen’s d/w) | |
|---|---|---|---|---|---|
| Male | 71.6 (1071) | 71.4 (1097) | 0.90 | 0.28 | Small |
| Age (years) | 50.8 ± 13.1 | 51.1 ± 13.1 | 0.52 | −0.01 | Null |
| DM | 11.4 (170) | 13.7 (211) | 0.05 | 0.87 | Large |
| HBP | 20.7 (310) | 21.5 (330) | 0.62 | 0.78 | Medium |
| BMI (kg/m2) | 29.5 ± 3.5 | 29.5 ± 3.5 | 1.00 | −0.70 | Null |
| Glucose (g/dL) | 100.2 ± 25.8 | 100.7 ± 26.3 | 0.59 | −0.31 | Null |
| HbA1c (%) | 5.6 ± 0.9 | 5.6 ± 0.9 | 1.00 | −0.28 | Null |
| SBP (mmHg) | 117.3 ± 15.8 | 117.4 ± 15.8 | 0.86 | −0.27 | Null |
| DBP (mmHg) | 76.7 ± 9.3 | 76.6 ± 9.4 | 0.76 | −0.37 | Null |
| Triglycerides (mg/dL) | 165.8 ± 99 | 165.2 ± 98.4 | 0.86 | −0.37 | Null |
| HDL (mg/dL) | 44.3 ± 18 | 44.3 ± 17.9 | 1.00 | 0.22 | Small |
| CRP (mg/L) | 3.2 ± 5.9 | 3.3 ± 6.8 | 0.66 | −0.10 | Null |
| WC (cm) | 100.7 ± 9.7 | 100.6 ± 9.7 | 0.77 | −0.74 | Null |
| CAP (dB/m) | 311.7 ± 35.7 | 309.5 ± 38 | 0.10 | −2.44 | Null |
| S1 | 23.7 (355) | 23.1 (355) | 0.69 | 0.76 | Medium |
| S2 | 15.5 (232) | 15.1 (232) | 0.76 | 0.84 | Large |
| S3 | 59.3 (886) | 57.7 (886) | 0.39 | 0.41 | Small |
| kPa | 4.6 ± 1.9 | 4.6 ± 1.9 | 1.00 | −0.23 | Null |
| Significant fibrosis 7–10 kPa | 1.6 (24) | 1.6 (25) | 1.00 | 0.98 | Large |
| Advanced fibrosis >10 kPa | 1.3 (20) | 1.4 (22) | 0.87 | 0.98 | Large |
| Characteristic | Lean NAFLD (n= 273) % (n)/μ ± SD | Lean MAFLD (n = 118) % (n)/μ ± SD | p | Effect Size (Cohen’s d/w) | |
|---|---|---|---|---|---|
| Male | 56.8 (155) | 52.5 (62) | 0.44 | 0.92 | Large |
| Age (years) | 50.7 ± 9.9 | 52.7 ± 10.5 | 0.07 | −0.06 | Null |
| DM | 4.8 (13) | 10.2 (12) | 0.06 | 0.99 | Large |
| HBP | 10.3 (28) | 17.8 (21) | 0.04 | 0.98 | Large |
| BMI (kg/m2) | 23.4 ± 1.8 | 23.3 ± 2.4 | 0.65 | −0.69 | Null |
| Glucose (g/dL) | 94.2 ± 16.5 | 98.9 ± 22.2 | 0.02 | −0.40 | Null |
| HbA1c (%) | 5.4 ± 0.6 | 5.5 ± 0.7 | 0.15 | −0.39 | Null |
| SBP (mmHg) | 110.4 ± 14.1 | 114.3 ± 13.8 | 0.01 | −0.31 | Null |
| DBP (mmHg) | 72.4 ± 9.2 | 74.7 ± 9.6 | 0.02 | −0.36 | Null |
| Triglycerides (mg/dL) | 138.8 ± 81.1 | 184.2 ± 95.8 | <0.0001 | −0.37 | Null |
| HDL (mg/dL) | 48.1 ± 12.7 | 43.2 ± 12.6 | 0.0005 | 0.23 | Small |
| CRP | 2.8 ± 18.3 | 5.2 ± 27.7 | 0.31 | −0.14 | Null |
| WC (cm) | 87.7 ± 7.0 | 88.7 ± 7.9 | 0.21 | −0.75 | Null |
| CAP (dB/m) | 291.9 ± 26.5 | 296.3 ± 27.9 | 0.13 | −2.24 | Null |
| S1 | 45.1 (123) | 37.3 (44) | 0.18 | 0.94 | Large |
| S2 | 17.2 (47) | 21.2 (25) | 0.39 | 0.97 | Large |
| S3 | 34.8 (95) | 39.8 (47) | 0.36 | 0.95 | Large |
| kPa | 4.0 ± 0.8 | 4.1 ± 0.8 | 0.257 | −0.25 | Null |
| Glucose abnormalities | 26.4 (72) | 44.9 (53) | 0.004 | 0.95 | Large |
| HBP abnormalities | 17.2 (47) | 31.4 (37) | 0.003 | 0.97 | Large |
| Triglycerides >150 | 32.6 (89) | 62.7 (74) | 0.0001 | 0.94 | Large |
| HDL abnormalities | 35.5 (97) | 62.7 (74) | 0.0001 | 0.94 | Large |
| CRP > 2.0 | 23.8 (65) | 44.9 (53) | 0.0001 | 0.96 | Large |
| WC abnormalities | 10.3 (28) | 18.6 (22) | 0.03 | 0.98 | Large |
| Characteristic | Univariate | Multivariate | ||
|---|---|---|---|---|
| OR (CI 95%) | p | OR (CI 95%) | p | |
| Age > 54 years | 1.65 (1.24–2.20) | 0.001 | 1.42 (1.02–1.97) | 0.036 |
| BMI > 24 kg/m2 | 2.54 (1.92–3.36) | ≤0.0001 | 1.63 (1.19–2.24) | 0.002 |
| SBP > 117 mmHg | 1.70 (1.27–2.27) | ≤0.0001 | 1.04 (0.72–1.50) | 0.801 |
| DBP > 76 mmHg | 1.79 (1.34–2.38) | ≤0.0001 | 1.20 (0.84–1.71) | 0.307 |
| Fasting glucose > 94 mg/dL | 2.58 (1.94–3.42) | ≤0.0001 | 1.80 (1.30–2.48) | ≤0.0001 |
| Triglycerides > 124 mg/dL | 3.77 (2.86–4.97) | ≤0.0001 | 2.63 (1.94–3.58) | ≤0.0001 |
| HDL < 44 mg/dL | 2.57 (1.95–3.37) | ≤0.0001 | 1.52 (1.12–2.08) | 0.007 |
| CRP > 1.80 mg/dL | 1.28 (0.95–1.73) | 0.099 | 0.97 (0.70–1.34) | 0.869 |
| HbA1c > 5.5% | 1.53 (1.13–2.08) | 0.006 | 0.87 (0.61–1.25) | 0.476 |
| WC > 89 cm | 3.45 (2.59–4.58) | ≤0.0001 | 2.04 (1.47–2.83) | ≤0.0001 |
Publisher’s Note: MDPI stays neutral with regard to jurisdictional claims in published maps and institutional affiliations. |
© 2022 by the authors. Licensee MDPI, Basel, Switzerland. This article is an open access article distributed under the terms and conditions of the Creative Commons Attribution (CC BY) license (https://creativecommons.org/licenses/by/4.0/).
Share and Cite
Ordoñez-Vázquez, A.L.; Juárez-Hernández, E.; Zuarth-Vázquez, J.M.; Ramos-Ostos, M.H.; Uribe, M.; Castro-Narro, G.; López-Méndez, I. Impact on Prevalence of the Application of NAFLD/MAFLD Criteria in Overweight and Normal Weight Patients. Int. J. Environ. Res. Public Health 2022, 19, 12221. https://doi.org/10.3390/ijerph191912221
Ordoñez-Vázquez AL, Juárez-Hernández E, Zuarth-Vázquez JM, Ramos-Ostos MH, Uribe M, Castro-Narro G, López-Méndez I. Impact on Prevalence of the Application of NAFLD/MAFLD Criteria in Overweight and Normal Weight Patients. International Journal of Environmental Research and Public Health. 2022; 19(19):12221. https://doi.org/10.3390/ijerph191912221
Chicago/Turabian StyleOrdoñez-Vázquez, Ana Luisa, Eva Juárez-Hernández, Julia María Zuarth-Vázquez, Martha Helena Ramos-Ostos, Misael Uribe, Graciela Castro-Narro, and Iván López-Méndez. 2022. "Impact on Prevalence of the Application of NAFLD/MAFLD Criteria in Overweight and Normal Weight Patients" International Journal of Environmental Research and Public Health 19, no. 19: 12221. https://doi.org/10.3390/ijerph191912221