
Frailty Risk Prediction Model among Older Adults: A Chinese Nation-Wide Cross-Sectional Study


Abstract
:1. Introduction
2. Methods
2.1. Samples
2.2. Measures
2.3. Statistical Methods
3. Results
3.1. Basic Characteristics of the Sample
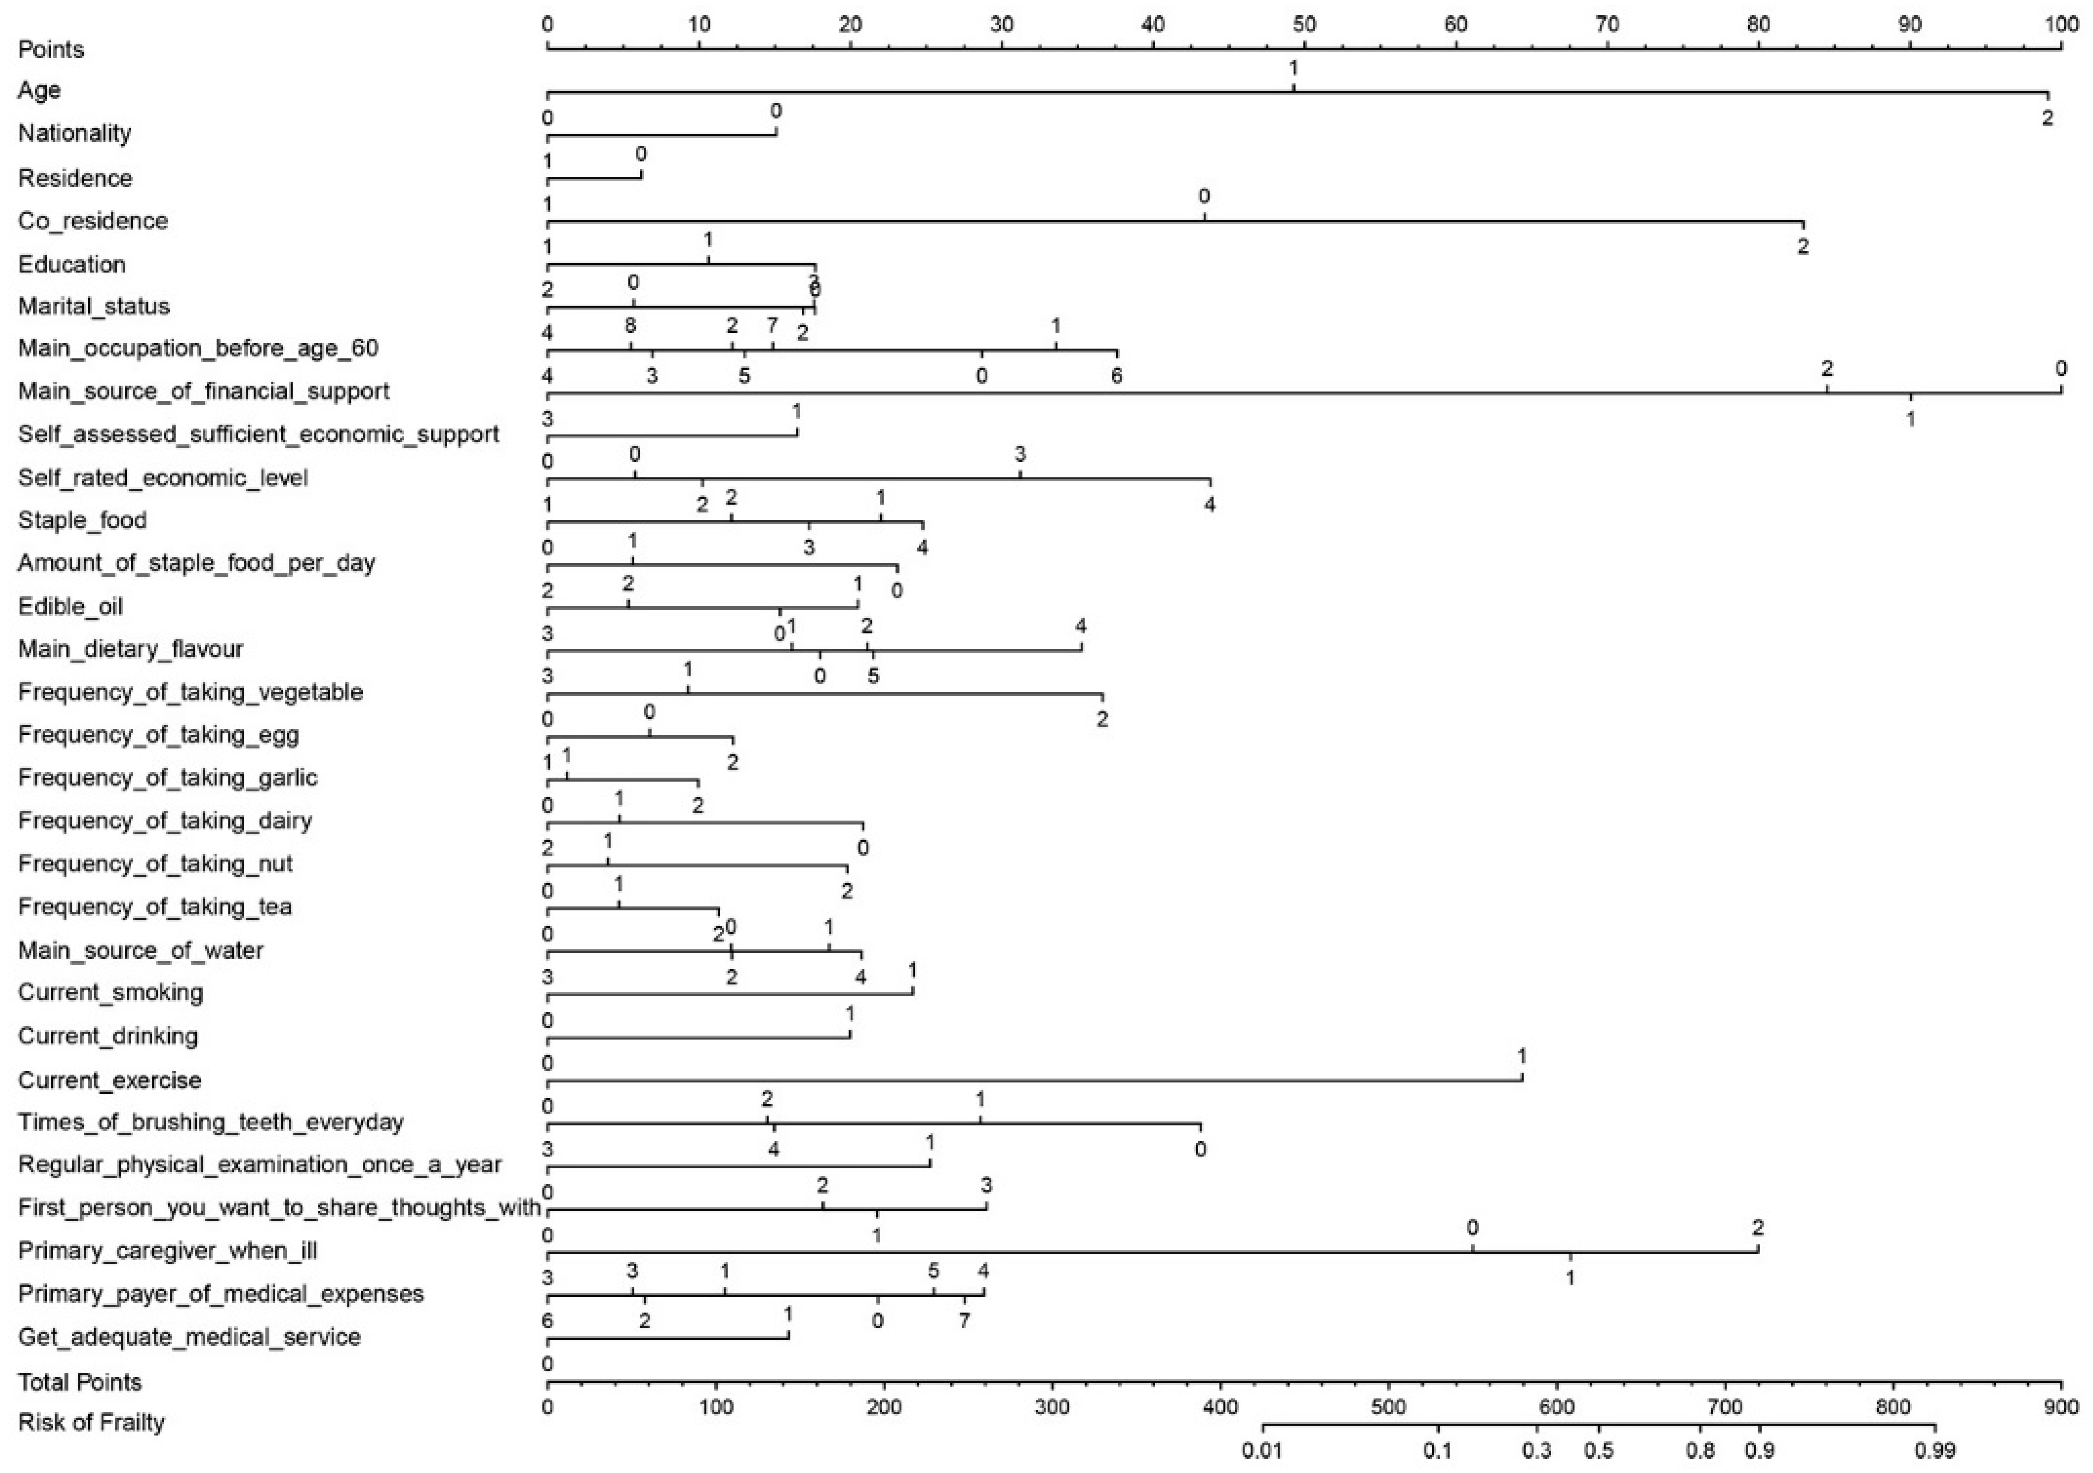
3.2. Establishment of the Frailty Risk Prediction Model
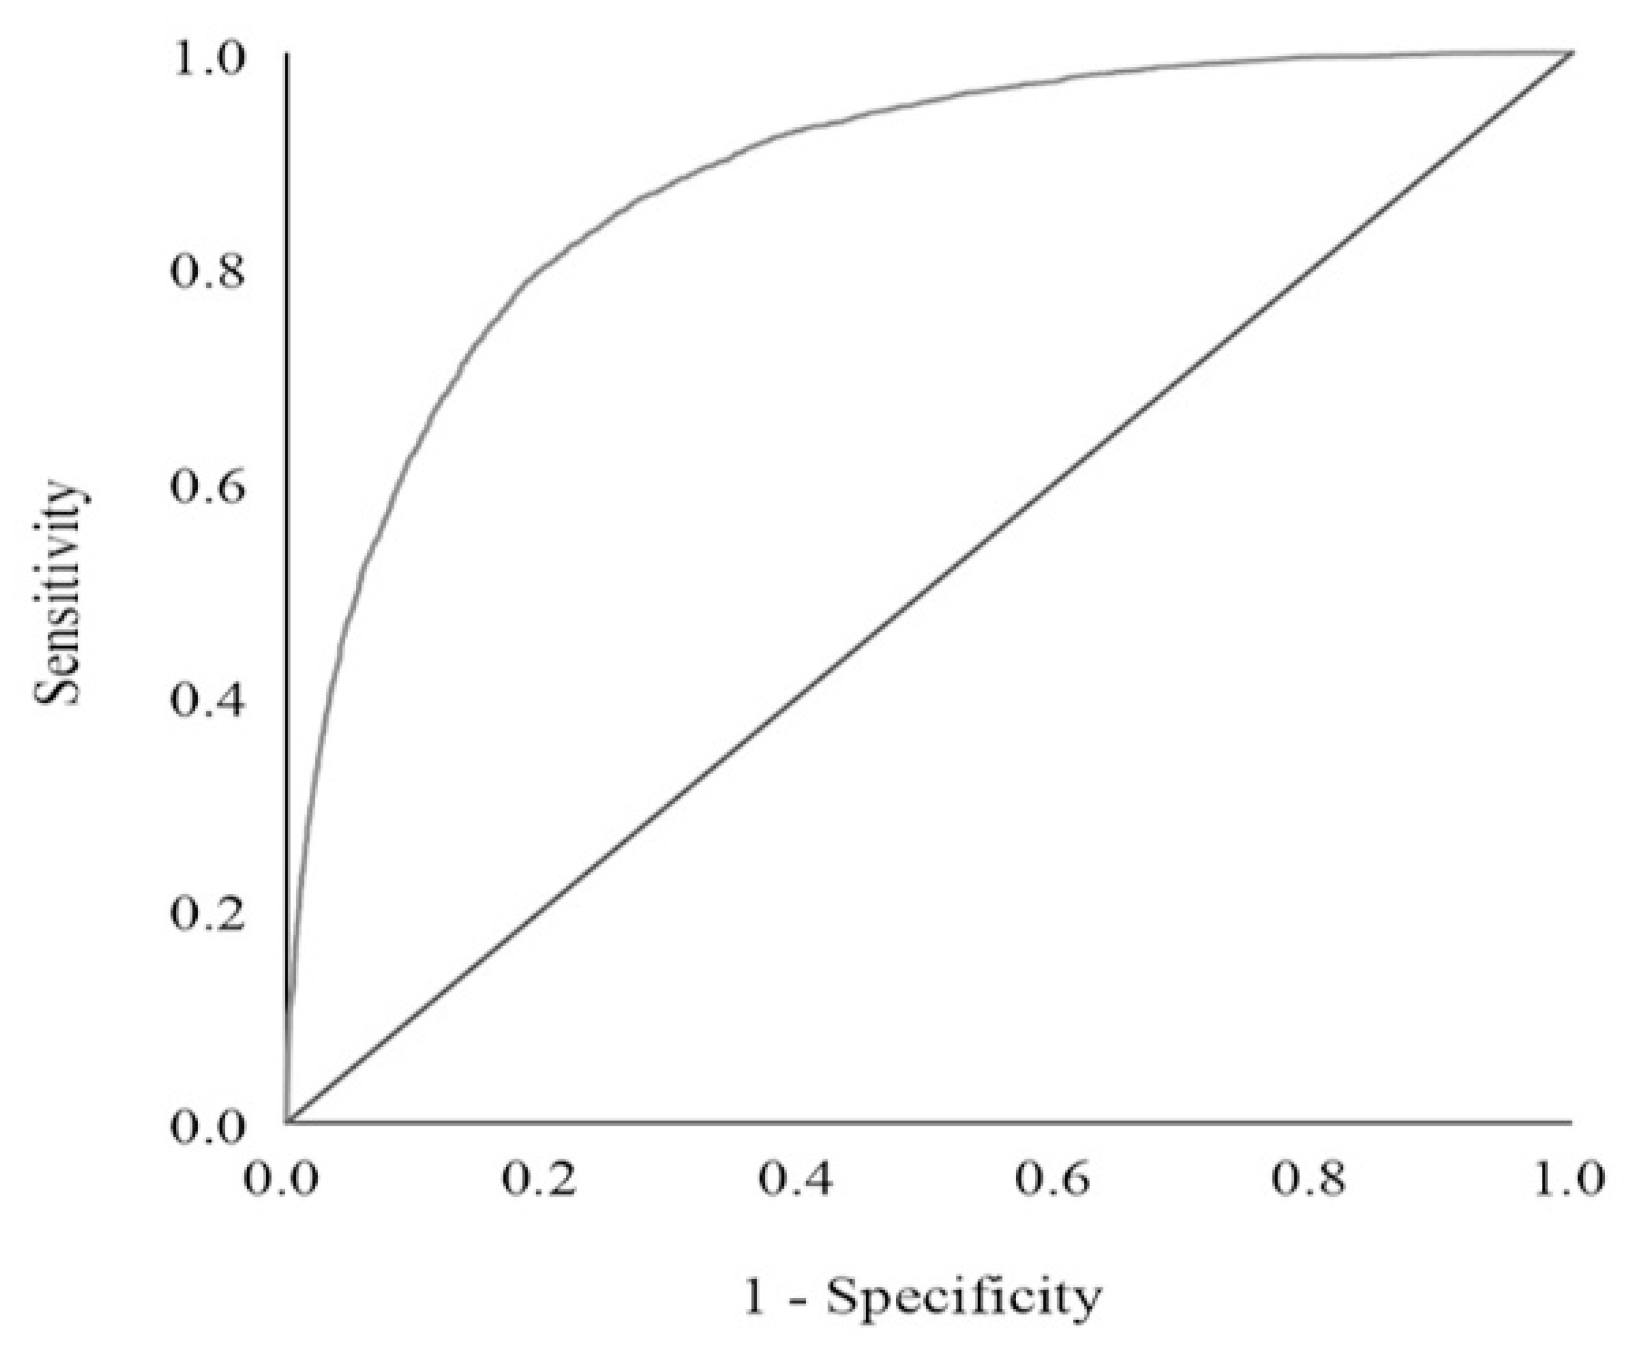
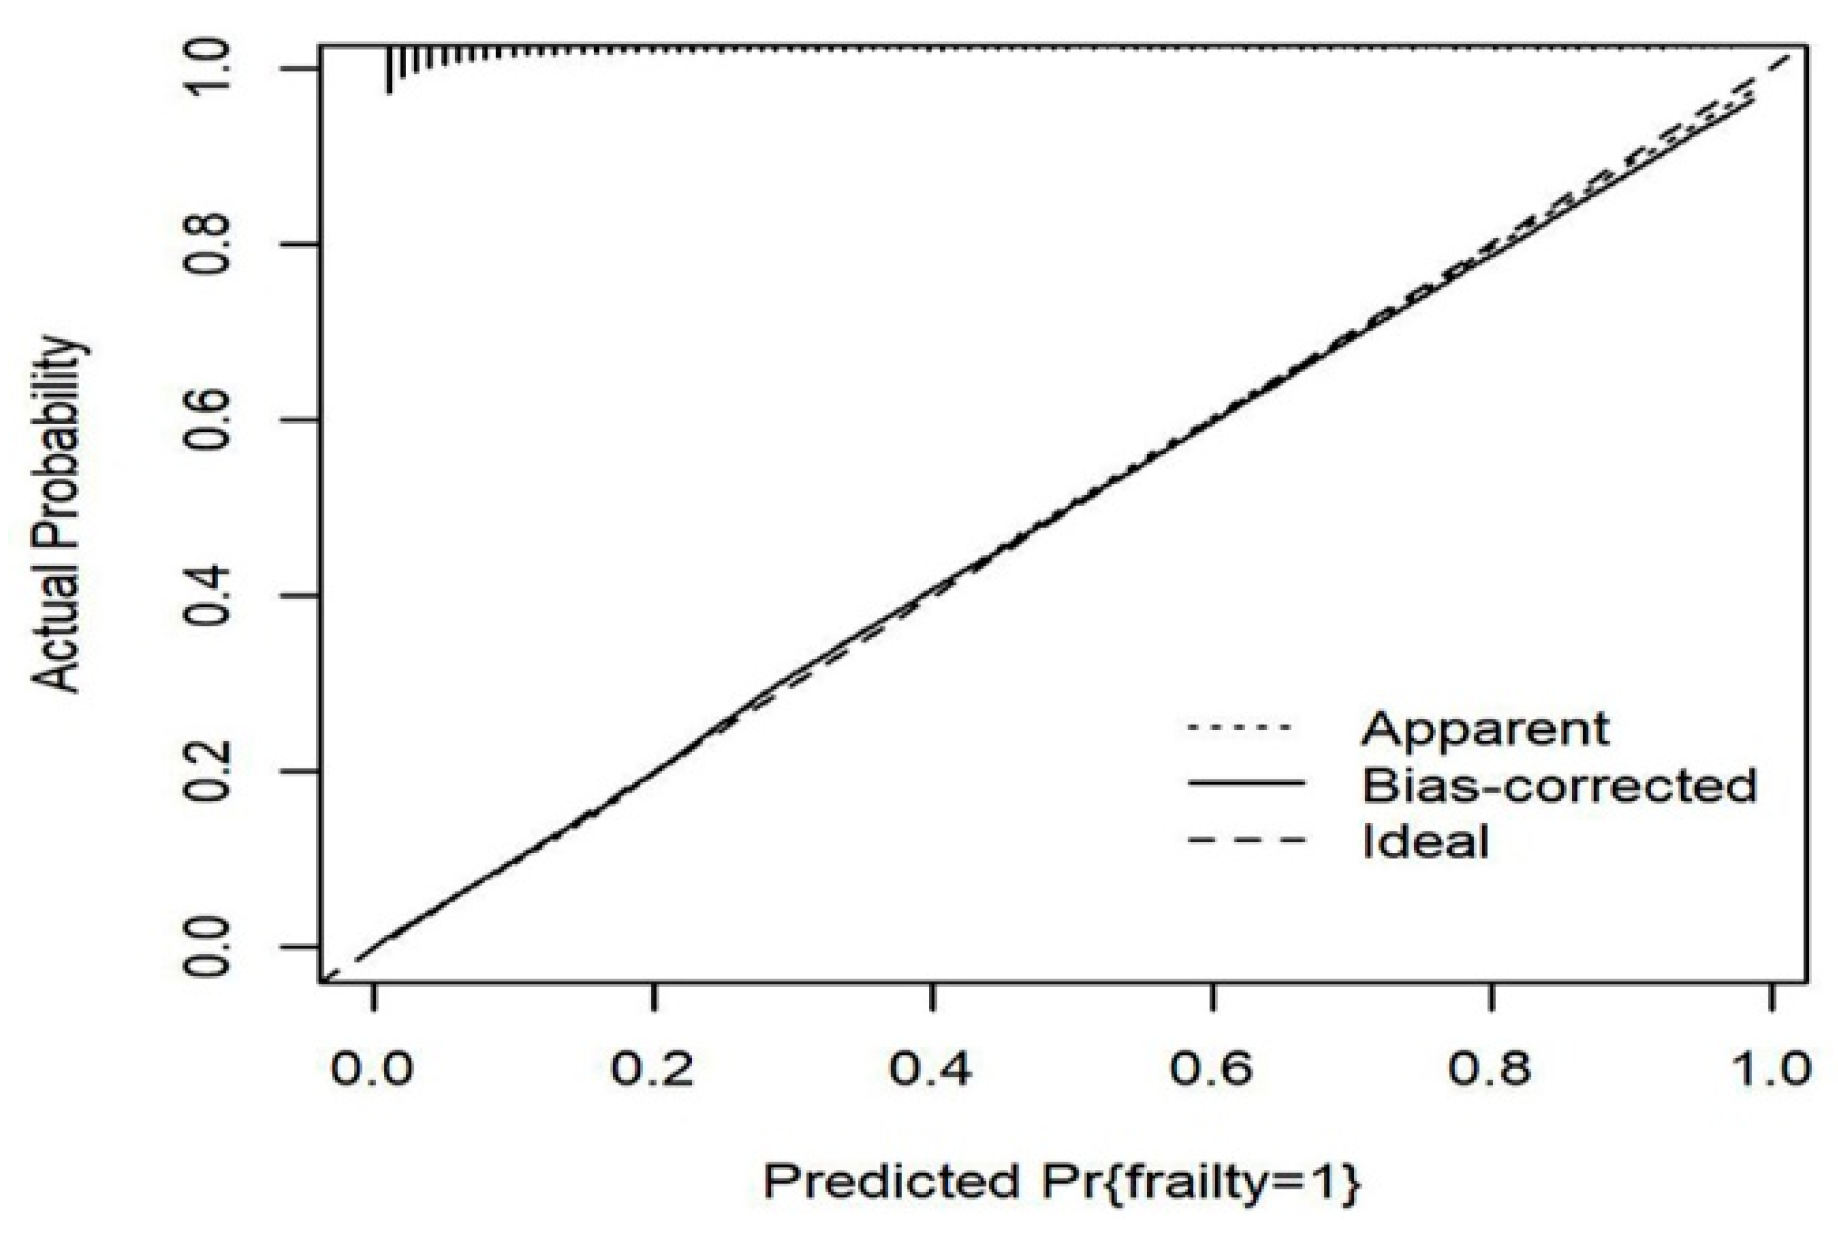
3.3. Effectiveness of the Frailty Risk Prediction Model
4. Discussion
5. Conclusions
Supplementary Materials
Author Contributions
Funding
Institutional Review Board Statement
Informed Consent Statement
Data Availability Statement
Acknowledgments
Conflicts of Interest
Abbreviations
| CLHLS | Chinese Longitudinal Healthy Longevity Survey |
| AUC | Area under curve |
| ROC | Receiver operating characteristic |
| VIF | Variance inflation factor |
References
- Hoogendijk, E.O.; Afilalo, J.; Ensrud, K.E.; Kowal, P.; Onder, G.; Fried, L.P. Frailty: Implications for Clinical Practice and Public Health. Lancet 2019, 394, 1365–1375. [Google Scholar] [CrossRef]
- Dent, E.; Lien, C.; Lim, W.S.; Wong, W.C.; Wong, C.H.; Ng, T.P.; Woo, J.; Dong, B.; de la Vega, S.; Hua Poi, P.J.; et al. The Asia-Pacific Clinical Practice Guidelines for the Management of Frailty. J. Am. Med. Dir. Assoc. 2017, 18, 564–575. [Google Scholar] [CrossRef]
- McGuigan, F.E.; Bartosch, P.; Åkesson, K.E. Musculoskeletal Health and Frailty. Best Pract. Res. Clin. Rheumatol. 2017, 31, 145–159. [Google Scholar] [CrossRef] [PubMed]
- Fan, L.; Hou, X.-Y.; Liu, Y.; Chen, S.; Wang, Q.; Du, W. Catastrophic Health Expenditure Associated with Frailty in Community-Dwelling Chinese Older Adults: A Prospective Cohort Analysis. Front Public Health 2021, 9, 718910. [Google Scholar] [CrossRef] [PubMed]
- Kojima, G.; Walters, K.; Iliffe, S.; Taniguchi, Y.; Tamiya, N. Marital Status and Risk of Physical Frailty: A Systematic Review and Meta-Analysis. J. Am. Med. Dir. Assoc. 2020, 21, 322–330. [Google Scholar] [CrossRef] [PubMed]
- Hoogendijk, E.O.; van Hout, H.P.J.; Heymans, M.W.; van der Horst, H.E.; Frijters, D.H.M.; Broese van Groenou, M.I.; Deeg, D.J.H.; Huisman, M. Explaining the Association between Educational Level and Frailty in Older Adults: Results from a 13-Year Longitudinal Study in the Netherlands. Ann. Epidemiol. 2014, 24, 538–544.e2. [Google Scholar] [CrossRef] [PubMed]
- Kojima, G.; Taniguchi, Y.; Kitamura, A.; Fujiwara, Y. Is Living Alone a Risk Factor of Frailty? A Systematic Review and Meta-Analysis. Ageing Res. Rev. 2020, 59, 101048. [Google Scholar] [CrossRef]
- Kojima, G.; Iliffe, S.; Walters, K. Smoking as a Predictor of Frailty: A Systematic Review. BMC Geriatr. 2015, 15, 131. [Google Scholar] [CrossRef] [Green Version]
- Kojima, G.; Liljas, A.; Iliffe, S.; Jivraj, S.; Walters, K. A Systematic Review and Meta-Analysis of Prospective Associations between Alcohol Consumption and Incident Frailty. Age Ageing 2018, 47, 26–34. [Google Scholar] [CrossRef] [Green Version]
- Puts, M.T.E.; Toubasi, S.; Andrew, M.K.; Ashe, M.C.; Ploeg, J.; Atkinson, E.; Ayala, A.P.; Roy, A.; Rodríguez Monforte, M.; Bergman, H.; et al. Interventions to Prevent or Reduce the Level of Frailty in Community-Dwelling Older Adults: A Scoping Review of the Literature and International Policies. Age Ageing 2017, 46, 383–392. [Google Scholar] [CrossRef] [Green Version]
- Ghosh, T.S.; Rampelli, S.; Jeffery, I.B.; Santoro, A.; Neto, M.; Capri, M.; Giampieri, E.; Jennings, A.; Candela, M.; Turroni, S.; et al. Mediterranean Diet Intervention Alters the Gut Microbiome in Older People Reducing Frailty and Improving Health Status: The NU-AGE 1-Year Dietary Intervention across Five European Countries. Gut 2020, 69, 1218–1228. [Google Scholar] [CrossRef] [PubMed] [Green Version]
- Duppen, D.; Van der Elst, M.C.J.; Dury, S.; Lambotte, D.; De Donder, L.; D-SCOPE. The Social Environment’s Relationship with Frailty: Evidence from Existing Studies. J. Appl. Gerontol. 2019, 38, 3–26. [Google Scholar] [CrossRef] [PubMed]
- Raymond, E.; Reynolds, C.A.; Dahl Aslan, A.K.; Finkel, D.; Ericsson, M.; Hägg, S.; Pedersen, N.L.; Jylhävä, J. Drivers of Frailty from Adulthood into Old Age: Results from a 27-Year Longitudinal Population-Based Study in Sweden. J. Gerontol. Ser. A 2020, 75, 1943–1950. [Google Scholar] [CrossRef] [PubMed]
- Johannesen, M.; LoGiudice, D. Elder Abuse: A Systematic Review of Risk Factors in Community-Dwelling Elders. Age Ageing 2013, 42, 292–298. [Google Scholar] [CrossRef] [Green Version]
- Kono, A.; Izumi, K.; Yoshiyuki, N.; Kanaya, Y.; Rubenstein, L.Z. Effects of an Updated Preventive Home Visit Program Based on a Systematic Structured Assessment of Care Needs for Ambulatory Frail Older Adults in Japan: A Randomized Controlled Trial. J. Gerontol. A Biol. Sci. Med. Sci. 2016, 71, 1631–1637. [Google Scholar] [CrossRef] [Green Version]
- Gao, Y.; Chen, Y.; Hu, M.; Gan, T.; Sun, X.; Zhang, Z.; He, W.; Wu, I.X.Y. Characteristics and Quality of Diagnostic and Risk Prediction Models for Frailty in Older Adults: A Systematic Review. J. Appl. Gerontol. 2022, 7334648221097084. [Google Scholar] [CrossRef]
- Abe, T.; Seino, S.; Nofuji, Y.; Tomine, Y.; Nishi, M.; Hata, T.; Shinkai, S.; Kitamura, A. Development of Risk Prediction Models for Incident Frailty and Their Performance Evaluation. Prev. Med. 2021, 153, 106768. [Google Scholar] [CrossRef]
- Vernerey, D.; Anota, A.; Vandel, P.; Paget-Bailly, S.; Dion, M.; Bailly, V.; Bonin, M.; Pozet, A.; Foubert, A.; Benetkiewicz, M.; et al. Development and Validation of the FRAGIRE Tool for Assessment an Older Person’s Risk for Frailty. BMC Geriatr. 2016, 16, 187. [Google Scholar] [CrossRef] [Green Version]
- Theou, O.; Brothers, T.D.; Rockwood, M.R.; Haardt, D.; Mitnitski, A.; Rockwood, K. Exploring the Relationship between National Economic Indicators and Relative Fitness and Frailty in Middle-Aged and Older Europeans. Age Ageing 2013, 42, 614–619. [Google Scholar] [CrossRef] [Green Version]
- United Nations, Department of Economic and Social Affairs, Population Division. World Population Ageing 2019: Highlights; (ST/ESA/SER.A/430); United Nations: New York, NY, USA, 2019. [Google Scholar]
- Dupre, M.E.; Gu, D.; Warner, D.F.; Yi, Z. Frailty and Type of Death among Older Adults in China: Prospective Cohort Study. BMJ 2009, 338, b1175. [Google Scholar] [CrossRef] [Green Version]
- Zeng, Y.; Feng, Q.; Gu, D.; Vaupel, J.W. Demographics, Phenotypic Health Characteristics and Genetic Analysis of Centenarians in China. Mech. Ageing Dev. 2017, 165, 86–97. [Google Scholar] [CrossRef] [PubMed]
- Goggins, W.B.; Woo, J.; Sham, A.; Ho, S.C. Frailty Index as a Measure of Biological Age in a Chinese Population. J. Gerontol. A Biol. Sci. Med. Sci. 2005, 60, 1046–1051. [Google Scholar] [CrossRef] [PubMed] [Green Version]
- Chen, Q.; Tang, B.; Zhai, Y.; Chen, Y.; Jin, Z.; Han, H.; Gao, Y.; Wu, C.; Chen, T.; He, J. Dynamic Statistical Model for Predicting the Risk of Death among Older Chinese People, Using Longitudinal Repeated Measures of the Frailty Index: A Prospective Cohort Study. Age Ageing 2020, 49, 966–973. [Google Scholar] [CrossRef] [PubMed]
- Hoogendijk, E.O.; Smit, A.P.; van Dam, C.; Schuster, N.A.; de Breij, S.; Holwerda, T.J.; Huisman, M.; Dent, E.; Andrew, M.K. Frailty Combined with Loneliness or Social Isolation: An Elevated Risk for Mortality in Later Life. J. Am. Geriatr. Soc. 2020, 68, 2587–2593. [Google Scholar] [CrossRef] [PubMed]
- Collard, R.M.; Boter, H.; Schoevers, R.A.; Voshaar, R.C.O. Prevalence of Frailty in Community-Dwelling Older Persons: A Systematic Review. J. Am. Geriatr. Soc. 2012, 60, 1487–1492. [Google Scholar] [CrossRef] [PubMed]
- Trevisan, C.; Veronese, N.; Maggi, S.; Baggio, G.; Toffanello, E.D.; Zambon, S.; Sartori, L.; Musacchio, E.; Perissinotto, E.; Crepaldi, G.; et al. Factors Influencing Transitions Between Frailty States in Elderly Adults: The Progetto Veneto Anziani Longitudinal Study. J. Am. Geriatr. Soc. 2017, 65, 179–184. [Google Scholar] [CrossRef]
- Oksuzyan, A.; Juel, K.; Vaupel, J.W.; Christensen, K. Men: Good Health and High Mortality. Sex Differences in Health and Aging. Aging Clin. Exp. Res. 2008, 20, 91–102. [Google Scholar] [CrossRef] [Green Version]
- Gordon, E.H.; Peel, N.M.; Samanta, M.; Theou, O.; Howlett, S.E.; Hubbard, R.E. Sex Differences in Frailty: A Systematic Review and Meta-Analysis. Exp. Gerontol. 2017, 89, 30–40. [Google Scholar] [CrossRef]
- Iavicoli, I.; Leso, V.; Cesari, M. The Contribution of Occupational Factors on Frailty. Arch. Gerontol. Geriatr. 2018, 75, 51–58. [Google Scholar] [CrossRef]
- Woo, J.; Goggins, W.; Sham, A.; Ho, S.C. Social Determinants of Frailty. Gerontology 2005, 51, 402–408. [Google Scholar] [CrossRef]
- Panahi, S.; Tremblay, A. Sedentariness and Health: Is Sedentary Behavior More Than Just Physical Inactivity? Front. Public Health 2018, 6, 258. [Google Scholar] [CrossRef] [PubMed] [Green Version]
- Tareque, M.I.; Koshio, A.; Tiedt, A.D.; Hasegawa, T. Are the Rates of Hypertension and Diabetes Higher in People from Lower Socioeconomic Status in Bangladesh? Results from a Nationally Representative Survey. PLoS ONE 2015, 10, e0127954. [Google Scholar] [CrossRef] [Green Version]
- Haapanen, M.J.; Perälä, M.M.; Salonen, M.K.; Kajantie, E.; Simonen, M.; Pohjolainen, P.; Pesonen, A.K.; Räikkönen, K.; Eriksson, J.G.; von Bonsdorff, M.B. Early Life Stress and Frailty in Old Age: The Helsinki Birth Cohort Study. BMC Geriatr. 2018, 18, 179. [Google Scholar] [CrossRef] [Green Version]
- Haapanen, M.J.; von Bonsdorff, M.B.; Perttila, N.M.; Tormakangas, T.; von Bonsdorff, M.E.; Strandberg, A.Y.; Strandberg, T.E. Retirement Age and Type as Predictors of Frailty: A Retrospective Cohort Study of Older Businessmen. BMJ Open 2020, 10, e037722. [Google Scholar] [CrossRef] [PubMed]
- Stephan, A.-J.; Strobl, R.; Holle, R.; Grill, E. Wealth and Occupation Determine Health Deficit Accumulation Onset in Europe—Results from the SHARE Study. Exp. Gerontol. 2018, 113, 74–79. [Google Scholar] [CrossRef] [Green Version]
- Wong, C.H.; Weiss, D.; Sourial, N.; Karunananthan, S.; Quail, J.M.; Wolfson, C.; Bergman, H. Frailty and Its Association with Disability and Comorbidity in a Community-Dwelling Sample of Seniors in Montreal: A Cross-Sectional Study. Aging Clin. Exp. Res. 2010, 22, 54–62. [Google Scholar] [CrossRef]
- Ballard, J.; Mooney, M.; Dempsey, O. Prevalence of Frailty-Related Risk Factors in Older Adults Seen by Community Nurses. J. Adv. Nurs. 2013, 69, 675–684. [Google Scholar] [CrossRef]
- Xu, W.; Li, Y.-X.; Wu, C. Incidence of Frailty among Community-Dwelling Older Adults: A Nationally Representative Profile in China. BMC Geriatr. 2019, 19, 378. [Google Scholar] [CrossRef] [Green Version]
- Yokoyama, K.; Yamada, Y.; Akamatsu, Y.; Yoshinaka, Y.; Yamamoto, A.; Koizumi, T.; Ohyama, K.; Suzuki, K.; Hashimoto, M.; Sato, H.; et al. Effects of Capsinoids on Daily Physical Activity, Body Composition and Cold Hypersensitivity in Middle-Aged and Older Adults: A Randomized Study. Nutrients 2020, 12, 212. [Google Scholar] [CrossRef] [Green Version]
- Drouin-Chartier, J.-P.; Chen, S.; Li, Y.; Schwab, A.L.; Stampfer, M.J.; Sacks, F.M.; Rosner, B.; Willett, W.C.; Hu, F.B.; Bhupathiraju, S.N. Egg Consumption and Risk of Cardiovascular Disease: Three Large Prospective US Cohort Studies, Systematic Review, and Updated Meta-Analysis. BMJ 2020, 368, m513. [Google Scholar] [CrossRef] [Green Version]
- Missmer, S.A.; Smith-Warner, S.A.; Spiegelman, D.; Yaun, S.-S.; Adami, H.-O.; Beeson, W.L.; van den Brandt, P.A.; Fraser, G.E.; Freudenheim, J.L.; Goldbohm, R.A.; et al. Meat and Dairy Food Consumption and Breast Cancer: A Pooled Analysis of Cohort Studies. Int. J. Epidemiol. 2002, 31, 78–85. [Google Scholar] [CrossRef] [PubMed] [Green Version]
- Zhuang, P.; Wu, F.; Mao, L.; Zhu, F.; Zhang, Y.; Chen, X.; Jiao, J.; Zhang, Y. Egg and Cholesterol Consumption and Mortality from Cardiovascular and Different Causes in the United States: A Population-Based Cohort Study. PLoS Med. 2021, 18, e1003508. [Google Scholar] [CrossRef] [PubMed]
- Bordoni, A.; Danesi, F.; Dardevet, D.; Dupont, D.; Fernandez, A.S.; Gille, D.; Nunes dos Santos, C.; Pinto, P.; Re, R.; Rémond, D.; et al. Dairy Products and Inflammation: A Review of the Clinical Evidence. Crit. Rev. Food Sci. Nutr. 2017, 57, 2497–2525. [Google Scholar] [CrossRef] [PubMed]
- Melnik, B.C. Milk—The Promoter of Chronic Western Diseases. Med. Hypotheses 2009, 72, 631–639. [Google Scholar] [CrossRef] [PubMed]
- Yu, F.-N.; Hu, N.-Q.; Huang, X.-L.; Shi, Y.-X.; Zhao, H.-Z.; Cheng, H.-Y. Dietary Patterns Derived by Factor Analysis Are Associated with Cognitive Function among a Middle-Aged and Elder Chinese Population. Psychiatry Res. 2018, 269, 640–645. [Google Scholar] [CrossRef]
- Liu, Y.; You, M.; Shen, J.; Xu, Y.; Li, L.; Wang, D.; Yang, Y. Allicin Reversed the Process of Frailty in Aging Male Fischer 344 Rats With Osteoporosis. J. Gerontol. Ser. A-Biol. Sci. Med. Sci. 2020, 75, 821–825. [Google Scholar] [CrossRef]
- Casado, Á.; Ramos, P.; Rodríguez, J.; Moreno, N.; Gil, P. Types and Characteristics of Drinking Water for Hydration in the Elderly. Crit. Rev. Food Sci. Nutr. 2015, 55, 1633–1641. [Google Scholar] [CrossRef]
- Cook, B.L.; Wayne, G.F.; Keithly, L.; Connolly, G. One Size Does Not Fit All: How the Tobacco Industry Has Altered Cigarette Design to Target Consumer Groups with Specific Psychological and Psychosocial Needs. Addiction 2003, 98, 1547–1561. [Google Scholar] [CrossRef]
- Ortolá, R.; García-Esquinas, E.; León-Muñoz, L.M.; Guallar-Castillón, P.; Valencia-Martín, J.L.; Galán, I.; Rodríguez-Artalejo, F. Patterns of Alcohol Consumption and Risk of Frailty in Community-Dwelling Older Adults. J. Gerontol. Ser. A 2016, 71, 251–258. [Google Scholar] [CrossRef] [Green Version]
- Woo, J.; Zheng, Z.; Leung, J.; Chan, P. Prevalence of Frailty and Contributory Factors in Three Chinese Populations with Different Socioeconomic and Healthcare Characteristics. BMC Geriatr. 2015, 15, 163. [Google Scholar] [CrossRef] [Green Version]
- Bond, J.; Farrow, G.; Gregson, B.A.; Bamford, C.; Buck, D.; McNamee, P.; Wright, K. Informal Caregiving for Frail Older People at Home and in Long-Term Care Institutions: Who Are the Key Supporters? Health Soc. Care Community 1999, 7, 434–444. [Google Scholar] [CrossRef] [PubMed]
- Levitzki, N. Parenting of Adult Children in an Israeli Sample: Parents Are Always Parents. J. Fam. Psychol. 2009, 23, 226–235. [Google Scholar] [CrossRef] [PubMed]


| Characteristics | Total | Non-Frail | Frail | FI |
|---|---|---|---|---|
| Sex | ||||
| Man | 6300 (44.0) | 5080 (48.8) | 1220 (31.3) | 0.154 |
| Woman | 8014 (56.0) | 5336 (51.2) | 2678 (68.7) | 0.182 |
| Age (year) | ||||
| 50–69 | 1494 (10.5) | 1453 (13.9) | 41 (1.1) | 0.077 |
| 70–99 | 10,289 (71.9) | 8131 (78.1) | 2158 (55.4) | 0.154 |
| 100 | 2531 (17.7) | 832 (8.0) | 1699 (43.6) | 0.182 |
| Nationality | ||||
| Han | 11,611 (94.2) | 8295 (93.8) | 3316 (95.4) | 0.175 |
| Minority | 712 (5.8) | 553 (6.3) | 159 (4.6) | 0.162 |
| Residence | ||||
| Urban | 7970 (55.7) | 5646 (54.2) | 2324 (59.6) | 0.180 |
| Rural | 6344 (44.3) | 4770 (45.8) | 1574 (40.4) | 0.162 |
| Education (year) | ||||
| 0 | 6003 (49.2) | 3646 (41.6) | 2357 (69.0) | 0.185 |
| 1–6 | 3868 (31.7) | 3154 (36.0) | 714 (20.9) | 0.152 |
| 6 | 2319 (19.0) | 1972 (22.5) | 347 (10.2) | 0.145 |
| Marital status | ||||
| Currently married and living with spouse | 5651 (39.9) | 5051 (48.9) | 600 (15.6) | 0.122 |
| Separated | 241 (1.7) | 196 (1.9) | 45 (1.2) | 0.151 |
| Divorced | 45 (0.3) | 33 (0.3) | 12 (0.3) | 0.154 |
| Widowed | 8120 (57.3) | 4944 (47.9) | 3176 (82.3) | 0.186 |
| Never married | 122 (0.9) | 97 (0.9) | 25 (0.6) | 0.146 |
| Main occupation before age 60 | ||||
| Professionals and technician | 817 (6.7) | 634 (7.3) | 183 (5.3) | 0.166 |
| Administrative manager | 498 (4.1) | 363 (4.2) | 135 (3.9) | 0.183 |
| Clerk | 1794 (14.7) | 1323 (15.1) | 471 (13.7) | 0.183 |
| Self-employed | 233 (1.9) | 171 (2.0) | 62 (1.8) | 0.163 |
| Agriculture/husbandry/fishery | 7478 (61.4) | 5418 (62.0) | 2060 (60.1) | 0.168 |
| House worker | 824 (6.8) | 492 (5.6) | 332 (9.7) | 0.192 |
| Soldier | 111 (0.9) | 81 (0.9) | 30 (0.9) | 0.178 |
| Never worked | 196 (1.6) | 99 (1.1) | 97 (2.8) | 0.221 |
| Others | 222 (1.8) | 163 (1.9) | 59 (1.7) | 0.174 |
| Main source of financial support | ||||
| Retirement wages | 3546 (22.3) | 2697 (28.3) | 849 (23.5) | 0.174 |
| Relative (s) | 6995 (53.3) | 4677 (49.1) | 2318 (64.1) | 0.178 |
| Local government or community | 1399 (8.8) | 963 (10.1) | 436 (12.1) | 0.171 |
| Work by self | 1195 (7.5) | 1182 (12.4) | 13 (0.4) | 0.056 |
| Household income (10,000 RMB) | ||||
| 0.1 | 736 (5.6) | 507 (5.3) | 229 (6.4) | 0.173 |
| 0.1–0.3 | 965 (7.4) | 742 (7.8) | 223 (6.3) | 0.151 |
| 0.3–0.8 | 1707 (13.0) | 1251 (13.1) | 456 (12.8) | 0.171 |
| 0.8–1.0 | 956 (7.3) | 691 (7.2) | 265 (7.4) | 0.170 |
| 1.0–10.0 | 6259 (47.8) | 4524 (47.4) | 1735 (48.7) | 0.177 |
| 10.0 | 2474 (18.9) | 1821 (19.1) | 653 (18.3) | 0.174 |
| Self-assessed sufficient economic support | ||||
| Yes | 12,240 (86.1) | 9058 (87.5) | 3182 (82.3) | 0.169 |
| No | 1982 (13.9) | 1297 (12.5) | 685 (17.7) | 0.189 |
| Self-rated economic level | ||||
| Very rich | 371 (2.6) | 280 (2.7) | 91 (2.4) | 0.172 |
| Rich | 2418 (17.1) | 1890 (18.3) | 528 (13.8) | 0.158 |
| So-so | 9877 (69.7) | 7232 (70.0) | 2709 (69.0) | 0.172 |
| Poor | 1311 (9.3) | 833 (8.1) | 478 (12.5) | 0.189 |
| Very poor | 191 (1.3) | 99 (1.0) | 92 (2.4) | 0.199 |
| Variables | OR (95% CI) | AOR (95% CI) | β |
|---|---|---|---|
| Age (year) (n = 14,314, 100%) (reference: 50–69) | |||
| 70–99 | 9.41 (6.87–12.88) ** | 3.10 (2.22–4.34) ** | 1.110 |
| 100 | 72.37 (52.48–99.79) ** | 9.76 (6.86–13.90) ** | 2.248 |
| Nationality (n = 12,323, 86.1%) (reference: Han) | |||
| Minority | 0.70 (0.59–0.83) ** | 0.71 (0.57–0.87) * | −0.345 |
| Residence (n = 14,314, 100%) (reference: Urban) | |||
| Rural | 0.90 (0.86–0.93) ** | 0.87 (0.78–0.97) * | −0.115 |
| Education (n = 12,190, 85.2%) (year) (reference: 0) | |||
| 1–6 | 0.41 (0.38–0.45) ** | 0.85 (0.76–0.95) * | −0.194 |
| 6 | 0.31 (0.28–0.35) ** | 0.67 (0.55–0.81) ** | −0.460 |
| Marital status (n = 14,179, 99.1%) (reference: Currently married and living with spouse) | |||
| Separated | 1.90 (1.36–2.66) ** | 1.32 (0.86–2.02) | |
| Divorced | 2.92 (1.88–4.52) ** | 1.29 (0.73–2.30) | |
| Widowed | 5.34 (4.86–5.88) ** | 1.31 (1.07–1.60) * | 0.271 |
| Never married | 2.15 (1.37–3.36) * | 0.90 (0.48–1.67) | |
| Main occupation before age 60 (n = 12,173, 85.0%) (reference: Professional and technician) | |||
| Administrative manager | 1.24 (0.96–1.59) | 1.09 (0.78–1.53) | |
| Clerk | 1.20 (0.99–1.46) * | 0.69 (0.53–0.91) * | −0.371 |
| Self-employed | 0.96 (0.74–1.23) | 0.60 (0.37–0.95) * | −0.517 |
| Agriculture, husbandry, fishery | 1.31 (1.11–1.56) * | 0.52 (0.39–0.70) ** | −0.645 |
| House worker | 2.02 (1.64–2.49) ** | 0.70 (0.50–0.99) * | −0.354 |
| Soldier | 1.15 (0.78–1.68) | 1.19 (0.65–2.18) | |
| Never worked | 3.20 (2.33–4.39) ** | 0.72 (0.45–1.14) | |
| Others | 1.26 (0.90–1.77) | 0.58 (0.35–0.93) * | −0.553 |
| Main source of financial support (n = 13,135, 91.8%) (reference: Retirement wages) | |||
| Local government or community | 1.37 (1.20–1.56) ** | 0.82 (0.68–0.98) * | −0.202 |
| Relative(s) | 1.46 (1.34–1.60) ** | 0.70 (0.56–0.89) * | −0.352 |
| Work by self | 0.05 (0.03–0.08) ** | 0.10 (0.06–0.17) ** | −2.268 |
| Self-assessed sufficient economic support (n = 14,222, 99.4%) (reference: Yes) | |||
| No | 1.50 (1.36–1.66) ** | 1.45 (1.24–1.69) ** | 0.370 |
| Self-rated economic level (n = 14,168, 99.0%) (reference: Very rich) | |||
| Rich | 0.86 (0.67–1.11) | 0.85 (0.61–1.19) | |
| So-so | 1.14 (0.90–1.45) | 1.09 (0.79–1.51) | |
| Poor | 1.77 (1.36–2.29) ** | 1.76 (1.23–2.54) * | 0.567 |
| Very poor | 2.86 (1.98–4.14) ** | 2.29 (1.35–3.86) * | 0.826 |
| Co-residence (n = 14,132, 98.7%) (reference: With household member(s)) | |||
| Alone | 0.50 (0.44–0.56) ** | 0.38 (0.33–0.44) ** | −0.975 |
| In an institution | 3.29 (2.74–3.94) ** | 2.49 (1.93–3.22) ** | 0.914 |
| Staple food (n = 14,285, 99.8%) (reference: Rice) | |||
| Corn (maize) | 1.42 (1.17–1.71) ** | 1.64 (1.26–2.14) ** | 0.495 |
| Wheat (noodles and bread, etc.) | 1.37 (1.24–1.51) ** | 1.28 (1.10–1.49) * | 0.249 |
| Half rice and half flour | 1.47 (1.34–1.62) ** | 1.44 (1.26–1.65) ** | 0.366 |
| Others | 4.60 (3.22–6.57) ** | 1.68 (1.02–2.78) * | 0.520 |
| Amount of staple food per day (n = 14,233, 99.4%) (kg) (reference: <0.2) | |||
| 0.2–0.5 | 0.45 (0.41–0.48) ** | 0.68 (0.61–0.76) ** | −0.384 |
| 0.5 | 0.30 (0.25–0.36) ** | 0.59 (0.46–0.76) ** | −0.526 |
| Edible oil (n = 14,269, 99.7%) (reference: Other vegetable oils) | |||
| Gingili grease | 1.37 (0.90–2.07) | 1.08 (0.61–1.92) | |
| Lard | 0.75 (0.66–0.86) ** | 0.78 (0.66–0.93) * | −0.246 |
| Other animal’s fat | 1.04 (0.60–1.81) | 0.69 (0.33–1.44) | |
| Main dietary flavour (n = 14,269, 99.7%) (reference: Insipidity) | |||
| Salty | 0.79 (0.71–0.87) ** | 0.97 (0.85–1.10) | |
| Sweet | 1.53 (1.31–1.790 ** | 1.04 (0.84–1.29) | |
| Hot | 0.40 (0.29–0.56) ** | 0.67 (0.45–0.98) * | −0.400 |
| Crude | 1.52 (0.60–3.87) | 1.49 (0.45–4.91) | |
| Others | 1.29 (1.01–1.55) | 1.08 (0.86–1.38) | |
| Frequency of taking vegetables (n = 14,283, 99.8%) (reference: Almost every day) | |||
| Occasionally | 1.52 (1.40–1.64) ** | 1.28 (1.15–1.43) ** | 0.246 |
| Rarely or never | 5.74 (4.78–6.90) ** | 2.19 (1.71–2.80) ** | 0.784 |
| Frequency of taking egg (n = 14,182, 99.1%) (reference: Almost every day) | |||
| Occasionally | 0.73 (0.67–0.78) ** | 0.88 (0.78–0.99) * | −0.127 |
| Rarely or never | 0.97 (0.85–1.11) | 1.05 (0.87–1.27) | |
| Frequency of taking garlic (n = 14,175, 99.0%) (reference: Almost every day) | |||
| Occasionally | 1.33 (1.20–1.48) ** | 1.03 (0.90–1.19) | |
| Rarely or never | 2.48 (2.21–2.78) ** | 1.20 (1.03–1.41) * | 0.184 |
| Frequency of taking dairy (n = 14,163, 98.9%) (reference: Almost every day) | |||
| Occasionally | 0.66 (0.60–0.72) ** | 0.72 (0.63–0.82) ** | −0.332 |
| Rarely or never | 0.68 (0.62–0.74) ** | 0.63 (0.55–0.73) ** | −0.455 |
| Frequency of taking nut (n = 14,161, 98.9%) (reference: Almost every day) | |||
| Occasionally | 1.04 (0.86–1.25) | 1.11 (0.86–1.44) | |
| Rarely or never | 2.45 (2.04–2.94) ** | 1.56 (1.20–2.01) * | 0.442 |
| Frequency of taking tea (n = 14,011, 97.9%) (reference: Almost every day) | |||
| Occasionally | 1.43 (1.20–1.71) ** | 1.16 (0.93–1.46) | |
| Rarely or never | 2.42 (2.14–2.72) ** | 1.32 (1.12–1.54) * | 0.274 |
| Main source of water (n = 14,060, 98.2%) (reference: From a well) | |||
| From a river or lake | 1.00 (0.68–1.48) | 1.18 (0.73–1.91) | |
| From a spring | 0.80 (0.61–1.05) | 1.00 (0.71–1.41) | |
| From a pond or pool | 0.68 (0.26–1.80) | 0.80 (0.26–2.45) | |
| Tap water | 1.23 (1.12–1.36) ** | 1.22 (1.07–1.40) * | 0.200 |
| Current smoking (n = 14,174, 99.0%) (reference: Yes) | |||
| No | 3.05 (2.66–3.49) ** | 1.80 (1.51–2.15) ** | 0.590 |
| Current drinking (n = 14,103, 98.5%) (reference: Yes) | |||
| No | 2.87 (2.51–3.29) ** | 1.60 (1.34–1.91) ** | 0.470 |
| Current exercise (n = 14,127, 98.7%) (reference: Yes) | |||
| No | 5.93 (5.28–6.65) ** | 4.53 (3.95–5.20) ** | 1.511 |
| Number of times brushing teeth everyday (n = 13,952, 97.5%) (reference: Do not brush) | |||
| Occasionally | 0.47 (0.41–0.53) ** | 0.72 (0.61–0.84) ** | −0.329 |
| Once | 0.27 (0.26–0.30) ** | 0.52 (0.46–0.60) ** | −0.645 |
| Twice | 0.20 (0.18–0.23) ** | 0.38 (0.32–0.45) ** | −0.977 |
| Three or more times | 0.30 (0.25–0.36) ** | 0.51 (0.40–0.65) ** | −0.669 |
| Regular physical examination once a year (n = 12,043, 84.1%) (reference: Yes) | |||
| No | 3.21 (2.97–3.46) ** | 1.78 (1.61–1.97) ** | 0.574 |
| First person you want to share thoughts with (n = 13,952, 97.5%) (reference: Spouse) | |||
| Children, sons in law or daughters in law | 5.99 (5.36–6.68) ** | 1.65 (1.25–2.16) ** | 0.498 |
| Others | 3.91 (3.25–4.70) ** | 1.48 (1.02–2.15) * | 0.395 |
| Nobody | 6.15 (4.97–7.63) ** | 2.09 (1.42–3.10) ** | 0.739 |
| Primary caregiver when ill (n = 14,086, 98.4%) (reference: Spouse) | |||
| Children, sons in law or daughters in law | 5.55 (4.93–6.25) ** | 1.16 (0.94–1.42) | |
| Others | 10.37 (8.79–12.23) ** | 1.52 (1.15–1.99) * | 0.415 |
| Nobody | 0.65 (0.37–1.12) | 0.25 (0.13–0.47) ** | −1.405 |
| Primary payer of medical expenses (n = 13,841, 96.7%) (reference: Urban employee/resident medical insurance) | |||
| Cooperative medical scheme | 0.82 (0.74–0.91) ** | 0.83 (0.68–1.02) | |
| Private medical insurance | 0.90 (0.58–1.43) | 0.74 (0.41–1.34) | |
| Self | 0.49 (0.43–0.57) ** | 0.70 (0.57–0.86) * | −0.360 |
| Spouse | 0.63 (0.44–0.89) * | 1.21 (0.75–1.94) | |
| Children | 1.80 (1.62–1.99) ** | 1.11 (0.91–1.34) | |
| No money to pay | 1.90 (0.81–4.49) | 0.61 (0.20–1.83) | |
| Others | 1.98 (1.50–2.61) ** | 1.08 (0.74–1.59) | |
| Access to adequate medical service (n = 14,192, 99.1%) (reference: Yes) | |||
| No | 2.16 (1.78–2.62) ** | 1.42 (1.09–1.87) * | 0.353 |
Publisher’s Note: MDPI stays neutral with regard to jurisdictional claims in published maps and institutional affiliations. |
© 2022 by the authors. Licensee MDPI, Basel, Switzerland. This article is an open access article distributed under the terms and conditions of the Creative Commons Attribution (CC BY) license (https://creativecommons.org/licenses/by/4.0/).
Share and Cite
Li, S.; Fan, W.; Zhu, B.; Ma, C.; Tan, X.; Gu, Y. Frailty Risk Prediction Model among Older Adults: A Chinese Nation-Wide Cross-Sectional Study. Int. J. Environ. Res. Public Health 2022, 19, 8410. https://doi.org/10.3390/ijerph19148410
Li S, Fan W, Zhu B, Ma C, Tan X, Gu Y. Frailty Risk Prediction Model among Older Adults: A Chinese Nation-Wide Cross-Sectional Study. International Journal of Environmental Research and Public Health. 2022; 19(14):8410. https://doi.org/10.3390/ijerph19148410
Chicago/Turabian StyleLi, Siying, Wenye Fan, Boya Zhu, Chao Ma, Xiaodong Tan, and Yaohua Gu. 2022. "Frailty Risk Prediction Model among Older Adults: A Chinese Nation-Wide Cross-Sectional Study" International Journal of Environmental Research and Public Health 19, no. 14: 8410. https://doi.org/10.3390/ijerph19148410