
Potential Biomarkers and Drugs for Nanoparticle-Induced Cytotoxicity in the Retina: Based on Regulation of Inflammatory and Apoptotic Genes

Abstract
:1. Introduction
2. Materials and Methods
2.1. Dataset Collection
2.2. Differential Expression Analysis
2.3. Function Enrichment Analysis
2.4. Construction of a Protein–Protein Interaction (PPI) Network
2.5. Construction of a Competing Endogenous RNAs (ceRNAs) Regulatory Network
2.6. Small Molecule Drug Analysis
3. Results
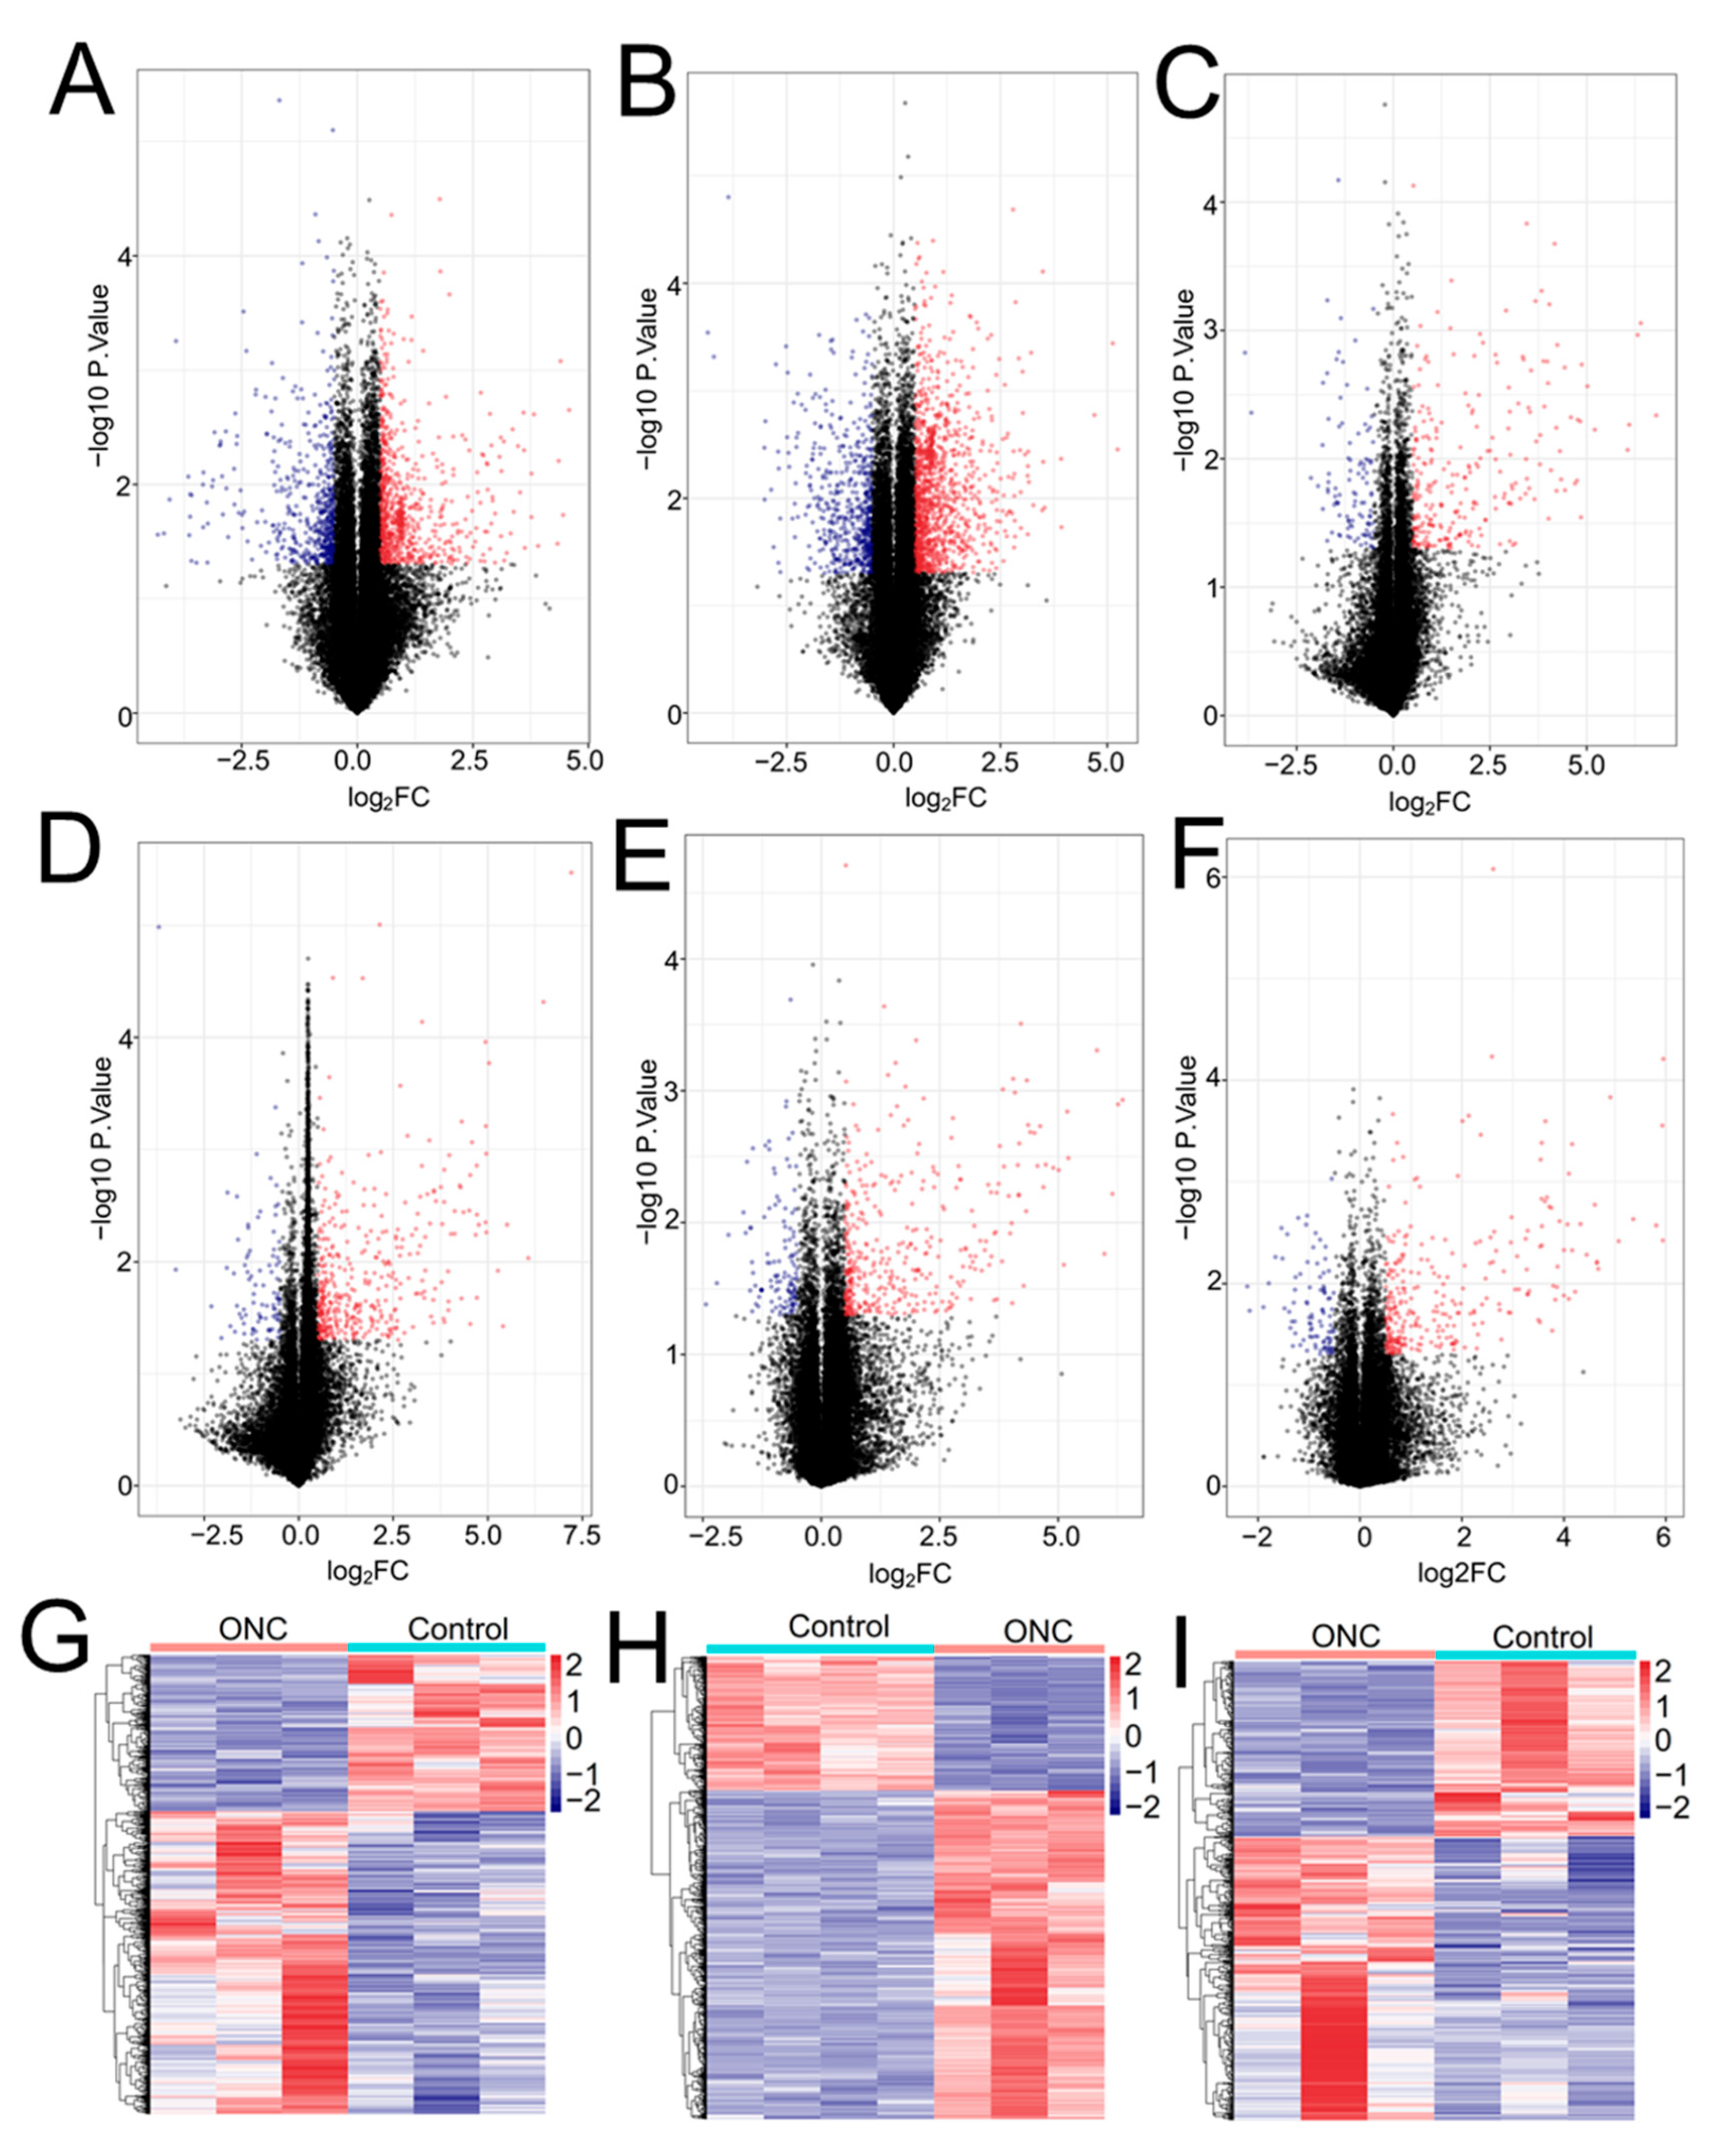
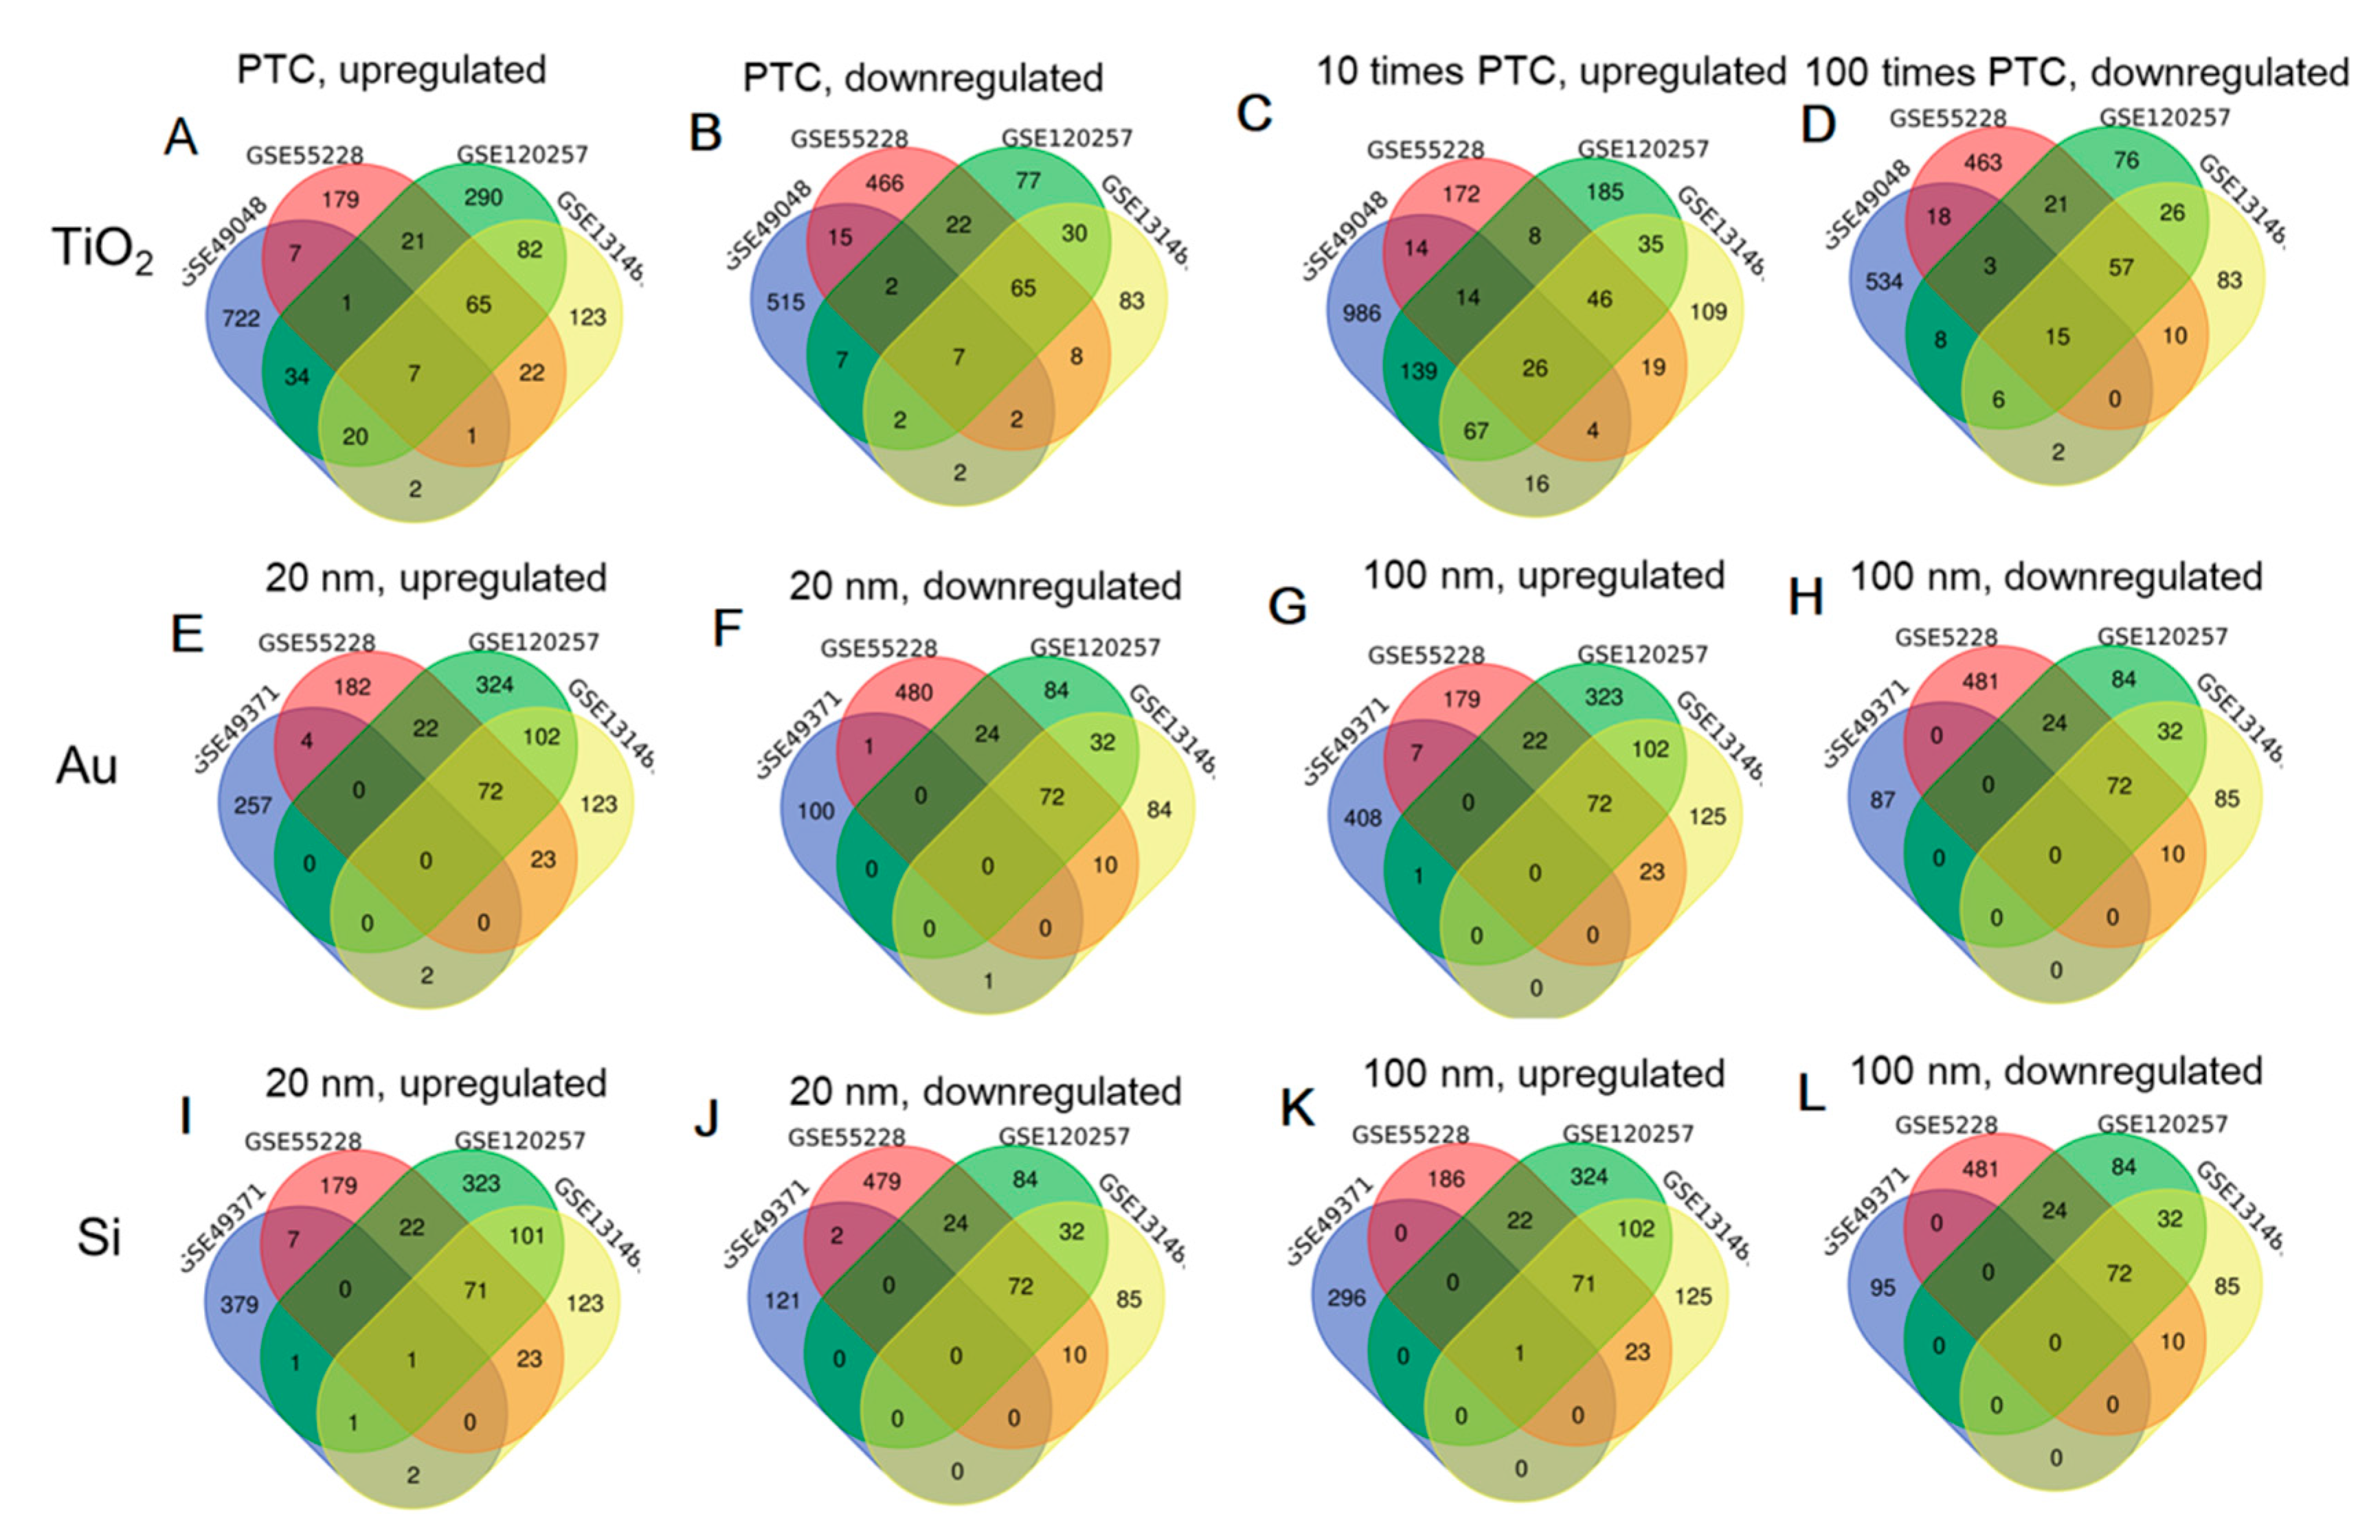
3.1. Differential Expression Analysis
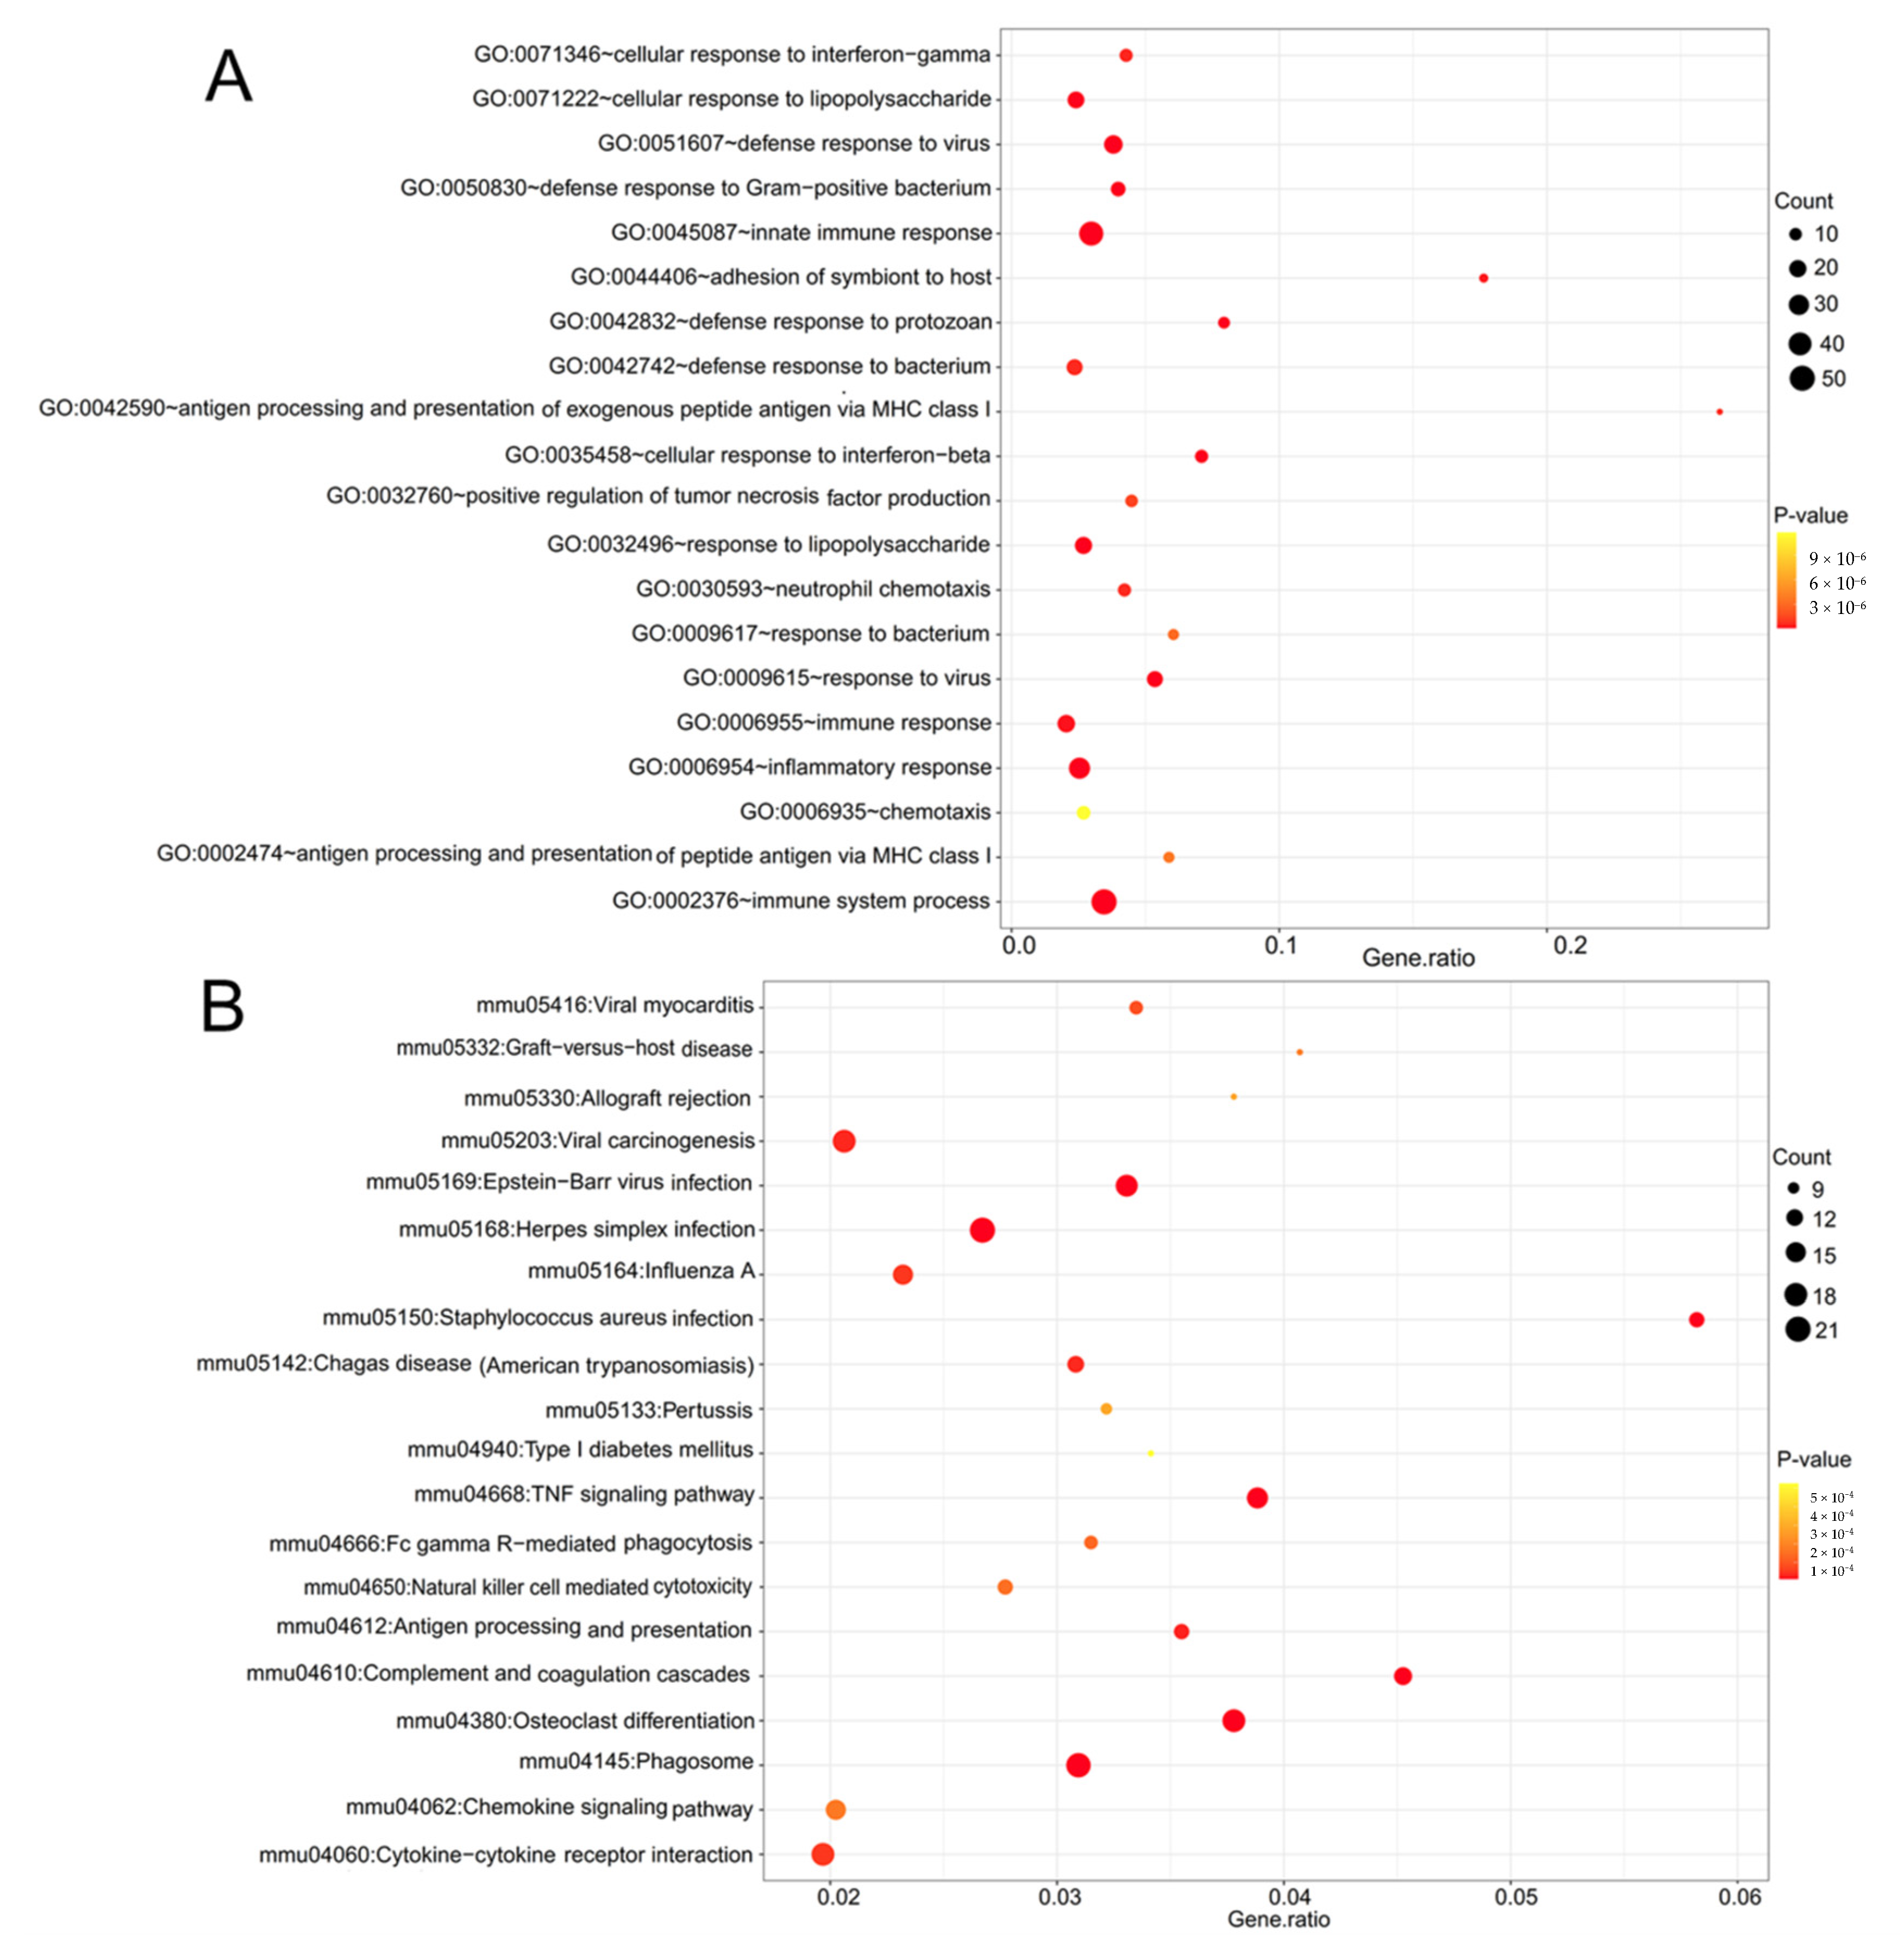
3.2. Function Enrichment Analysis
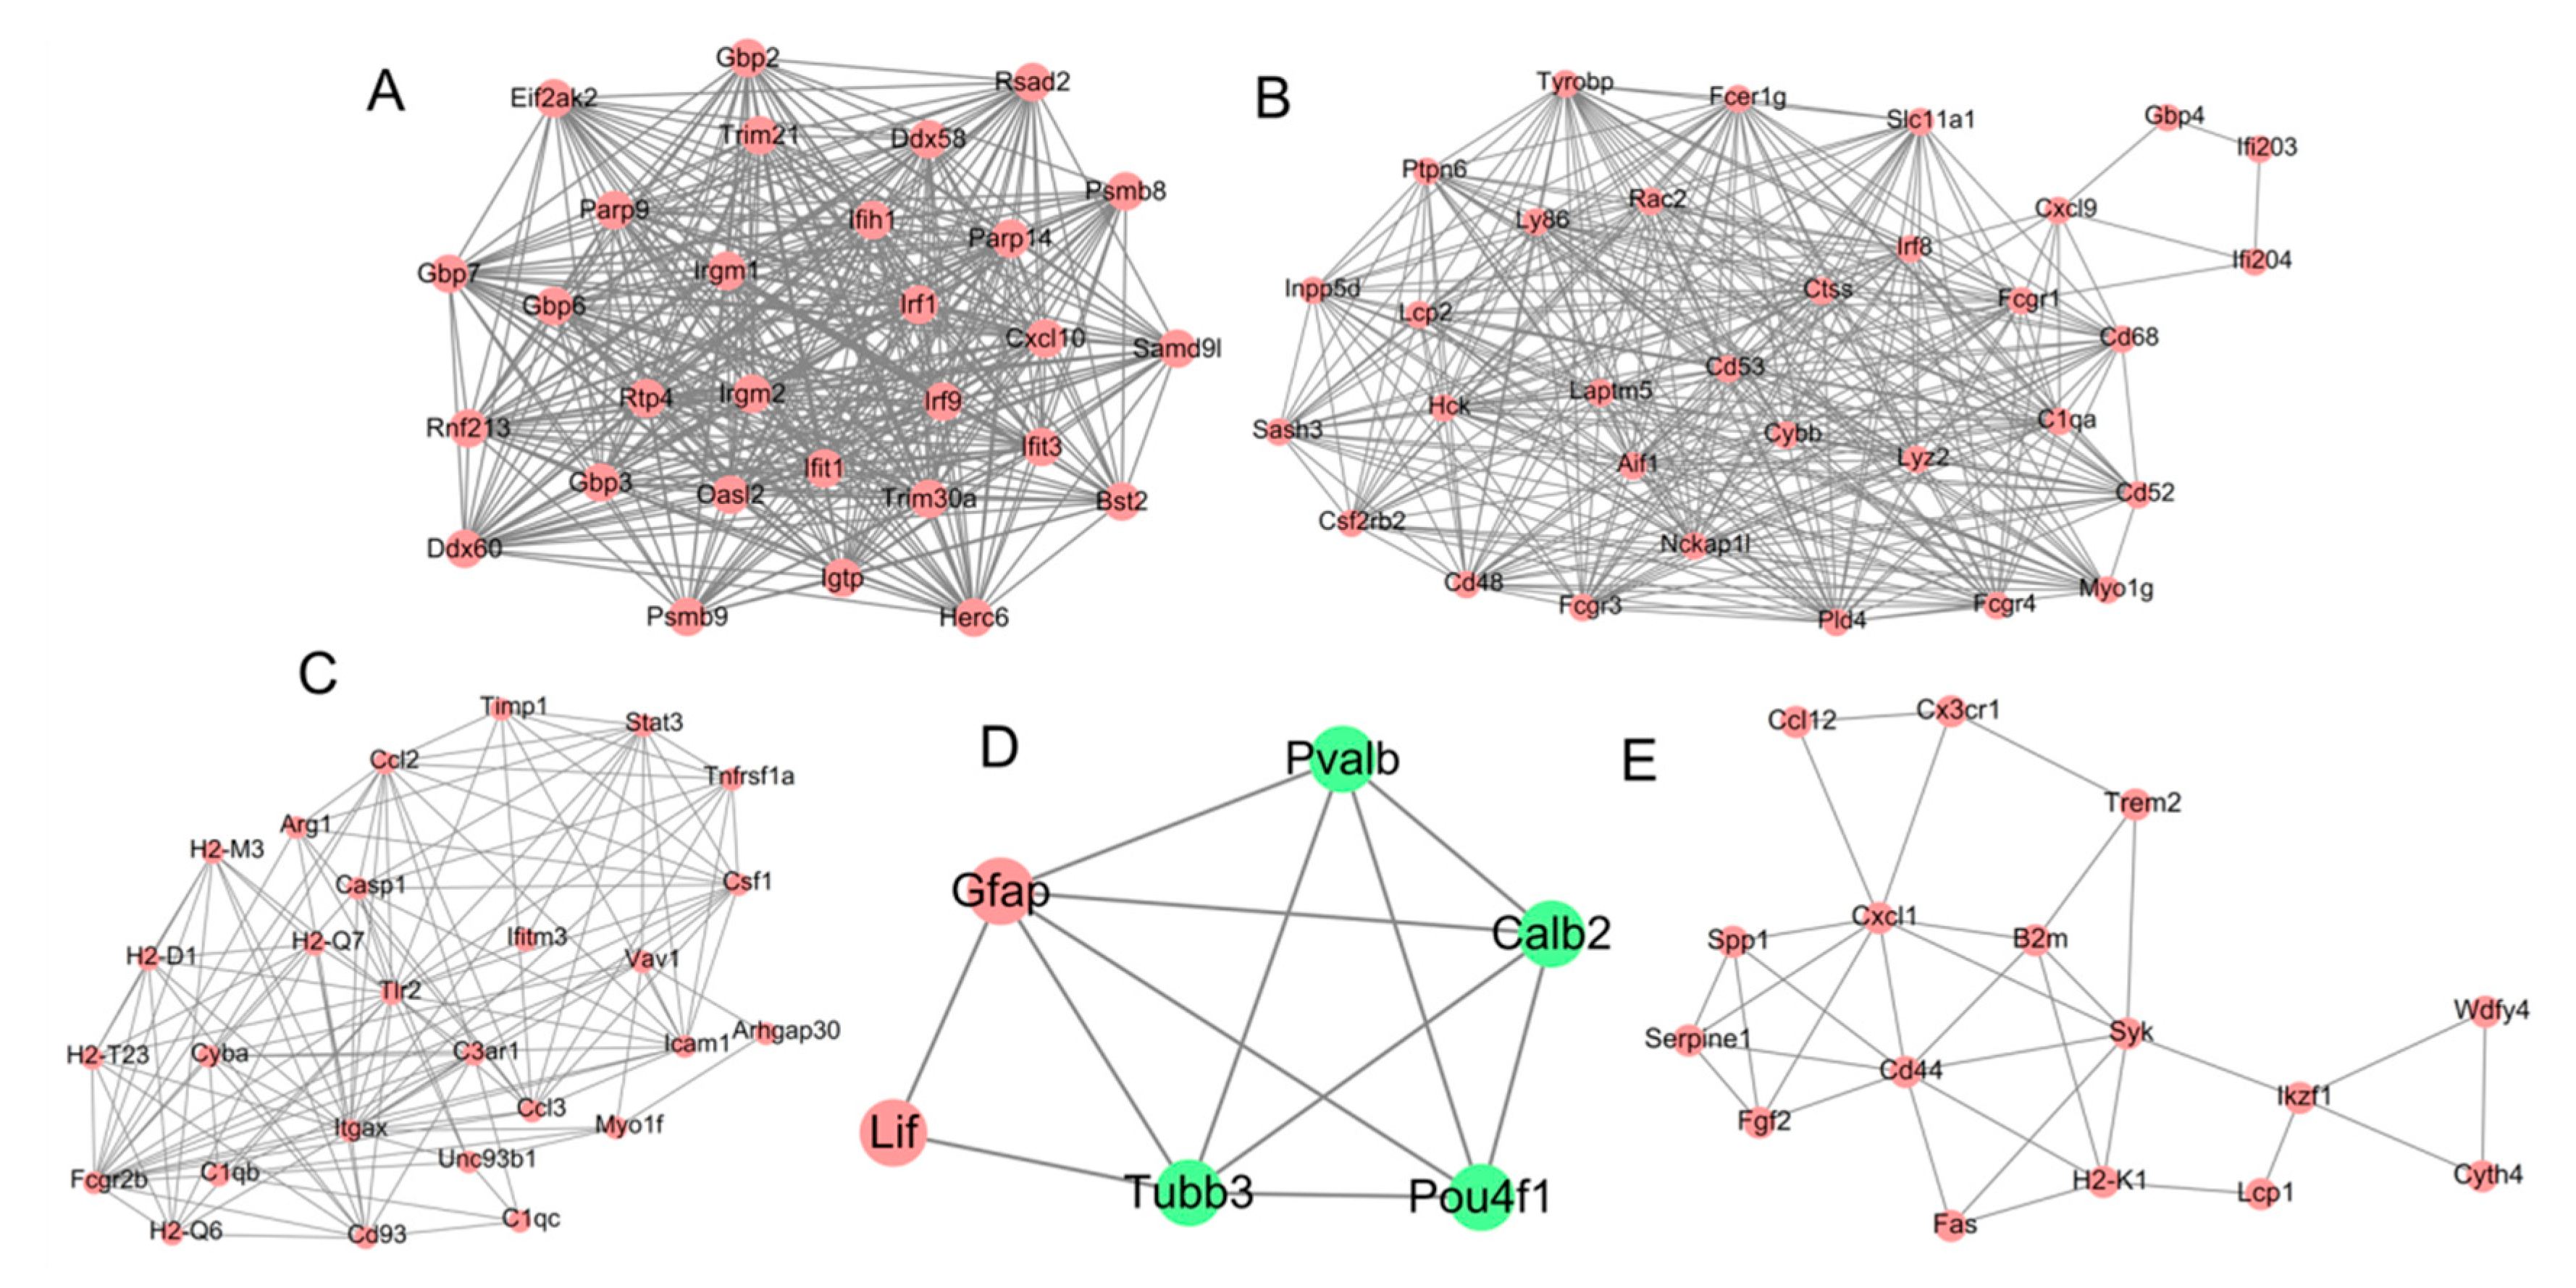
3.3. PPI Network
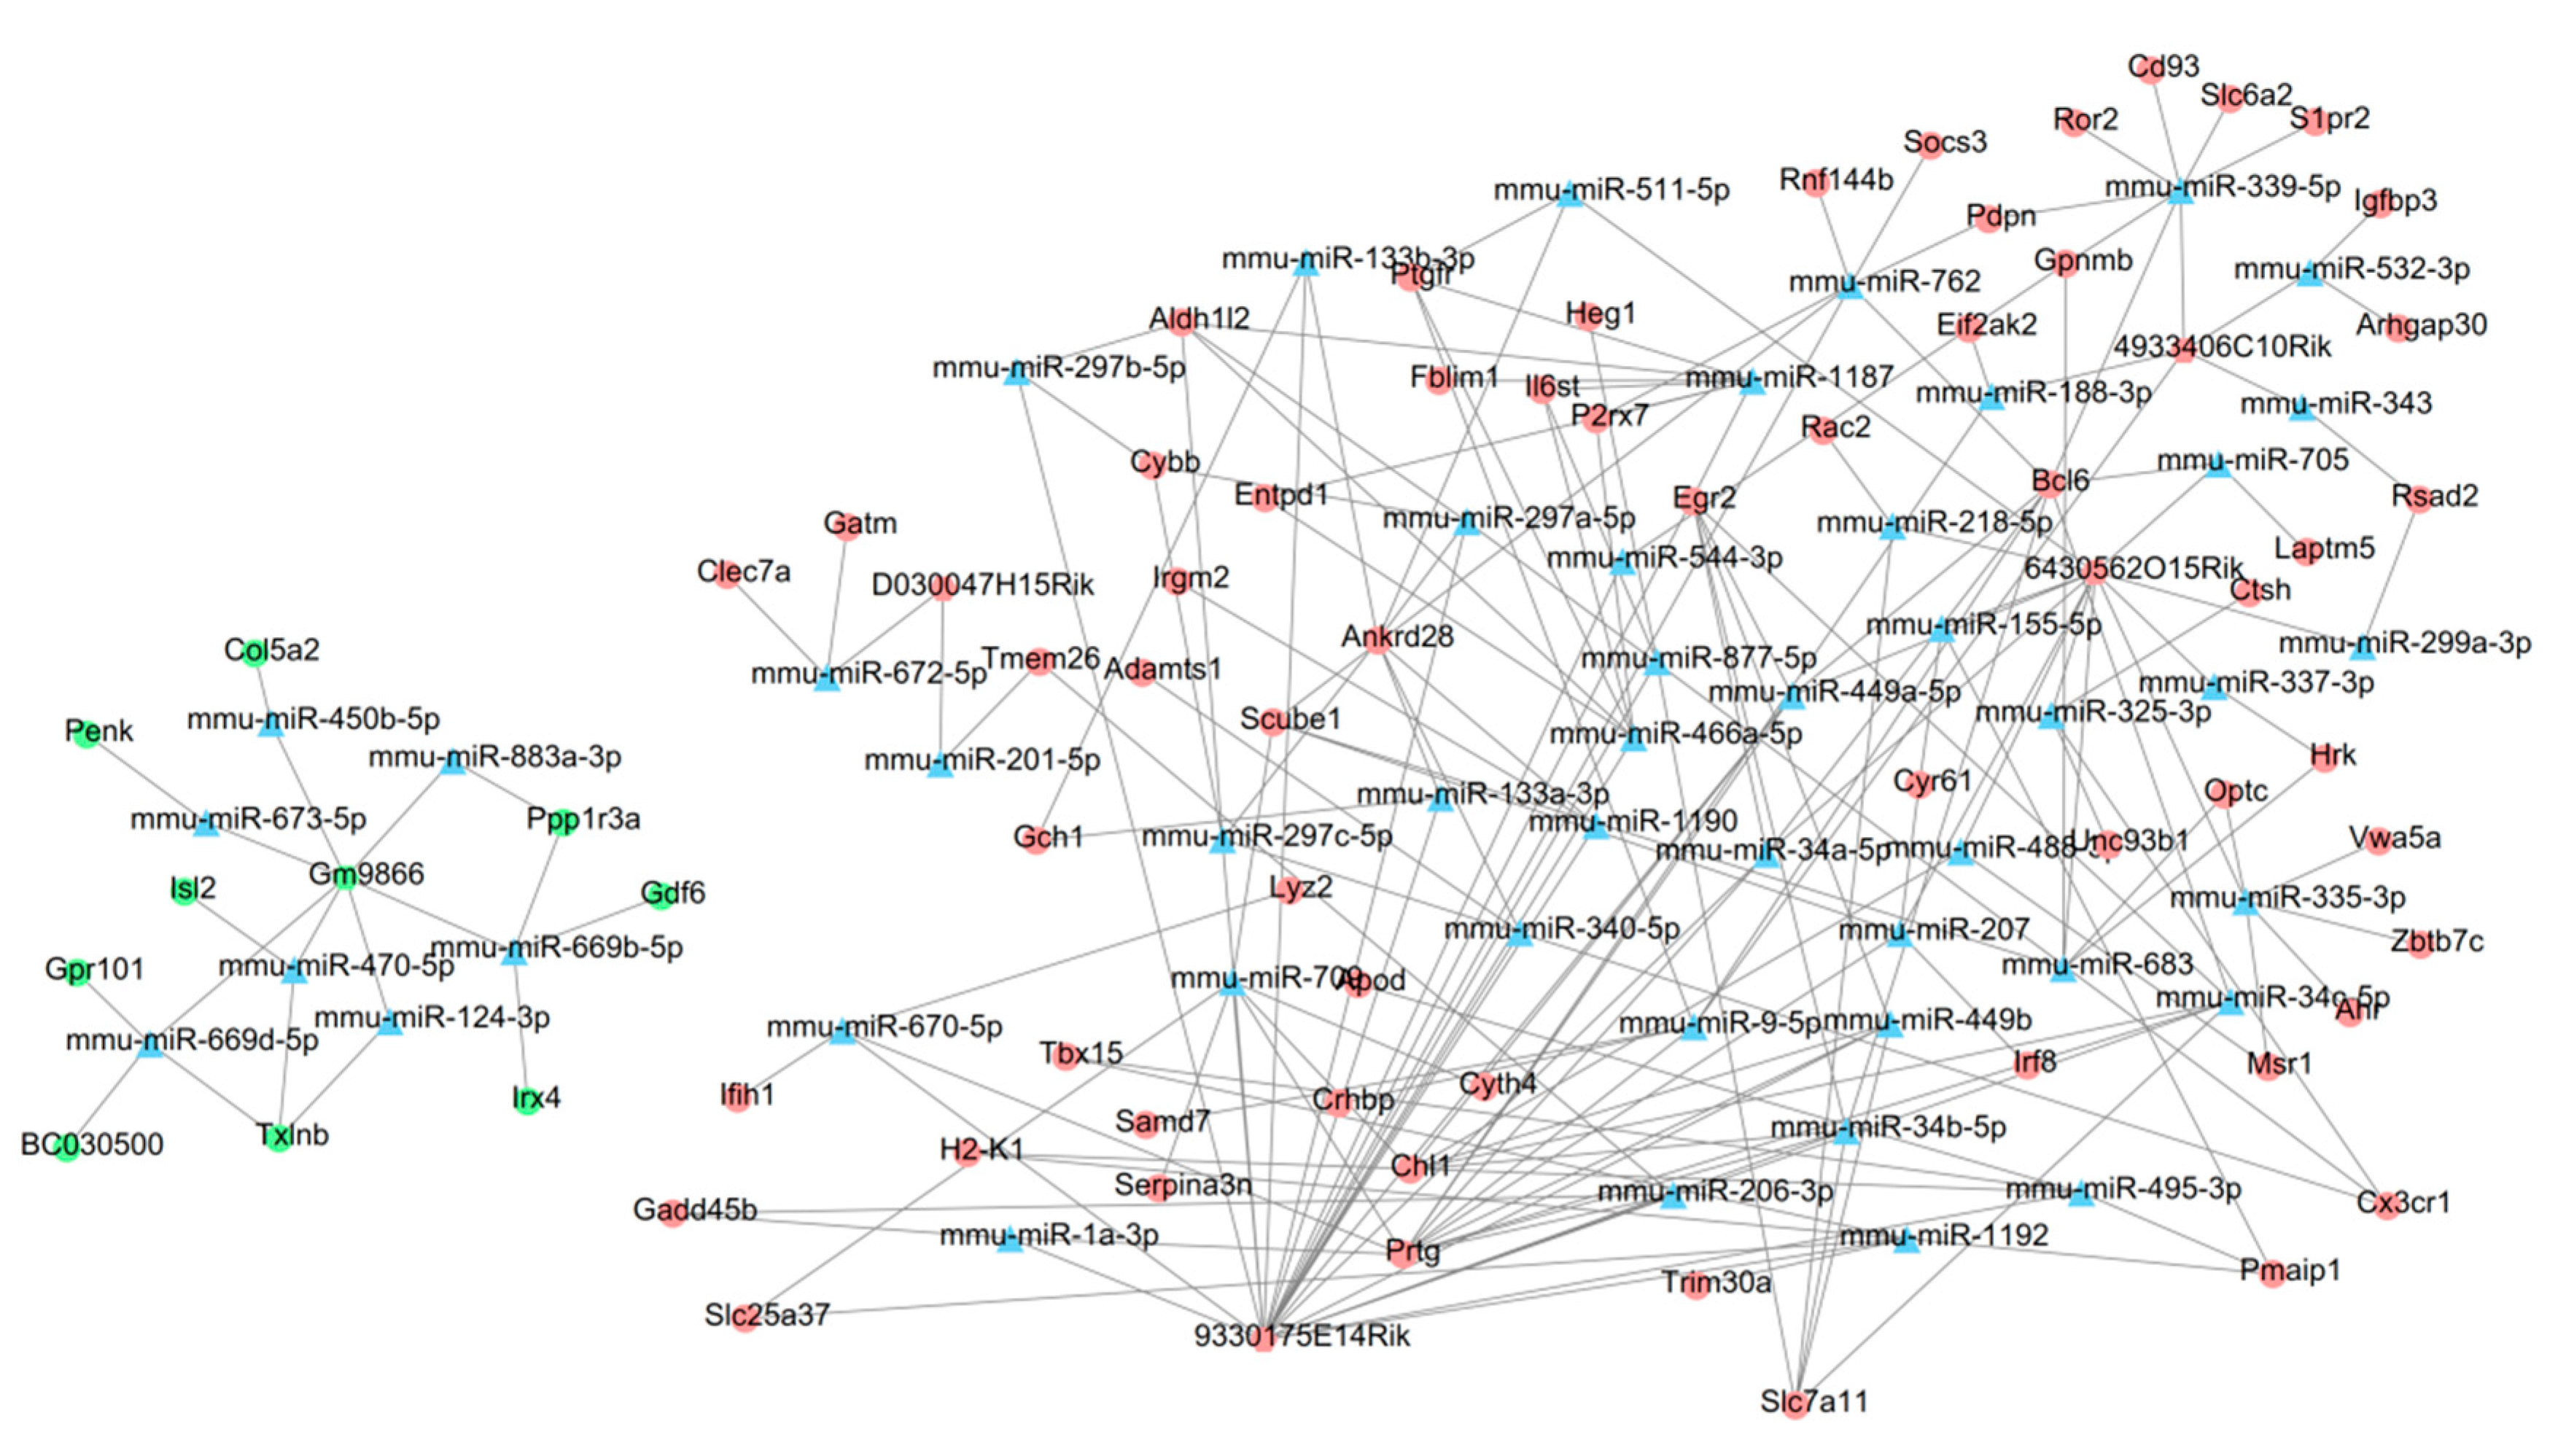
3.4. Construction of a ceRNA Network
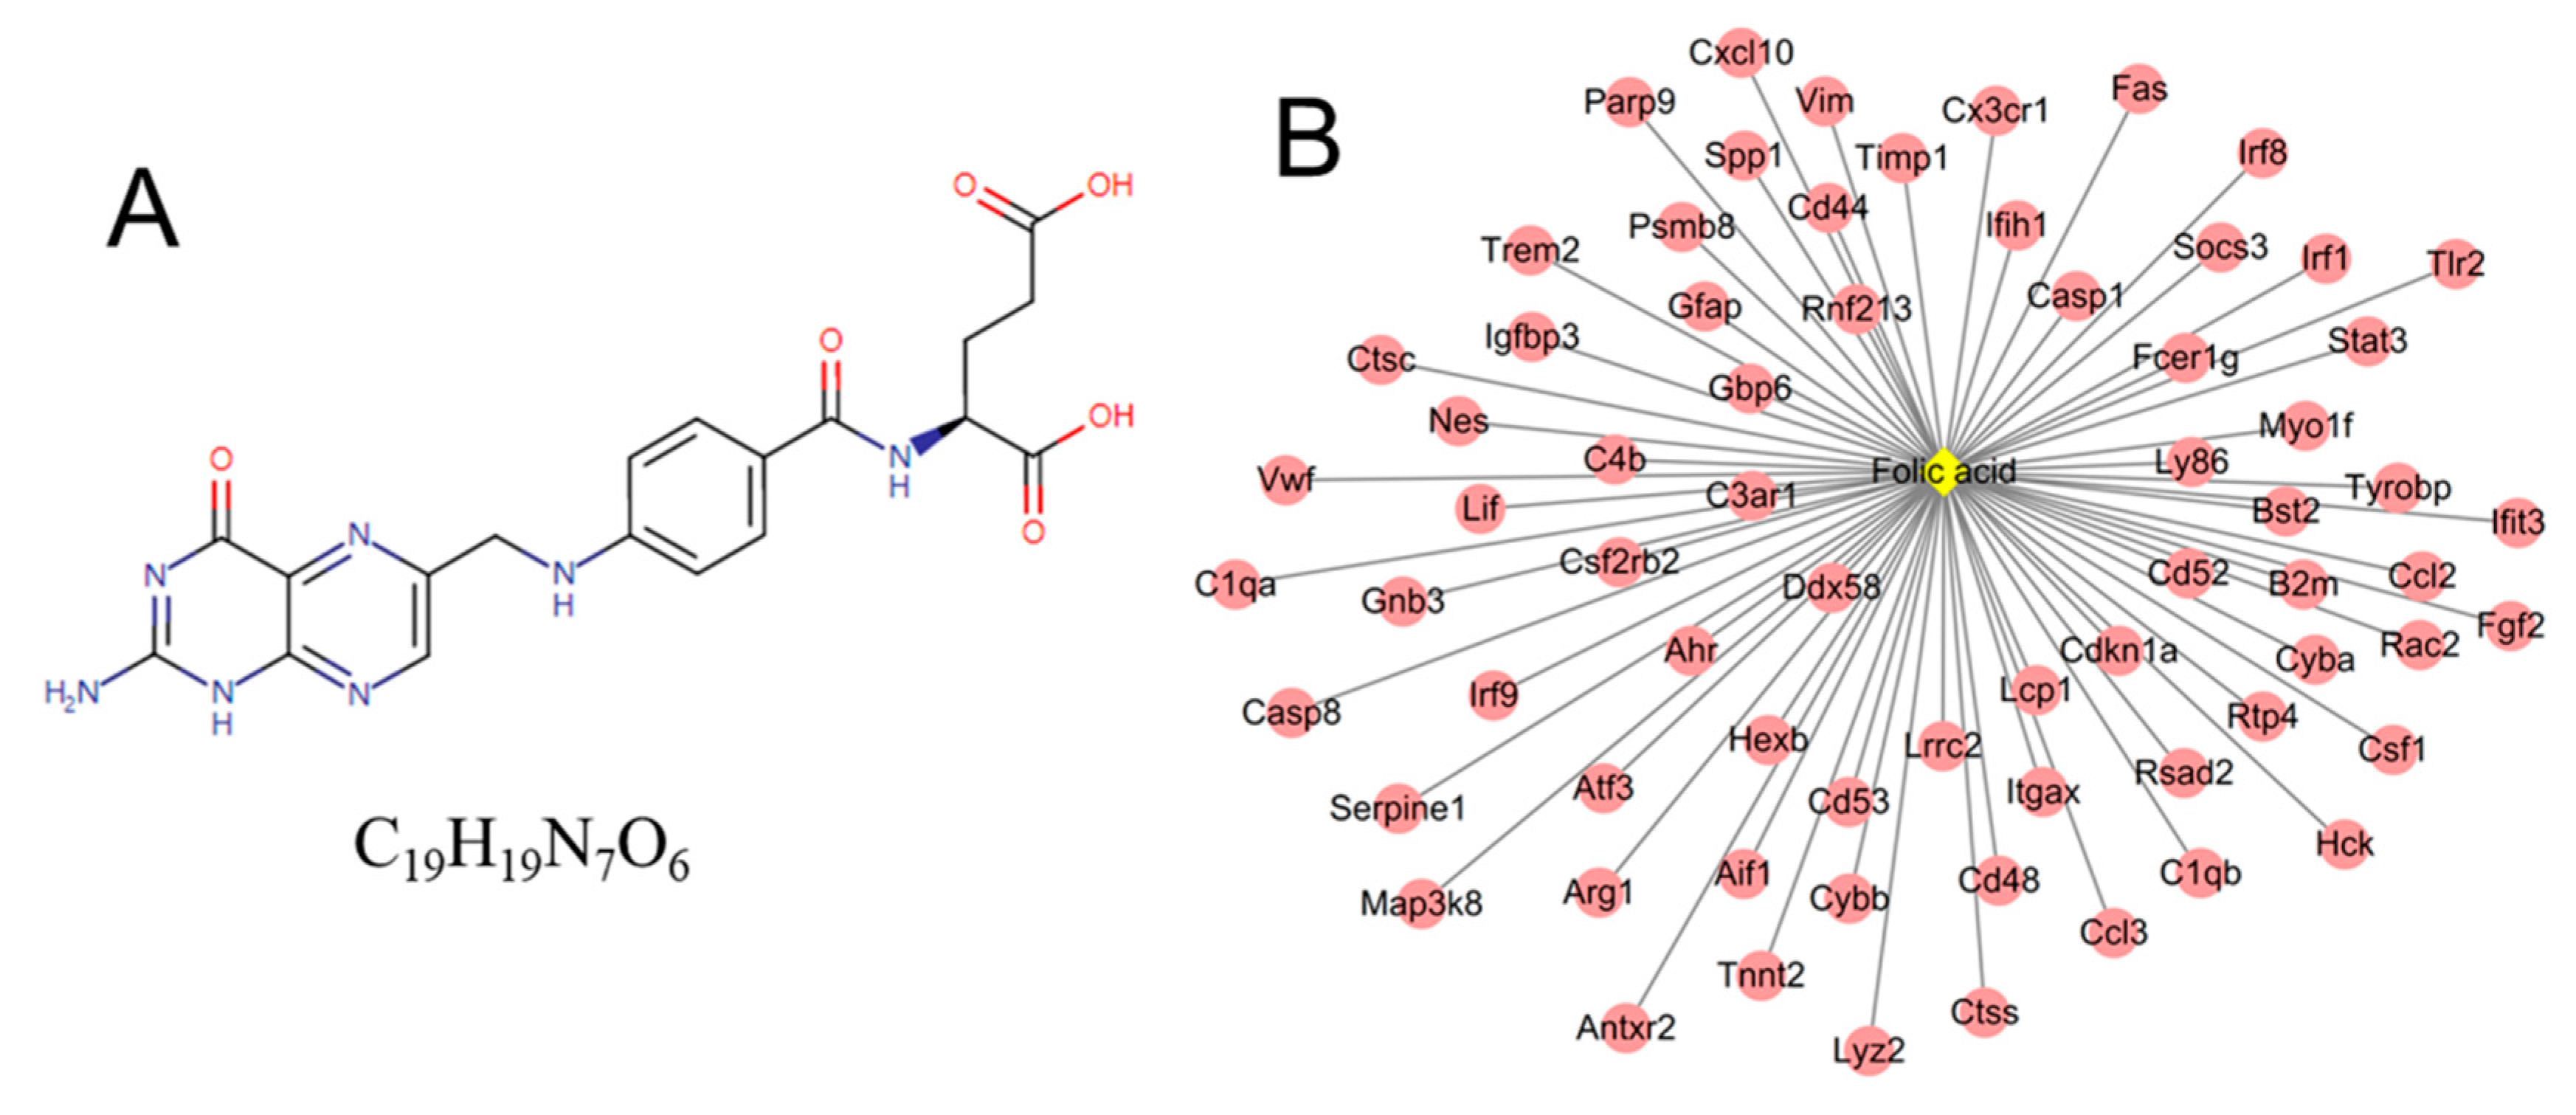
3.5. Identification of Small Molecule Drugs
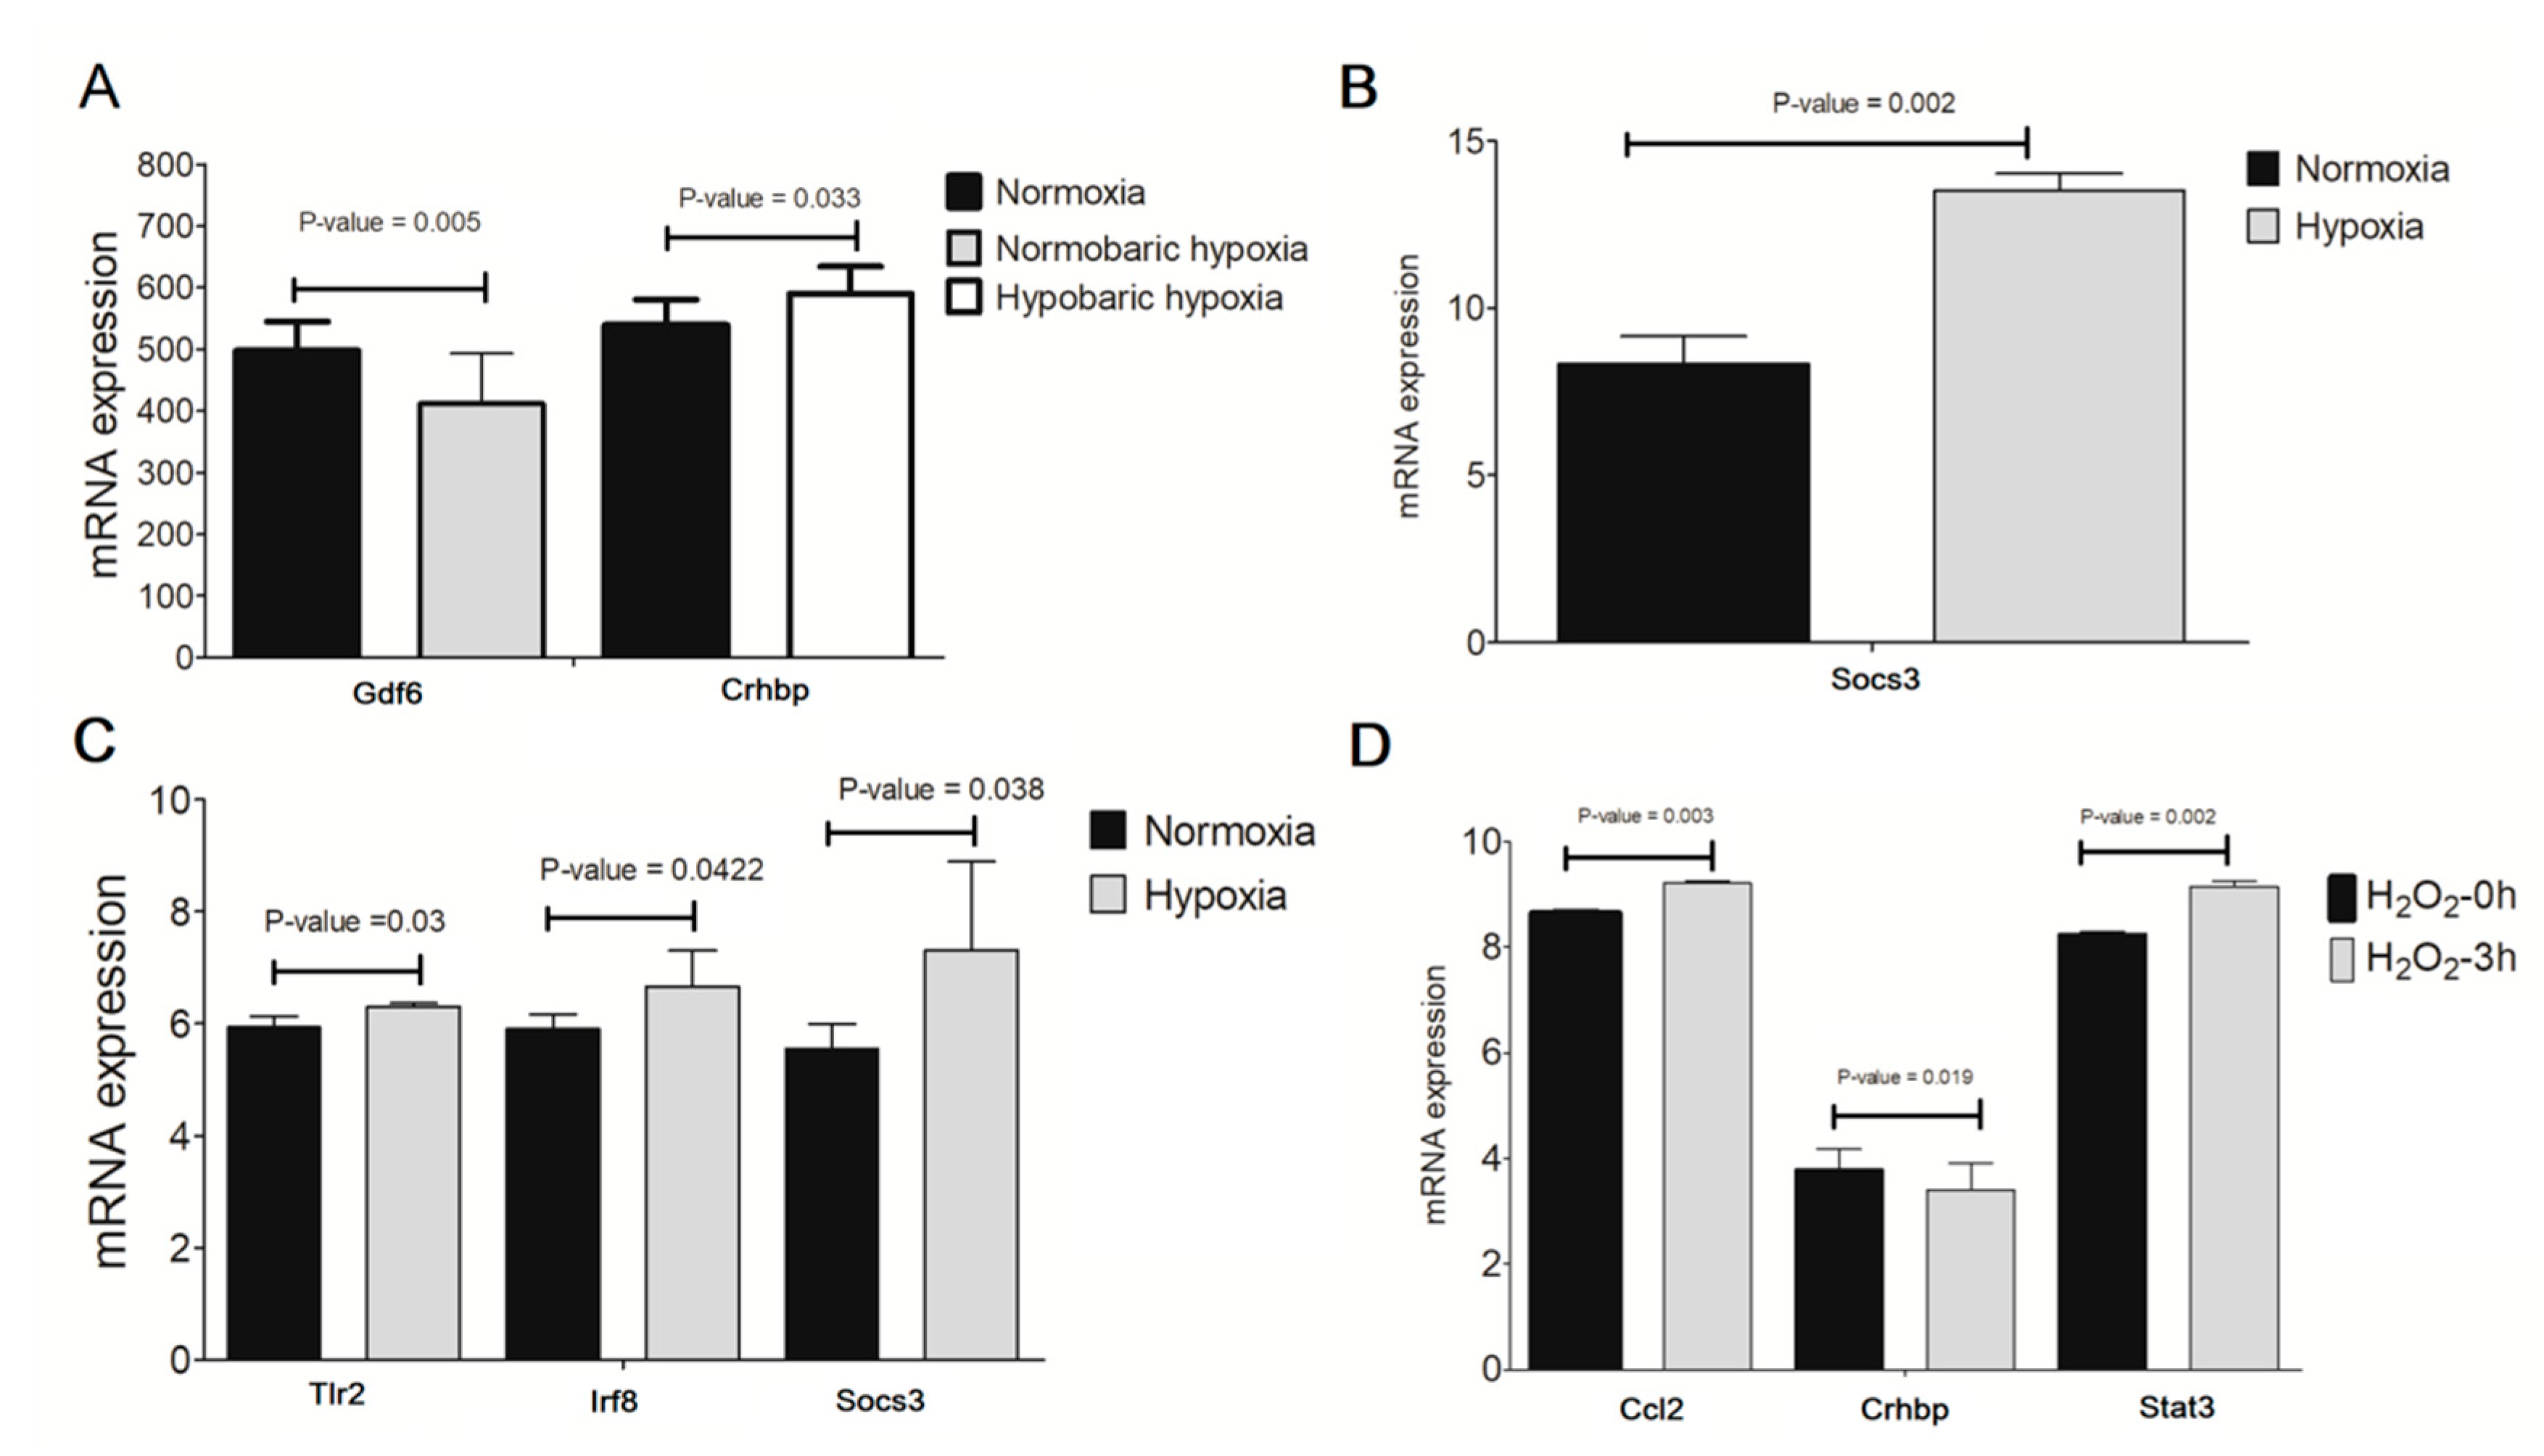
3.6. Validation of Crucial Genes in Hypoxia/H2O2-Induced Retinal Injury Models
4. Discussion
5. Conclusions
Author Contributions
Funding
Institutional Review Board Statement
Informed Consent Statement
Data Availability Statement
Conflicts of Interest
Abbreviations
| NPs | nanoparticles |
| Ag | silver |
| Au | gold |
| Si | silicate |
| IL | interleukin |
| TNF | tumor necrosis factor |
| TiO2 | titanium dioxide |
| NCBI | National Center for Biotechnology Information |
| GEO | Gene Expression Omnibus |
| PBS | phosphate buffer saline |
| PTC | presumptive therapeutic concentration |
| ONC | optic nerve crush |
| FC | fold change |
| DE-lncRNAs | differentially expressed long non-coding RNAs |
| DE-mRNAs | differentially expressed messenger RNAs |
| GO | Gene Ontology |
| KEGG | Kyoto Encyclopedia of Genes and Genomes |
| DAVID | Database for Annotation, Visualization and Integrated Discovery |
| PPI | Protein–protein interaction |
| DC | degree centrality |
| EC | eigenvector centrality |
| LAC | local average connectivity |
| BC | betweenness centrality |
| CC | closeness centrality |
| MCODE | Molecular Complex Detection |
| ceRNAs | competing endogenous RNAs |
| miRNAs | microRNAs |
| CMap | Connectivity Map |
| CTD | Comparative Toxicogenomics Database |
| SOCS3 | suppressor of cytokine signaling 3 |
| STAT3 | signal transducer and activator of transcription 3 |
| FAS | Fas cell surface death receptor |
| CASP1 | caspase 1 |
| CCL2 | C-C motif chemokine ligand 2 |
| CXCL10 | C-X-C motif chemokine ligand 10 |
| IRF8 | interferon regulatory factor 8 |
| SYK | spleen tyrosine kinase |
| TLR | toll-like receptor |
| GDF6 | growth differentiation factor 6 |
| CRHBP | corticotropin-releasing hormone-binding protein |
| NF-κB | nuclear factor κB |
References
- Mohajerani, A.; Burnett, L.; Smith, J.V.; Kurmus, H.; Milas, J.; Arulrajah, A.; Horpibulsuk, S.; Abdul Kadir, A. Nanoparticles in Construction Materials and Other Applications, and Implications of Nanoparticle Use. Materials 2019, 12, 3052. [Google Scholar] [CrossRef] [PubMed] [Green Version]
- Zhu, S.; Gong, L.; Li, Y.; Xu, H.; Gu, Z. Safety Assessment of Nanomaterials to Eyes: An Important but Neglected Issue. Adv. Sci. 2019, 6, 1802289. [Google Scholar] [CrossRef] [PubMed]
- Söderstjerna, E.; Bauer, P.; Cedervall, T.; Abdshill, H.; Johansson, F.; Johansson, U.E. Silver and gold nanoparticles exposure to in vitro cultured retina—Studies on nanoparticle internalization, apoptosis, oxidative stress, glial- and microglial activity. PLoS ONE 2014, 9, e105359. [Google Scholar] [CrossRef] [PubMed]
- Kalishwaralal, K.; Banumathi, E.; Ram Kumar Pandian, S.; Deepak, V.; Muniyandi, J.; Eom, S.H.; Gurunathan, S. Silver nanoparticles inhibit VEGF induced cell proliferation and migration in bovine retinal endothelial cells. Colloids Surf. B Biointerfaces 2009, 73, 51–57. [Google Scholar] [CrossRef]
- An, W.; Zhang, Y.; Zhang, X.; Li, K.; Kang, Y.; Akhtar, S.; Sha, X.; Gao, L. Ocular toxicity of reduced graphene oxide or graphene oxide exposure in mouse eyes. Exp. Eye Res. 2018, 174, 59–69. [Google Scholar] [CrossRef]
- Quan, J.H.; Gao, F.F.; Lee, M.; Yuk, J.M.; Cha, G.H.; Chu, J.Q.; Wang, H.; Lee, Y.H. Involvement of endoplasmic reticulum stress response and IRE1-mediated ASK1/JNK/Mcl-1 pathways in silver nanoparticle-induced apoptosis of human retinal pigment epithelial cells. Toxicology 2020, 442, 152540. [Google Scholar] [CrossRef]
- Guo, D.; Bi, H.; Liu, B.; Wu, Q.; Wang, D.; Cui, Y. Reactive oxygen species-induced cytotoxic effects of zinc oxide nanoparticles in rat retinal ganglion cells. Toxicol. Vitr. 2013, 27, 731–738. [Google Scholar] [CrossRef]
- Bose, K.; Lakshminarasimhan, H.; Sundar, K.; Kathiresan, T. Cytotoxic effect of ZnS nanoparticles on primary mouse retinal pigment epithelial cells. Artif. Cells Nanomed. Biotechnol. 2016, 44, 1764–1773. [Google Scholar] [CrossRef]
- Guo, D.; Bi, H.; Wu, Q.; Wang, D.; Cui, Y. Zinc oxide nanoparticles induce rat retinal ganglion cell damage through bcl-2, caspase-9 and caspase-12 pathways. J. Nanosci. Nanotechnol. 2013, 13, 3769–3777. [Google Scholar] [CrossRef]
- Wang, L.; Chen, C.; Guo, L.; Li, Q.; Ding, H.; Bi, H.; Guo, D. Zinc oxide nanoparticles induce murine photoreceptor cell death via mitochondria-related signaling pathway. Artif. Cells Nanomed. Biotechnol. 2018, 46, 1102–1113. [Google Scholar] [CrossRef]
- Zhao, G.; Sun, H.; Zhang, T.; Liu, J.X. Copper induce zebrafish retinal developmental defects via triggering stresses and apoptosis. Cell Commun. Signal. 2020, 18, 45. [Google Scholar] [CrossRef] [PubMed] [Green Version]
- Chen, X.; Zhu, S.; Hu, X. Toxicity and mechanism of mesoporous silica nanoparticles in eyes. Nanoscale 2020, 12, 13637–13653. [Google Scholar] [CrossRef] [PubMed]
- Ma, Y.; Li, P.; Zhao, L.; Liu, J.; Yu, J.; Huang, Y.; Zhu, Y.; Li, Z.; Zhao, R.; Hua, S.; et al. Size-Dependent Cytotoxicity and Reactive Oxygen Species of Cerium Oxide Nanoparticles in Human Retinal Pigment Epithelia Cells. Int. J. Nanomed. 2021, 16, 5333–5341. [Google Scholar] [CrossRef] [PubMed]
- Wu, W.; Yan, L.; Chen, S.; Li, Q.; Gu, Z.; Xu, H.; Yin, Z.Q. Investigating oxidation state-induced toxicity of PEGylated graphene oxide in ocular tissue using gene expression profiles. Nanotoxicology 2018, 12, 819–835. [Google Scholar] [CrossRef]
- Chan, Y.J.; Liao, P.L.; Tsai, C.H.; Cheng, Y.W.; Lin, F.L.; Ho, J.D.; Chen, C.Y.; Li, C.H. Titanium dioxide nanoparticles impair the inner blood-retinal barrier and retinal electrophysiology through rapid ADAM17 activation and claudin-5 degradation. Part. Fibre Toxicol. 2021, 18, 4. [Google Scholar] [CrossRef]
- Jo, D.H.; Kim, J.H.; Son, J.G.; Song, N.W.; Kim, Y.I.; Yu, Y.S.; Lee, T.G.; Kim, J.H. Anti-angiogenic effect of bare titanium dioxide nanoparticles on pathologic neovascularization without unbearable toxicity. Nanomedicine 2014, 10, 1109–1117. [Google Scholar] [CrossRef]
- Jo, D.H.; Kim, J.H.; Yu, Y.S.; Lee, T.G.; Kim, J.H. Antiangiogenic effect of silicate nanoparticle on retinal neovascularization induced by vascular endothelial growth factor. Nanomedicine 2012, 8, 784–791. [Google Scholar] [CrossRef]
- Wang, D.; Luo, M.; Huang, B.; Gao, W.; Jiang, Y.; Li, Q.; Nan, K. Localized co-delivery of CNTF and FK506 using a thermosensitive hydrogel for retina ganglion cells protection after traumatic optic nerve injury. Drug Deliv. 2020, 27, 556–564. [Google Scholar] [CrossRef]
- Zhang, X.H.; Feng, Z.H.; Wang, X.Y. The ROCK pathway inhibitor Y-27632 mitigates hypoxia and oxidative stress-induced injury to retinal Müller cells. Neural. Regen. Res. 2018, 13, 549–555. [Google Scholar]
- Chen, H.Y.; Ho, Y.J.; Chou, H.C.; Liao, E.C.; Tsai, Y.T.; Wei, Y.S.; Lin, L.H.; Lin, M.W.; Wang, Y.S.; Ko, M.L.; et al. TGF-β1 signaling protects retinal ganglion cells from oxidative stress via modulation of the HO-1/Nrf2 pathway. Chem. Biol. Interact. 2020, 331, 109249. [Google Scholar] [CrossRef]
- Cho, H.K.; Kim, S.; Lee, E.J.; Kee, C. Neuroprotective Effect of Ginkgo Biloba Extract Against Hypoxic Retinal Ganglion Cell Degeneration In Vitro and In Vivo. J. Med. Food 2019, 22, 771–778. [Google Scholar] [CrossRef] [PubMed]
- Yasuda, M.; Tanaka, Y.; Ryu, M.; Tsuda, S.; Nakazawa, T. RNA Sequence Reveals Mouse Retinal Transcriptome Changes Early after Axonal Injury. PLoS ONE 2014, 9, e93258. [Google Scholar] [CrossRef] [PubMed]
- Pita-Thomas, W.; Mahar, M.; Joshi, A.; Gan, D.; Cavalli, V. HDAC5 promotes optic nerve regeneration by activating the mTOR pathway. Exp. Neurol. 2019, 317, 271–283. [Google Scholar] [CrossRef] [PubMed]
- Chen, J.; Zhang, L.; Liu, L.; Yang, X.; Wu, F.; Gan, X.; Zhang, R.; He, Y.; Lv, Q.; Fu, H.; et al. Acupuncture Treatment Reverses Retinal Gene Expression Induced by Optic Nerve Injury via RNA Sequencing Analysis. Front. Integr. Neurosci. 2019, 13, 59. [Google Scholar] [CrossRef] [PubMed]
- Ebner, L.J.A.; Samardzija, M.; Storti, F.; Todorova, V.; Karademir, D.; Behr, J.; Simpson, F.; Thiersch, M.; Grimm, C. Transcriptomic analysis of the mouse retina after acute and chronic normobaric and hypobaric hypoxia. Sci. Rep. 2021, 11, 16666. [Google Scholar] [CrossRef]
- Li Calzi, S.; Shaw, L.C.; Moldovan, L.; Shelley, W.C.; Qi, X.; Racette, L.; Quigley, J.L.; Fortmann, S.D.; Boulton, M.E.; Yoder, M.C.; et al. Progenitor cell combination normalizes retinal vascular development in the oxygen-induced retinopathy (OIR) model. JCI Insight 2019, 4, e129224. [Google Scholar] [CrossRef] [Green Version]
- Love, M.I.; Huber, W.; Anders, S. Moderated estimation of fold change and dispersion for RNA-seq data with DESeq2. Genome Biol. 2014, 15, 550. [Google Scholar] [CrossRef] [Green Version]
- Huang, D.W.; Sherman, B.T.; Lempicki, R.A. Systematic and integrative analysis of large gene lists using DAVID bioinformatics resources. Nat. Protoc. 2009, 4, 44. [Google Scholar] [CrossRef]
- Szklarczyk, D.; Franceschini, A.; Wyder, S.; Forslund, K.; Heller, D.; Huerta-Cepas, J.; Simonovic, M.; Roth, A.; Santos, A.; Tsafou, K.P. STRING v10: Protein-protein interaction networks, integrated over the tree of life. Nucleic Acids Res. 2015, 43, D447. [Google Scholar] [CrossRef]
- Tang, Y.; Li, M.; Wang, J.; Pan, Y.; Wu, F.X. CytoNCA: A cytoscape plugin for centrality analysis and evaluation of protein interaction networks. Biosystems 2015, 127, 67–72. [Google Scholar] [CrossRef]
- Qin, C.; Sun, Y.; Dong, Y. A New Method for Identifying Essential Proteins Based on Network Topology Properties and Protein Complexes. PLoS ONE 2016, 11, e0161042. [Google Scholar] [CrossRef] [PubMed] [Green Version]
- Bader, G.D.; Hogue, C.W. An automated method for finding molecular complexes in large protein interaction networks. BMC Bioinform. 2003, 4, 2. [Google Scholar] [CrossRef] [PubMed] [Green Version]
- Thomson, D.W.; Dinger, M.E. Endogenous microRNA sponges: Evidence and controversy. Nat. Rev. Genet. 2016, 17, 272–283. [Google Scholar] [CrossRef] [PubMed]
- Paraskevopoulou, M.D.; Georgakilas, G.; Kostoulas, N.; Reczko, M.; Maragkakis, M.; Dalamagas, T.M.; Hatzigeorgiou, A.G. DIANA-LncBase: Experimentally verified and computationally predicted microRNA targets on long non-coding RNAs. Nucleic Acids Res. 2013, 41, D239. [Google Scholar] [CrossRef] [PubMed]
- Dweep, H.; Gretz, N. MiRWalk2. 0: A comprehensive atlas of microRNA-target interactions. Nat. Methods 2016, 12, 697. [Google Scholar] [CrossRef]
- Han, J.Y.; Kang, B.; Eom, Y.; Kim, H.M.; Song, J.S. Comparing the Effects of Particulate Matter on the Ocular Surfaces of Normal Eyes and a Dry Eye Rat Model. Cornea 2017, 36, 605–610. [Google Scholar] [CrossRef]
- Eom, Y.; Song, J.S.; Lee, H.K.; Kang, B.; Kim, H.C.; Lee, H.K.; Kim, H.M. The Effect of Ambient Titanium Dioxide Microparticle Exposure to the Ocular Surface on the Expression of Inflammatory Cytokines in the Eye and Cervical Lymph Nodes. Investig. Ophthalmol. Vis. Sci. 2016, 57, 6580–6590. [Google Scholar] [CrossRef] [Green Version]
- Diebold, Y.; Calonge, M. Applications of nanoparticles in ophthalmology. Prog. Retin. Eye Res. 2010, 29, 596–609. [Google Scholar] [CrossRef]
- Mak, H.K.; Ng, S.H.; Ren, T.; Ye, C.; Leung, C.K. Impact of PTEN/SOCS3 deletion on amelioration of dendritic shrinkage of retinal ganglion cells after optic nerve injury. Exp. Eye Res. 2020, 192, 107938. [Google Scholar] [CrossRef]
- Smith, P.D.; Sun, F.; Park, K.K.; Cai, B.; Wang, C.; Kuwako, K.; Martinez-Carrasco, I.; Connolly, L.; He, Z. SOCS3 deletion promotes optic nerve regeneration in vivo. Neuron 2009, 64, 617–623. [Google Scholar] [CrossRef] [Green Version]
- Hellström, M.; Muhling, J.; Ehlert, E.M.; Verhaagen, J.; Pollett, M.A.; Hu, Y.; Harvey, A.R. Negative impact of rAAV2 mediated expression of SOCS3 on the regeneration of adult retinal ganglion cell axons. Mol. Cell Neurosci. 2011, 46, 507–515. [Google Scholar] [CrossRef] [PubMed]
- Sun, F.; Park, K.K.; Belin, S.; Wang, D.; Lu, T.; Chen, G.; Zhang, K.; Yeung, C.; Feng, G.; Yankner, B.A.; et al. Sustained axon regeneration induced by co-deletion of PTEN and SOCS3. Nature 2011, 480, 372–375. [Google Scholar] [CrossRef] [PubMed] [Green Version]
- Chen, P.; Miao, Y.; Yan, P.; Wang, X.J.; Jiang, C.; Lei, Y. MiR-455-5p ameliorates HG-induced apoptosis, oxidative stress and inflammatory via targeting SOCS3 in retinal pigment epithelial cells. J. Cell Physiol. 2019, 234, 21915–21924. [Google Scholar] [CrossRef] [PubMed]
- Jiang, Y.; Zhang, Q.; Soderland, C.; Steinle, J.J. TNFα and SOCS3 regulate IRS-1 to increase retinal endothelial cell apoptosis. Cell Signal. 2012, 24, 1086–1092. [Google Scholar] [CrossRef] [Green Version]
- Marrero, B.; He, C.; Oh, H.M.; Ukwu, U.T.; Yu, C.R.; Dambuza, I.M.; Sun, L.; Egwuagu, C.E. Persistent Activation of STAT3 Pathway in the Retina Induced Vision Impairment and Retinal Degenerative Changes in Ageing Mice. Adv. Exp. Med. Biol. 2019, 1185, 353–358. [Google Scholar]
- Hong, J.; Wang, L.; Zhao, X.; Yu, X.; Sheng, L.; Xu, B.; Liu, D.; Zhu, Y.; Long, Y.; Hong, F. Th2 factors may be involved in TiO2 NP-induced hepatic inflammation. J. Agric. Food Chem. 2014, 62, 6871–6878. [Google Scholar] [CrossRef]
- Xiao, J.; Yao, J.; Jia, L.; Lin, C.; Zacks, D.N. Protective Effect of Met12, a Small Peptide Inhibitor of Fas, on the Retinal Pigment Epithelium and Photoreceptor After Sodium Iodate Injury. Investig. Ophthalmol. Vis. Sci. 2017, 58, 1801–1810. [Google Scholar] [CrossRef] [Green Version]
- Arai, J.; Katai, N.; Kuida, K.; Kikuchi, T.; Yoshimura, N. Decreased retinal neuronal cell death in caspase-1 knockout mice. Jpn. J. Ophthalmol. 2006, 50, 417–425. [Google Scholar] [CrossRef]
- Huang, R.; Lan, Q.; Chen, L.; Zhong, H.; Cui, L.; Jiang, L.; Huang, H.; Li, L.; Zeng, S.; Li, M.; et al. CD200Fc Attenuates Retinal Glial Responses and RGCs Apoptosis After Optic Nerve Crush by Modulating CD200/CD200R1 Interaction. J. Mol. Neurosci. 2018, 64, 200–210. [Google Scholar] [CrossRef]
- Ha, Y.; Liu, H.; Zhu, S.; Yi, P.; Liu, W.; Nathanson, J.; Kayed, R.; Loucas, B.; Sun, J.; Frishman, L.J.; et al. Critical Role of the CXCL10/C-X-C Chemokine Receptor 3 Axis in Promoting Leukocyte Recruitment and Neuronal Injury during Traumatic Optic Neuropathy Induced by Optic Nerve Crush. Am. J. Pathol. 2017, 187, 352–365. [Google Scholar] [CrossRef] [Green Version]
- Kim, S.H.; Burton, J.; Yu, C.R.; Sun, L.; He, C.; Wang, H.; Morse, H.C., 3rd; Egwuagu, C.E. Dual Function of the IRF8 Transcription Factor in Autoimmune Uveitis: Loss of IRF8 in T Cells Exacerbates Uveitis, Whereas Irf8 Deletion in the Retina Confers Protection. J. Immunol. 2015, 195, 1480–1488. [Google Scholar] [CrossRef] [PubMed] [Green Version]
- Zhou, T.; Huang, Z.; Zhu, X.; Sun, X.; Liu, Y.; Cheng, B.; Li, M.; Liu, Y.; He, C.; Liu, X. Alpha-1 Antitrypsin Attenuates M1 Microglia-Mediated Neuroinflammation in Retinal Degeneration. Front. Immunol. 2018, 9, 1202. [Google Scholar] [CrossRef] [PubMed]
- Sun, X.; Sun, P.; Liu, L.; Jiang, P.; Li, Y. Ferulic acid attenuates microglia-mediated neuroinflammation in retinal degeneration. BMC Ophthalmol. 2021, 21, 13. [Google Scholar] [CrossRef] [PubMed]
- Liu, X.; Xu, B.; Gao, S. Spleen Tyrosine Kinase Mediates Microglial Activation in Mice with Diabetic Retinopathy. Transl. Vis. Sci. Technol. 2021, 10, 20. [Google Scholar] [CrossRef] [PubMed]
- Ishizuka, F.; Shimazawa, M.; Inoue, Y.; Nakano, Y.; Ogishima, H.; Nakamura, S.; Tsuruma, K.; Tanaka, H.; Inagaki, N.; Hara, H. Toll-like receptor 4 mediates retinal ischemia/reperfusion injury through nuclear factor-κB and spleen tyrosine kinase activation. Investig. Ophthalmol. Vis. Sci. 2013, 54, 5807–5816. [Google Scholar] [CrossRef] [PubMed]
- Cui, Y.; Liu, H.; Zhou, M.; Duan, Y.; Li, N.; Gong, X.; Hu, R.; Hong, M.; Hong, F. Signaling pathway of inflammatory responses in the mouse liver caused by TiO2 nanoparticles. J. Biomed. Mater. Re. A. 2011, 96, 221–229. [Google Scholar] [CrossRef]
- Hong, F.; Wang, Y.; Zhou, Y.; Zhang, Q.; Ge, Y.; Chen, M.; Hong, J.; Wang, L. Exposure to TiO2 Nanoparticles Induces Immunological Dysfunction in Mouse Testitis. J. Agric. Food Chem. 2016, 64, 346–355. [Google Scholar] [CrossRef]
- Kim, A.S.; Chae, C.H.; Kim, J.; Choi, J.Y.; Kim, S.G.; Băciut, G. Silver nanoparticles induce apoptosis through the toll-like receptor 2 pathway. Oral Surg. Oral Med. Oral Pathol. Oral Radiol. 2012, 113, 789–798. [Google Scholar] [CrossRef]
- Roy, R.; Kumar, D.; Sharma, A.; Gupta, P.; Chaudhari, B.P.; Tripathi, A.; Das, M.; Dwivedi, P.D. ZnO nanoparticles induced adjuvant effect via toll-like receptors and Src signaling in Balb/c mice. Toxicol. Lett. 2014, 230, 421–433. [Google Scholar] [CrossRef]
- Hanel, M.L.; Hensey, C. Eye and neural defects associated with loss of GDF6. BMC Dev. Biol. 2006, 6, 43. [Google Scholar] [CrossRef] [Green Version]
- Yang, K.; Xiao, Y.; Xu, T.; Yu, W.; Ruan, Y.; Luo, P.; Cheng, F. Integrative analysis reveals CRHBP inhibits renal cell carcinoma progression by regulating inflammation and apoptosis. Cancer Gene Ther. 2020, 27, 607–618. [Google Scholar] [CrossRef] [PubMed]
- Zhang, J.; Feng, C.; Song, C.; Ai, B.; Bai, X.; Liu, Y.; Li, X.; Zhao, J.; Shi, S.; Chen, X.; et al. Identification and analysis of a key long non-coding RNAs (lncRNAs)-associated module reveal functional lncRNAs in cardiac hypertrophy. J. Cell Mol. Med. 2018, 22, 892–903. [Google Scholar] [CrossRef] [PubMed] [Green Version]
- Gao, H.; Ni, N.; Zhang, D.; Wang, Y.; Tang, Z.; Sun, N.; Ju, Y.; Dai, X.; Zhang, Y.; Liu, Y.; et al. MiR-762 regulates the proliferation and differentiation of retinal progenitor cells by targeting NPDC1. Cell Cycle 2020, 19, 1754–1767. [Google Scholar] [CrossRef] [PubMed]
- Tao, J.; Liu, W.; Shang, G.; Zheng, Y.; Huang, J.; Lin, R.; Chen, L. MiR-207/352 regulate lysosomal-associated membrane proteins and enzymes following ischemic stroke. Neuroscience 2015, 305, 1–14. [Google Scholar] [CrossRef]
- Chi, L.; Jiao, D.; Nan, G.; Yuan, H.; Shen, J.; Gao, Y. MiR-9-5p attenuates ischemic stroke through targeting ERMP1-mediated endoplasmic reticulum stress. Acta Histochem. 2019, 121, 151438. [Google Scholar] [CrossRef]
- Li, C.; Wang, X.; Yuan, F.; Zhao, Z.; Zhang, B.; Zhang, J.; Li, W.; Liu, T. MiR-669b-3p regulates CD4+ T cell function by down-regulating indoleamine-2, 3-dioxygenase. Transpl. Immunol. 2020, 62, 101320. [Google Scholar] [CrossRef]
- Muralidharan, P.; Sarmah, S.; Marrs, J.A. Zebrafish retinal defects induced by ethanol exposure are rescued by retinoic acid and folic acid supplement. Alcohol 2015, 49, 149–163. [Google Scholar] [CrossRef] [Green Version]
- Iskandar, B.J.; Nelson, A.; Resnick, D.; Skene, J.H.; Gao, P.; Johnson, C.; Cook, T.D.; Hariharan, N. Folic acid supplementation enhances repair of the adult central nervous system. Ann. Neurol. 2004, 56, 221–227. [Google Scholar] [CrossRef]
- Ma, J.; Zhen, X.; Huang, X.; Jiang, X. Folic acid supplementation repressed hypoxia-induced inflammatory response via ROS and JAK2/STAT3 pathway in human promyelomonocytic cells. Nutr. Res. 2018, 53, 40–50. [Google Scholar] [CrossRef]
- Cui, S.; Li, W.; Lv, X.; Wang, P.; Gao, Y.; Huang, G. Folic Acid Supplementation Delays Atherosclerotic Lesion Development by Modulating MCP1 and VEGF DNA Methylation Levels In Vivo and In Vitro. Int. J. Mol. Sci. 2017, 18, 990. [Google Scholar] [CrossRef] [Green Version]
- Long, Q.; Huang, Y.; Shang, J.; Liu, Y.; Chen, C. Black Carbon Induces Cytotoxicity and NLRP3 Inflammasome Activation in Human Corneal Epithelial Cells. Curr. Eye Res. 2020, 45, 680–685. [Google Scholar] [CrossRef] [PubMed]
- Wu, W.; Yan, L.; Wu, Q.; Li, Y.; Li, Q.; Chen, S.; Yang, Y.; Gu, Z.; Xu, H.; Yin, Z.Q. Evaluation of the toxicity of graphene oxide exposure to the eye. Nanotoxicology 2016, 10, 1329–1340. [Google Scholar] [CrossRef] [PubMed]


| Treatment | Gene Symbol | GSE49048 | GSE55228 | GSE120257 | GSE131486 | ||||
|---|---|---|---|---|---|---|---|---|---|
| Log2FC | p-Value | Log2FC | p-Value | Log2FC | p-Value | Log2FC | p-Value | ||
| TiO2 vs. control (PTC) | Gm9866 | −0.50 | 3.94 × 10² | −0.57 | 2.74 × 10² | ||||
| Cx3cr1 | 1.44 | 3.97 × 10² | 0.85 | 6.09 × 10¹³ | 0.62 | 1.47 × 10² | |||
| Stat3 | 1.00 | 2.98 × 10² | 1.04 | 4.73 × 1051 | 0.63 | 2.83 × 10² | |||
| Aif1 | 1.35 | 4.44 × 10² | 0.78 | 1.90 × 10⁶ | |||||
| Cxcl9 | 0.65 | 3.49 × 10² | 0.91 | 4.91 × 10¹¹ | |||||
| TiO2 vs. control (100 PTC) | 6430562O15Rik | 0.54 | 1.32 × 10³ | 0.77 | 1.04 × 10⁷ | ||||
| 9330175E14Rik | 1.24 | 3.92 × 10² | 0.62 | 3.30 × 10⁶ | |||||
| Tlr2 | 1.08 | 1.60 × 10³ | 2.38 | 1.55 × 10³ | 1.14 | 3.06 × 10¹² | 1.54 | 4.20 × 10² | |
| C1qa | 1.44 | 1.59 × 10³ | 0.64 | 5.26 × 10³ | 1.73 | 5.75 × 1051 | |||
| Cx3cr1 | 1.16 | 4.06 × 10³ | 0.85 | 6.09 × 10¹³ | 0.62 | 1.47 × 10² | |||
| Irf1 | 0.66 | 2.83 × 10² | 1.25 | 5.84 × 1030 | 0.57 | 1.01 × 10² | |||
| Irf8 | 1.39 | 6.97 × 10⁴ | 1.05 | 3.01 × 10¹³ | 1.07 | 4.07 × 10³ | |||
| Cxcl10 | 2.43 | 8.73 × 10³ | 1.39 | 4.11 × 10¹⁸ | 1.90 | 1.31 × 10² | |||
| Socs3 | 1.36 | 1.3 × 10⁴ | 1.61 | 3.81 × 1038 | 1.08 | 2.43 × 10² | |||
| Ccl2 | 1.60 | 3.24 × 10³ | 5.63 | 7.48 × 10³ | |||||
| Stat3 | 1.03 | 9.11 × 10⁴ | 1.04 | 4.73 × 1051 | 0.63 | 2.83 × 10² | |||
| Ifih1 | 0.91 | 1.10× 10² | 0.73 | 7.64 × 10⁴ | |||||
| Aif1 | 1.17 | 8.88 × 10³ | 0.78 | 1.90 × 10⁶ | |||||
| Fas | 1.00 | 9.77 × 10³ | 0.70 | 1.63 × 10⁵ | |||||
| Casp1 | 1.19 | 3.2 × 10⁴ | 0.56 | 7.35 × 10⁵ | |||||
| Cxcl9 | 0.61 | 1.37 × 10³ | 0.91 | 4.91 × 10¹¹ | |||||
| Pou4f1 | −0.62 | 1.00× 10² | −0.70 | 2.27 × 10⁷ | −1.50 | 3.19 × 1055 | −1.48 | 1.78 × 10¹⁰ | |
| Au20 vs. control | 4933406C10Rik | 0.73 | 3.32× 10² | 0.96 | 9.35 × 10³ | ||||
| Crhbp | 1.22 | 4.29× 10² | 0.61 | 2.44 × 10² | |||||
| Gdf6 | −0.98 | 1.20 × 10³ | −1.14 | 4.97 × 10² | |||||
| Au100 vs. control | 4933406C10Rik | 0.74 | 385× 102 | 0.96 | 9.35 × 10³ | ||||
| Crhbp | 2.10 | 3.40× 10² | 0.61 | 2.44 × 10² | |||||
| D030047H15Rik | 0.56 | 5.06 × 10³ | 0.87 | 2.08 × 10² | |||||
| Si20 vs. control | 4933406C10Rik | 0.61 | 1.60× 10² | 0.96 | 9.35 × 10³ | ||||
| Crhbp | 1.74 | 2.73× 10² | 0.61 | 2.44 × 10² | |||||
| Term | p-Value | Genes |
|---|---|---|
| GO:0002376~immune system process | 3.04 × 1027 | IFITM3, H2-T23, SPON2, CD84, CSF1, H2-K1, AHR, IFI30, IFIT1, IFIT3, IFIH1, MAP3K8, LGALS9, JAK3, B2M, OASL2, HERC6, RSAD2, SYK, DDX58, TAP1, FCGR1, NAIP2, HCK, IRF1, SERPING1, H2-D1, TLR13, TLR2, TRIM56, C1QB, C1QA, UNC93B1, H2-Q7, NLRC5, ZC3HAV1, INPP5D, C1RA, LY86, EIF2AK2, IRGM1, PSMB8, PSMB9, BST2, BCL6, AXL, MYO1G, C1QC |
| GO:0045087~innate immune response | 7.54 × 10²² | IFITM3, C1QB, SPON2, C1QA, CD84, CSF1, UNC93B1, NLRC5, OAS1A, TREM2, ZC3HAV1, IFIT1, IFIT3, IFIH1, C4B, CLEC7A, JAK3, TRIM21, B2M, HERC6, OASL2, C1RA, FCER1G, RSAD2, SYK, DDX58, LY86, CYBB, IRGM1, EIF2AK2, CYBA, BST2, FCGR1, NAIP2, HCK, TYROBP, AXL, IRF1, SERPING1, TLR13, TLR2, C1QC, TRIM56 |
| GO:0006954~inflammatory response | 5.15 × 10¹⁴ | PTGFR, CCL12, CALCA, CXCL9, NCF1, CSF1, CXCL1, AIF1, PTGS1, C4B, CRHBP, CLEC7A, STAB1, SPP1, CCL3, C3AR1, CCL2, SLC11A1, LY86, CYBB, CYBA, TNFRSF1B, TNFRSF1A, P2RX7, CXCL10, NAIP2, HCK, BCL6, TNIP2, AXL, FAS, TLR13, TLR2 |
| GO:0051607~defense response to virus | 5.61 × 10¹⁴ | APOBEC1, IFITM3, SPON2, CXCL9, RSAD2, UNC93B1, DDX58, NLRC5, EIF2AK2, OAS1A, ZC3HAV1, DDX60, IFIT1, IFIT3, IFIH1, BST2, CXCL10, IRF1, ITGAX, PMAIP1, TRIM56, OASL2 |
| GO:0009615~response to virus | 2.52 × 10¹² | IFITM3, RSAD2, DDX58, EIF2AK2, OAS1A, ZC3HAV1, DDX60, IFIT1, IFIT3, IFIH1, BST2, CXCL10, BCL3, TLR13, OASL2 |
| GO:0035458~cellular response to interferon-beta | 2.65 × 10⁹ | GBP6, IFI204, IRF1, IFI203, IGTP, IRGM2, IRGM1, IFIT1, GBP2, IFIT3, GBP3 |
| GO:0032496~response to lipopolysaccharide | 4.44 × 10⁹ | SPON2, PTGFR, CEBPB, CXCL9, GCH1, SLC11A1, EIF2AK2, CXCL1, TNFRSF1B, LITAF, TNFRSF1A, P2RX7, CXCL10, CASP8, PENK, CASP1, ACP5, FAS, LGALS9, TLR2 |
| GO:0050830~defense response to Gram-positive bacterium | 1.53 × 10⁸ | GBP6, H2-T23, GBP7, NCF1, GBP9, LYZ2, P2RX7, HCK, ACP5, GBP2, B2M, MYO1F, TLR2, GBP3 |
| GO:0042832~defense response to protozoan | 5.00 × 10⁸ | GBP6, GBP7, GBP9, SLC11A1, BCL3, IRGM2, IRF8, GBP2, GBP3 |
| GO:0071222~cellular response to lipopolysaccharide | 6.62 × 10⁸ | CX3CR1, GBP6, SPON2, CEBPB, ARG1, SERPINE1, TNFRSF1B, LITAF, ICAM1, CXCL10, SBNO2, PLSCR2, FCGR4, TNIP2, AXL, CCL2, IRF8, GBP2, B2M |
| GO:0006955~immune response | 1.68 × 10⁷ | CCL12, CXCL9, H2-K1, LIF, CXCL1, TNFRSF1B, CTSS, VAV1, TNFRSF1A, CXCL10, BLNK, CCL3, CCL2, FAS, IRF8, LCP2, FCGR2B, B2M, H2-D1, TLR2, OASL2 |
| GO:0044406~adhesion of symbiont to host | 2.44 × 10⁷ | GBP6, GBP7, GBP9, GBP2, ICAM1, GBP3 |
| GO:0071346~cellular response to interferon-gamma | 4.42 × 10⁷ | GBP6, CCL12, GBP7, GBP9, H2-Q7, CCL3, CCL2, GBP2, AIF1, GBP4, GBP3 |
| GO:0030593~neutrophil chemotaxis | 5.09 × 10⁷ | FCGR3, CCL12, EDN2, FCER1G, SYK, SPP1, CCL3, CCL2, CXCL1, NCKAP1L, VAV1 |
| GO:0042742~defense response to bacterium | 5.22 × 10⁷ | SPON2, CEBPB, FCER1G, SYK, NCF1, ANXA3, LYZ2, SLC11A1, H2-M3, H2-K1, IRGM2, TNFRSF1A, FCGR1, NAIP2, BCL3, STAB1, IRF8 |
| GO:0042590~antigen processing and presentation of exogenous peptide antigen via MHC class I | 5.57 × 10⁷ | FCGR1, FCGR3, FCER1G, H2-K1, IFI30 |
| GO:0032760~positive regulation of tumor necrosis factor production | 1.22 × 10⁶ | SASH3, H2-T23, SPON2, FCER1G, CCL3, CCL2, CYBA, LGALS9, TNFRSF1A, TLR2 |
| GO:0009617~response to bacterium | 2.91 × 10⁶ | FCGR1, P2RX7, NCF1, SLC11A1, CASP1, IRF8, FCGR2B, TLR2 |
| GO:0002474~antigen processing and presentation of peptide antigen via MHC class I | 3.56 × 10⁶ | H2-T23, H2-BL, H2-Q6, H2-Q7, H2-K1, H2-M3, B2M, H2-D1 |
| GO:0006935~chemotaxis | 1.16 × 10⁵ | CX3CR1, CXCL10, CXCL9, CCL12, RAC2, C3AR1, CCL3, CCL2, NCKAP1L, LGALS9, DOCK2, CYR61 |
| GO:0002479~antigen processing and presentation of exogenous peptide antigen via MHC class I, TAP-dependent | 1.52 × 10⁵ | H2-T23, H2-Q7, H2-K1, B2M, PSMB8, H2-D1, PSMB9 |
| GO:0019221~cytokine-mediated signaling pathway | 1.69 × 10⁵ | CX3CR1, CCL12, EDN2, STAT3, CSF2RB, TNFRSF1A, CSF2RB2, SOCS3, CCL2, PTPN6, IL6ST, JAK3, CD44 |
| GO:0010628~positive regulation of gene expression | 1.75 × 10⁵ | PTGFR, CSF1, DDX58, SLC11A1, SERPINE1, STAT3, PLAUR, LIF, SOX11, IKZF1, POU4F1, FGF2, TNFRSF1A, P2RX7, CCL3, CTSH, VIM, LGALS9, ATF3, CD44, NKX3-1, TLR2 |
| GO:0001916~positive regulation of T cell mediated cytotoxicity | 1.93 × 10⁵ | P2RX7, H2-T23, H2-K1, H2-M3, B2M, H2-D1 |
| GO:0050766~positive regulation of phagocytosis | 2.60 × 10⁵ | FCGR1, FCGR3, FCER1G, PROS1, SLC11A1, CYBA, DOCK2, FCGR2B |
| GO:0009636~response to toxic substance | 2.89 × 10⁵ | CDKN1A, PENK, CCL3, EIF2AK2, FAS, NEFL, AHR, NUPR1, SLC7A11, TLR2 |
| GO:0007155~cell adhesion | 3.58 × 10⁵ | CX3CR1, LGALS3BP, SPON2, CD84, VWF, CD93, TNFAIP6, TNFRSF12A, FBLIM1, MCAM, PCDH8, CYR61, ICAM1, MFAP4, GPNMB, CHL1, PDPN, STAB1, SPP1, ITGAX, CD9, CTNNAL1, CD33, CD44 |
| GO:0006909~phagocytosis | 4.43 × 10⁵ | HCK, ANXA3, AXL, SLC11A1, PLD4, IRF8, VAV1, MYO1G |
| GO:0045576~mast cell activation | 7.08 × 10⁵ | FCGR3, FCER1G, LCP2, CD48, FCGR2B |
| GO:0048246~macrophage chemotaxis | 9.77 × 10⁵ | CX3CR1, CCL12, EDN2, CCL3, CCL2 |
| GO:0034341~response to interferon-gamma | 9.84 × 10⁵ | IFITM3, BST2, GCH1, SLC11A1, IRGM2, TRIM21 |
| GO:0030335~positive regulation of cell migration | 1.04 × 10⁴ | TNFAIP6, CSF1, SEMA3C, MCAM, AIF1, CYR61, CXCL10, GPNMB, PDPN, C3AR1, CCL3, CTSH, ROR2, MYO1F |
| GO:0050729~positive regulation of inflammatory response | 1.54 × 10⁴ | CCL12, SERPINE1, CCL3, CCL2, CTSS, TNFRSF1A, TLR2, TGM2 |
| GO:0045730~respiratory burst | 2.05 × 10⁴ | NCF1, SLC11A1, CYBB, CYBA |
| GO:0043029~T cell homeostasis | 2.36 × 10⁴ | P2RX7, PMAIP1, FAS, NCKAP1L, AHR, JAK3 |
| GO:0042771~intrinsic apoptotic signaling pathway in response to DNA damage by p53 class mediator | 2.36 × 10⁴ | CDKN1A, IFI204, BCL3, SHISA5, PMAIP1, NUPR1 |
| GO:0045071~negative regulation of viral genome replication | 2.75 × 10⁴ | IFITM3, BST2, RSAD2, EIF2AK2, ZC3HAV1 |
| GO:0008285~negative regulation of cell proliferation | 2.92 × 10⁴ | IFITM3, CDKN1A, IGFBP3, STAT3, LIF, EIF2AK2, DHCR24, FGF2, IFIT3, MYO16, RUNX1, BCL6, IRF1, INPP5D, CD9, ROR2, NKX3-1, SKAP2, TLR2 |
| GO:0043615~astrocyte cell migration | 3.24 × 10⁴ | CCL12, HEXB, CCL3, CCL2 |
| GO:0007568~aging | 3.72 × 10⁴ | CALCA, ARG1, STAT3, PENK, SERPING1, CCL2, APOD, TIMP1, TNFRSF1B, LITAF, FGF2, CTSC |
| GO:0071407~cellular response to organic cyclic compound | 4.58 × 10⁴ | P2RX7, MSR1, CEBPB, CCL12, CASP8, STAT3, CCL3, CYBA |
| GO:0071347~cellular response to interleukin-1 | 6.78 × 10⁴ | CEBPB, CCL12, IRF1, SERPINE1, CCL3, CCL2, ICAM1, NKX3-1 |
| GO:0030168~platelet activation | 7.08 × 10⁴ | ENTPD1, VWF, SYK, AXL, ADRA2C, VAV1 |
| GO:0045944~positive regulation of transcription from RNA polymerase II promoter | 8.08 × 10⁴ | CSRNP1, CEBPB, CEBPD, HEXB, NLRC5, IKZF1, FGF2, CYR61, SBNO2, CCL3, JAK3, ZBTB7C, NKX3-1, WWTR1, EGR2, DDX58, SLC11A1, STAT3, ARID5A, LIF, SOX11, POU4F1, POU4F2, RUNX1, TNFRSF1A, HOXB9, TNIP2, IRF1, BCL3, CAPRIN2, FOSB, ATF3, TLR2, CREB5 |
| GO:0043066~negative regulation of apoptotic process | 8.49 × 10⁴ | PTGFR, CDKN1A, STAT3, PLAUR, EIF2AK2, DHCR24, AIF1, POU4F1, CYR61, IFIT3, TNFRSF1A, BTC, HCK, SOCS3, BCL6, AXL, BCL3, SPP1, CTSH, FAS, NCKAP1L, TIMP1, CD44 |
| GO:0008217~regulation of blood pressure | 9.63 × 10⁴ | CALCA, EDN2, GCH1, C3AR1, CYBA, AHR, PTGS1 |
| GO:0071356~cellular response to tumor necrosis factor | 9.78 × 10⁴ | CRHBP, CCL12, CALCA, IRF1, CCL3, CCL2, CYBA, ICAM1, NKX3-1 |
| GO:0035457~cellular response to interferon-alpha | 1.20 × 10³ | IFI204, AXL, IFIT1, IFIT3 |
| GO:0043065~positive regulation of apoptotic process | 1.45 × 10³ | HRK, TNFRSF12A, GADD45B, IGFBP3, EIF2AK2, POU4F1, CYR61, P2RX7, CASP8, BCL6, INPP5D, CASP1, PMAIP1, FAS, NUPR1, TGM2 |
| GO:0097191~extrinsic apoptotic signaling pathway | 6.69 × 10³ | P2RX7, CASP8, TNFRSF12A, FAS, TNFRSF1B |
| GO:0006915~apoptotic process | 9.46 × 10³ | HRK, CSRNP1, TNFRSF12A, NCF1, GADD45B, SHISA5, GDF6, LITAF, TNFRSF1A, RNF144B, NAIP2, CASP8, TNIP2, IRF1, INPP5D, CASP1, PMAIP1, FAS, MAP3K8, XAF1 |
| GO:0042127~regulation of cell proliferation | 9.50 × 10³ | APOBEC1, CXCL10, HCK, CXCL9, BCL6, SERPINE1, TCF7, FAS, TNFRSF1B, TNFRSF1A, PTGS1 |
| GO:0042981~regulation of apoptotic process | 1.16 × 10² | HRK, CASP8, BCL3, CASP1, PMAIP1, EIF2AK2, FAS, TNFRSF1B, GDF6, TNFRSF1A |
| GO:0048678~response to axon injury | 2.07 × 10² | ARG1, APOD, FGF2, AIF1 |
| GO:0043524~negative regulation of neuron apoptotic process | 2.89 × 10² | CEBPB, CCL12, CHL1, AXL, NEFL, CCL2, POU4F1, NES |
| Term | p-Value | Genes |
|---|---|---|
| mmu04380:Osteoclast differentiation | 3.44 × 10⁹ | SYK, NCF1, CSF1, CYBB, CYBA, TREM2, TNFRSF1A, FCGR1, SOCS3, FCGR3, TYROBP, FCGR4, BLNK, ACP5, FOSB, LCP2, FCGR2B, IRF9 |
| mmu04145:Phagosome | 1.08 × 10⁸ | H2-T23, MSR1, C1RA, H2-BL, NCF1, H2-Q6, H2-Q7, H2-M3, H2-K1, TAP1, CYBA, CTSS, FCGR1, FCGR3, CLEC7A, TUBB3, FCGR4, FCGR2B, H2-D1, TLR2 |
| mmu04668:TNF signaling pathway | 2.29 × 10⁸ | CEBPB, CCL12, CSF1, LIF, CXCL1, TNFRSF1B, TNFRSF1A, ICAM1, CXCL10, SOCS3, CASP8, BCL3, CCL2, FAS, MAP3K8, CREB5 |
| mmu05168:Herpes simplex infection | 5.17 × 10⁸ | H2-T23, CCL12, H2-BL, DDX58, H2-Q6, H2-Q7, H2-M3, H2-K1, EIF2AK2, OAS1A, TAP1, IFIT1, TNFRSF1A, IFIH1, SOCS3, CASP8, CCL2, FAS, IRF9, H2-D1, TLR2 |
| mmu05169:Epstein-Barr virus infection | 7.42 × 10⁸ | H2-T23, ENTPD1, CDKN1A, H2-BL, SYK, DDX58, H2-Q6, H2-Q7, H2-M3, STAT3, H2-K1, EIF2AK2, ICAM1, VIM, JAK3, H2-D1, CD44 |
| mmu04610:Complement and coagulation cascades | 1.31 × 10⁷ | C1QB, C1QA, C1RA, VWF, PROS1, SERPINE1, PLAUR, PLAT, C4B, C3AR1, SERPING1, A2M, C1QC |
| mmu05150:Staphylococcus aureus infection | 1.50 × 10⁷ | FCGR1, C1QB, C4B, C1QA, FCGR3, C1RA, FCGR4, C3AR1, FCGR2B, ICAM1, C1QC |
| mmu04612:Antigen processing and presentation | 1.65 × 10⁵ | H2-T23, H2-BL, H2-Q6, H2-Q7, H2-K1, H2-M3, TAP1, IFI30, B2M, CTSS, H2-D1 |
| mmu05203:Viral carcinogenesis | 2.12 × 10⁵ | H2-T23, EGR2, CDKN1A, H2-BL, SYK, H2-Q6, H2-Q7, H2-M3, STAT3, H2-K1, EIF2AK2, CASP8, PMAIP1, IL6ST, JAK3, IRF9, H2-D1, CREB5 |
| mmu05142:Chagas disease (American trypanosomiasis) | 2.23 × 10⁵ | C1QB, GNA14, C1QA, CCL12, CASP8, SERPINE1, CCL3, FAS, CCL2, TNFRSF1A, C1QC, TLR2 |
| mmu05164:Influenza A | 3.64 × 10⁵ | CCL12, RSAD2, DDX58, MX2, EIF2AK2, OAS1A, TNFRSF1A, ICAM1, IFIH1, CXCL10, SOCS3, CASP1, CCL2, FAS, IRF9 |
| mmu04060:Cytokine-cytokine receptor interaction | 3.86 × 10⁵ | CX3CR1, IL15RA, CCL12, CXCL9, TNFRSF12A, CSF1, LIF, CXCL1, CSF2RB, OSMR, TNFRSF1B, TNFRSF1A, CSF2RB2, CXCL10, CCL3, CCL2, FAS, IL6ST |
| mmu05416:Viral myocarditis | 7.61 × 10⁵ | H2-T23, CASP8, H2-BL, H2-Q6, H2-Q7, H2-K1, H2-M3, RAC2, H2-D1, ICAM1 |
| mmu04666:Fc gamma R-mediated phagocytosis | 1.23 × 10⁴ | FCGR1, HCK, NCF1, SYK, MYO10, INPP5D, RAC2, DOCK2, FCGR2B, VAV1 |
| mmu04650:Natural killer cell mediated cytotoxicity | 1.41 × 10⁴ | TYROBP, FCER1G, SYK, FCGR4, RAC2, FAS, PTPN6, LCP2, CD48, VAV1, ICAM1 |
| mmu04062:Chemokine signaling pathway | 1.60 × 10⁴ | CX3CR1, CCL12, CXCL9, NCF1, STAT3, CXCL1, VAV1, CXCL10, HCK, CCL3, RAC2, GNB3, CCL2, DOCK2, JAK3 |
| mmu05332:Graft-versus-host disease | 1.69 × 10⁴ | H2-T23, H2-BL, H2-Q6, H2-Q7, H2-K1, H2-M3, FAS, H2-D1 |
| mmu05330:Allograft rejection | 2.72 × 10⁴ | H2-T23, H2-BL, H2-Q6, H2-Q7, H2-K1, H2-M3, FAS, H2-D1 |
| mmu05133:Pertussis | 2.77 × 10⁴ | C1QB, C4B, C1QA, C1RA, IRF1, CASP1, SERPING1, IRF8, C1QC |
| mmu04940:Type I diabetes mellitus | 5.14 × 10⁴ | H2-T23, H2-BL, H2-Q6, H2-Q7, H2-K1, H2-M3, FAS, H2-D1 |
| mmu05152:Tuberculosis | 7.21 × 10⁴ | CEBPB, FCER1G, SYK, CTSS, TNFRSF1A, FCGR1, FCGR3, CASP8, CLEC7A, FCGR4, ITGAX, FCGR2B, TLR2 |
| mmu05144:Malaria | 7.51 × 10⁴ | CCL12, CCL2, HBB-B1, HBA-A2, HBA-A1, ICAM1, TLR2 |
| mmu04115:p53 signaling pathway | 8.25 × 10⁴ | CDKN1A, CASP8, GADD45B, IGFBP3, SERPINE1, SHISA5, PMAIP1, FAS |
| mmu04662:B cell receptor signaling pathway | 1.07 × 10³ | CD72, SYK, INPP5D, BLNK, RAC2, PTPN6, FCGR2B, VAV1 |
| mmu05162:Measles | 1.13 × 10³ | IFIH1, DDX58, MX2, STAT3, EIF2AK2, FAS, OAS1A, FCGR2B, JAK3, IRF9, TLR2 |
| mmu05320:Autoimmune thyroid disease | 1.17 × 10³ | H2-T23, H2-BL, H2-Q6, H2-Q7, H2-K1, H2-M3, FAS, H2-D1 |
| mmu04630:Jak-STAT signaling pathway | 1.83 × 10³ | CSF2RB2, IL15RA, SOCS3, STAT3, LIF, PTPN6, CSF2RB, IL6ST, OSMR, JAK3, IRF9 |
| mmu05140:Leishmaniasis | 3.39 × 10³ | FCGR1, FCGR3, NCF1, FCGR4, CYBA, PTPN6, TLR2 |
| mmu05160:Hepatitis C | 4.04 × 10³ | SOCS3, CDKN1A, DDX58, IRF1, STAT3, EIF2AK2, OAS1A, IFIT1, IRF9, TNFRSF1A |
| mmu04142:Lysosome | 6.97 × 10³ | HEXB, SLC11A1, LAPTM5, ACP5, CTSH, CD68, LITAF, CTSS, CTSC |
| mmu05143:African trypanosomiasis | 8.14 × 10³ | FAS, HBB-B1, HBA-A2, HBA-A1, ICAM1 |
| mmu04621:NOD-like receptor signaling pathway | 9.72 × 10³ | NAIP2, CCL12, CASP8, CASP1, CCL2, CXCL1 |
| mmu05166:HTLV-I infection | 1.10 × 10² | H2-T23, IL15RA, EGR2, CDKN1A, H2-BL, H2-Q6, H2-Q7, H2-M3, H2-K1, TNFRSF1A, ICAM1, JAK3, ATF3, H2-D1 |
| mmu05323:Rheumatoid arthritis | 1.13 × 10² | CCL12, CSF1, CCL3, CCL2, ACP5, ICAM1, TLR2 |
| mmu05161:Hepatitis B | 1.92 × 10² | IFIH1, EGR2, CDKN1A, CASP8, DDX58, STAT3, FAS, CREB5, TLR2 |
| mmu04664:Fc epsilon RI signaling pathway | 1.98 × 10² | FCER1G, SYK, INPP5D, RAC2, LCP2, VAV1 |
| mmu04620:Toll-like receptor signaling pathway | 2.87 × 10² | CXCL10, CXCL9, CASP8, SPP1, CCL3, MAP3K8, TLR2 |
| mmu04611:Platelet activation | 3.12 × 10² | FCER1G, VWF, SYK, COL5A2, TBXAS1, PRKG2, LCP2, PTGS1 |
| mmu05134:Legionellosis | 4.17 × 10² | NAIP2, CASP8, CASP1, CXCL1, TLR2 |
| mmu04210:Apoptosis | 4.88 × 10² | CSF2RB2, CASP8, FAS, CSF2RB, TNFRSF1A |
| Genes | DC | Genes | EC | Genes | LAC | Genes | BC | Genes | CC |
|---|---|---|---|---|---|---|---|---|---|
| Cxcl10 | 77 | Tlr2 | 0.16 | Ifit3 | 28.38 | Stat3 | 6332.91 | Cxcl10 | 0.044 |
| Tlr2 | 73 | Tyrobp | 0.16 | Ifit1 | 28.13 | Cd44 | 5426.13 | Stat3 | 0.044 |
| Tyrobp | 70 | Cxcl10 | 0.16 | Irf9 | 27.79 | Cxcl10 | 4681.39 | Tlr2 | 0.043 |
| Itgax | 66 | Itgax | 0.16 | Rtp4 | 27.67 | Tlr2 | 4583.62 | Ccl2 | 0.043 |
| Stat3 | 64 | Aif1 | 0.15 | Oasl2 | 27.58 | Aif1 | 4057.10 | Cd44 | 0.043 |
| Aif1 | 62 | Cd68 | 0.15 | Irgm1 | 27.47 | Vwf | 3852.56 | Aif1 | 0.043 |
| Cd68 | 60 | Irf8 | 0.14 | Irgm2 | 27.46 | Atf3 | 3484.15 | Itgax | 0.043 |
| Ccl2 | 60 | Fcgr2b | 0.14 | Gbp2 | 27.11 | Vim | 3158.54 | Cd68 | 0.043 |
| Ctss | 58 | Ctss | 0.14 | Parp14 | 26.92 | Ccl2 | 3102.06 | Cxcl9 | 0.043 |
| Cd44 | 57 | Cxcl9 | 0.13 | Gbp3 | 26.69 | Fgf2 | 2981.26 | Tyrobp | 0.043 |
| Fcgr2b | 55 | Fcgr1 | 0.13 | Rnf213 | 26.37 | Entpd1 | 2352.07 | Icam1 | 0.043 |
| Cxcl9 | 55 | Nckap1l | 0.13 | Fcer1g | 26.27 | Igfbp3 | 2348.79 | Irf8 | 0.043 |
| C1qa | 55 | C1qa | 0.13 | Rsad2 | 26.15 | Antxr2 | 2238 | C1qa | 0.043 |
| Irf8 | 54 | Ccl2 | 0.13 | Tyrobp | 26 | Tnnt2 | 2238 | Cxcl1 | 0.043 |
| Nckap1l | 54 | Casp1 | 0.12 | Parp9 | 25.94 | C1qa | 2156.60 | Csf1 | 0.043 |
| Irf1 | 54 | Cybb | 0.12 | Herc6 | 25.89 | Itgax | 2130.30 | Fcgr2b | 0.043 |
| Ifih1 | 54 | Fcer1g | 0.12 | Ddx60 | 25.83 | Socs3 | 2039.41 | Fgf2 | 0.043 |
| Ddx58 | 54 | Cd53 | 0.12 | Nckap1l | 25.48 | Timp1 | 1996.1 | Casp1 | 0.043 |
| Mx1 | 50 | Fcgr4 | 0.12 | Pld4 | 25.44 | Cxcl1 | 1920.96 | Timp1 | 0.043 |
| C1qb | 48 | Lyz2 | 0.12 | Cd53 | 25.32 | Cxcl9 | 1830.66 | Cybb | 0.043 |
| Casp1 | 47 | Stat3 | 0.12 | Trim30a | 25.30 | C1qb | 1772.68 | Lyz2 | 0.043 |
| Syk | 47 | Irf1 | 0.11 | Gbp6 | 25.24 | Tyrobp | 1763.02 | Ctss | 0.043 |
| Icam1 | 47 | Ifih1 | 0.11 | Ifih1 | 25.15 | Spp1 | 1704.59 | Fcgr1 | 0.043 |
| Ptpn6 | 47 | Ly86 | 0.11 | Mx1 | 25.08 | Bst1 | 1680 | Irf1 | 0.043 |
| Fcgr1 | 46 | H2-K1 | 0.11 | Cxcl10 | 24.80 | Irf1 | 1619.14 | H2-K1 | 0.043 |
| Lyz2 | 46 | Ddx58 | 0.11 | Igtp | 24.77 | Irf8 | 1564.14 | Ccl3 | 0.043 |
| Ly86 | 46 | Pld4 | 0.11 | Irf1 | 24.59 | Cd68 | 1519.08 | Serpine1 | 0.043 |
| H2-K1 | 46 | Mx1 | 0.11 | Ctss | 24.24 | C4b | 1491.62 | Ddx58 | 0.043 |
| Cybb | 45 | Fcgr3 | 0.11 | Gbp7 | 24.23 | Arg1 | 1475.19 | Psmb8 | 0.043 |
| Fcgr4 | 45 | Syk | 0.11 | Fcgr1 | 24.23 | Mx1 | 1474.78 | Syk | 0.043 |
| Ifit1 | 45 | Cd48 | 0.11 | Cd68 | 23.6 | Cyr61 | 1448.63 | Socs3 | 0.043 |
| Fcer1g | 44 | C1qb | 0.11 | Fcgr2b | 23.56 | Ddx58 | 1429.51 | Spp1 | 0.043 |
| Cd53 | 44 | Vav1 | 0.101 | Ly86 | 23.52 | Lyz2 | 1427.96 | Mx1 | 0.043 |
| Psmb8 | 44 | Cd44 | 0.101 | Samd9l | 23.36 | Gnb3 | 1422.19 | B2m | 0.043 |
| Pld4 | 43 | Slc11a1 | 0.101 | Itgax | 23.33 | Csf1 | 1404.39 | Gfap | 0.043 |
| Fcgr3 | 43 | Icam1 | 0.101 | Ddx58 | 23.22 | Myo1g | 1373.28 | Arg1 | 0.043 |
| Lcp2 | 43 | Hck | 0.101 | Aif1 | 22.90 | Ctsc | 1337.92 | Fcgr4 | 0.043 |
| Trim30a | 43 | Ptpn6 | 0.10 | Trim21 | 22.85 | Lcp2 | 1322.43 | Vwf | 0.043 |
| Cxcl1 | 43 | Ifit1 | 0.10 | Hck | 22.70 | Icam1 | 1297.18 | Vav1 | 0.043 |
| Oasl2 | 43 | Psmb8 | 0.10 | Fcgr3 | 22.60 | Serpine1 | 1273.40 | C1qb | 0.043 |
| Cd48 | 42 | Lcp2 | 0.10 | Tlr2 | 22.52 | Gbp7 | 1255.33 | Ptpn6 | 0.043 |
| Vav1 | 42 | Trim30a | 0.10 | Laptm5 | 22.4 | Ctss | 1219.90 | Cd48 | 0.043 |
| Ifit3 | 42 | Rac2 | 0.09 | Fcgr4 | 22 | Cdkn1a | 1208.70 | C3ar1 | 0.043 |
| Rtp4 | 42 | Csf1 | 0.09 | Rac2 | 21.68 | B2m | 1202.51 | Nckap1l | 0.043 |
| Csf1 | 41 | Ccl3 | 0.09 | Cd48 | 21.67 | Hbb-bs | 1200.55 | Cx3cr1 | 0.043 |
| Rsad2 | 41 | C3ar1 | 0.09 | Cybb | 21.56 | Pou4f1 | 1195.79 | Ifih1 | 0.043 |
| Psmb9 | 40 | Cxcl1 | 0.09 | Bst2 | 21.44 | Hexb | 1156.12 | Psmb9 | 0.043 |
| C1qc | 40 | Laptm5 | 0.09 | Cxcl9 | 21.13 | Pola2 | 1154.03 | Cd53 | 0.043 |
| C3ar1 | 39 | Psmb9 | 0.09 | Eif2ak2 | 20.93 | Lrrc2 | 1126 | Lcp2 | 0.043 |
| Igtp | 39 | C1qc | 0.09 | Irf8 | 20.85 | Prkg2 | 1126 | Ly86 | 0.043 |
| Irf9 | 39 | Trem2 | 0.09 | Lyz2 | 20.70 | Ahr | 1124 | Fcgr3 | 0.043 |
| Parp14 | 39 | Irgm1 | 0.09 | Psmb8 | 20.5 | Map3k8 | 1124 | Clec7a | 0.043 |
| Irgm1 | 38 | Igtp | 0.09 | Slc11a1 | 20.27 | Irx4 | 1124 | Fas | 0.043 |
| Gbp2 | 38 | Oasl2 | 0.09 | C1qa | 20.22 | Nes | 1109.62 | C1qc | 0.043 |
| Rnf213 | 38 | Gbp2 | 0.08 | Psmb9 | 20.15 | Fcgr2b | 1042.78 | Atf3 | 0.043 |
| B2m | 38 | Ifit3 | 0.08 | Cd52 | 20.08 | Nckap1l | 1029.29 | Trem2 | 0.043 |
| Slc11a1 | 37 | Rtp4 | 0.08 | Myo1f | 19.48 | Casp1 | 1026.18 | Slc11a1 | 0.043 |
| Hck | 37 | Irf9 | 0.08 | Vav1 | 19.43 | C3ar1 | 979.36 | Cyba | 0.043 |
| Rac2 | 37 | Rsad2 | 0.08 | Casp1 | 19.23 | Psmb8 | 891.35 | Lcp1 | 0.043 |
| Irgm2 | 37 | Cyba | 0.08 | Ptpn6 | 19.23 | Ifih1 | 883.81 | Hck | 0.043 |
| Cluster | Score | Nodes | Edges | Node IDs |
|---|---|---|---|---|
| 1 | 27.357 | 29 | 383 | Herc6, Irf1, Irf9, Ifih1, Oasl2, Gbp7, Parp9, Gbp2, Ddx60, Rsad2, Psmb9, Bst2, Gbp3, Irgm2, Rnf213, Ifit1, Trim21, Samd9l, Gbp6, Trim30a, Irgm1, Eif2ak2, Ddx58, Cxcl10, Rtp4, Igtp, Parp14, Psmb8, Ifit3 |
| 2 | 20.968 | 32 | 325 | Ptpn6, Ly86, Ifi203, Lyz2, Ctss, Cybb, Inpp5d, Tyrobp, Irf8, Laptm5, Ifi204, Csf2rb2, C1qa, Cxcl9, Cd68, Fcgr3, Nckap1l, Hck, Lcp2, Slc11a1, Gbp4, Fcer1g, Cd52, Cd48, Fcgr1, Rac2, Sash3, Pld4, Aif1, Myo1g, Cd53, Fcgr4 |
| 3 | 9.692 | 27 | 126 | Stat3, H2-Q6, Tlr2, Cd93, Casp1, Icam1, Myo1f, Arg1, Timp1, Ifitm3, Fcgr2b, Cyba, Ccl2, Unc93b1, Itgax, Csf1, C1qc, H2-Q7, Ccl3, C1qb, Tnfrsf1a, C3ar1, Vav1, H2-D1, Arhgap30, H2-T23, H2-M3 |
| 4 | 4.8 | 6 | 12 | Gfap, Pvalb, Calb2, Pou4f1, Tubb3, Lif |
| 5 | 4.4 | 16 | 33 | Cx3cr1, Fas, H2-K1, Syk, Fgf2, Serpine1, Cd44, Ccl12, Ikzf1, Lcp1, Wdfy4, B2m, Cxcl1, Cyth4, Spp1, Trem2 |
| CMap Name | Mean | Enrichment | p-Value |
|---|---|---|---|
| 5182598 | −0.66 | −0.97 | 2.03 × 10³ |
| Tocainide | −0.58 | −0.92 | 6.00 × 10⁵ |
| NU-1025 | −0.38 | −0.88 | 2.88 × 10² |
| Harpagoside | −0.37 | −0.88 | 5.20 × 10⁴ |
| Cloxacillin | −0.24 | −0.83 | 1.55 × 10³ |
| Prestwick-1103 | −0.26 | −0.80 | 3.18 × 10³ |
| Benzathine benzylpenicillin | −0.27 | −0.79 | 4.08 × 10³ |
| Folic acid | −0.25 | −0.78 | 4.44 × 10³ |
| Prestwick-967 | −0.50 | −0.77 | 5.61 × 10³ |
| Timolol | −0.25 | −0.77 | 5.89 × 10³ |
| Prestwick-675 | −0.26 | −0.77 | 6.15 × 10³ |
| Indoprofen | −0.21 | −0.75 | 7.70 × 10³ |
| Atractyloside | −0.33 | −0.71 | 4.45 × 10³ |
| Arcaine | −0.41 | −0.69 | 2.01 × 10² |
| Retrorsine | −0.38 | −0.69 | 2.14 × 10² |
| Prestwick-689 | −0.38 | −0.68 | 2.32 × 10² |
| Fursultiamine | −0.51 | −0.67 | 2.72 × 10² |
| Isometheptene | −0.23 | −0.65 | 3.44 × 10² |
| Diphenylpyraline | −0.29 | −0.56 | 2.94 × 10² |
| Vincamine | −0.20 | −0.54 | 3.79 × 10² |
Publisher’s Note: MDPI stays neutral with regard to jurisdictional claims in published maps and institutional affiliations. |
© 2022 by the authors. Licensee MDPI, Basel, Switzerland. This article is an open access article distributed under the terms and conditions of the Creative Commons Attribution (CC BY) license (https://creativecommons.org/licenses/by/4.0/).
Share and Cite
Xie, D.; Hu, J.; Wu, T.; Cao, K.; Luo, X. Potential Biomarkers and Drugs for Nanoparticle-Induced Cytotoxicity in the Retina: Based on Regulation of Inflammatory and Apoptotic Genes. Int. J. Environ. Res. Public Health 2022, 19, 5664. https://doi.org/10.3390/ijerph19095664
Xie D, Hu J, Wu T, Cao K, Luo X. Potential Biomarkers and Drugs for Nanoparticle-Induced Cytotoxicity in the Retina: Based on Regulation of Inflammatory and Apoptotic Genes. International Journal of Environmental Research and Public Health. 2022; 19(9):5664. https://doi.org/10.3390/ijerph19095664
Chicago/Turabian StyleXie, Dongli, Jianchen Hu, Tong Wu, Kangli Cao, and Xiaogang Luo. 2022. "Potential Biomarkers and Drugs for Nanoparticle-Induced Cytotoxicity in the Retina: Based on Regulation of Inflammatory and Apoptotic Genes" International Journal of Environmental Research and Public Health 19, no. 9: 5664. https://doi.org/10.3390/ijerph19095664