
Concordance between Different Criteria for Self-Reported Physical Activity Levels and Risk Factors in People with High Blood Pressure in a Rural District in Bangladesh

 ,
,  ,
,
Abstract
:1. Introduction
2. Materials and Methods
2.1. Study Location
2.2. Statistical Power
2.3. Recruitment
2.4. Ethics Approval and Consent Processes
2.5. Participant Benefits
2.6. Outcome Measures
2.6.1. The Difference in Self-Reported Physical Activity
2.6.2. Concordance in Physical Activity Measure
2.7. Sociodemographic Factors
2.8. Questionnaire Rigor and Preparation
2.9. Statistical Analysis
3. Results
4. Discussion
5. Conclusions
Author Contributions
Funding
Institutional Review Board Statement
Informed Consent Statement
Data Availability Statement
Acknowledgments
Conflicts of Interest
References
- Zhao, R.; Bu, W.; Chen, Y.; Chen, X. The Dose-Response Associations of Sedentary Time with Chronic Diseases and the Risk for All-Cause Mortality Affected by Different Health Status: A Systematic Review and Meta-Analysis. J. Nutr. Health Aging 2020, 24, 63–70. [Google Scholar] [CrossRef]
- Nocon, M.; Hiemann, T.; Muller-Riemenschneider, F.; Thalau, F.; Roll, S.; Willich, S.N. Association of physical activity with all-cause and cardiovascular mortality: A systematic review and meta-analysis. Eur. J. Cardiovasc. Prev. Rehabil. 2008, 15, 239–246. [Google Scholar] [CrossRef]
- Katzmarzyk, P.T.; Lear, S.A. Physical activity for obese individuals: A systematic review of effects on chronic disease risk factors. Obes. Rev. 2012, 13, 95–105. [Google Scholar] [CrossRef] [PubMed]
- Owen, N.; Healy, G.N.; Dempsey, P.C.; Salmon, J.; Timperio, A.; Clark, B.K.; Goode, A.D.; Koorts, H.; Ridgers, N.D.; Hadgraft, N.T.; et al. Sedentary Behavior and Public Health: Integrating the Evidence and Identifying Potential Solutions. Annu. Rev. Public Health 2020, 41, 265–287. [Google Scholar] [CrossRef] [PubMed] [Green Version]
- Climie, R.E.; Srikanth, V.; Keith, L.J.; Davies, J.E.; Sharman, J.E. Exercise excess pressure and exercise-induced albuminuria in patients with type 2 diabetes mellitus. Am. J. Physiol. Heart Circ. Physiol. 2015, 308, H1136–H1142. [Google Scholar] [CrossRef] [PubMed] [Green Version]
- Lee, I.M.; Shiroma, E.J.; Lobelo, F.; Puska, P.; Blair, S.N.; Katzmarzyk, P.T.; Lancet Physical Activity Series Working Group. Effect of physical inactivity on major non-communicable diseases worldwide: An analysis of burden of disease and life expectancy. Lancet 2012, 380, 219–229. [Google Scholar] [CrossRef] [Green Version]
- Warburton, D.E.R.; Bredin, S.S.D. Health benefits of physical activity: A systematic review of current systematic reviews. Curr. Opin. Cardiol. 2017, 32, 541–556. [Google Scholar] [CrossRef]
- Islam, F.M.A. Factors Associated with Physical Activity among People with Hypertension in a Rural Area in Bangladesh: Baseline Data from a Cluster Randomized Control Trial. Int. J. Environ. Res. Public Health 2021, 18, 7365. [Google Scholar] [CrossRef]
- Veluswamy, S.K.; Maiya, A.G.; Nair, S.; Guddattu, V.; Nair, N.S.; Vidyasagar, S. Awareness of chronic disease related health benefits of physical activity among residents of a rural South Indian region: A cross-sectional study. Int. J. Behav. Nutr. Phys. Act. 2014, 11, 27. [Google Scholar] [CrossRef] [PubMed] [Green Version]
- Pedisic, Z.; Shrestha, N.; Loprinzi, P.D.; Mehata, S.; Mishra, S.R. Prevalence, patterns, and correlates of physical activity in Nepal: Findings from a nationally representative study using the Global Physical Activity Questionnaire (GPAQ). BMC Public Health 2019, 19, 864. [Google Scholar] [CrossRef]
- Guwatudde, D.; Kirunda, B.E.; Wesonga, R.; Mutungi, G.; Kajjura, R.; Kasule, H.; Muwonge, J.; Behendeka, S.K. Physical Activity Levels Among Adults in Uganda: Findings from a Countrywide Cross-Sectional Survey. J. Phys. Act. Health 2016, 13, 938–945. [Google Scholar] [CrossRef]
- Dowd, K.P.; Szeklicki, R.; Minetto, M.A.; Murphy, M.H.; Polito, A.; Ghigo, E.; van der Ploeg, H.; Ekelund, U.; Maciaszek, J.; Stemplewski, R.; et al. A systematic literature review of reviews on techniques for physical activity measurement in adults: A DEDIPAC study. Int. J. Behav. Nutr. Phys. Act. 2018, 15, 15. [Google Scholar] [CrossRef]
- Shephard, R.J. Limits to the measurement of habitual physical activity by questionnaires. Br. J. Sports Med. 2003, 37, 197–206. [Google Scholar] [CrossRef] [Green Version]
- Owen, N.; Healy, G.N.; Matthews, C.E.; Dunstan, D.W. Too much sitting: The population health science of sedentary behavior. Exerc. Sport Sci. Rev. 2010, 38, 105–113. [Google Scholar] [CrossRef] [PubMed]
- Skender, S.; Ose, J.; Chang-Claude, J.; Paskow, M.; Bruhmann, B.; Siegel, E.M.; Steindorf, K.; Ulrich, C.M. Accelerometry and physical activity questionnaires—A systematic review. BMC Public Health 2016, 16, 515. [Google Scholar] [CrossRef] [PubMed] [Green Version]
- Godino, J.; Watkinson, C.; Corder, K.; Sutton, S.; Griffin, S.; van Sluijs, E. Awareness of physical activity in healthy middle-aged adults: A cross-sectional study of associations with sociodemographic, biological, behavioural, and psychological factors. BMC Public Health 2014, 14, 421. [Google Scholar] [CrossRef] [Green Version]
- Smith, L.; Lee, J.A.; Mun, J.; Pakpahan, R.; Imm, K.R.; Izadi, S.; Kibel, A.S.; Colditz, G.A.; Grubb, R.L., III; Wolin, K.Y.; et al. Levels and patterns of self-reported and objectively-measured free-living physical activity among prostate cancer survivors: A prospective cohort study. Cancer 2019, 125, 798–806. [Google Scholar] [CrossRef] [Green Version]
- Cleland, C.L.; Hunter, R.F.; Kee, F.; Cupples, M.E.; Sallis, J.F.; Tully, M.A. Validity of the global physical activity questionnaire (GPAQ) in assessing levels and change in moderate-vigorous physical activity and sedentary behaviour. BMC Public Health 2014, 14, 1255. [Google Scholar] [CrossRef] [Green Version]
- Ferrari, P.; Friedenreich, C.; Matthews, C.E. The role of measurement error in estimating levels of physical activity. Am. J. Epidemiol. 2007, 166, 832–840. [Google Scholar] [CrossRef] [PubMed] [Green Version]
- Neilson, H.K.; Robson, P.J.; Friedenreich, C.M.; Csizmadi, I. Estimating activity energy expenditure: How valid are physical activity questionnaires? Am. J. Clin. Nutr. 2008, 87, 279–291. [Google Scholar] [CrossRef] [Green Version]
- Prince, S.A.; Adamo, K.B.; Hamel, M.E.; Hardt, J.; Connor Gorber, S.; Tremblay, M. A comparison of direct versus self-report measures for assessing physical activity in adults: A systematic review. Int. J. Behav. Nutr. Phys. Act. 2008, 5, 56. [Google Scholar] [CrossRef] [Green Version]
- Troiano, R.P.; Berrigan, D.; Dodd, K.W.; Masse, L.C.; Tilert, T.; McDowell, M. Physical activity in the United States measured by accelerometer. Med. Sci. Sports Exerc. 2008, 40, 181–188. [Google Scholar] [CrossRef] [PubMed]
- Padrao, P.; Damasceno, A.; Silva-Matos, C.; Prista, A.; Lunet, N. Physical activity patterns in Mozambique: Urban/rural differences during epidemiological transition. Prev. Med. 2012, 55, 444–449. [Google Scholar] [CrossRef]
- Moniruzzaman, M.; Mostafa Zaman, M.; Islalm, M.S.; Ahasan, H.A.; Kabir, H.; Yasmin, R. Physical activity levels in Bangladeshi adults: Results from STEPS survey 2010. Public Health 2016, 137, 131–138. [Google Scholar] [CrossRef] [PubMed]
- Zaman, M.M.; Rahman, M.M.; Rahman, M.R.; Bhuiyan, M.R.; Karim, M.N.; Chowdhury, M.A. Prevalence of risk factors for non-communicable diseases in Bangladesh: Results from STEPS survey 2010. Indian J. Public Health 2016, 60, 17–25. [Google Scholar] [CrossRef]
- Moniruzzaman, M.; Ahmed, M.S.; Zaman, M.M. Physical activity levels and associated socio-demographic factors in Bangladeshi adults: A cross-sectional study. BMC Public Health 2017, 17, 59. [Google Scholar] [CrossRef] [Green Version]
- Saquib, N.; Saquib, J.; Ahmed, T.; Khanam, M.A.; Cullen, M.R. Cardiovascular diseases and type 2 diabetes in Bangladesh: A systematic review and meta-analysis of studies between 1995 and 2010. BMC Public Health 2012, 12, 434. [Google Scholar] [CrossRef] [Green Version]
- Chowdhury, M.Z.I.; Rahman, M.; Akter, T.; Akhter, T.; Ahmed, A.; Shovon, M.A.; Farhana, Z.; Chowdhury, N.; Turin, T.C. Hypertension prevalence and its trend in Bangladesh: Evidence from a systematic review and meta-analysis. Clin. Hypertens. 2020, 26, 10. [Google Scholar] [CrossRef] [PubMed]
- World Health Organization. Global strategy on diet, physical activity and health. In Proceedings of the 57th World Health Assembly, Geneva, Switzerland, 17–22 May 2004; World Health Organization: Geneva, Switzerland, 2004; pp. 2–18. [Google Scholar]
- World Health Organization. WHO STEPS Surveillance Manual: The WHO STEPwise Approach to Chronic Disease Risk Factor Surveillance; World Health Organization: Geneva, Switzerland, 2005. [Google Scholar]
- Bull, F.C.; Maslin, T.S.; Armstrong, T. Global physical activity questionnaire (GPAQ): Nine country reliability and validity study. J. Phys. Act. Health 2009, 6, 790–804. [Google Scholar] [CrossRef] [PubMed] [Green Version]
- Mumu, S.J.; Ali, L.; Barnett, A.; Merom, D. Validity of the global physical activity questionnaire (GPAQ) in Bangladesh. BMC Public Health 2017, 17, 650. [Google Scholar] [CrossRef] [PubMed] [Green Version]
- Armstrong, T.B.F. Development of the World Health Organization global physical activity questionnaire (GPAQ). J. Public Health 2006, 14, 66–70. [Google Scholar] [CrossRef]
- World Health Organization. GPAQ: Global Physical Activity Questionnaire (Version 2.0). World Health Organization: Geneva, Switzerland, 2016; Available online: http://www.who.int/chp/steps/resources/GPAQ_Analysis_Guide.pdf (accessed on 12 September 2021).
- Chakrabarti, R.; Finger, R.P.; Lamoureux, E.; Islam, M.T.; Dirani, M.; Bhuiyan, A.; Islam, S.Z.; Wahab, M.A.; Islam, F.M.A. Rationale and methodology for a population-based study of diabetes and common eye diseases in a rural area in Bangladesh: Bangladesh Population-based Diabetes and Eye Study (BPDES). Bangladesh J. Med. Sci. 2015, 14, 367–375. [Google Scholar] [CrossRef] [Green Version]
- Islam, F.M.; Bhuiyan, A.; Chakrabarti, R.; Rahman, M.A.; Kanagasingam, Y.; Hiller, J.E. Undiagnosed hypertension in a rural district in Bangladesh: The Bangladesh Population-based Diabetes and Eye Study (BPDES). J. Hum. Hypertens. 2016, 30, 252–259. [Google Scholar] [CrossRef]
- Whelton, P.K.; Carey, R.M.; Aronow, W.S.; Casey, D.E., Jr.; Collins, K.J.; Dennison Himmelfarb, C.; DePalma, S.M.; Gidding, S.; Jamerson, K.A.; Jones, D.W.; et al. 2017 ACC/AHA/AAPA/ABC/ACPM/AGS/APhA/ASH/ASPC/NMA/PCNA Guideline for the Prevention, Detection, Evaluation, and Management of High Blood Pressure in Adults: A Report of the American College of Cardiology/American Heart Association Task Force on Clinical Practice Guidelines. J. Am. Coll. Cardiol. 2018, 71, e127–e248. [Google Scholar] [CrossRef] [PubMed]
- Islam, F.M.A.; Lambert, E.A.; Islam, S.M.S.; Islam, M.A.; Biswas, D.; McDonald, R.; Maddison, R.; Thompson, B.; Lambert, G.W. Lowering blood pressure by changing lifestyle through a motivational education program: A cluster randomized controlled trial study protocol. Trials 2021, 22, 438. [Google Scholar] [CrossRef] [PubMed]
- Bangladesh Bureau of Statistics. Population and Housing Census 2011; Bangladesh Bureau of Statistics: Dhaka, Bangladesh, 2011.
- Bonett, D.G. Sample Size Planning for Behavioral Science Research; University of California: Santa Cruz, CA, USA, 2016; Available online: https://people.ucsc.edu/~dgbonett/docs/wrkshp/LectureNotes.pdf (accessed on 12 September 2021).
- Trinh, O.T.; Nguyen, N.D.; Dibley, M.J.; Phongsavan, P.; Bauman, A.E. The prevalence and correlates of physical inactivity among adults in Ho Chi Minh City. BMC Public Health 2008, 8, 204. [Google Scholar] [CrossRef] [Green Version]
- Altman, D.G.M.; David, T.N.; Bryant, M.J. Gardner. Statistics with Confidence, 2nd ed.; BMJ Books: London, UK, 2000. [Google Scholar]
- Cheng, Y.H.; Chi, I.; Boey, K.W.; Ko, L.S.; Chou, K.L. Self-rated economic condition and the health of elderly persons in Hong Kong. Soc. Sci. Med. 2002, 55, 1415–1424. [Google Scholar] [CrossRef]
- World Health Organization. Global Recommendations on Physical Activity for Health; World Health Organization: Geneva, Switzerland, 2010; p. 58. [Google Scholar]
- MedCalc Software Ltd. Diagnostic Test Evaluation Calculator. (Version 20.010). MedCalc Software Ltd.: Ostend, Belgium. Available online: https://www.medcalc.org/calc/diagnostic_test.php (accessed on 26 August 2021).
- Lim, S.; Wyker, B.; Bartley, K.; Eisenhower, D. Measurement error of self-reported physical activity levels in New York City: Assessment and correction. Am. J. Epidemiol. 2015, 181, 648–655. [Google Scholar] [CrossRef] [Green Version]
- Ekelund, U.; Tomkinson, G.; Armstrong, N. What proportion of youth are physically active? Measurement issues, levels and recent time trends. Br. J. Sports Med. 2011, 45, 859–865. [Google Scholar] [CrossRef]
- Colley, R.C.; Butler, G.; Garriguet, D.; Prince, S.A.; Roberts, K.C. Comparison of self-reported and accelerometer-measured physical activity among Canadian youth. Health Rep. 2019, 30, 3–12. [Google Scholar] [CrossRef]
- Colley, R.C.; Butler, G.; Garriguet, D.; Prince, S.A.; Roberts, K.C. Comparison of self-reported and accelerometer-measured physical activity in Canadian adults. Health Rep. 2018, 29, 3–15. [Google Scholar]
- Fukuoka, Y.; Haskell, W.; Vittinghoff, E. New insights into discrepancies between self-reported and accelerometer-measured moderate to vigorous physical activity among women—The mPED trial. BMC Public Health 2016, 16, 761. [Google Scholar] [CrossRef] [Green Version]
- Ogonowska-Slodownik, A.; Morgulec-Adamowicz, N.; Geigle, P.R.; Kalbarczyk, M.; Kosmol, A. Objective and Self-reported Assessment of Physical Activity of Women over 60 Years Old. Ageing Int. 2021. [Google Scholar] [CrossRef]
- Colbert, L.H.; Matthews, C.E.; Schoeller, D.A.; Havighurst, T.C.; Kim, K. Intensity of physical activity in the energy expenditure of older adults. J. Aging Phys. Act. 2014, 22, 571–577. [Google Scholar] [CrossRef] [Green Version]
- Maruf, F.A.; Ojukwu, C.C.; Akindele, M.O. Perception, Knowledge, and Attitude toward Physical Activity Behaviour: Implications for Participation among Individuals with Essential Hypertension. High Blood Press. Cardiovasc. Prev. 2018, 25, 53–60. [Google Scholar] [CrossRef]
- Islam, F.M.A.; Hosen, M.A.; Islam, M.A.; Lambert, E.A.; Thompson, B.R.; Lambert, G.W.; Maddison, R. Knowledge of and Intention to Participate in Physical Activity Programs and Their Associated Sociodemographic Factors in People with High Blood Pressure in a Rural Area of Bangladesh: Initial Investigation from a Cluster Randomized Controlled Trial. Int. J. Environ. Res. Public Health 2021, 18, 9561. [Google Scholar] [CrossRef]
- Bauman, A.; Bull, F.; Chey, T.; Craig, C.L.; Ainsworth, B.E.; Sallis, J.F.; Bowels, H.R.; Hagstromer, M.; Sjostrom, M.; Pratt, M.; et al. The International Prevalence Study on Physical Activity: Results from 20 countries. Int. J. Behav. Nutr. Phys. Act. 2009, 6, 21. [Google Scholar] [CrossRef] [PubMed]
- Ng, N.; Hakimi, M.; Van Minh, H.; Juvekar, S.; Razzaque, A.; Ashraf, A.; Ahmed, S.M.; Kanungsukkasem, U.; Soonthornthada, K.; Bich, T.H. Prevalence of physical inactivity in nine rural INDEPTH Health and Demographic Surveillance Systems in five Asian countries. Glob. Health Action 2009, 2, 1985. [Google Scholar] [CrossRef] [PubMed]
- Bennett, D.A.; Du, H.; Clarke, R.; Guo, Y.; Yang, L.; Bian, Z.; Chen, Y.; Millwood, I.; Yu, C.; He, P.; et al. Association of Physical Activity with Risk of Major Cardiovascular Diseases in Chinese Men and Women. JAMA Cardiol. 2017, 2, 1349–1358. [Google Scholar] [CrossRef] [PubMed]
- Shephard, R.J.; Aoyagi, Y. Measurement of human energy expenditure, with particular reference to field studies: An historical perspective. Eur. J. Appl. Physiol. 2012, 112, 2785–2815. [Google Scholar] [CrossRef] [PubMed]


| No of Participants | ≥2.5 Hours Activities Per Week | WHO Recommended, MET-min >600 min/Week | Discrepancy | p-Value | |
|---|---|---|---|---|---|
| Factors | n (%) | n (%) | n (%) | ||
| Total | 307 | 172 (56.0) | 255 (83.0) | 83 (27.0) | |
| Female | 154 | 84 (54.5) | 121 (78.6) | 37 (24.1) | 0.77 |
| Male | 153 | 88 (57.5) | 134 (87.6) | 46 (30.1) | |
| Less than 40 | 46 | 35 (76.1) | 46 (100) | 11 (23.9) | 0.21 |
| 40–49 | 65 | 45 (69.2) | 59 (90.8) | 14 (21.6) | |
| 50-59 | 95 | 57 (60.0) | 81 (85.3) | 24 (25.3) | |
| 60–69 | 79 | 30 (38.0) | 57 (72.2) | 27 (34.2) | |
| 70–75 years or older | 22 | 5 (22.7) | 14 (63.6) | 9 (40.9) | |
| No education | 99 | 48 (48.5) | 70 (70.7) | 22 (22.2) | 0.39 |
| Primary to high school | 148 | 88 (59.5) | 131 (88.5) | 43 (29.0) | |
| SSC or above | 59 | 36 (61.0) | 54 (91.6) | 18 (30.6) | |
| Poor | 92 | 56 (60.9) | 77 (83.7) | 21 (22.8) | 0.59 |
| Middle class or rich | 214 | 115 (53.7) | 177 (82.7) | 62 (29.0) | |
| Farmer | 66 | 49 (74.2) | 65 (90.3) | 16 (16.1) | 0.00 |
| Homemakers | 146 | 84 (57.5) | 118 (80.8) | 34 (23.3) | |
| Employees | 53 | 15 (28.3) | 38 (71.7) | 23 (43.4) | |
| Businessperson | 24 | 13 (54.2) | 24 (100) | 11 (45.8) | |
| No diabetes | 217 | 118 (54.4) | 171 (78.8) | 53 (24.4) | 0.32 |
| Diabetes | 41 | 20 (48.8) | 36 (87.8) | 16 (39.0) | |
| Unknown | 49 | 34 (69.4) | 48 (97.9) | 14 (28.5) |
| Physical Activity MET-min <600 min/Week vs. 600–2999 min/Week | |||||
|---|---|---|---|---|---|
| ≥2.5 h of physical activity | Yes | No | Total | PPV (95% CI) | NPV (95% CI) |
| Yes | 21 (a) | 4 (c) | 25 | 96 (90, 98) | |
| No | 37 (b) | 46 (d) | 83 | 22 (18, 25) | |
| Total | 58 | 50 | 108 | ||
| Sensitivity (95% CI) % | 36 (24, 50) | ||||
| Specificity (95% CI) % | 92 (81, 98) | ||||
| Concordance | 45 (36, 55) | ||||
| Physical activity MET-min <600 min/week vs. ≥3000 min/week | |||||
| ≥2.5 h of physical activity | Yes | No | Total | PPV (95% CI) | NPV (95% CI) |
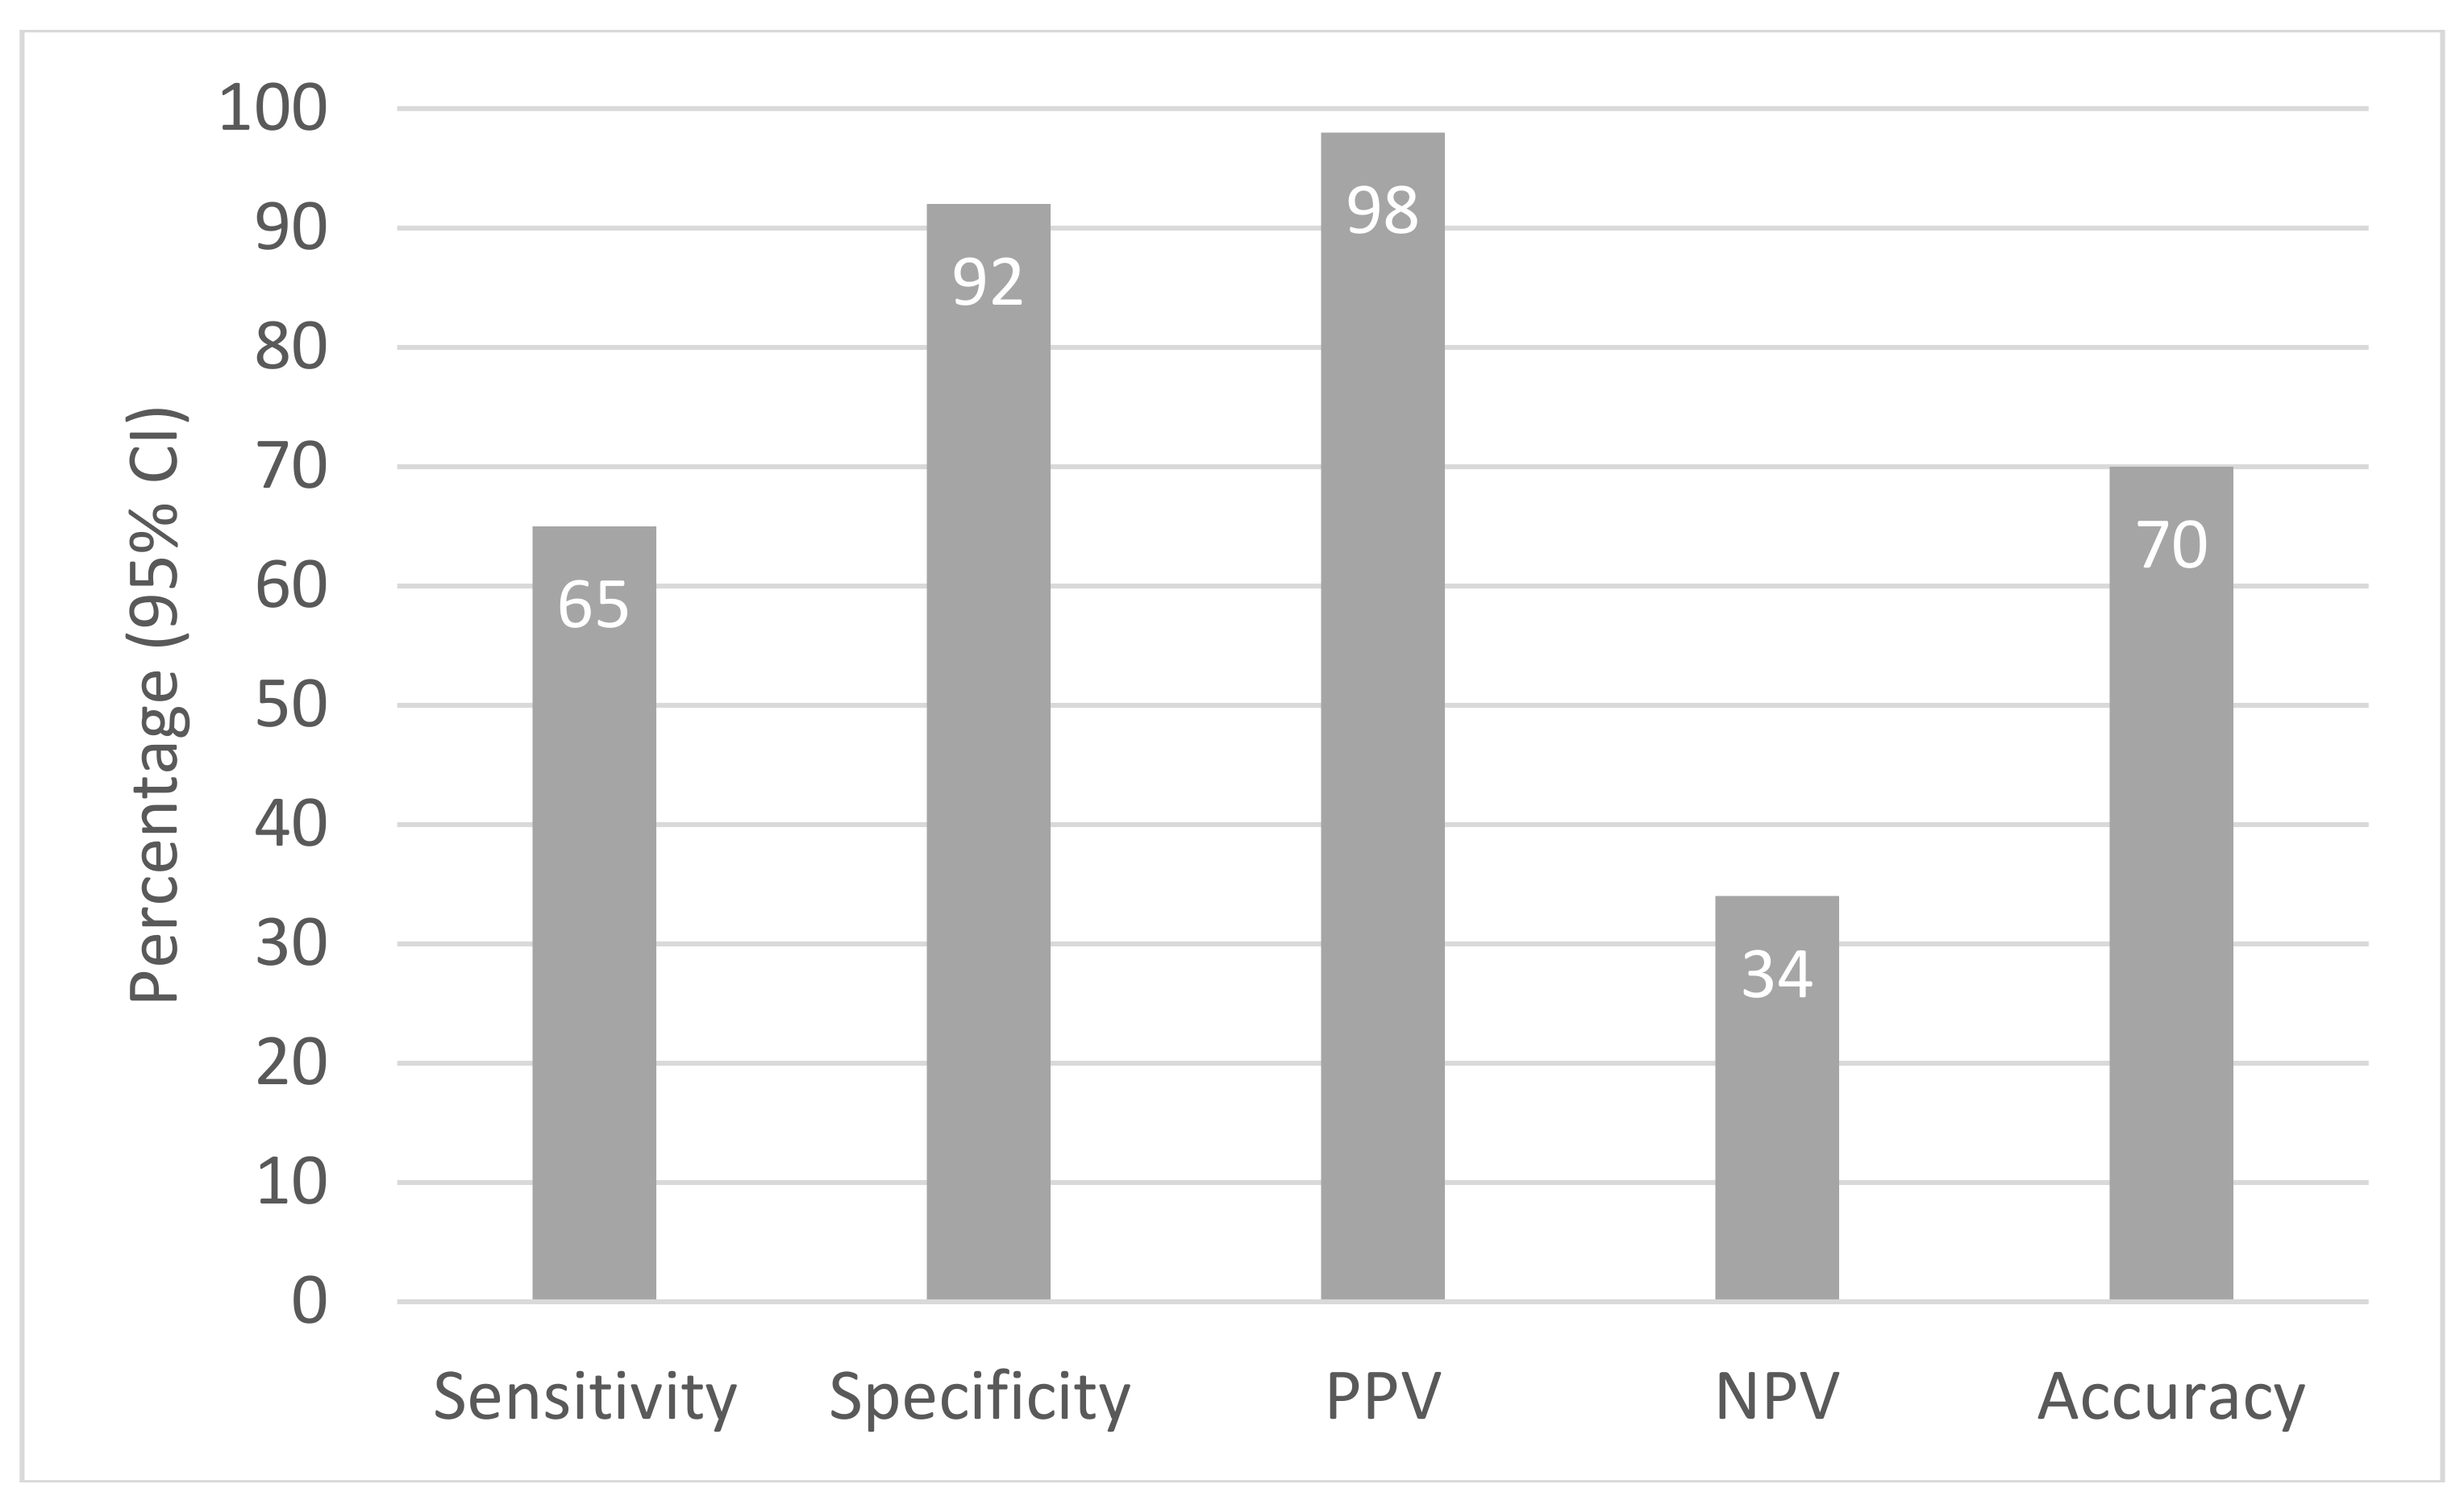
| Yes | 147 (a) | 4 (c) | 151 | 98 (95, 99) | |
| No | 52 (b) | 46 (d) | 98 | 40 (34, 46) | |
| Total | 199 | 50 | 249 | ||
| Sensitivity (95% CI), % | 74 (67, 80) | ||||
| Specificity (95% CI), % | 92 (81, 98) | ||||
| Concordance | 77 (71, 82) | ||||
| WHO Recommended MET-min >600 Per Week | |||
|---|---|---|---|
| Factors | n (%) | OR (95% CI) * | |
| Total | 257 | 89 (35) | |
| Sex | |||
| Female | 123 | 42 (34.1) | 1.00 |
| Male | 134 | 47 (35.1) | 1.04 (0.62, 1.74) |
| Age group, years | |||
| Below 40 | 46 | 11 (23.9) | 1.00 |
| 40–49 | 59 | 15 (25.4) | 1.09 (0.44, 2.66) |
| 50–59 | 81 | 25 (30.9) | 1.42 (0.62, 3.24) |
| 60–69 | 57 | 29 (50.9) | 3.30 (1.40, 7.74) |
| 70–75 | 14 | 9 (64.3) | 5.73 (1.58, 20.7) |
| Level of education | |||
| No education | 70 | 23 (32.9) | 1.00 |
| Primary to high school | 133 | 47 (35.3) | 1.12 (0.61, 2.06) |
| SSC or above | 54 | 19 (35.2) | 1.11 (0.52, 2.35) |
| Socioeconomic status | |||
| Poor | 78 | 22 (28.2) | 1.00 |
| Middle class | 178 | 67 (37.6) | 1.54 (0.86, 2.74) |
| * Occupation | |||
| Farmer | 65 | 13 (20.0) | 1.00 |
| Homemakers | 120 | 39 (32.5) | 1.93 (0.94, 3.95) |
| Professionals * | 38 | 23 (60.5) | 6.13 (2.52, 14.9) |
| Businesspersons ** | 24 | 11 (45.8) | 3.38 (1.24, 9.27) |
| Diabetes status | |||
| No diabetes | 173 | 58 (33.5) | 1.0 |
| Diabetes | 36 | 17 (47.2) | 1.77 (0.86, 3.67) |
| Unknown | 48 | 14 (29.2) | 0.82 (0.41, 1.64) |
Publisher’s Note: MDPI stays neutral with regard to jurisdictional claims in published maps and institutional affiliations. |
© 2021 by the authors. Licensee MDPI, Basel, Switzerland. This article is an open access article distributed under the terms and conditions of the Creative Commons Attribution (CC BY) license (https://creativecommons.org/licenses/by/4.0/).
Share and Cite
Islam, F.M.A.; Bhowmik, J.; Camera, D.M.; Maddison, R.; Lambert, G.W. Concordance between Different Criteria for Self-Reported Physical Activity Levels and Risk Factors in People with High Blood Pressure in a Rural District in Bangladesh. Int. J. Environ. Res. Public Health 2021, 18, 10487. https://doi.org/10.3390/ijerph181910487
Islam FMA, Bhowmik J, Camera DM, Maddison R, Lambert GW. Concordance between Different Criteria for Self-Reported Physical Activity Levels and Risk Factors in People with High Blood Pressure in a Rural District in Bangladesh. International Journal of Environmental Research and Public Health. 2021; 18(19):10487. https://doi.org/10.3390/ijerph181910487
Chicago/Turabian StyleIslam, Fakir M. Amirul, Jahar Bhowmik, Donny M. Camera, Ralph Maddison, and Gavin W. Lambert. 2021. "Concordance between Different Criteria for Self-Reported Physical Activity Levels and Risk Factors in People with High Blood Pressure in a Rural District in Bangladesh" International Journal of Environmental Research and Public Health 18, no. 19: 10487. https://doi.org/10.3390/ijerph181910487