Article

Analysis on the Temporal and Spatial Features of the Coupling and Coordination of Industrialization and Agricultural Green Development in China during 1990–2019

1
College of Biological and Agricultural Engineering, Jilin University, 5988 Renmin Street, Changchun 130022, China
2
Changchun Guoxin Modern Agricultural Science and Technology Development Co., Ltd., Shuangyang District, Changchun 130600, China
*
Author to whom correspondence should be addressed.
Int. J. Environ. Res. Public Health 2021, 18(16), 8320; https://doi.org/10.3390/ijerph18168320
Submission received: 3 July 2021 / Revised: 1 August 2021 / Accepted: 3 August 2021 / Published: 6 August 2021
(This article belongs to the Special Issue Future and Feature Paper in Environment and Applied Ecology)

Abstract

:
In the past 30 years, China’s industrialization level has developed rapidly, and agricultural green development (AGD) is facing severe challenges. The research on the temporal and spatial features of the coupling and coordination of industrialization and agricultural green development is a key issue to promote the sustainable development of agriculture. This paper takes China’s industrialization and AGD level as the research object, and uses panel data from 31 provinces in China from 1990 to 2019 to construct an evaluation index system for industrialization and AGD. This paper uses the coupling coordination degree model and spatial autocorrelation analysis method to calculate, test and analyze the temporal and spatial features of the coupling coordination level of industrialization and AGD. The results show that: this paper compares the industrialization and AGD levels during the study period and finds that China’s industrialization development level is on the rise as a whole, and the AGD level shows a downward trend first and then rises later. Through the horizontal comparison of different regions, this paper finds that there is a large regional imbalance in the level of industrialization and AGD. The coupling and coordination level of industrialization and AGD has always been primary. From the time point of view, coupling coordination degree shows a trend of first decline and then rise. From a spatial point of view, coupling coordination degree varies greatly among provinces, with the eastern, central and western regions decreasing successively. The level of coupling coordination has obvious positive autocorrelation in spatial distribution, and presents significant spatial agglomeration characteristics in space. The research results can provide a theoretical basis for regionally differentiated governance of the coordinated development of industrialization and AGD, and promote coordinated development.

1. Introduction

China’s total GDP ranks second in the world, and it has become the world’s largest newly industrialized country and the second largest economy [1]. “Innovation, coordination, green, openness and sharing” are the main characteristics of China’s current development. However, the contradiction between industry and resource and environmental constraints is still prominent [2]. The cost of environmental resources for agricultural production is too high. At present, crop production is heavily dependent on chemical fertilizers, pesticides, diesel fuel and irrigation. However, excessive use of these inputs will not only lead to increased greenhouse gas emissions [3], water consumption and water pollution [4], it will also cause serious acidification of farmland soil, threaten agricultural production, and seriously hinder AGD.
The transfer of rural surplus labor from the agricultural sector to non-agricultural sectors such as industry is an important way to eliminate the difference between workers and farmers and realize the transformation from traditional agricultural society to modern industrial society or even post-industrial society [5]. The transfer of rural surplus labor from agriculture to industry will increase the welfare of farmers [6]. This is the prerequisite and characterization of industrial development and an important aspect of industrialization. The concept of sustainable development has become a social consensus. The “True green growth” concept aims to reduce the environmental impact of economic growth [7]. The concepts of “Preferring green water and green mountains, not gold mountains and silver mountains” and “Green water and green mountains are golden mountains and silver mountains” are deeply rooted in the hearts of the people. Agriculture is the core of sustainable development. It determines the relationship between the global economy, society and the natural world [8]. AGD is gradually integrated into all aspects of economic and social development. Facts have proved that industrialization and AGD have become the driving force and index of national economic development and social transformation. The systematic analysis of the development level of industrialization and AGD, as well as the coupling and coordination of the two systems, and the temporal and spatial features can provide a scientific reference for national and regional development decisions.

2. Literature Review

There are few studies on the coordinated relationship between industrialization and AGD in the existing literature, but scholars have done a lot on industrialization and agricultural development or ecological environment. The concept of “AGD” has been fully proposed in a relatively short time. Scholars’ specific research on the AGD is relatively rare. However, related “agricultural sustainability” research is relatively rich, which can provide a reference for studying the relationship between China’s industrialization and AGD.

2.1. Research on the Relationship between Industrialization, Agricultural Development, and Ecological Environment

Industrialized economies tend to grow faster, while non-industrialized economies lag behind [9]. Industrialization is a rapid and long-term process of comprehensive changes in the economic structure, a process of improving the quality and efficiency of economic growth, and a historical process from an agricultural society to an industrial society. With the update and iteration of new technologies, the conditions for industrial development are gradually changing, and the conditions for agricultural development will also change with the advancement of biotechnology. The process of technological change is related to the increase in labor productivity brought about by the use of fertilizers and mechanization, together with the law of centralized agricultural land ownership, releasing cheap labor for industry [10]. In short, the high output of agriculture can accelerate the process of industrialization, while the lag of industrial production will hinder the development of agriculture [11]. At the same time, in the process of industrialization and agricultural development, the role of local governments cannot be ignored. The response of local governments to changes in national development policies will affect the development of local societies and rural microregions [12]. As long as external financial resources have appropriate goals and effective use, conditions can be created for the sustainable development of the economy [13]. Therefore, it is necessary for the government to consider the relationship between agricultural development and industrialization before introducing new agricultural policies [14]. The environmental protection of agricultural ecology is currently a major strategic task for the sustainable development of agriculture and rural areas in China. Human activities have significantly changed the natural ecosystem [15]. This seriously threatens biodiversity [16]. For example, the expansion of industrialization has caused a large amount of agricultural land loss and environmental pollution [17]. The exploitation of natural resources will also have a negative impact on the environment [18], which will also have a greater impact on the improvement of agricultural land and the quality of agricultural products. International policy makers are gradually paying attention to issues of green growth, the promotion of energy efficiency and clean energy technology, and sustainable development [19].

2.2. Research on the Sustainable Development of Agriculture

After the Second World War, due to the blind pursuit of the efficiency of agricultural industrialization, agricultural development continued to suffer from problems such as overproduction, biodiversity and loss of soil fertility [20]. Modern agriculture must meet new challenges, such as producing healthy food, adapting to climate change [21], while meeting the needs of a growing population [22] protecting natural resources and protecting landscapes [21]. Scholars began to carry out a series of studies on sustainable agricultural development in response to this issue.
Sustainable development in agriculture refers to agricultural activities that are environmentally sound, technically appropriate, economically feasible and socially acceptable. At the same time, the realization of sustainable agriculture requires the optimization of the agricultural system, including the coordination and trade-offs of a series of factors such as agronomy, environment, social economy, agricultural product diversity, and human nutrition [8]. Sustainable agriculture integrates biology, chemistry, physics, ecology, economics, and social sciences in an integrated manner to develop new agricultural practices that are safe and will not damage the environment [23]. It is a choice to solve the resource and environmental constraints faced by food production through ecological methods [24].
Research on the comprehensive evaluation of sustainability includes social, economic and ecological dimensions, and goes beyond the current linear evaluation methods [25]. Rodrigues et al. (2018) evaluated the impact of ecological intensification measures on coconut production, and the results showed that diversified technologies are positively correlated with higher agricultural sustainability [26]. Buseth (2019) focuses on cross-disciplinary research on green economy, political economy, ideology, etc. [27]. Luis (2021) discusses sustainable development goals and indexes [28]. Nadaraia (2021) identified 47 indexes that can be used to assess the sustainability of plantation agricultural systems [29]. Wang et al. (2021) analyzed the sustainable development of agriculture from the three dimensions of environment, society and economy, identified the main factors affecting the sustainable development of agriculture, and proposed improvement measures and management suggestions to reduce obstacles to sustainable agricultural development and improve Sustainable Agriculture Practice [22].

2.3. Research on Agricultural Green Development

Due to the uncertainty brought about by environmental changes, green development is receiving increasing attention from countries all over the world [30]. Green growth is more conducive to the economy, the environment, balance and sustainability. Generally speaking, the concept of green development is considered the second generation of the concept of sustainable development [31]. Wang et al. (2021) used the entropy TOPSIS model and Theil index to reveal the differences in the green development of industries in China’s three major urban agglomerations [32]. The overall goal of AGD is to coordinate “green” and “development” to realize the transformation of current agriculture with high resource consumption and high environmental cost to a green agriculture with high productivity, high resource utilization efficiency and high efficiency [33]. Among them, the research on AGD mainly focuses on evaluating the process of AGD by constructing an AGD index [34,35]. Wang et al. (2021) used the Slacks-based model to measure the efficiency of agricultural green production in the middle reaches of the Yangtze River based on the input-output index system of agricultural green production [36].

2.4. Research Review

In summary, with the increasing number of research dimensions, the research content has evolved from a single study of the relationship between industrialization and AGD to the relationship between different research objects, and the research methods have evolved from methods such as the analytic hierarchy process and entropy method to the Tobit model and the degree of coupling and coordination. Complicated evaluation methods such as models. The depth of theoretical analysis continues to increase, and research is closely related to national and regional development strategies. It has become an important reference for national and local governments’ scientific decision-making. However, China has a vast territory, and there are obvious regional differences in natural geographic background and economic development level. Scholars’ research on the level of national industrialization, agricultural green development and the degree of coupling and coordination between the two systems is still blank. This paper draws on the methods of the above research. This paper intends to construct a set of index systems that can comprehensively and scientifically reflect the level of “industrialization and green agricultural development”. The research object of this paper is the level of industrialization and AGD in 31 provinces (autonomous regions and municipalities) in China. Based on the panel data from 1990 to 2019, this paper uses the improved entropy method to determine the index weight, and uses the coupling coordination degree model to calculate the coupling coordination degree of industrialization and AGD. This paper uses ArcGIS spatial analysis to reveal its spatial differences, and combines spatial autocorrelation analysis methods to test and analyze the temporal and spatial features of the coupling and coordination level of industrialization and AGD. This paper hopes to provide theoretical reference and policy guidance research content for the subsequent coordinated development of China’s industrialization and AGD.

3. Materials and Methods
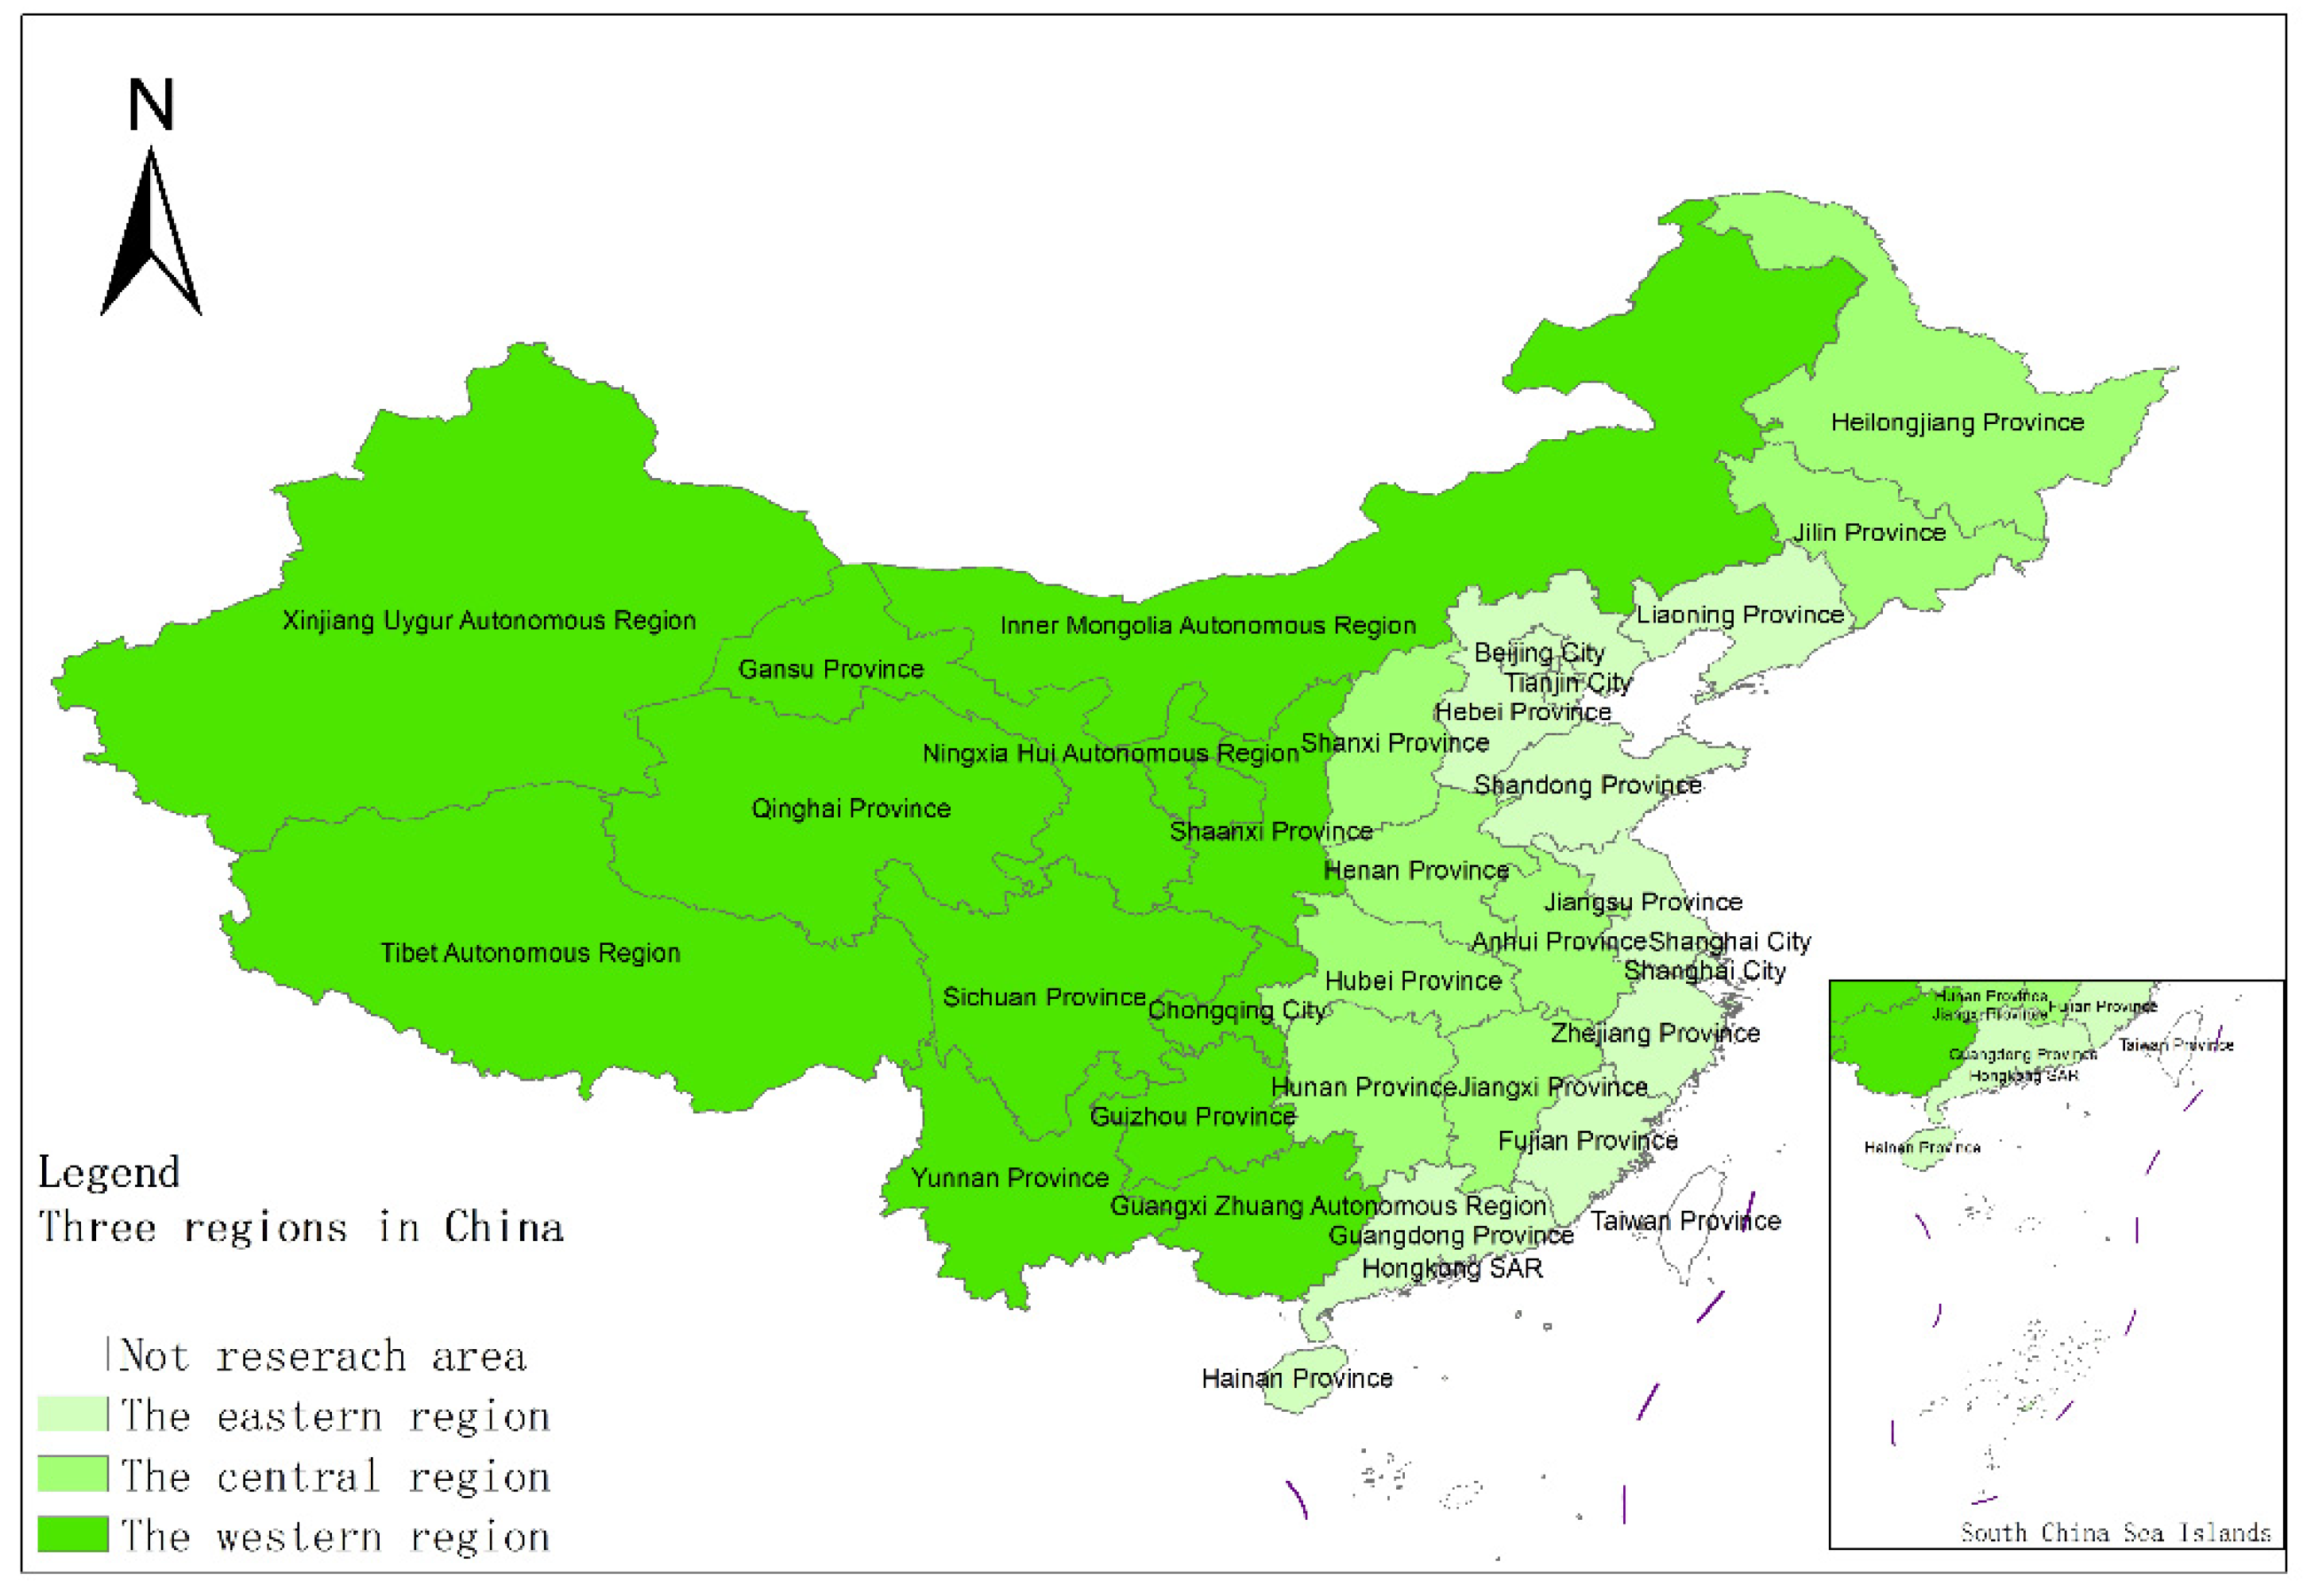
3.1. Data Sources

The data required for this paper are from the 1991–2020 China Statistical Yearbook, China Industrial Statistical Yearbook, China Rural Statistical Yearbook, China Regional Economic Statistical Yearbook, as well as the statistical yearbooks of various provinces, autonomous regions, and municipalities, economic and social development statistical bulletin. Due to the availability of data, Hong Kong, Macau and Taiwan have not been included in the study. China has a vast territory, and there are obvious differences in agricultural resource endowments and support policies. This paper analyzes the spatial differences of industrialization, AGD levels and coupling and coordination features in different regions, and divides China’s 31 provinces (autonomous regions and municipalities) except Hong Kong, Macau, and Taiwan into three major regions: the east, the middle, and the west. The specific division is shown in Figure 1.

3.2. Index Construction

3.2.1. Industrialization Development Level Evaluation Index

China’s industrialization is one of the characteristics of economic growth [37]. The industrialization development level evaluation indexes select four indexes: per capita GDP [1], the proportion of secondary industry output [38], the proportion of secondary industry employment [39], and secondary industry’s labor productivity [32,39]. This paper conducts a comprehensive evaluation of the level of industrialization development from the perspective of economic strength, output, employment, and labor productivity.

3.2.2. Evaluation Index of Agricultural Green Development Level

Although domestic research on the level of AGD are abundant, existing studies are not uniform in the index system for evaluating the level of AGD. China’s agricultural sector formally proposed the goal of “one control, two reductions and three basics” in 2015. “One control” refers to controlling the total amount of agricultural water use and agricultural water environmental pollution, ensuring that the total amount of agricultural irrigation water is maintained at 372 billion cubic meters. The water quality of farmland irrigation meets the standard. “Two reductions” refers to the reduced use of chemical fertilizers and pesticides. The “three basics” means that livestock and poultry manure, agricultural film, and crop straw are basically recycled, comprehensively recycled, and treated in a harmless manner [40]. On the whole, the amount of manure produced in China’s livestock and poultry farming has little impact on the environment [41]. Farms above the designated size break up the straw and return it to the field [42] or carry out conservation tillage. Moreover, this paper is affected by the availability of data, and the harmless treatment rate of livestock and poultry manure and straw has not been included in the evaluation index of the level of AGD. The recycling rate of mulch film is low [43], so the intensity of use is used. This paper selects eight indexes to evaluate the level of AGD: the per capita disposable income of rural residents [34,40], the level of agricultural mechanization [39,40,44] and the rate of land output [29,45], the level of farmland being irrigated [39,44], the intensity of fertilizer used [29,44], the intensity of pesticides used [29], the intensity of the used agricultural film [46], the proportion of disaster area [34]. The evaluation index system is shown in Table 1.

3.3. Analytical Method

3.3.1. Entropy Weight Method

In order to effectively avoid subjectivity [47], this paper uses the entropy method to determine the index weight. The smaller the information entropy, the greater the index weight [48]. This paper selects the data as panel data. In order to make the years comparable, time variables are introduced to improve the entropy method [34]. The evaluation model is as follows:
  • Construct the original index matrix data: given years, provinces, indexes, the original index matrix is X = { x λ i j } h n m ( 1 λ h , 1 i n , 1 j m ) , and x λ i j is the index value of the λ year, the i province, and the j index. In this paper h , n and m are 30, 31 and 8.
  • Dimensionless processing of the range standard method for each index in the index system:
    Standardization   of   positive   indexes :   Z λ i j = x λ i j x m i n x m a x x m i n
    Standardization   of   negative   indexes :   Z λ i j = x m a x x λ i j x m a x x m i n
  • Determine the index weight:
    P λ i j = Z λ i j λ = 1 h i = 1 n Z λ i j
  • Calculate the entropy value of various indexes:
    E j = k λ = 1 h   i = 1 n P λ i j ln P λ i j
    k = 1 ln ( h n )
  • Calculate the redundancy of the entropy values of various indexes:
    D j = 1 E j
  • Calculate the weight of each index:
    W j = D j j = 1 n D j
  • Construct a multi-index weighted comprehensive evaluation model:
    U = j = 1 n W j Z λ i j

3.3.2. Coupling Coordination Degree Model

Coupling refers to the process in which the systems under study influence each other through different links [49], Coupling coordination degree model is an evaluation of the degree of mutual influence between systems. This model has been widely used in the fields of social economics, biology, agriculture, ecology, etc. [31]. The two systems of China’s industrialization and AGD do not exist independently, and there are mutual promotion and mutual constraints between them. This paper uses the coupling coordination degree model to express the industrialization index ( U 1 ) and the AGD index ( U 2 ) . This paper first calculates the coupling degree ( C ) of each province (autonomous regions, municipalities) from 1990 to 2019. On this basis, this paper calculates the coupling coordination degree of the two systems [50] ( D ) . The value range of D is ( 0 , 1 ) . Specifically, the closer to 1, the more coordinated and balanced the industrialization and AGD; the closer to 0, the worse the coordination and imbalance of development. The calculation formula is:
C = 2 [ ( U 1 · U 2 ) ( U 1 + U 2 ) ] 1 2
T = α U 1 + β U 2
D = C · T
In the formula, T is the comprehensive coordination index of industrialization and AGD; α and β are undetermined coefficients α + β = 1 . In this paper, an improved entropy method is used to determine the value of the undetermined coefficient, α = 0.3332 ,   β = 0.6668 . Referring to related literature [51], the coupling and coordination level of industrialization and AGD in various provinces (autonomous regions and municipalities) is divided into 10 levels: extreme disorder ( 0 ,   0.1 ) , severe disorder ( 0.1 ,   0.2 ) , moderate disorder ( 0.2 ,   0.3 ) , mild disorder ( 0.3 ,   0.4 ) , on the verge of disorder ( 0.4 ,   0.5 ) , grudging coordination ( 0.5 ,   0.6 ) , primary coordination ( 0.6 ,   0.7 ) intermediate coordination ( 0.7 ,   0.8 ) , good coordination ( 0.8 ,   0.9 ) , quality coordination [ 0.9 , 1 ] .

3.3.3. Spatial Autocorrelation Analysis

As China’s industrialization and AGD have different degrees of impact on the neighborhood in terms of spatial distribution features, this paper uses the establishment of a spatial autocorrelation analysis model to study the changes in the spatial layout of the coupling and coordination of industrialization and AGD. At present, global spatial autocorrelation and local spatial autocorrelation are the two systems most commonly used in exploratory spatial data analysis [52]. Among them, the global spatial autocorrelation reflects the spatial correlation mode of a certain attribute value in the entire research area. The local spatial autocorrelation further reveals the correlation and distribution law of certain attribute values in the local space. The global spatial autocorrelation is usually represented by the global Moran’s I measurement, which ranges from [ 1 1 ] . When Moran s   I < 0 , it means that there is a negative spatial correlation between industrialization and AGD; when Moran s   I = 0 it means that there is no spatial correlation; when Moran s   I > 0 , there is a positive correlation. The calculation formula is [53]:
Moran s   I = n i = 1 n   j = 1 n   W i j ( x i x ¯ ) ( x j x ¯ ) i = 1 n   ( x i x ¯ ) 2 i = 1 n   j = 1 n   W i j
In the formula, n is the number of research areas, X i and X j represent the index values of areas i and j ; W i j represents the proximity relationship between areas i and j , when W i j = 1 , the area i and j are adjacent, when W i j = 0 , the area i and j are not adjacent.
Local autocorrelation index G can detect whether there are high address clusters in a local area. The calculation formula is:
G = j = 1 n   W i j X j i = 1 n   X i
In the formula, G is the local autocorrelation index.

4. Results

4.1. Index Weight

In this paper, Equations (1)–(7) are used to determine the index weights, and the weight results are shown in Table 2.

4.2. China’s Industrialization and Agricultural Green Development

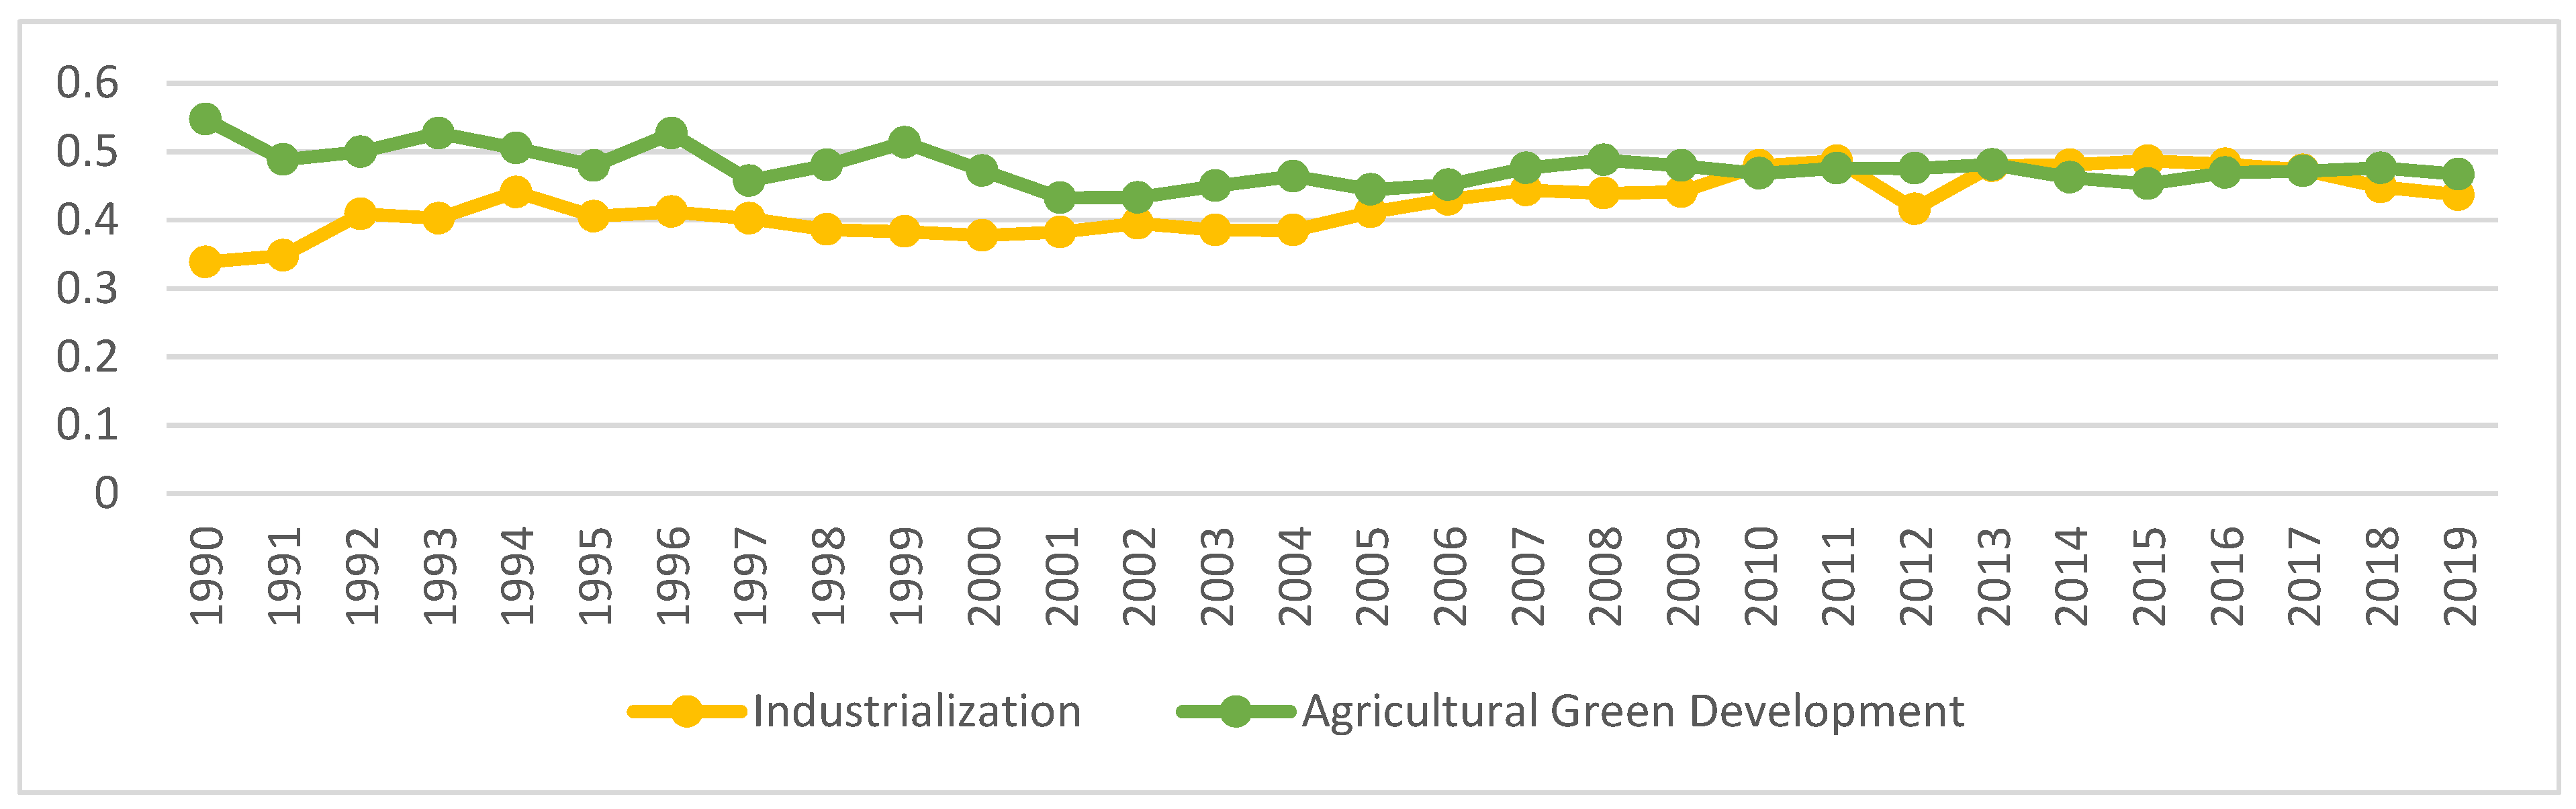
4.2.1. Industrialization Development Index

After determining the weights, Formula (8) is used to obtain the industrialization development index of China’s 31 provinces (autonomous regions and municipalities). The results are shown in Table 3. The level of industrialization development of China’s provinces (autonomous regions and municipalities) is on the rise as a whole, showing a spatial trend of the east > the middle > the west. Areas with higher development indexes than the average are mainly located in the eastern coastal areas of Bohai Economic Rim, Yangtze River Delta Economic Zone, Pearl River Delta and Beijing-Tianjin-Hebei region have relatively developed economies. Regions with a development index below the average are mainly distributed in Southwest and Northwest Territories, which is basically the same as the regional economic development pattern.

4.2.2. Agricultural Green Development Index

Using the same method to obtain the AGD index of China’s 31 provinces (autonomous regions and municipalities), the results are shown in Table 4, the overall AGD level of China’s provinces (autonomous regions and municipalities) has declined first and then increased. From a spatial perspective, there is a trend of east > middle > west. Areas with an AGD index higher than the average are mainly distributed in the North China Plain, southeastern coastal areas and Qinghai-Tibet plateau. Areas with an index lower than the average are mainly distributed in the Yunnan-Guizhou-Sichuan, Shaanxi-Gansu-Ningxia regions. The regional pattern may be related to the regional social economy The level of development is related to the background of natural geography, etc.

4.2.3. Overall Development Level

Using the provincial average of each index, explore the difference between China’s industrialization and AGD index from 1990 to 2019, as shown in Figure 2.
From 1990 to 2019, China’s industrialization development has generally gone through four development stages. Industrialization was in a rapid development stage from 1990 to 1994; the industrialization index was stagnant from 1994 to 2004; the industrialization index was fluctuating and rising after 2004–2015; the industrialization index was declining during 2015–2019. The industrialization development index remained at about 0.42 during the study period. The level of AGD is more complicated. From 1990 to 2001, the AGD index was in a state of volatility and decline; from 2001 to 2015, the AGD index was in a trend of first increasing and then decreasing; 2015–2019 AGD index was in a state of volatility and rising During the research period, the AGD index remained at around 0.47.

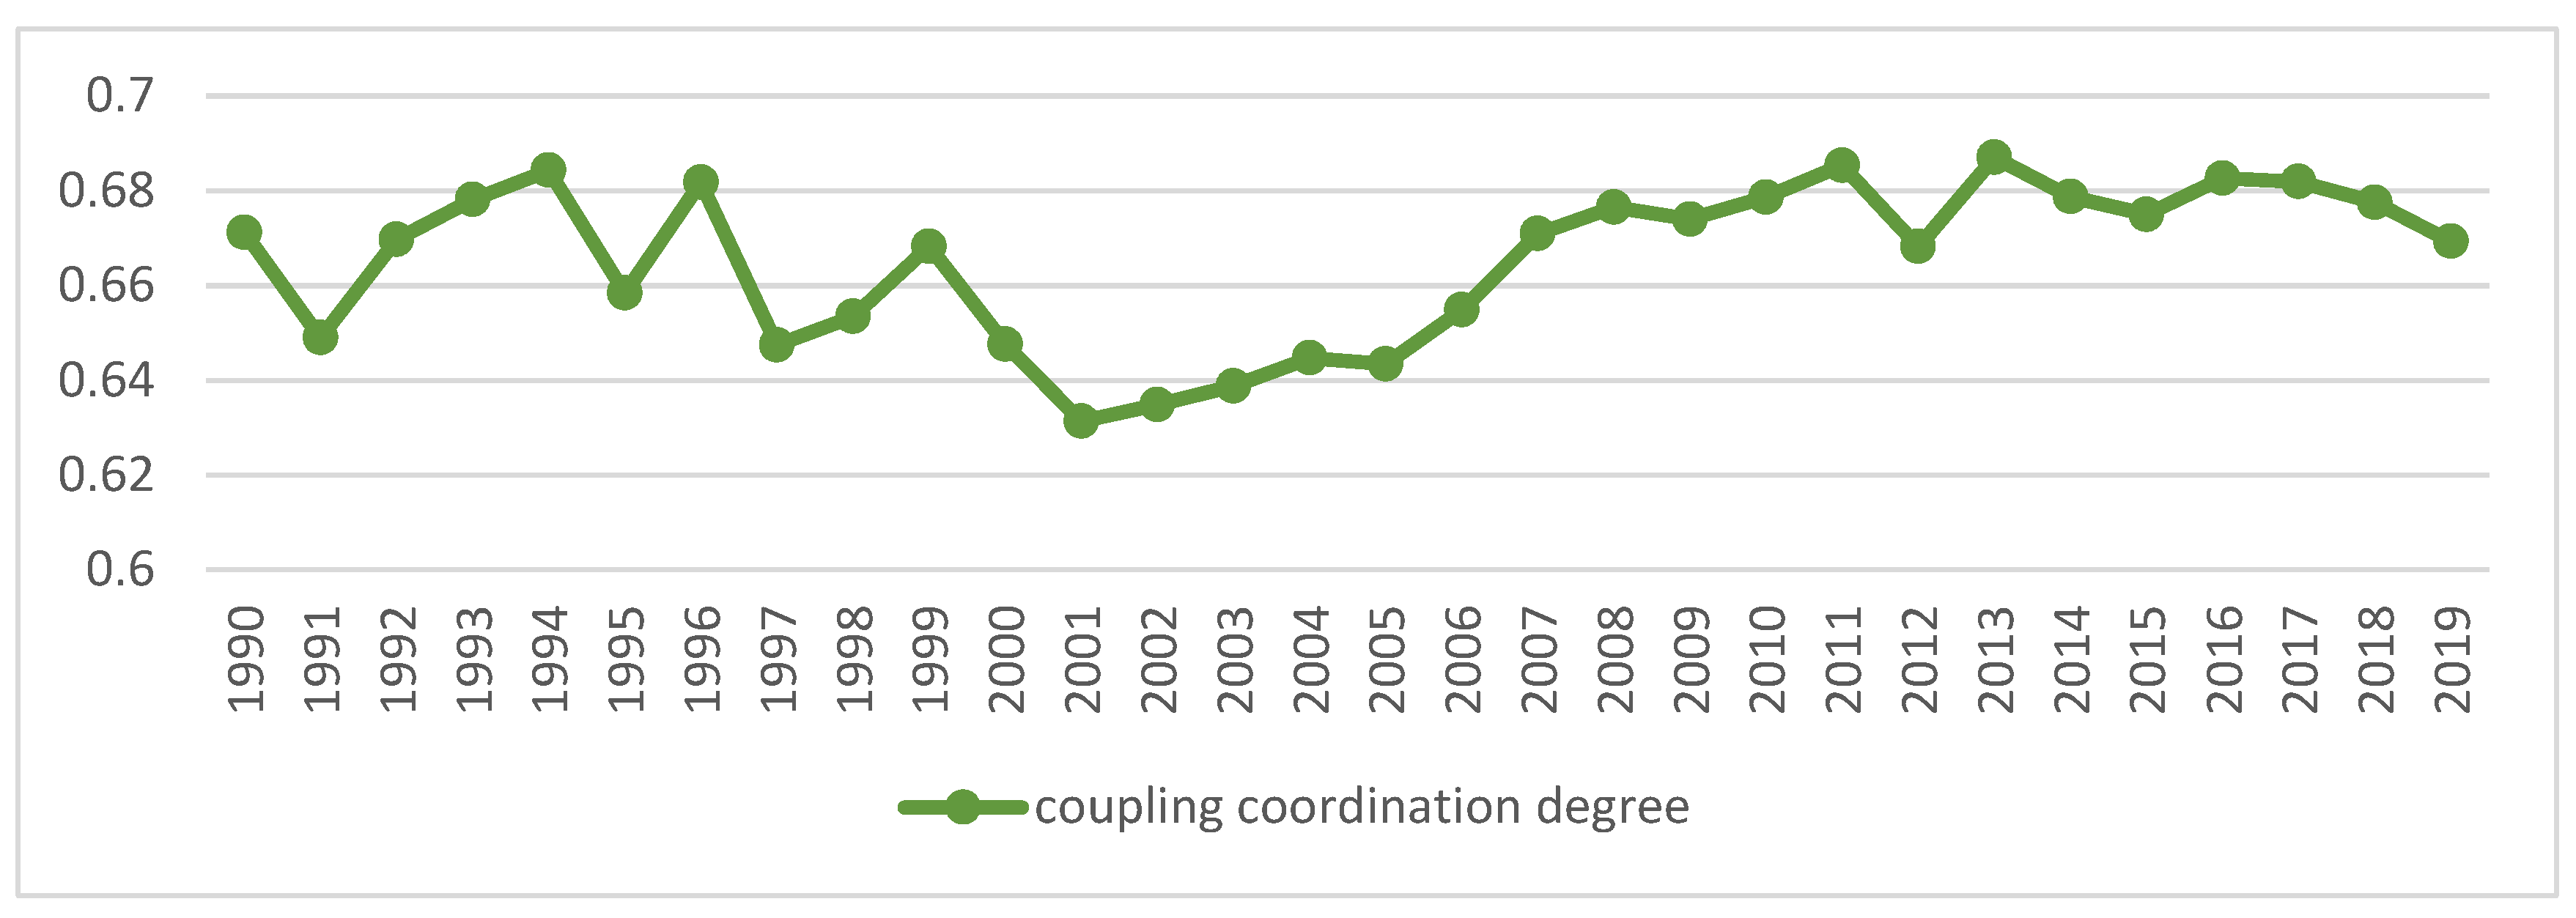
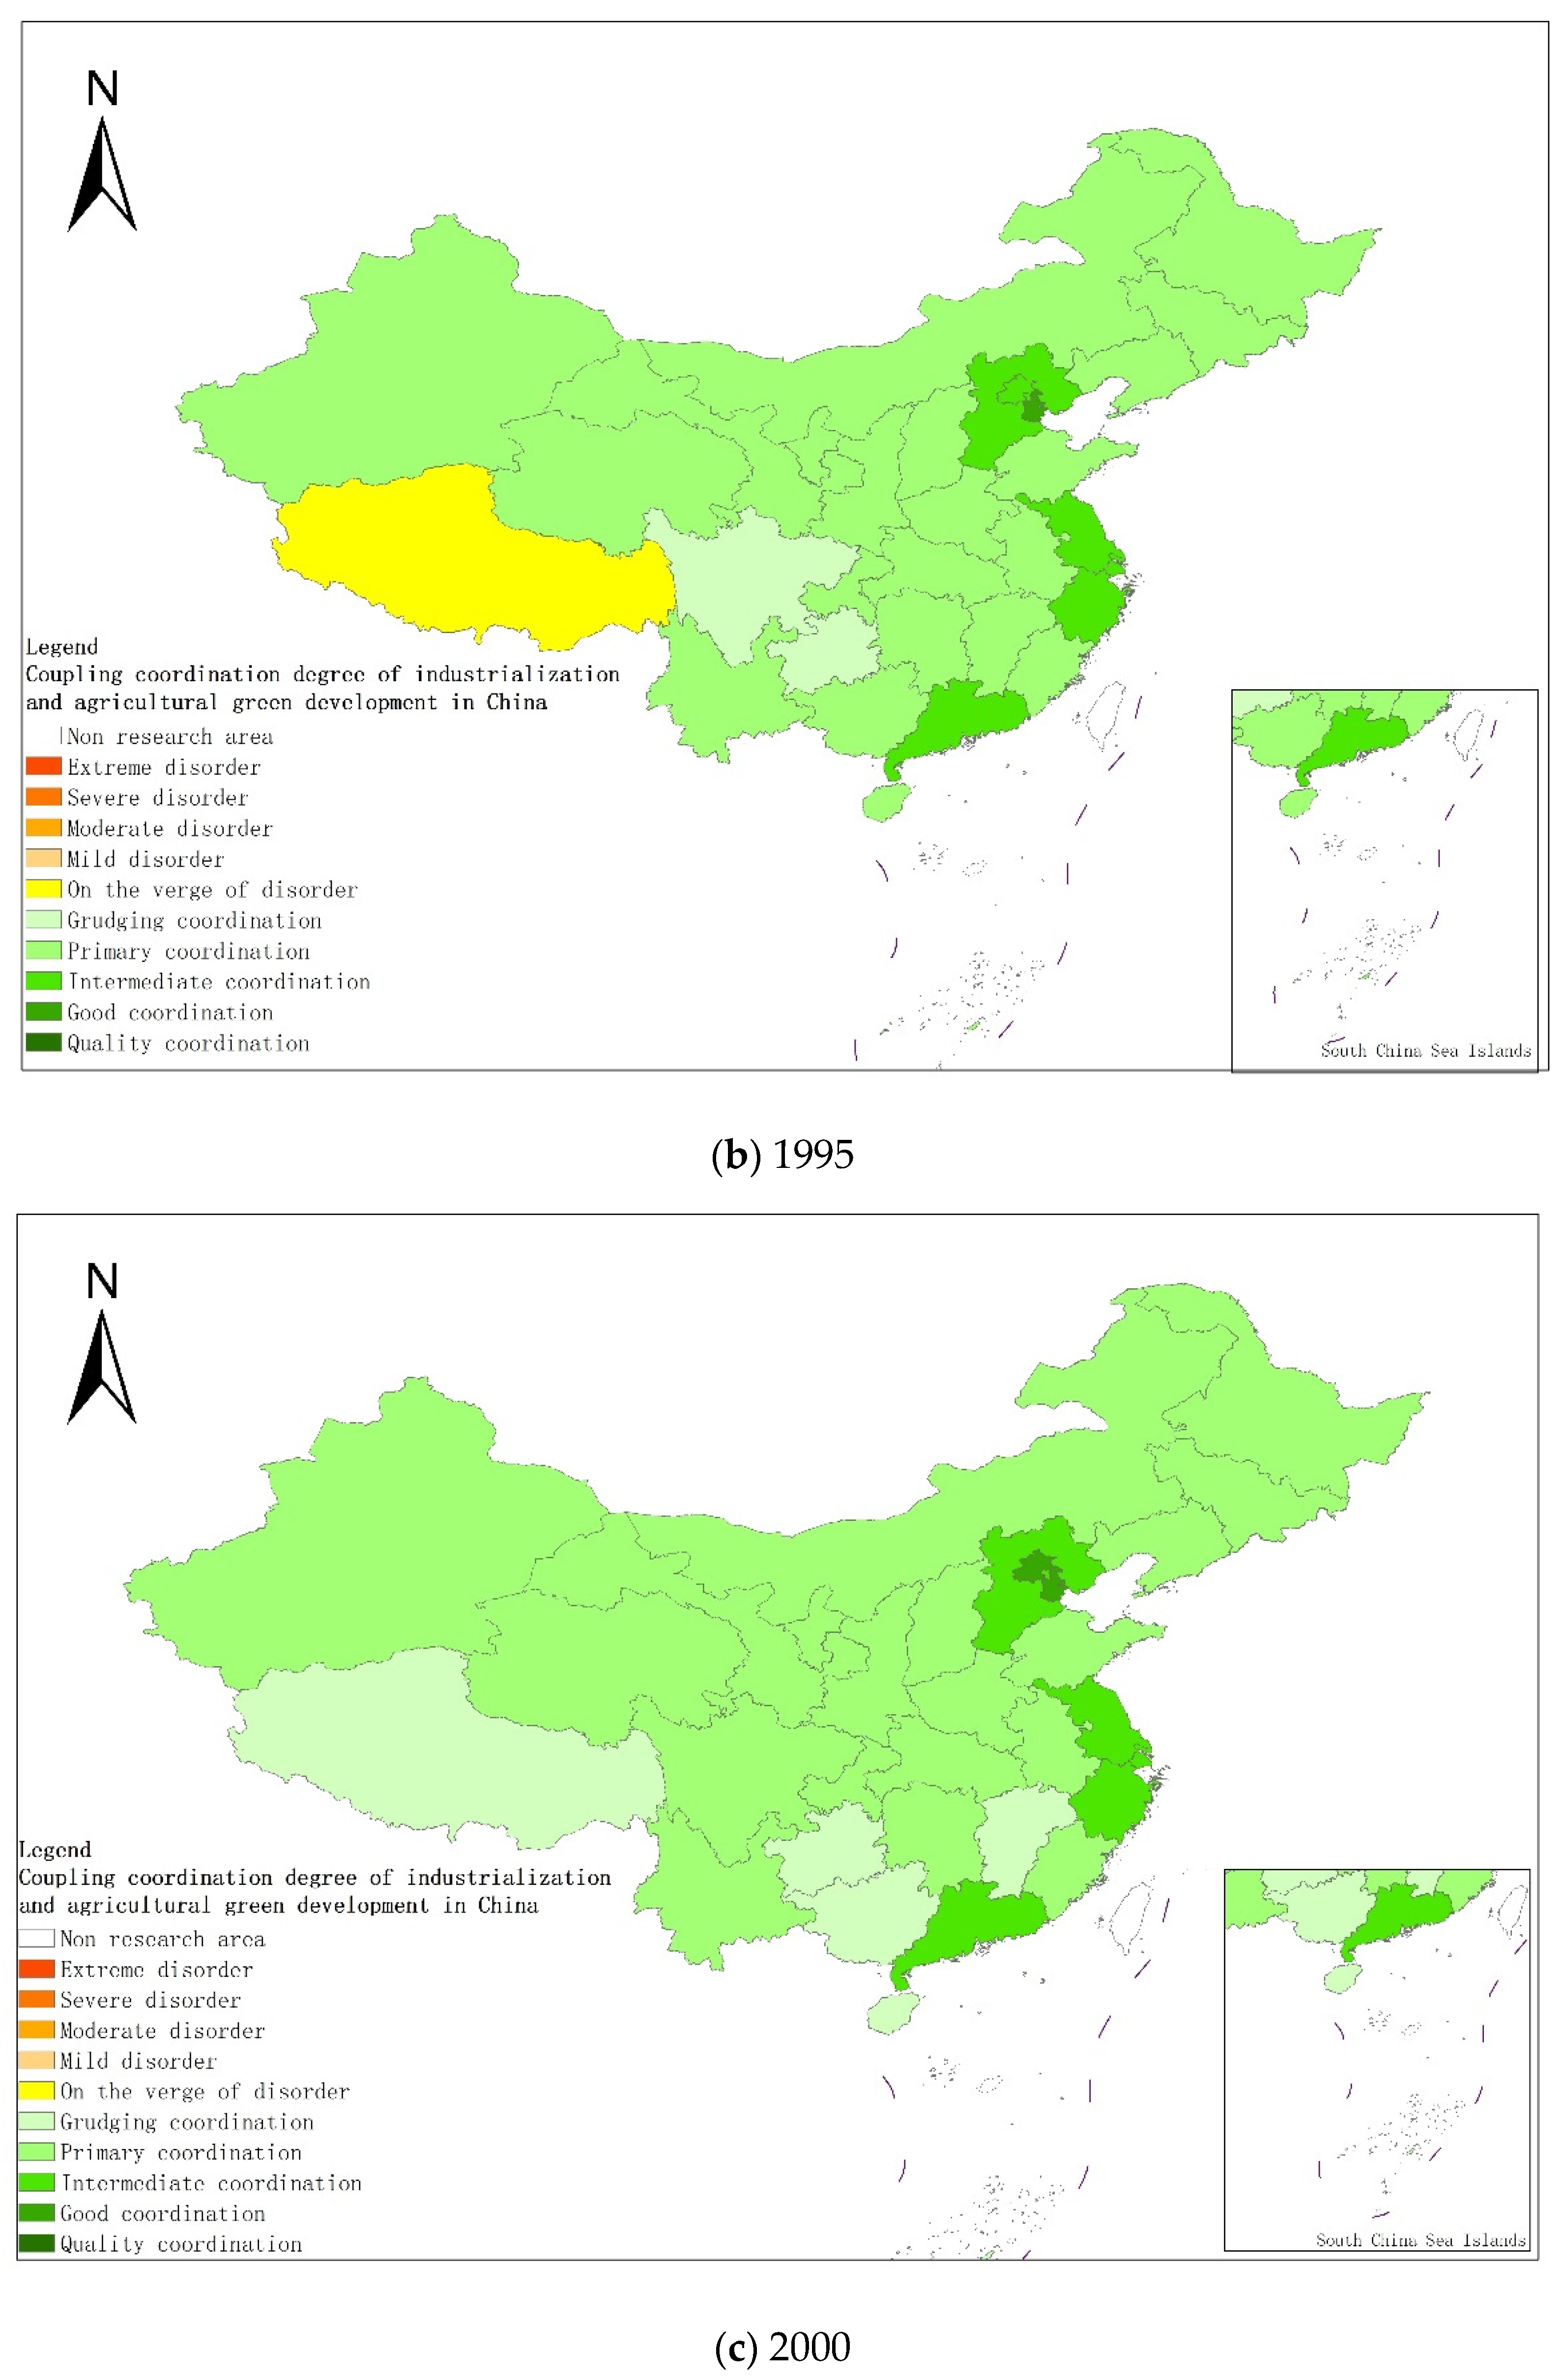
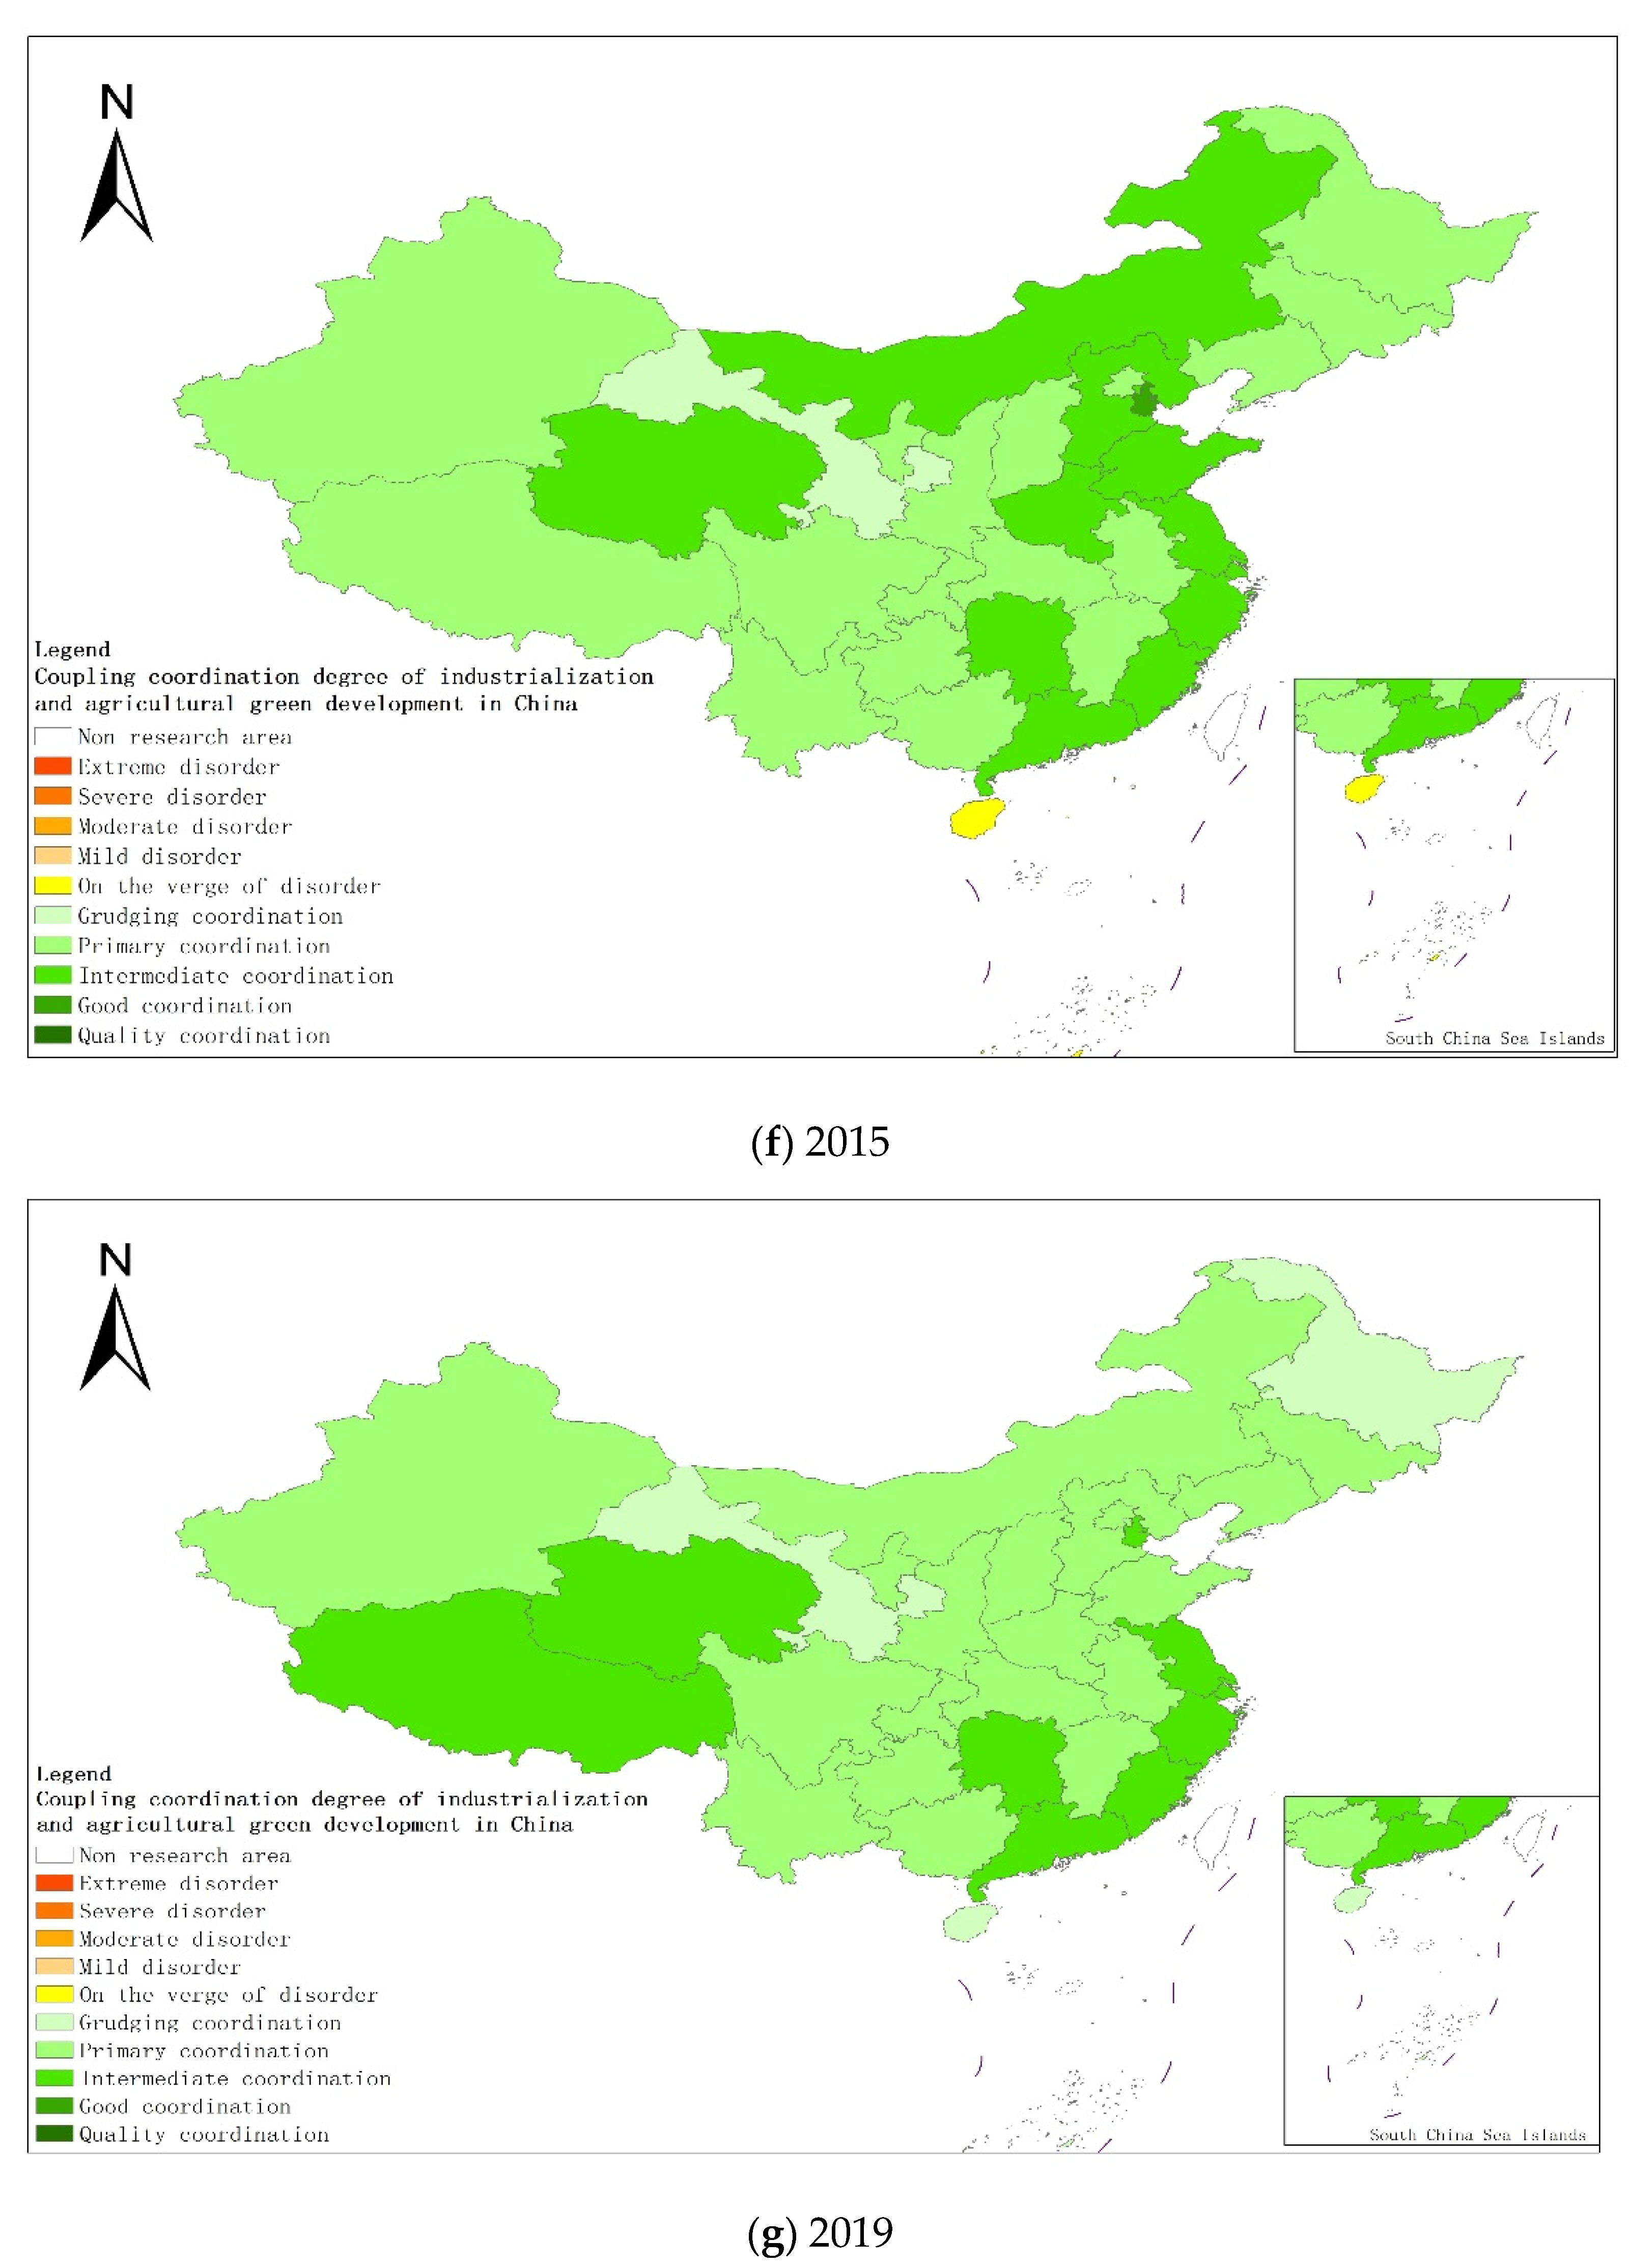
4.3. Coupling and Coordination Degree of Industrialization and Agricultural Green Development

According to Equation (9)–(11), the degree of coupling and coordination between China’s industrialization and AGD from 1990 to 2019 is calculated, and the calculation results are shown in Figure 3.
On the whole, from 1990 to 2019, the average value of the coupling coordination degree of China’s industrialization and AGD was 0.67, which has been in the primary coordination stage and still has huge development potential. The two systems present a relatively obvious interconnection and mutual influence relationship, and form an open and complex system. In the process of economic development, industrialization and AGD work together, and the disorderly development of any index will lead to a decline in the degree of system coupling and coordination. The coupling and coordination level of the two systems is improving, but the speed of improvement is gradually slowing down, and no further breakthroughs have been made in recent years, and it has entered a bottleneck period of transition to a higher level.
From a regional perspective, Figure 4a–g shows the types of coupling coordination in various provinces (autonomous regions and municipalities) in some years. The number of regions on the verge of dysfunction has been reduced from 1 to 0, and no regions are in lightly coordinated and high-quality coordinated provinces. It can be seen from the figure that during the study period, the three major regions showed a trend of first decreasing and then increasing, with the eastern, central and western regions successively decreasing. The eastern region has a relatively high level of industrialization development, but the level of AGD is relatively low. For example, in Fujian, the road of industrialization at the expense of AGD has restricted the further improvement of the level of coupling and coordination. Although the level of industrialization in the central and western regions is not as high as that in the eastern regions, the industrial structure in some regions is reasonable, and the reduction of chemical fertilizers and pesticides has been significant, making the gap in the level of coupling and coordination of industrialization and AGD not obvious.

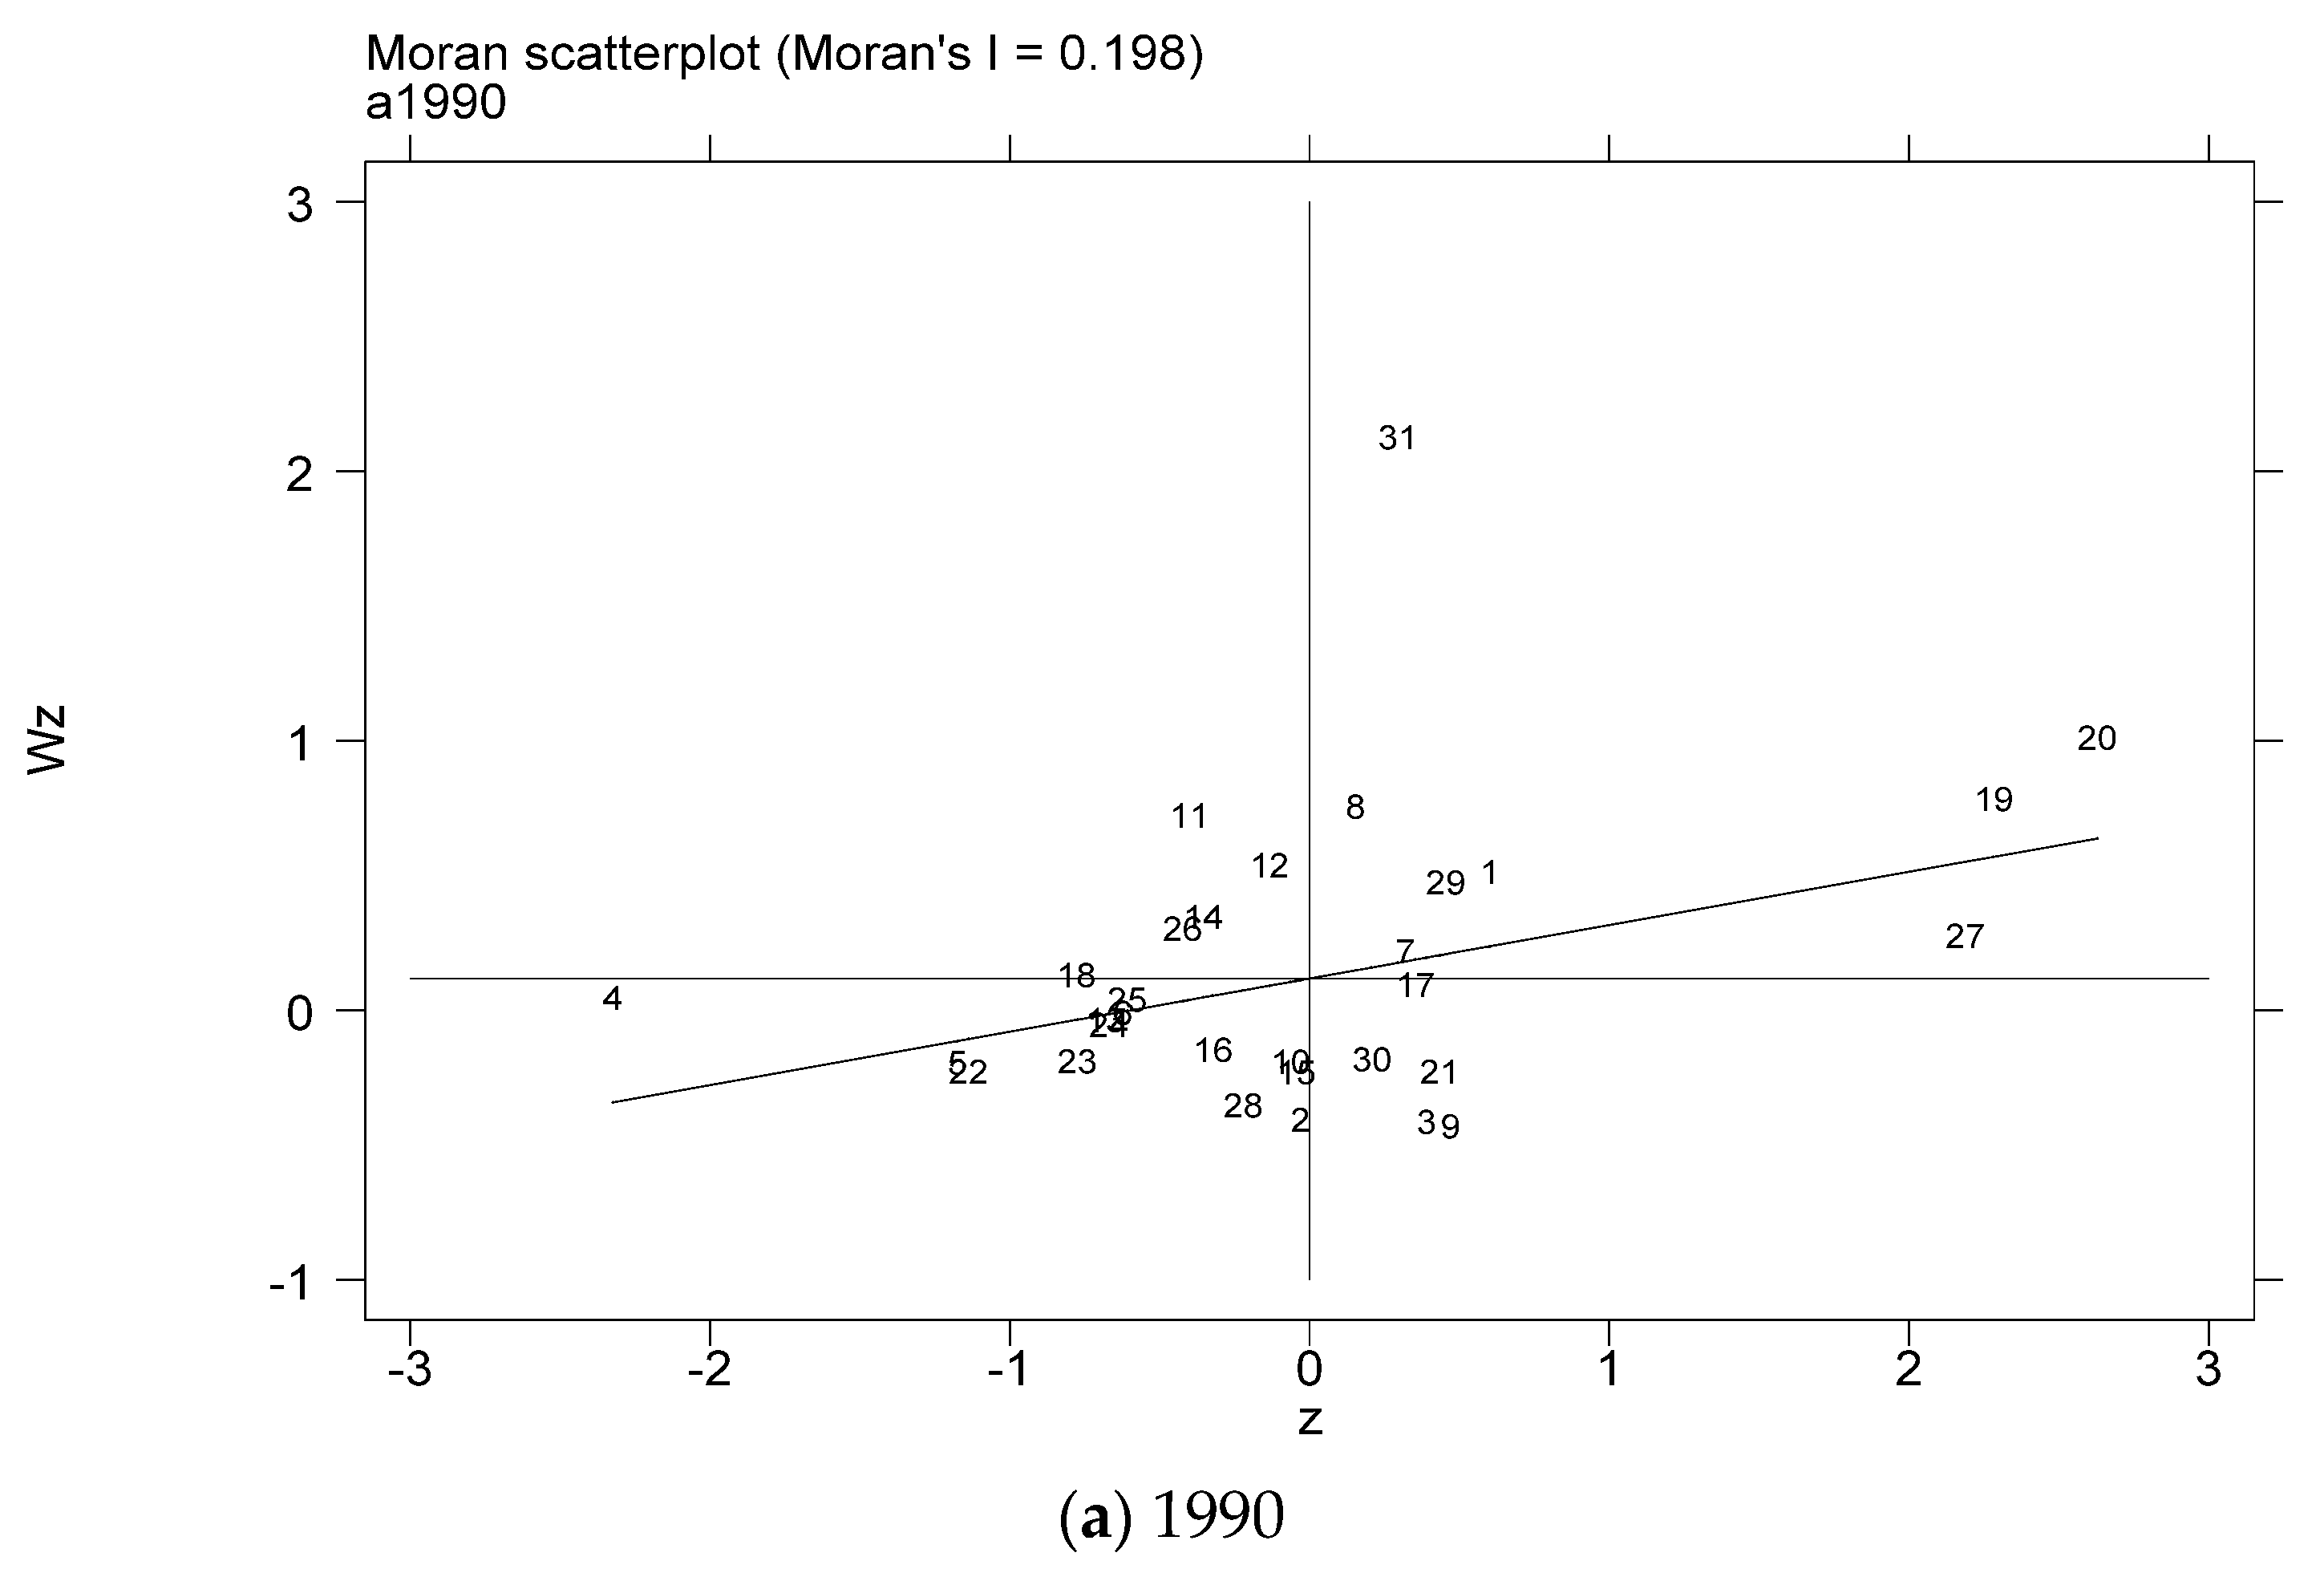
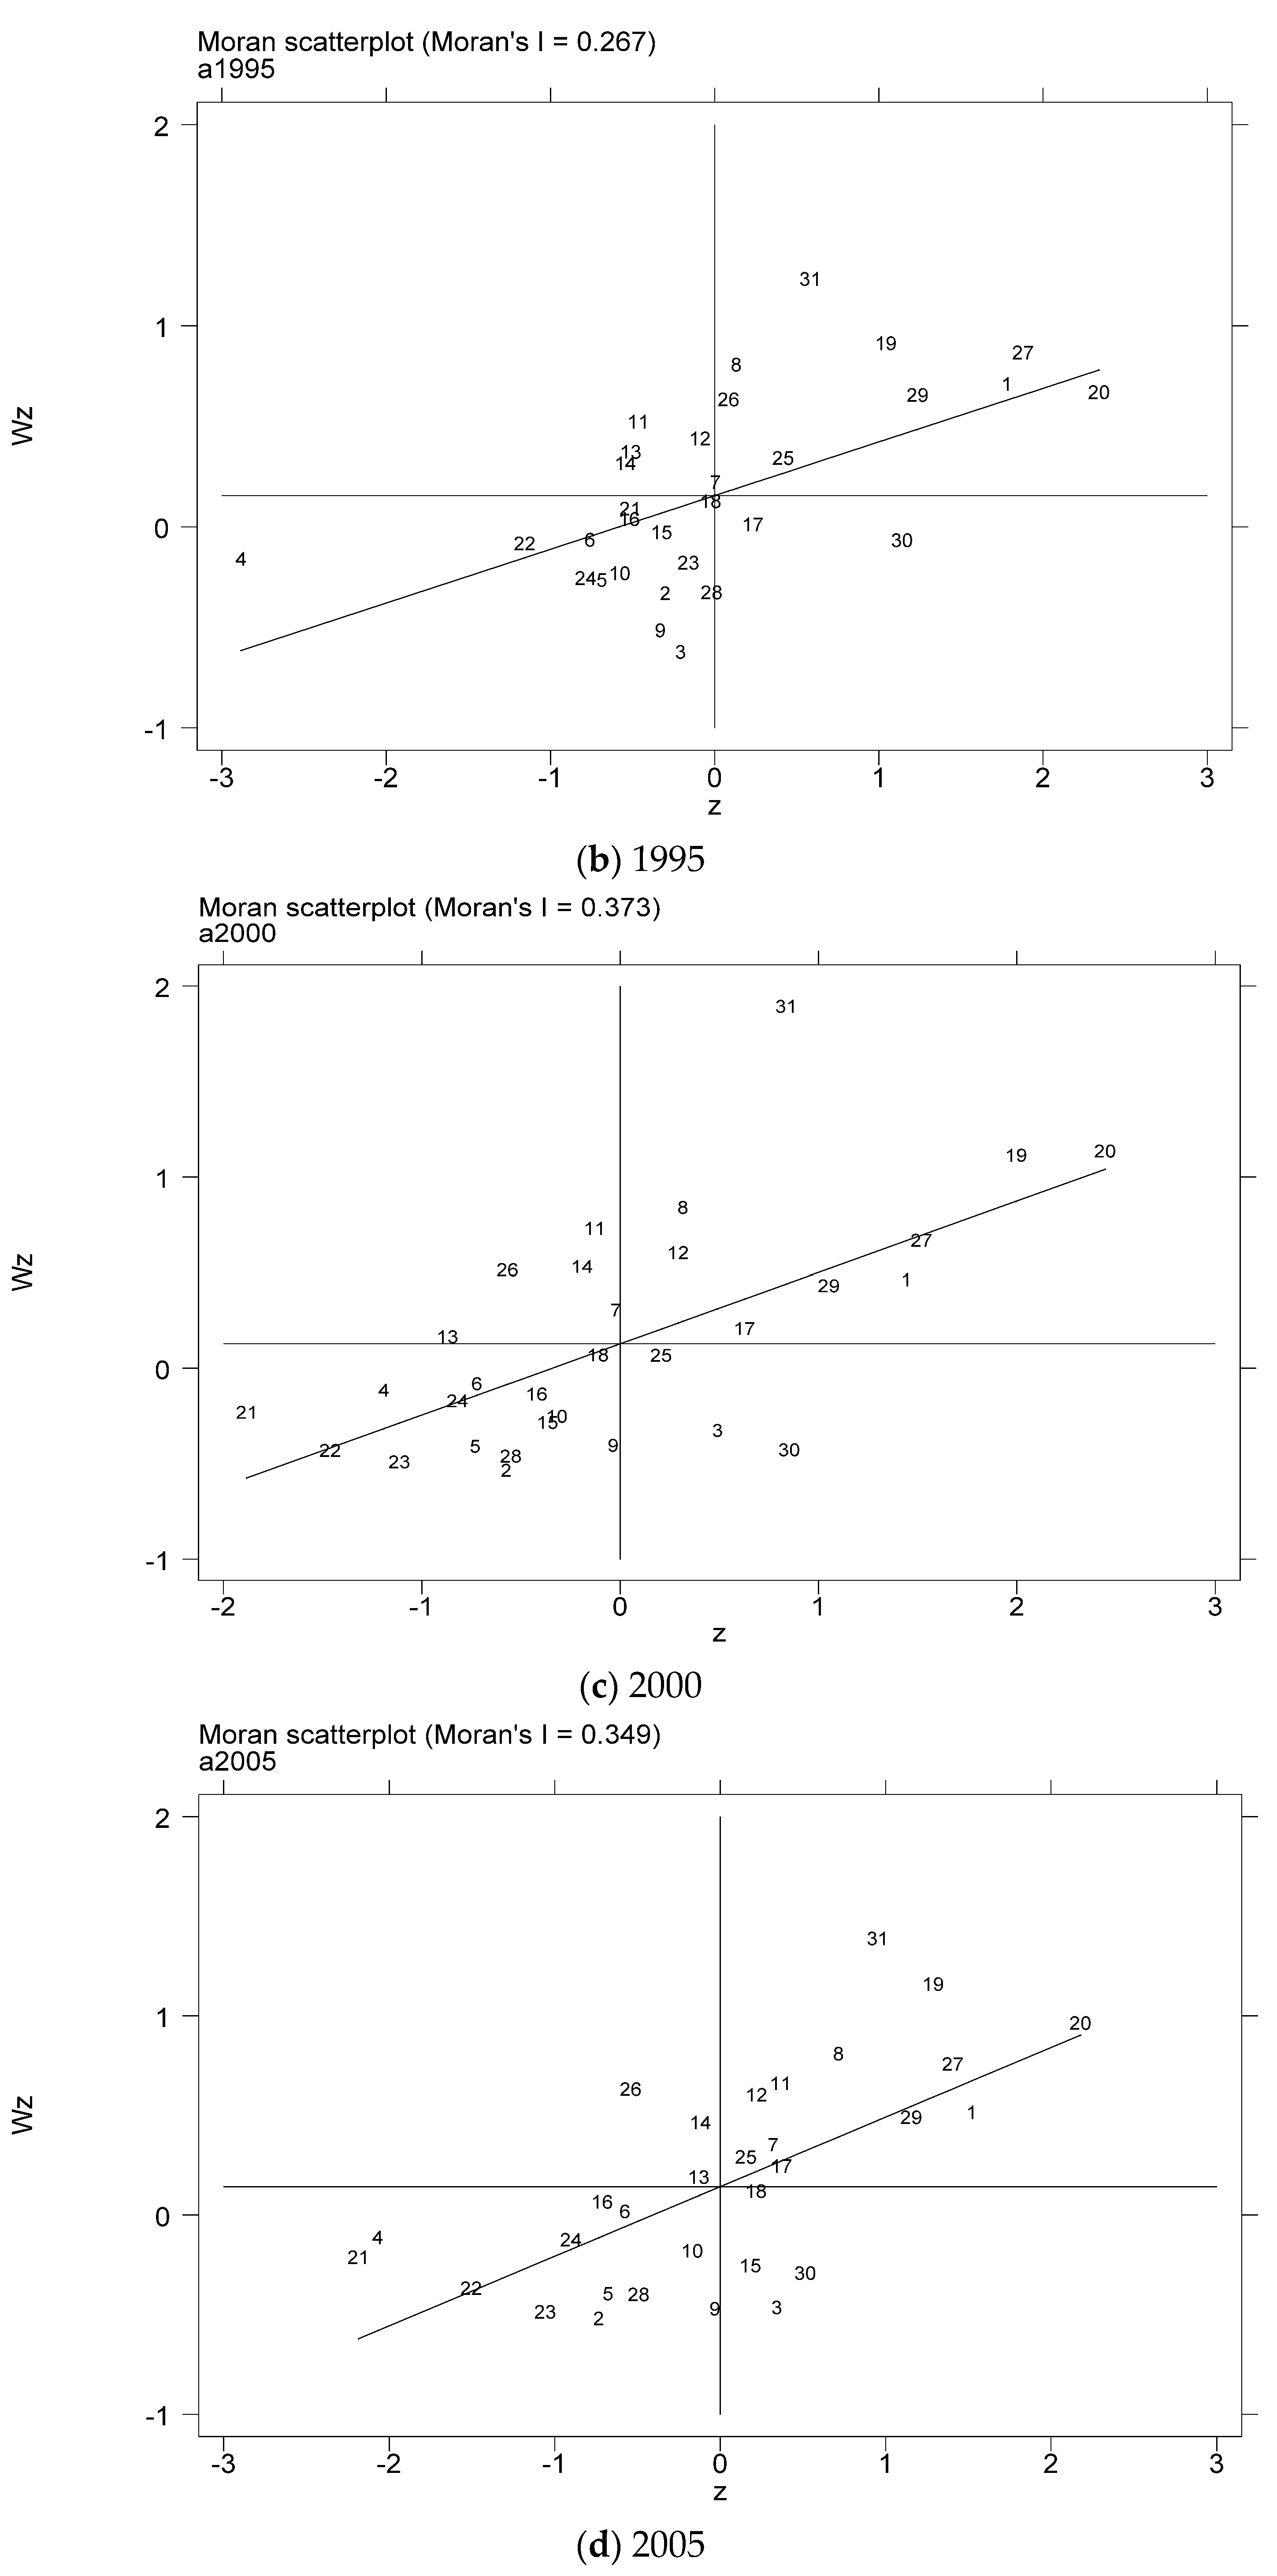
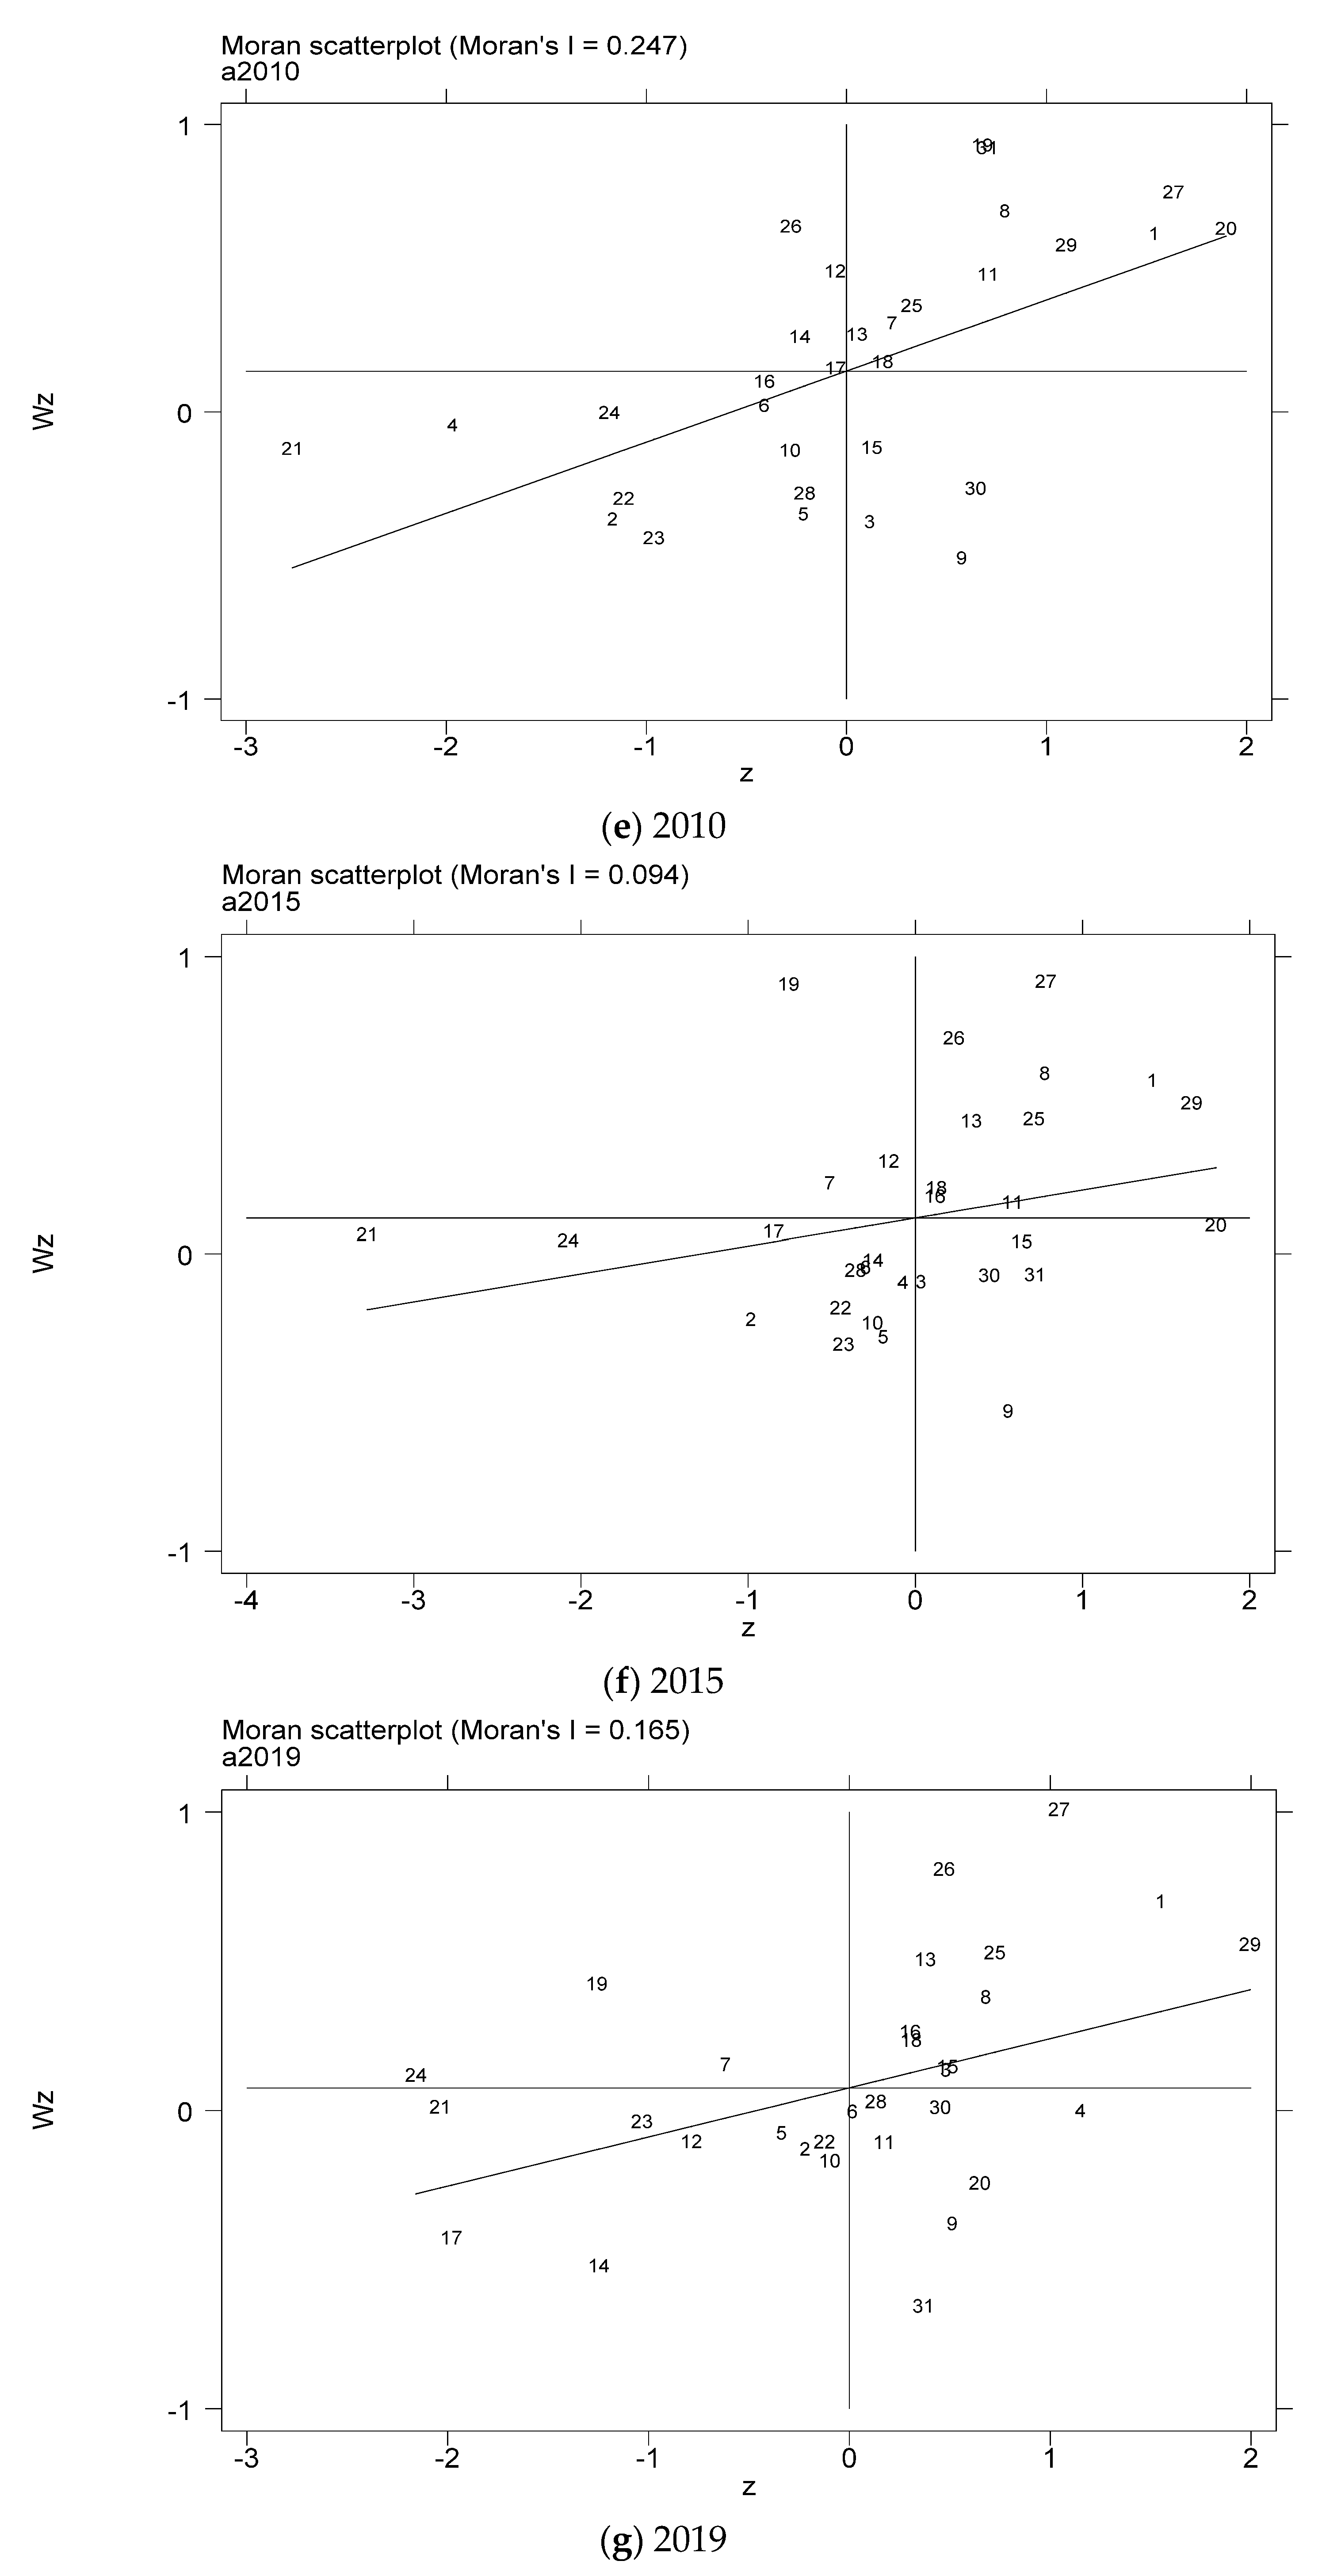
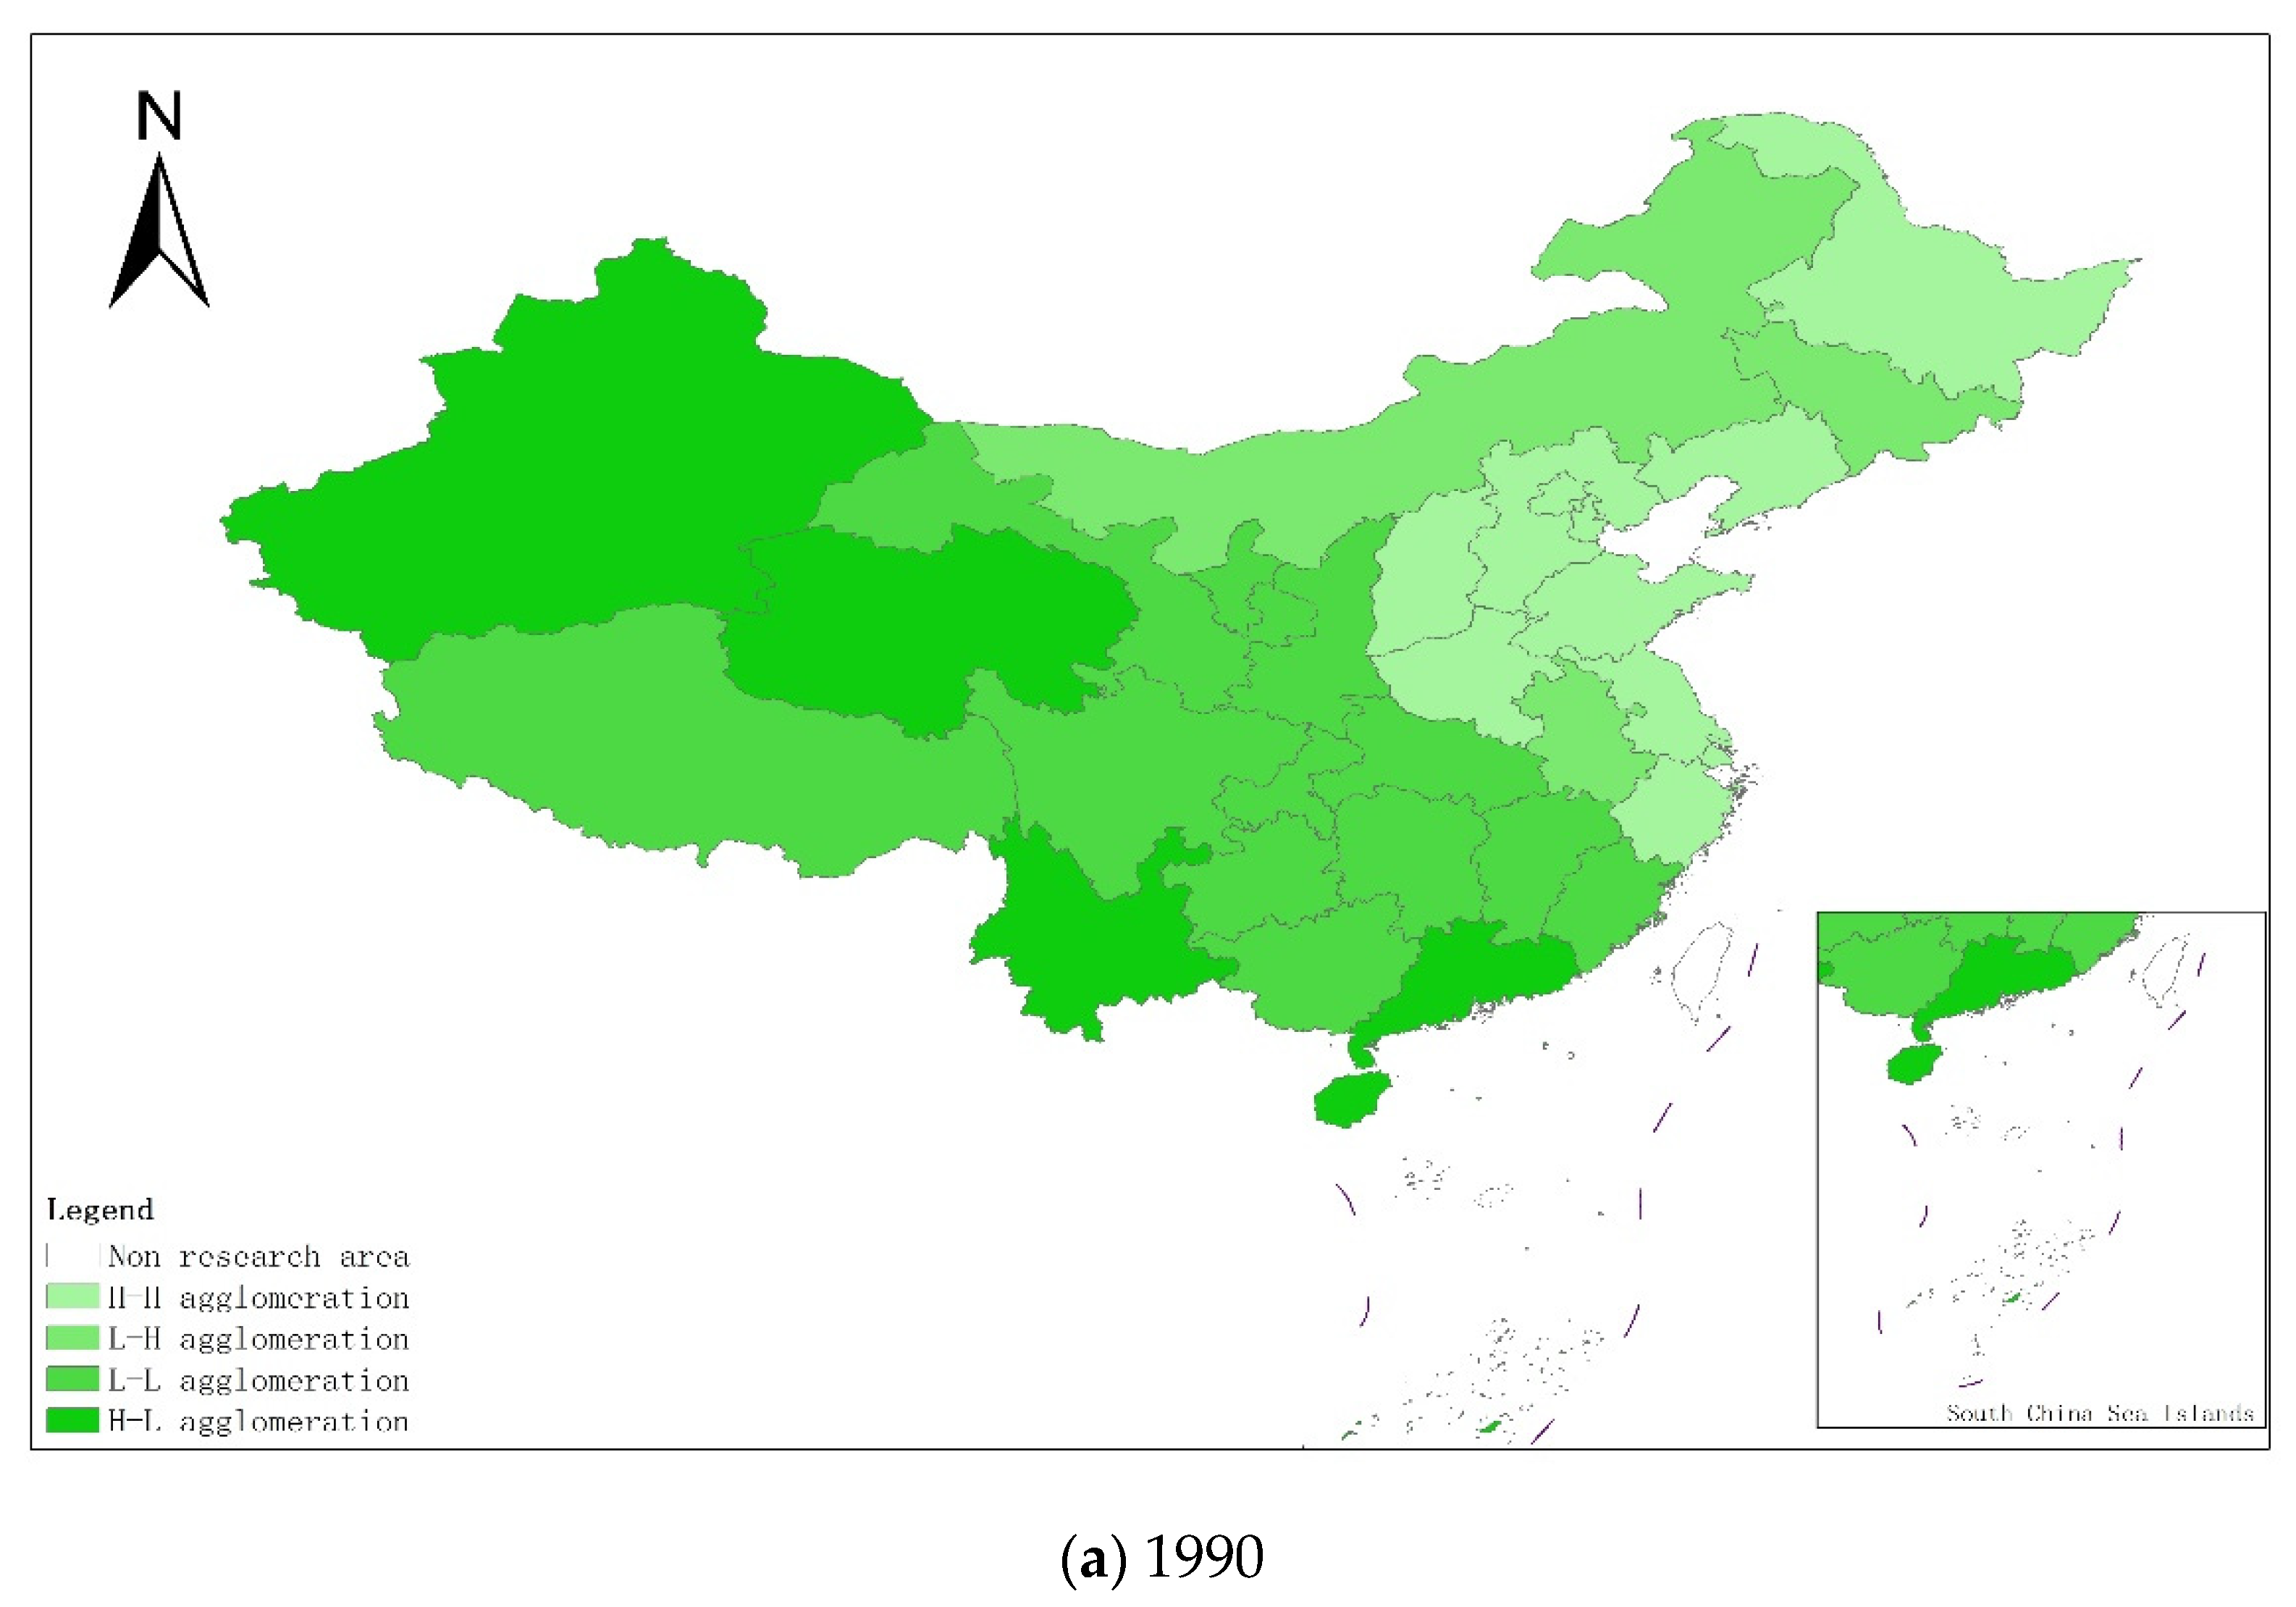
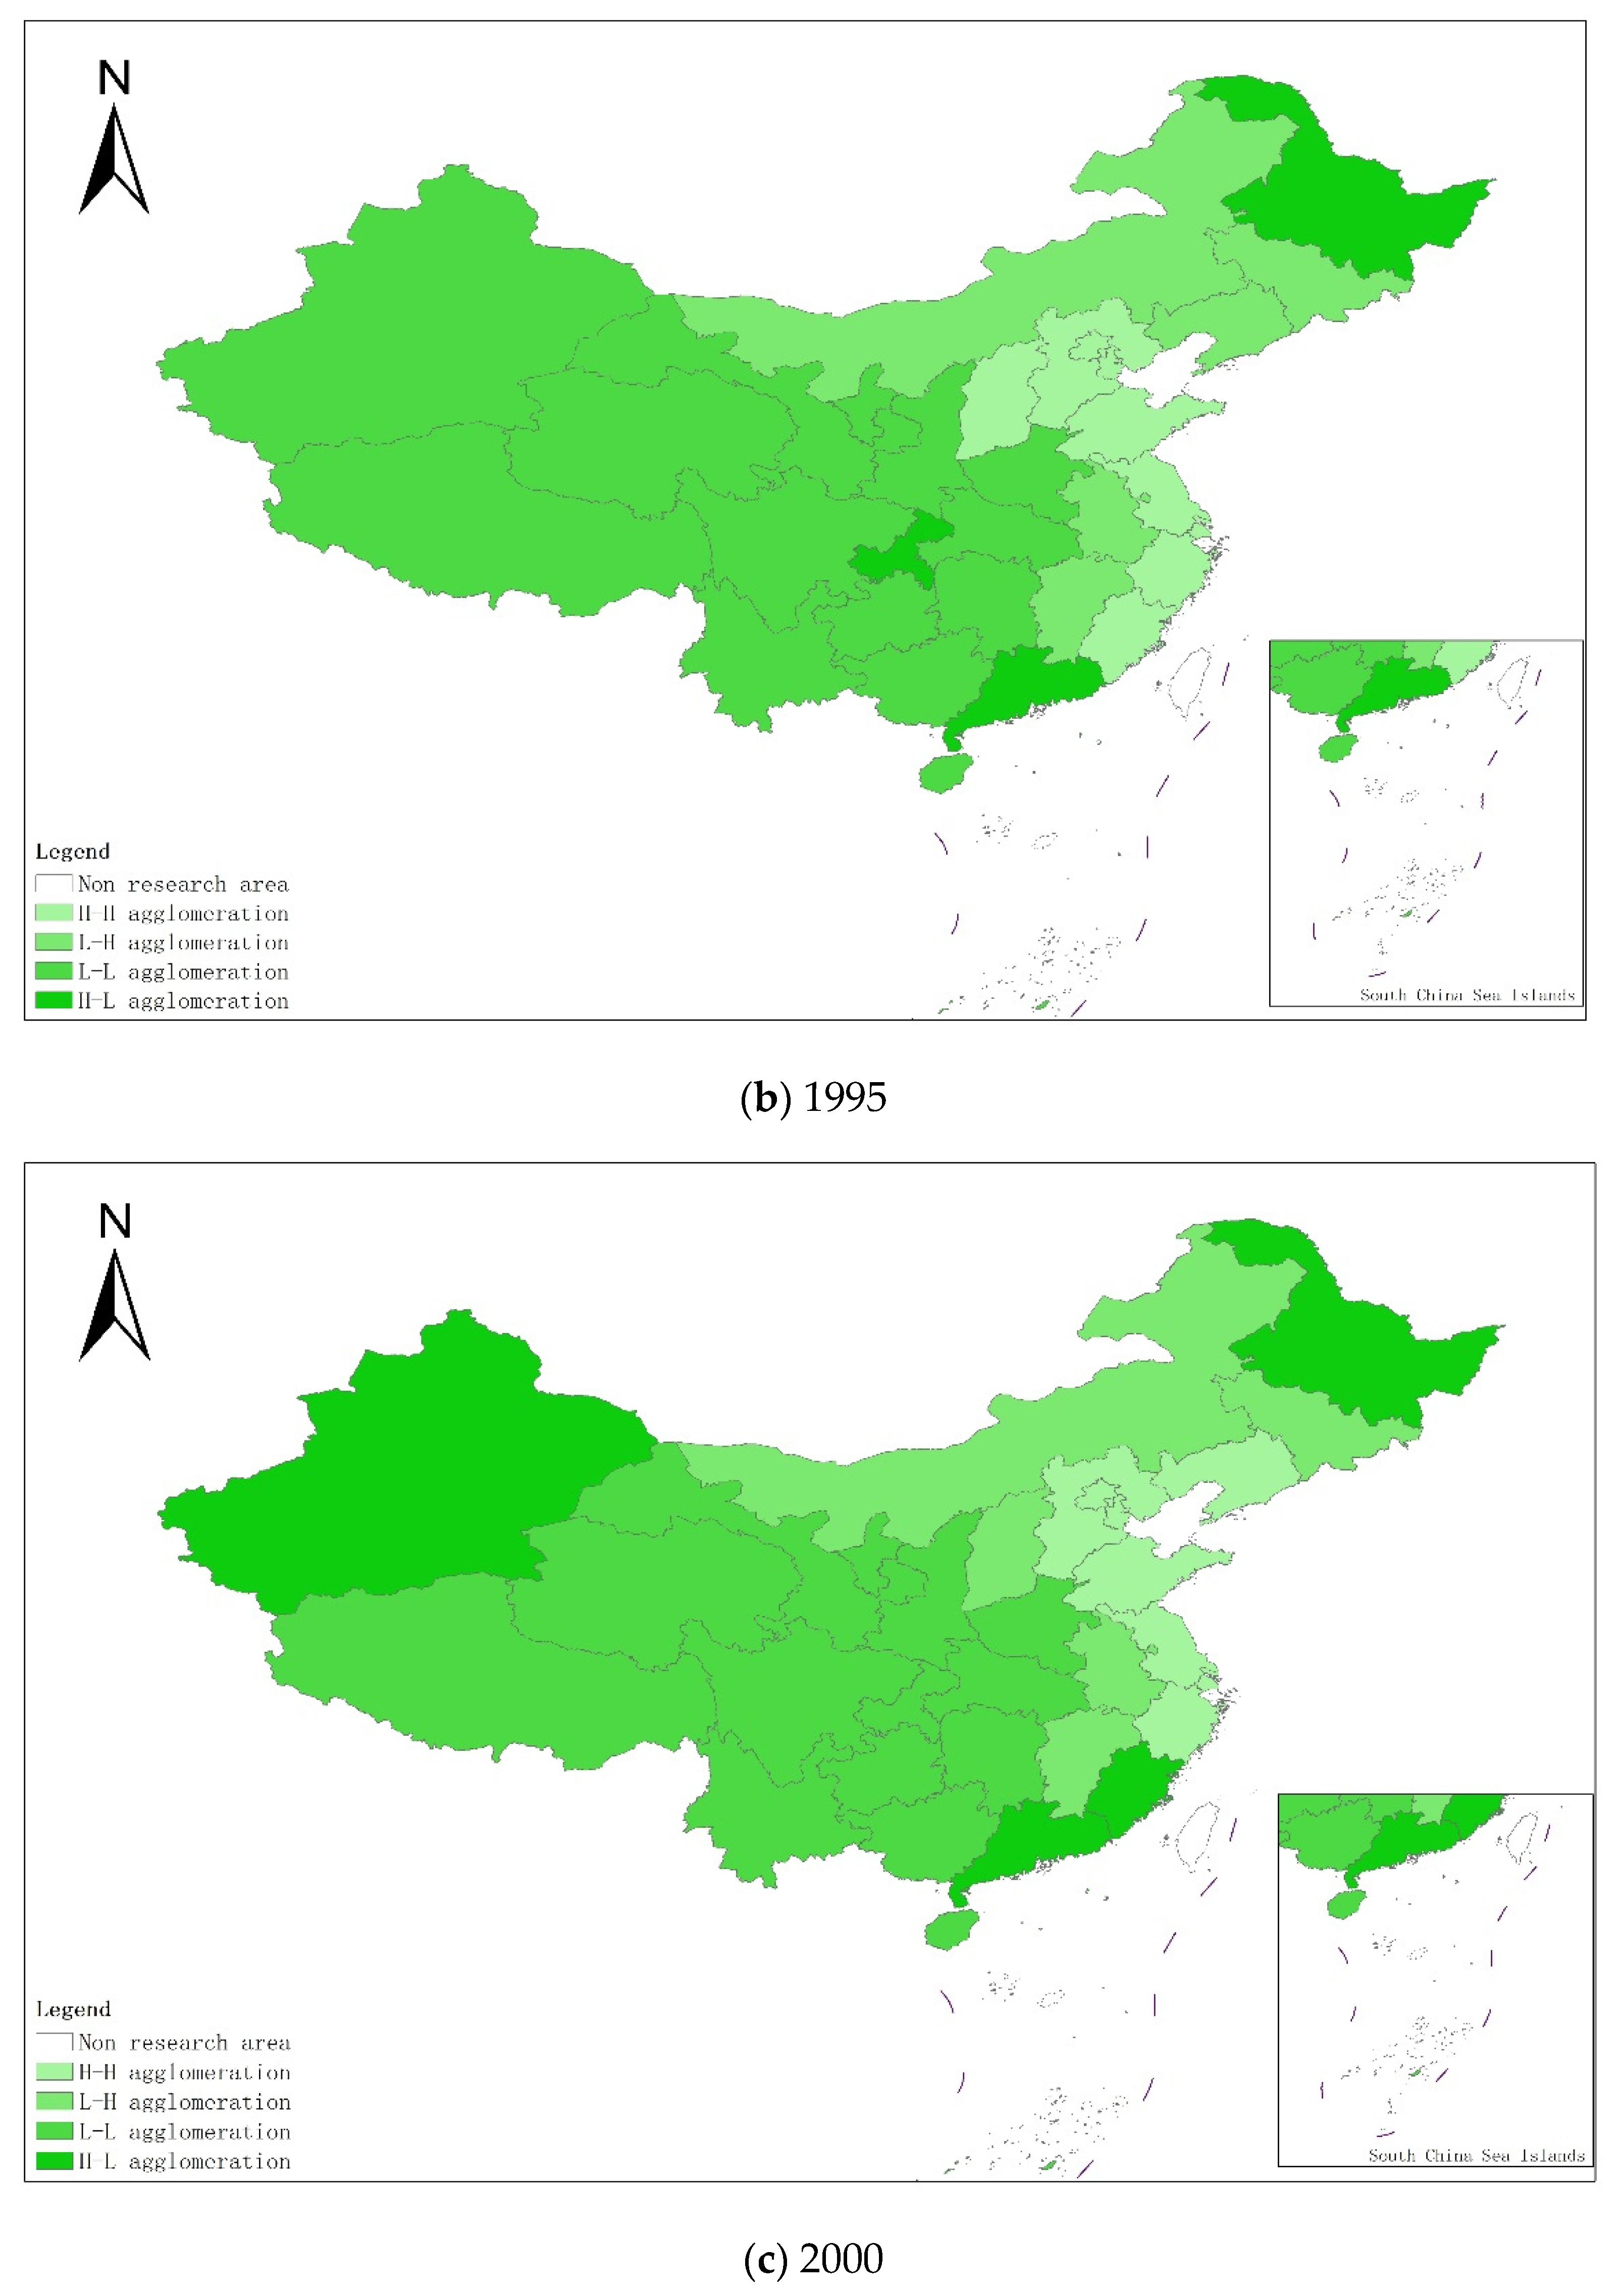
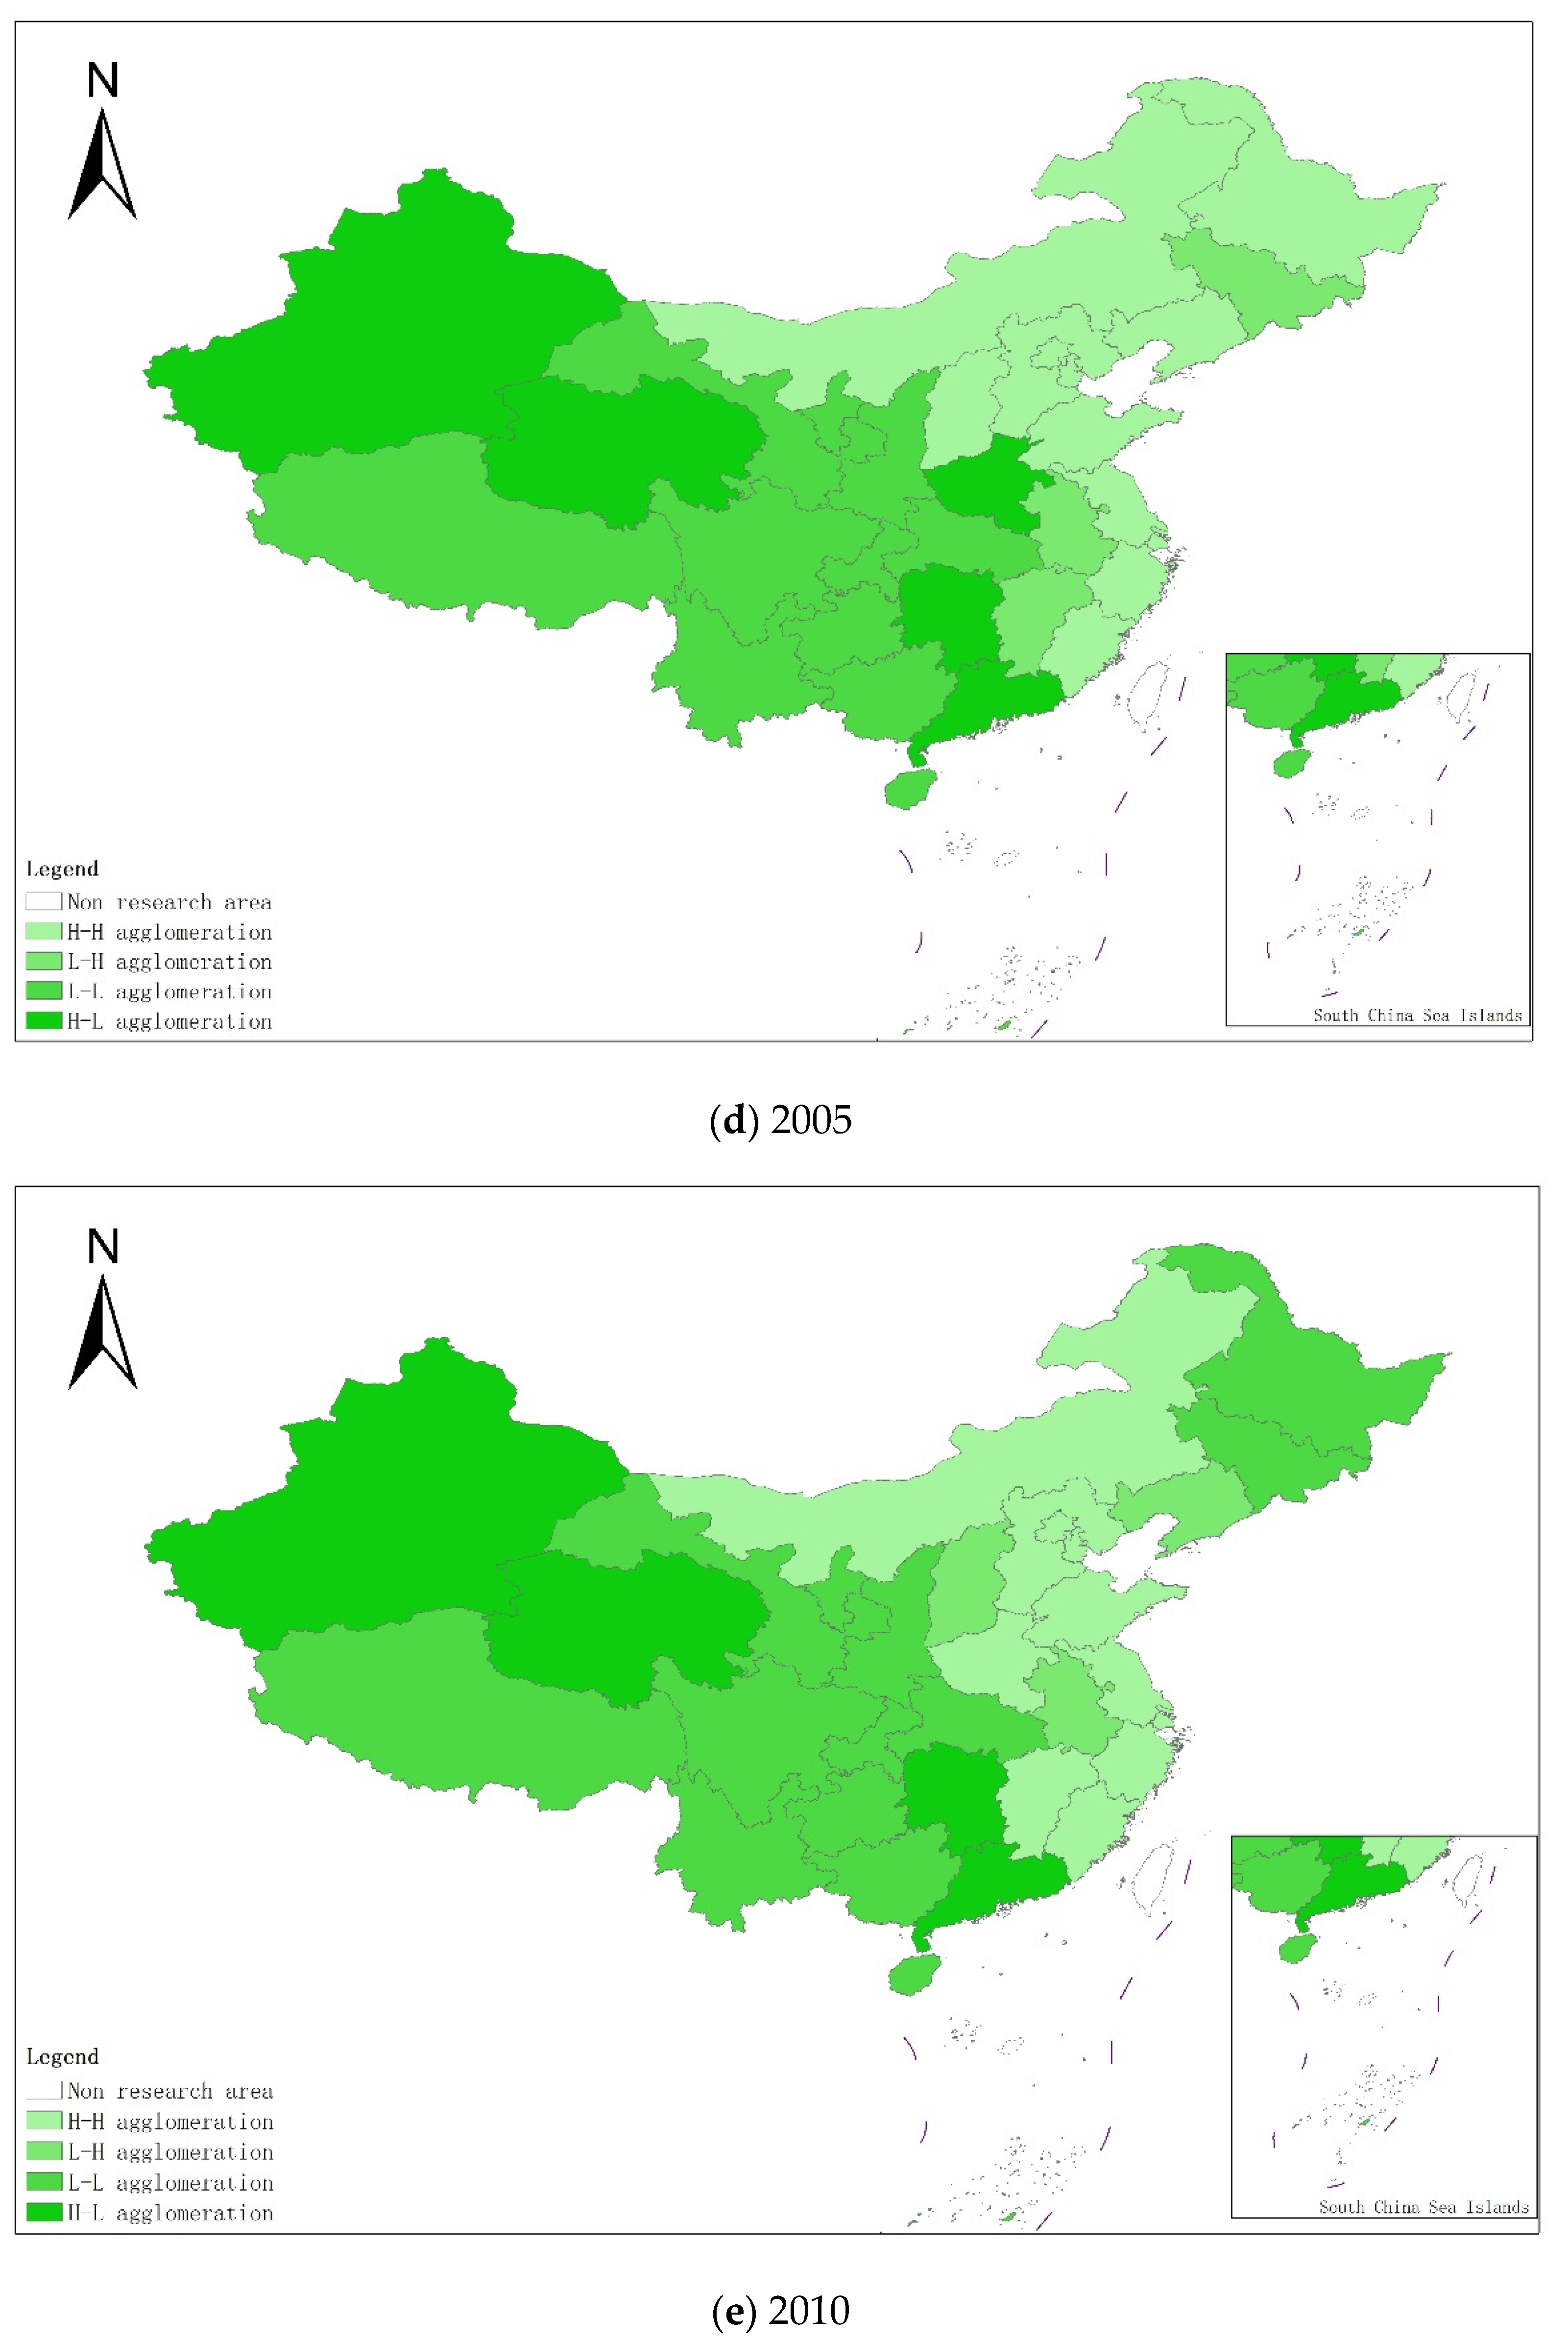
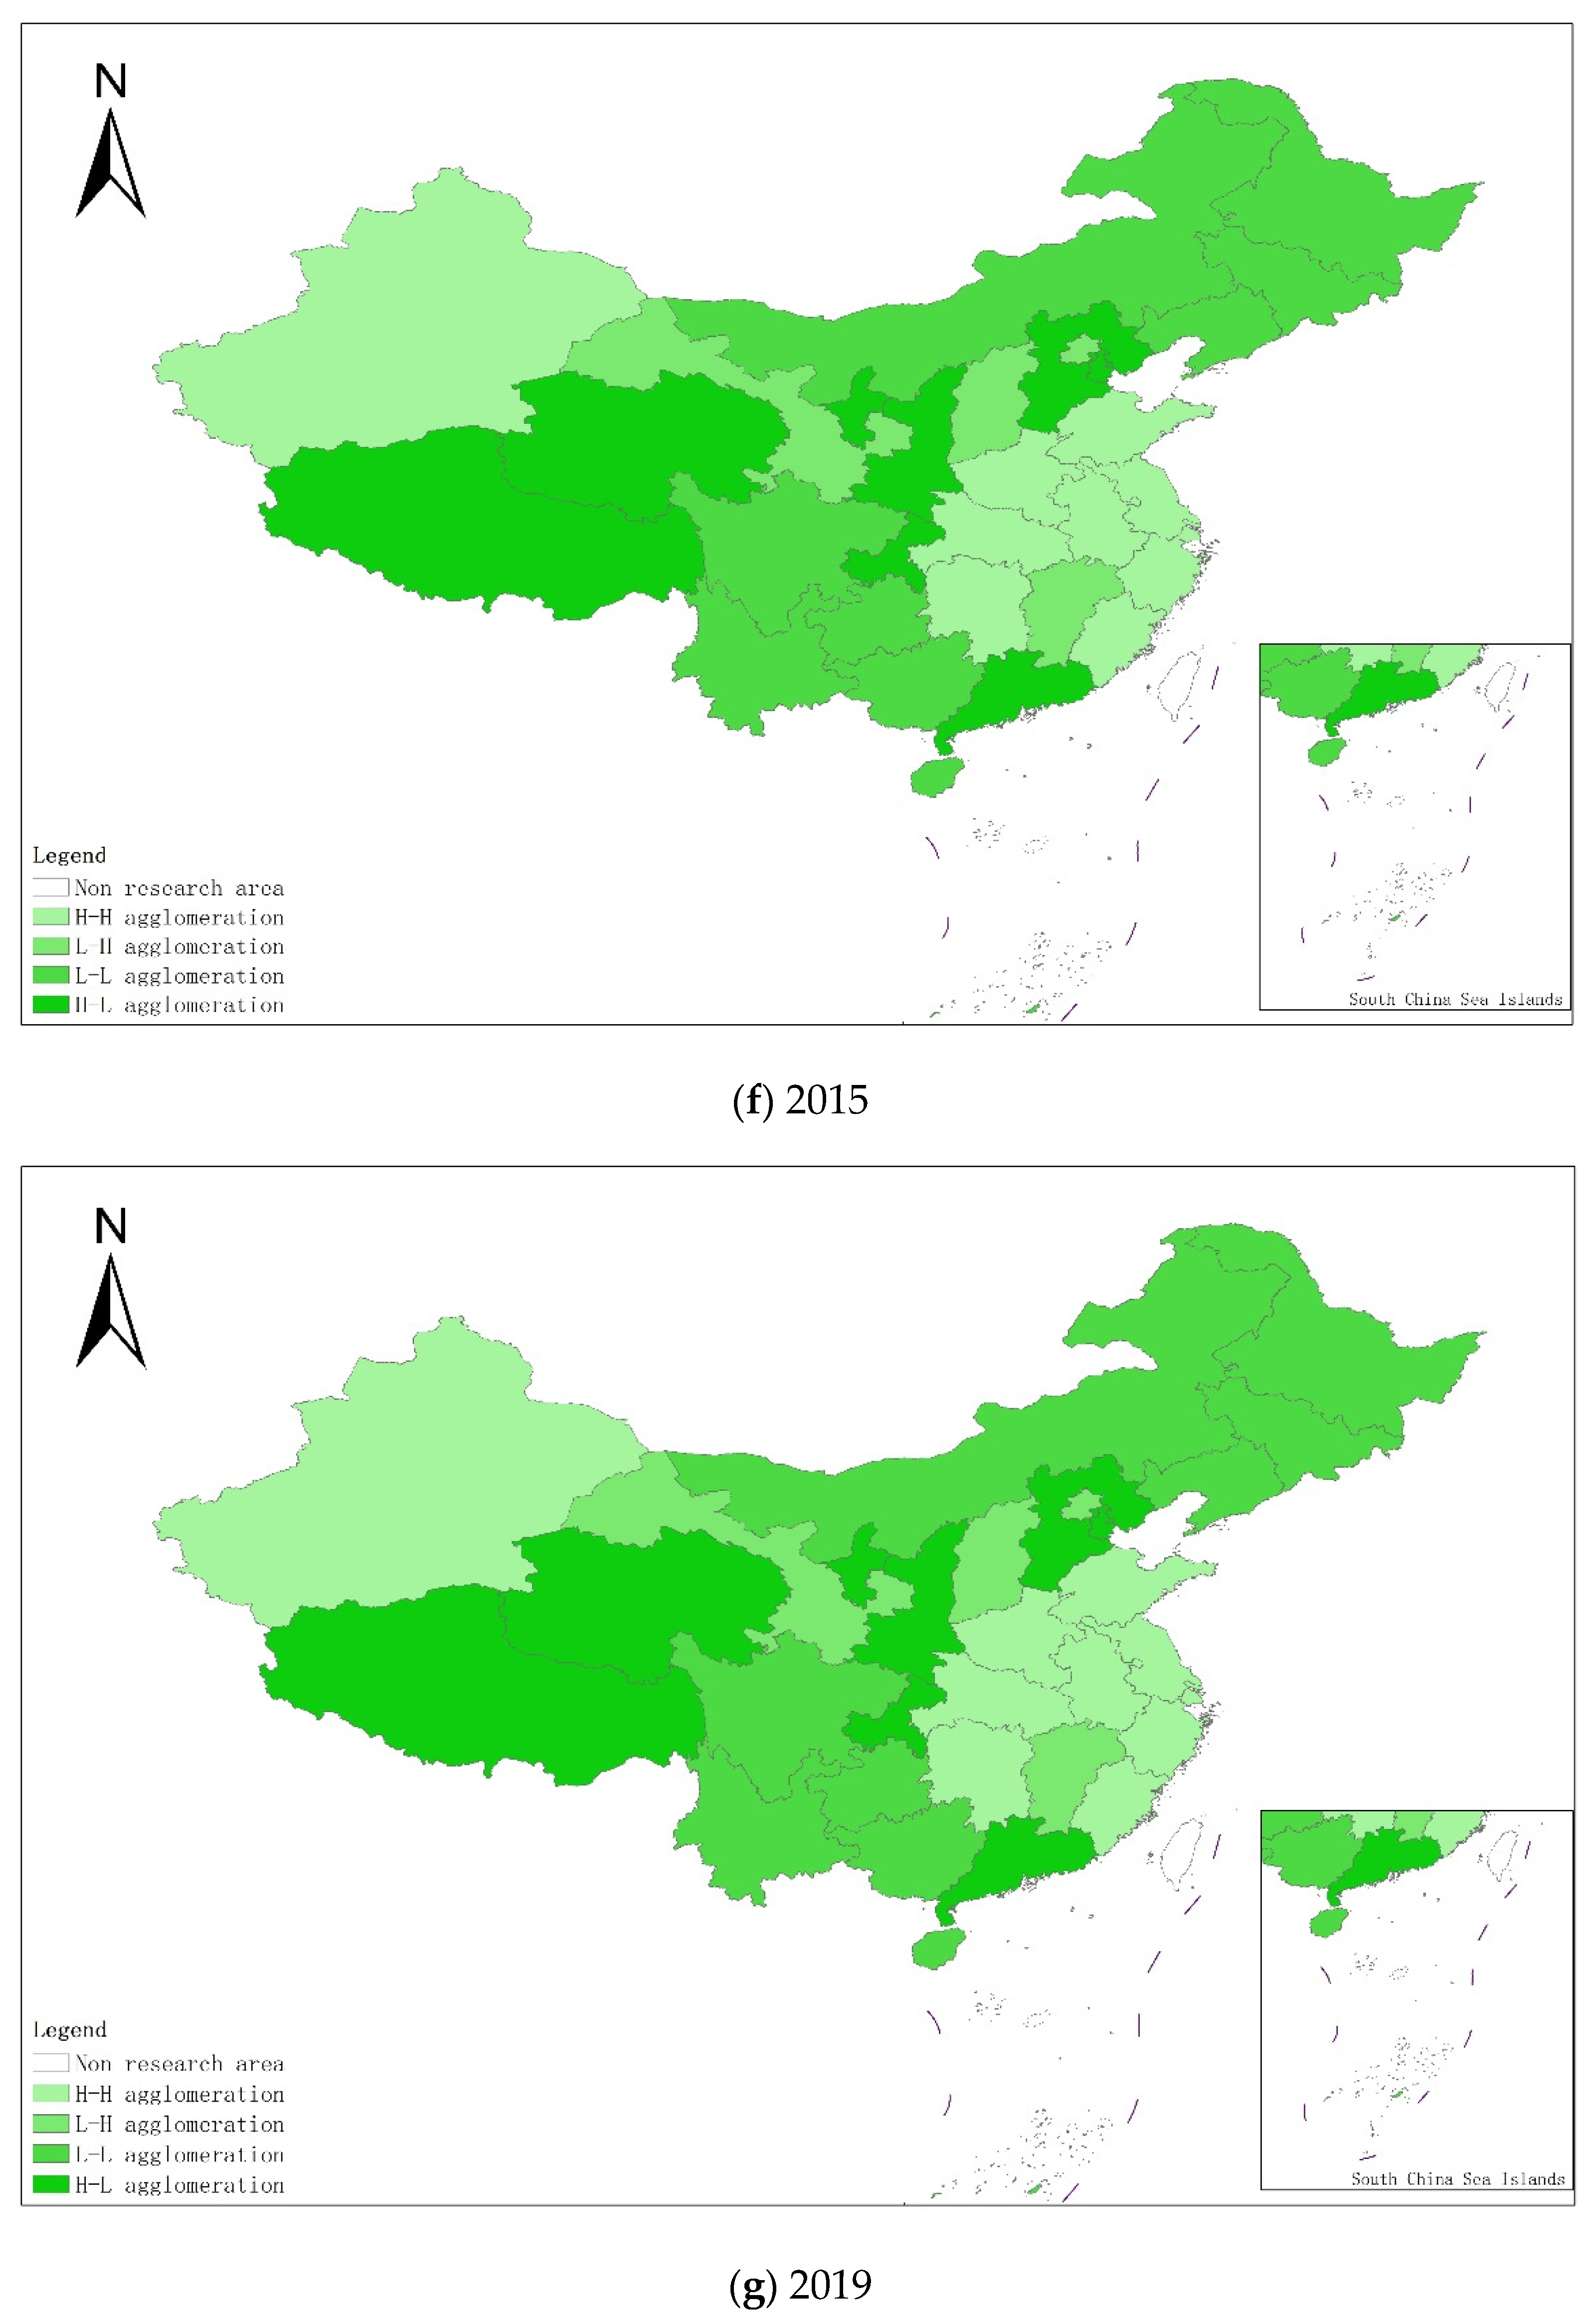
4.4. Spatial Autocorrelation Analysis of Coupling Degree of Industrialization and Agricultural Green Development in China

4.4.1. Global Autocorrelation Test

This paper uses the global spatial autocorrelation analysis method to analyze the degree of coupling and coordination of industrialization and AGD in the study area and make a Moran scatter diagram. Table 5 shows the calculation results of the global Moran index of the coupling coordination degree of China’s industrialization and AGD. Moran indexes are all greater than 0, and the adjoint probability p values are all less than 0.1. It shows that the degree of coupling and coordination of China’s provincial industrialization and AGD has an obvious positive autocorrelation in the spatial distribution. That is, the degree of coupling and coordination of China’s provincial industrialization and AGD shows significant spatial agglomeration characteristics in space.

4.4.2. Local Correlation Test

In order to further test the spatial relationship of the coupling coordination degree of China’s provincial industrialization and AGD, considering the distribution characteristics of the coupling coordination degree of the local area, this paper draws the local Moran index scatter plots for some years based on the inverse distance spatial weight matrix, as shown in Figure 5a–g. The Moran scatter diagram is presented by dividing the space into four quadrant units. The first quadrant is the high-high (H-H) agglomeration area, which means that provinces with a high level of coupling and coordination of industrialization and AGD are surrounded by high-value areas. The second quadrant is the low-high (L-H) agglomeration area, which means that provinces with low levels of industrialization and AGD coupling and coordination are surrounded by high-value areas. The third quadrant is the low-low (L-L) agglomeration area, which means that provinces with a low level of coupling and coordination of industrialization and AGD are surrounded by low-value areas. The fourth quadrant is the high-low (H-L) agglomeration area, which means that provinces with a high level of coupling and coordination of industrialization and AGD are surrounded by low-value areas.
In order to more intuitively understand the agglomeration or dispersion of various provinces, the data of each quadrant is summarized and presented in the form shown in Figure 6. From the perspective of time dynamics, the level of AGD in various regions has changed, but in the selected seven years, most of the provinces are located in the H-H agglomeration area and the L-L agglomeration area. In the long run, the provinces located in the quadrants have relatively little change. The provinces located in the H-H agglomeration area for a long time are mostly provinces in the eastern coastal region, while the provinces in the L-L agglomeration area are mostly provinces in the western region. It shows that China’s industrialization and AGD coupling and coordination degree are spatially positively correlated and have high spatial agglomeration.

5. Discussion

5.1. Characteristics of China’s Industrialization and Agricultural Green Development

From 1990 to 2019, China’s industrialization has generally gone through four stages of development. From 1990 to 1994, industrialization was in a stage of rapid development, and the scale of industrial and economic development was steadily increasing, and the structure was continuously optimized. During 1994–2004, the development of industrialization was at a standstill. During this period, China experienced the huge impact of the Asian financial turmoil and the reform of state-owned enterprises. The major adjustments in the industrial structure led to an increase in the number of laid-off employees in industrial enterprises, which resulted in a low proportion of the employment in the secondary industry. From 2004 to 2015, the industrialization index was in a state of volatility and rising. The level of industrialization maintained a high growth rate, with a growth rate of 26.36%. After economic reform and the process of opening up, the level of industrialization and economic development have been rapidly improved, but this is mostly due to China’s huge “demographic dividend” and resources. The environment has been sacrificed in exchange. After entering the 21st century, facing the problem of increasingly depleted domestic resources and a rapidly deteriorating environment, the previous extensive development model is no longer sustainable. The Chinese government proposes to strengthen the adjustment of industrial structure and increase support for technology-intensive industries, so that a number of high-tech industries that are “high-tech, high-efficiency, and high-efficiency” will develop rapidly. The level of industrialization in 2015–2019 is in a state of decline, and the one-sided pursuit of speed and scale of development has been unable to meet the people’s growing needs for a better life. At the same time, the contradictions between the industrial and agricultural structures accumulated over the past 40 years of economic reform and opening up, the contradictions of uncoordinated regional development, and the contradictions between economic growth and resource and environmental constraints have become increasingly prominent. At the same time, the tertiary industry dominated the economic structure during this period, and the characteristics of post-industrialization were obvious. The proportion of manufacturing output value fell sharply, and the employment of employees continued to transfer to tertiary industry. The Chinese government recognized that economic and social development needs to actively reduce the development speed and improve the internal development quality.
AGD has generally gone through three stages. From 1990 to 2001, the AGD index was in a state of volatility and decline. Since the 1990s, the large-scale use of chemical fertilizers, pesticides, and agricultural films in China’s agriculture has caused serious non-point source pollution. At the same time, the transfer of agricultural surplus labor and the development of agricultural industrialization have been affected by the decline in the level of industrialization during the same period. The above problems have led to a decline in the level of AGD. From 2001 to 2015, the AGD index was in a trend of increasing first and then decreasing. This is because the government attaches great importance to the “three rural” issues, and promulgated the central “No. 1 Document” related to the “three rural” issues in successive years, and issued a series of policies that benefit farmers and strengthen farmers. The large-scale promotion of mechanization in agriculture and the development of industrialization have promoted the enhancement of agricultural disaster resistance. However, the level of irrigated farmland, the low utilization rate of chemical fertilizers and pesticides, and the low recovery rate of agriculture have led to another decline in the level of AGD. From 2015 to 2019, the AGD index was in a state of volatility and rising. As of the end of 2017, the use of pesticides had been reduced for three consecutive years, the use of chemical fertilizers has been reduced for two consecutive years, and the utilization rate of chemical fertilizers and pesticides has increased significantly.

5.2. Coordination Level and Spatial Characteristics of China’s Industrialization and Agricultural Green Development

From an overall point of view, the main reason that the coupling coordination level of China’s industrialization and AGD has been in primary coordination is that after more than 40 years of rapid development of economic reform and opening up, China’s economy has gradually entered a stage of new normal development. At this stage, new features different from those of the past appeared, namely, a major change in the economic growth rate, economic structure and the development of economic driving forces. In the new stage of economic development, the level of China’s industrialization and AGD has been undergoing a process from “quantitative change” to “qualitative change”. However, the development from “quantitative change” to “qualitative change” is a gradual and insignificant process. This makes it difficult to achieve a breakthrough in the level of coupling and coordination in a short period of time.
From a regional perspective, from the early stage of economic reform and opening up to around 2000, the Chinese government established the eastern region as a priority growth pole for China’s economy, thereby driving a “goose model” in other regions; from 2000 to 2012, the Chinese government adopted the “Western Development”, regional development strategies such as the “Rise of Central China” and “ Revitalization of the Northeast “ which have gradually promoted balanced regional development; since 2012, all regions have entered a stage of comprehensive and coordinated development. Affected by historical factors, Beijing and Tianjin in the Bohai Rim Economic Circle in the eastern region, and Shanghai, Jiangsu, and Zhejiang in the Yangtze River Delta Economic Circle, have been at a relatively high level of coupling and coordination of industrialization and AGD. These regions have a superior technical level, high market openness and good national support policies, attracting a large number of domestic and foreign enterprises and a large number of rural surplus labor, and the effect of industrial agglomeration is obvious. The improvement of the level of industrialization can understand the improvement of the level of AGD. Therefore, the coordinated development of these regions is at the leading level in the country. Although the central region is not as mature as the eastern coastal regions in terms of technical conditions and market environment, and industrialization has not formed a comparative advantage, these regions are the main agricultural production areas with relatively mature agricultural technology. Moreover, because a large number of rural surplus labor flows to cities in the province and the eastern coastal areas, the level of agricultural industrialization in these areas is relatively high, and the scale effect is obvious. However, the technical level and economic foundation of Guizhou, Tibet, Gansu and other places in the western region are not as superior as those in the eastern region, and the natural conditions are not as good as those in the central region. The AGD model has not yet been formed. As a result, the level of coupling and coordination between industrialization and AGD is low. From this, it is concluded that the level of coordinated development of China’s industrialization and AGD during the study period was an example of primary coordination as a whole, with significant regional differences.

6. Conclusions, Limitations and Further Research

Based on a comprehensive understanding of China’s industrialization and AGD level from 1990 to 2019, this paper constructs two systems with 12 indexes, evaluates the industrialization and AGD level, and analyzes the temporal and spatial of the coupling and coordination level of the two systems. feature. The results compare the industrialization and AGD levels during the study period and find that China’s industrialization development level is on the rise as a whole, and the AGD level shows a downward trend first and then rises later. Through the horizontal comparison of different regions, this paper finds that there is a large regional imbalance in the level of industrialization and AGD. The coupling and coordination level of industrialization and AGD has always been in primary coordination. From the time point of view, coupling coordination degree shows a trend of first decline and then rise. From a spatial point of view, coupling coordination degree varies greatly among provinces, with the eastern, central and western regions decreasing successively. The level of coupling coordination has obvious positive autocorrelation in spatial distribution, and presents significant spatial agglomeration characteristics in space.
This paper preliminarily discusses the regional pattern of industrialization and AGD, the characteristics of the coupling coordination level, and the spatial autocorrelation analysis of the coupling coordination level. This paper has some limitations. The connotation of industrialization and AGD is far more abundant than the current index system reflects. Limited by data, it is difficult for this paper to undertake a comprehensive description of industrialization and AGD. In future studies, typical case studies can be conducted on the level of coupling and coordination of industrialization and AGD in different types of regions, in order to find out the factors that affect the level of coupling and coordination of industrialization and AGD, which will help guide the sustainable development of different regions.

Author Contributions

Conceptualization, H.G. and C.P.; methodology, H.G. and X.Y.; software, H.G. and X.Y.; validation, H.G., X.Y. and Y.L.; formal analysis, H.G. and B.Y.; investigation, H.G., X.Y. and Y.L.; resources, H.G.; data curation, Y.L. and B.Y.; writing—original draft preparation, H.G.; writing—review and editing, X.Y. and C.P.; visualization, H.G.; supervision, C.P.; project administration, H.G.; and funding acquisition, H.G. All authors have read and agreed to the published version of the manuscript.

Funding

This research was funded by Research on Science and Technology Strategy and Planning of Science and Technology Department of Jilin Province, China [grant No.20200101130FG]; Key Scientific and Technological Projects of Science and Technological Department of Jilin Province, China [grant No.20190301080NY]; MOE (Ministry of Education in China) Project of Humanities and Social Sciences [grant No.18YJC630128]; Social Science Fund Project of “the 13th Five-Year” of Education Department of Jilin Province, China [grant No.JJKH20190736SK]; Chinese Postdoctoral Science Foundation [grant No.2020M681052].

Institutional Review Board Statement

Not applicable.

Informed Consent Statement

Not applicable.

Data Availability Statement

Publicly available datasets were analyzed in this study. This data can be found here: China Statistical Yearbook (http://www.stats.gov.cn/tjsj/ndsj/ (accessed on 25 June 2021)), China Industrial Statistical Yearbook (https://data.cnki.net/trade/Yearbook/Single/N2021020054?z=Z012 (accessed on 25 June 2021)), China Rural Statistical Yearbook (https://data.cnki.net/area/Yearbook/Single/N2010080069?z=D22 (accessed on 25 June 2021)), China Regional Economic Statistical Yearbook (https://data.cnki.net/trade/Yearbook/Single/N2012030056?z=Z030 (accessed on 25 June 2021).

Conflicts of Interest

The authors declare no conflict of interest.

References

  1. Aslam, B.; Hu, J.; Shahab, S.; Ahmad, A.; Saleem, M.; Shah, S.S.; Javed, M.S.; Aslam, M.K.; Hussain, S.; Hassan, M. The nexus of industrialization, GDP per capita and CO2 emission in China. Environ. Technol. Innov. 2021, 23, 101674. [Google Scholar] [CrossRef]
  2. Cherniwchan, J. Economic growth, industrialization, and the environment. Resour. Energy Econ. 2012, 34, 442–467. [Google Scholar] [CrossRef]
  3. Zhang, G.; Wang, X.K.; Sun, B.F.; Zhao, H.; Lu, F.; Zhang, L. Status of mineral nitrogen fertilization and net mitigation potential of the state fertilization recommendation in Chinese cropland. Agric. Syst. 2016, 146, 1–10. [Google Scholar] [CrossRef]
  4. Mekonnen, M.M.; Hoekstra, A.Y. Global Gray Water Footprint and Water Pollution Levels Related to Anthropogenic Nitrogen Loads to Fresh Water. Environ. Sci. Technol. 2015, 49, 12860–12868. [Google Scholar] [CrossRef] [PubMed]
  5. Jorgenson, D.W. Surplus Agricultural Labour and the Development of a Dual Economy. Oxf. Econ. Pap. 1967, 19, 288–312. [Google Scholar] [CrossRef]
  6. Huasheng, S.; François, T.J.; Xiwei, Z. Urbanization and/or rural industrialization in China. Reg. Sci. Urban Econ. 2011, 42, 126–134. [Google Scholar]
  7. Stoknes, P.E.; Rockstrom, J. Redefining green growth within planetary boundaries. Energy Res. Soc. Sci. 2018, 44, 41–49. [Google Scholar] [CrossRef]
  8. Kanter, D.R.; Musumba, M.; Wood, S.L.R.; Palm, C.; Antle, J.; Balvanera, P.; Dale, V.H.; Havlik, P.; Kline, K.L.; Scholes, R.J.; et al. Evaluating agricultural trade-offs in the age of sustainable development. Agric. Syst. 2018, 163, 73–88. [Google Scholar] [CrossRef]
  9. Englmaier, F.; Reisinger, M. Information, coordination and the industrialization of countries. CESifo Econ. Stud. 2008, 54, 534–550. [Google Scholar] [CrossRef] [Green Version]
  10. Carnoy, M. The new information technology—International diffusion and its impact on employment and skills. Int. J. Manpow. 1997, 18, 119–159. [Google Scholar] [CrossRef]
  11. Eswaran, M.; Kotwal, A. The role of the service sector in the process of industrialization. J. Dev. Econ. 2002, 68, 401–420. [Google Scholar] [CrossRef]
  12. Perger, E. Local Responses to the Structural Changes of National Development Policyin Hungarian Rural Regions. East. Eur. Countrys. 2016, 22, 69–83. [Google Scholar] [CrossRef] [Green Version]
  13. Agnieszka, K.; Aldona, S.; Łukasz, S. Managing Rural Areas in the Context of the Growing Debt of Polish Local Government Units. Agriculture 2020, 10, 376. [Google Scholar]
  14. Lu, Q.; Liang, F.; Bi, X.; Duffy, R.; Zhao, Z. Effects of urbanization and industrialization on agricultural land use in Shandong Peninsula of China. Ecol. Indic. 2011, 11, 1710–1714. [Google Scholar] [CrossRef]
  15. Arowolo, A.O.; Deng, X.Z.; Olatunji, O.A.; Obayelu, A.E. Assessing changes in the value of ecosystem services in response to land-use/land-cover dynamics in Nigeria. Sci. Total Environ. 2018, 636, 597–609. [Google Scholar] [CrossRef] [PubMed]
  16. Venter, O.; Sanderson, E.W.; Magrach, A.; Allan, J.R.; Beher, J.; Jones, K.R.; Possingham, H.P.; Laurance, W.F.; Wood, P.; Fekete, B.M.; et al. Sixteen years of change in the global terrestrial human footprint and implications for biodiversity conservation. Nat. Commun. 2016, 7, 12558. [Google Scholar] [CrossRef] [PubMed] [Green Version]
  17. Kurucu, Y.; Chiristina, N.K. Monitoring the impacts of urbanization and industrialization on the agricultural land and environment of the Torbali, Izmir region, Turkey. Environ. Monit. Assess. 2008, 136, 289–297. [Google Scholar] [CrossRef]
  18. Mahmood, H.; Alkhateeb, T.T.Y.; Furqan, M. Industrialization, urbanization and CO2 emissions in Saudi Arabia: Asymmetry analysis. Energy Rep. 2020, 6, 1553–1560. [Google Scholar] [CrossRef]
  19. Barbier, E. The policy challenges for green economy and sustainable economic development. In Natural Resources Forum; Blackwell Publishing Ltd.: Oxford, UK, 2011; Volume 35, pp. 233–245. [Google Scholar]
  20. Hardeman, E.; Jochemsen, H. Are There Ideological Aspects to the Modernization of Agriculture? J. Agric. Environ. Ethic 2012, 25, 657–674. [Google Scholar] [CrossRef] [Green Version]
  21. Carof, M.; Colomb, B.; Aveline, A. A guide for choosing the most appropriate method for multi-criteria assessment of agricultural systems according to decision-makers’ expectations. Agric. Syst. 2013, 115, 51–62. [Google Scholar] [CrossRef]
  22. Wang, Z.G.; Wang, J.B.; Zhang, G.P.; Wang, Z.X. Evaluation of Agricultural Extension Service for Sustainable Agricultural Development Using a Hybrid Entropy and TOPSIS Method. Sustainability 2021, 13, 347. [Google Scholar] [CrossRef]
  23. Lichtfouse, E.; Navarrete, M.; Debaeke, P.; Souchere, V.; Alberola, C.; Menassieu, J. Agronomy for sustainable agriculture. A review. Agron. Sustain. Dev. 2009, 29, 1–7. [Google Scholar] [CrossRef]
  24. Lal, R. Soils and sustainable agriculture. A review. Agron Sustain Dev. 2008, 28, 57–64. [Google Scholar] [CrossRef]
  25. Quintero-Angel, M.; Gonzalez-Acevedo, A. Tendencies and challenges for the assessment of agricultural sustainability. Agric. Ecosyst. Environ. 2018, 254, 273–281. [Google Scholar] [CrossRef]
  26. Rodrigues, G.S.; Martins, C.R.; de Barros, I. Sustainability assessment of ecological intensification practices in coconut production. Agric. Syst. 2018, 165, 71–84. [Google Scholar] [CrossRef] [Green Version]
  27. Buseth, J.T. The green economy in Tanzania: From global discourses to institutionalization. Geoforum 2017, 86, 42–52. [Google Scholar] [CrossRef]
  28. Belmonte-Urena, L.J.; Plaza-Ubeda, J.A.; Vazquez-Brust, D.; Yakovleva, N. Circular economy, degrowth and green growth as pathways for research on sustainable development goals: A global analysis and future agenda. Ecol. Econ. 2021, 185, 107050. [Google Scholar] [CrossRef]
  29. Nadaraja, D.; Lu, C.G.; Islam, M.M. The Sustainability Assessment of Plantation Agriculture—A Systematic Review of Sustainability Indicators. Sustain. Prod. Consum. 2021, 26, 892–910. [Google Scholar] [CrossRef]
  30. Wang, M.X.; Zhao, H.H.; Cui, J.X.; Fan, D.; Lv, B.; Wang, G.; Li, Z.H.; Zhou, G.J. Evaluating green development level of nine cities within the Pearl River Delta, China. J. Clean. Prod. 2018, 174, 315–323. [Google Scholar] [CrossRef]
  31. Shang, Y.; Liu, S. Spatial-Temporal Coupling Coordination Relationship between Urbanization and Green Development in the Coastal Cities of China. Sustainability 2021, 13, 5339. [Google Scholar] [CrossRef]
  32. Wang, Y.; Hu, H.; Dai, W.; Burns, K. Evaluation of industrial green development and industrial green competitiveness: Evidence from Chinese urban agglomerations. Ecol. Indic. 2021, 124, 107371. [Google Scholar] [CrossRef]
  33. Shen, J.B.; Zhu, Q.C.; Jiao, X.Q.; Ying, H.; Wang, H.L.; Wen, X.; Xu, W.; Li, T.Y.; Cong, W.F.; Liu, X.J.; et al. Agriculture Green Development: A model for China and the world. Front. Agric. Sci. Eng. 2020, 7, 5–13. [Google Scholar] [CrossRef] [Green Version]
  34. Guo, H.; Xu, S.; Pan, C. Measurement of the Spatial Complexity and Its Influencing Factors of Agricultural Green Development in China. Sustainability 2020, 12, 9259. [Google Scholar] [CrossRef]
  35. Chen, W.H.; Chen, J.C.; Xu, D.Y.; Liu, J.C.; Niu, N.N. Assessment of the practices and contributions of China’s green industry to the socio-economic development. J. Clean. Prod. 2017, 153, 648–656. [Google Scholar] [CrossRef]
  36. Wang, L.; Qi, Z.R.; Pang, Q.H.; Xiang, Y.B.; Sun, Y.L. Analysis on the Agricultural Green Production Efficiency and Driving Factors of Urban Agglomerations in the Middle Reaches of the Yangtze River. Sustainability 2021, 13, 97. [Google Scholar] [CrossRef]
  37. Meng, G.; Guo, Z.; Li, J. The dynamic linkage among urbanisation, industrialisation and carbon emissions in China: Insights from spatiotemporal effect. Sci. Total Environ. 2020, 760, 144042. [Google Scholar] [CrossRef] [PubMed]
  38. Dong, H.M.; Xue, M.G.; Xiao, Y.J.; Liu, Y.S. Do carbon emissions impact the health of residents? Considering China’s industrialization and urbanization. Sci. Total Environ. 2021, 758, 143688. [Google Scholar] [CrossRef] [PubMed]
  39. Tian, Y.; Jiang, G.; Zhou, D.; Li, G. Systematically addressing the heterogeneity in the response of ecosystem services to agricultural modernization, industrialization and urbanization in the Qinghai-Tibetan Plateau from 2000 to 2018. J. Clean. Prod. 2021, 285, 125323. [Google Scholar] [CrossRef]
  40. Liu, Y.F.; Sun, D.S.; Wang, H.J.; Wang, X.J.; Yu, G.Q.; Zhao, X.J. An evaluation of China’s agricultural green production: 1978–2017. J. Clean. Prod. 2020, 243, 118483. [Google Scholar] [CrossRef]
  41. Sun, L.Y.; Liu, T.; Zhang, L. The Pollution of Scale Livestock and Poultry Breeding and Its Influence on Eco-Environment. J. South China Agric. Univ. 2016, 15, 23–30. (In Chinese) [Google Scholar]
  42. Liao, W. Characteristics and Influencing Factors of Farmers’ Straw Treatment Behavior. Areal Res. Dev. 2020, 39, 134–138, 145. (In Chinese) [Google Scholar]
  43. Zhang, T. Strengthening Soil and Environment Management of Agricultural Producing Area, Promoting Sustainable Development of Agriculture in China. Bull. Chin. Acad. Sci. 2015, 30, 435–444. (In Chinese) [Google Scholar]
  44. Wang, Y.; Zhou, Q. Evaluation of Development of Agricultural Modernization in Central China. IERI Procedia 2013, 4, 417–424. [Google Scholar] [CrossRef] [Green Version]
  45. Nambiar, K.K.M.; Gupta, A.P.; Fu, Q.L.; Li, S. Biophysical, chemical and socio-economic indicators for assessing agricultural sustainability in the Chinese coastal zone. Agric. Ecosyst. Environ. 2001, 87, 209–214. [Google Scholar] [CrossRef]
  46. Tian, Y.; Zhang, J.-B. Study on Regional Differences and Genesis in Development Level of Green Agriculture in China. Res. Agric. Mod. 2013, 34, 85–89. (In Chinese) [Google Scholar]
  47. Wu, Y.N.; Tao, Y.; Deng, Z.Q.; Zhou, J.L.; Xu, C.B.; Zhang, B.Y. A fuzzy analysis framework for waste incineration power plant comprehensive benefit evaluation from refuse classification perspective. J. Clean. Prod. 2020, 258, 120734. [Google Scholar] [CrossRef]
  48. Wu, Y.N.; Liao, M.J.; Hu, M.Y.; Xu, C.B.; Tao, Y.; Zhou, J.L. Effectiveness assessment of air pollution prevention and control under collaborative supervision in the Beijing-Tianjin-Hebei region based on combination weights and grey fuzzy synthetic evaluation analysis. Sustain. Cities Soc. 2021, 64, 102543. [Google Scholar] [CrossRef]
  49. Li, Y.F.; Li, Y.; Zhou, Y.; Shi, Y.L.; Zhu, X.D. Investigation of a coupling model of coordination between urbanization and the environment. J. Environ. Manag. 2012, 98, 127–133. [Google Scholar] [CrossRef]
  50. Liu, W.J.; Jiao, F.C.; Ren, L.J.; Xu, X.G.; Wang, J.C.; Wang, X. Coupling coordination relationship between urbanization and atmospheric environment security in Jinan City. J. Clean. Prod. 2018, 204, 1–11. [Google Scholar] [CrossRef]
  51. Li, S.; Du, S. An Empirical Study on the Coupling Coordination Relationship between Cultural Tourism Industry Competitiveness and Tourism Flow. Sustainability 2021, 13, 5525. [Google Scholar] [CrossRef]
  52. Li, Q.; Zhao, Y.; Li, S.; Zhang, L. Spatial-temporal characteristics of the coupling coordination of social security and economic development in China during 2002–2018. Reg. Sustain. 2021, 2, 1766. [Google Scholar]
  53. Moran, P.A.P. The Interpretation of Statistical Maps. J. R. Stat. Soc. Ser. B 1948, 10, 243–251. [Google Scholar] [CrossRef]
Figure 1. The spatial distribution features of China’s three regions. Source: [34].
Ijerph 18 08320 g001
Figure 2. China’s industrialization and agricultural green development level 1990–2019. Data Source: The author calculated based on China Statistical Yearbook, China Industrial Statistical Yearbook, China Rural Statistical Yearbook, China Regional Economic Statistical Yearbook.
Ijerph 18 08320 g002
Figure 3. Trends of coupling coordination of China’s industrialization and agricultural green development. Data Source: the authors calculated based on China Statistical Yearbook, China Industrial Statistical Yearbook, China Rural Statistical Yearbook, China Regional Economic Statistical Yearbook.
Ijerph 18 08320 g003
Figure 4. Coupling and coordination types of China’s industrialization and agricultural green development in some years (ag). (a) 1990; (b) 1995; (c) 2000; (d) 2005; (e) 2010; (f) 2015; (g) 2019. Data Source: the authors calculated based on China Statistical Yearbook, China Industrial Statistical Yearbook, China Rural Statistical Yearbook, China Regional Economic Statistical Yearbook.
Ijerph 18 08320 g004aIjerph 18 08320 g004bIjerph 18 08320 g004cIjerph 18 08320 g004d
Figure 5. Scatter plot of local Moran index of the coupling coordination degree of China’s industrialization and agricultural green development in some years (ag). (a) 1990; (b) 1995; (c) 2000; (d) 2005; (e) 2010; (f) 2015; (g) 2019. Data Source: the authors calculated based on China Statistical Yearbook, China Industrial Statistical Yearbook, China Rural Statistical Yearbook, China Regional Economic Statistical Yearbook.
Ijerph 18 08320 g005aIjerph 18 08320 g005bIjerph 18 08320 g005c
Figure 6. Province distribution of the Moran index of the coupling coordination degree of China’s industrialization and agricultural green development in some years (ag). (a) 1990; (b) 1995; (c) 2000; (d) 2005; (e) 2010; (f) 2015; (g) 2019. Data Source: the authors calculated based on China Statistical Yearbook, China Industrial Statistical Yearbook, China Rural Statistical Yearbook, China Regional Economic Statistical Yearbook.
Ijerph 18 08320 g006aIjerph 18 08320 g006bIjerph 18 08320 g006cIjerph 18 08320 g006d
Table 1. Evaluation index system for the degree of coupling and coordination of industrialization and agricultural green development.
Primary IndexesSecondary IndexesIndex DescriptionUnitsDirectionReference
IndustrializationThe level of economic developmentPer capita GDPYuan/person+[1]
The proportion of secondary industry outputGDP of the secondary industry/Gross regional product%+[38]
The proportion of employment in the secondary industryNumber of employees in the secondary industry/total number of employees%+[39]
Secondary industry labor productivityGDP of the secondary industry/number of employees in the secondary industryTen thousand yuan/person+[32,39]
Agricultural green developmentThe per capita disposable income of rural residentsThe per capita disposable income of rural residentsTen thousand yuan/person+[34,40]
The level of agricultural mechanizationTotal power of agricultural machinery/crop sown areaW/ha+[39,40,44]
The rate of land outputTotal agricultural output value/sown area of cropsYuan/ha+[29,45]
The level of farmland being irrigatedEffective irrigation area/arable land area%+[39,44]
The intensity of fertilizer usedTotal fertilizer input/total sown areaKg/ha[29,44]
The intensity of pesticides usedTotal pesticide input/total sown areaKg/ha[29]
The intensity of the used agricultural filmTotal agricultural film input/total sown areaKg/ha[46]
The proportion of disaster areaInfested area of disaster-stricken area%[34]
Table 2. Evaluation index weights of the coupling coordination degree of industrialization and agricultural green development.
Primary IndexesSecondary IndexesIndex Weight
IndustrializationThe level of economic development0.2456
The proportion of secondary industry output0.2542
The proportion of employment in the secondary industry0.2522
Secondary industry labor productivity0.2481
Agricultural green developmentThe per capita disposable income of rural residents0.1232
The level of agricultural mechanization0.1226
The rate of land output0.1236
The level of farmland being irrigated0.1247
The intensity of fertilizer used0.1260
The intensity of pesticides used0.1269
the intensity of the used agricultural film0.1272
the proportion of disaster area0.1258
Source: the authors calculated based on China Statistical Yearbook, China Industrial Statistical Yearbook, China Rural Statistical Yearbook, China Regional Economic Statistical Yearbook.
Table 3. China’s Industrialization Development Index.
ProvinceYearsLevelSort
1990199520002005201020152019
Shanghai0.82320.94400.93320.92000.69310.47100.45200.7481
Tianjin0.59030.67250.69260.83890.76180.74000.40090.67102
Jiangsu0.37650.65790.54600.67480.60150.69250.70940.60843
Zhejiang0.34900.70950.55720.66470.59930.62960.60610.58794
Guangdong0.33140.64010.55000.60470.56690.57820.51780.54135
Fujian0.24790.51890.45550.50760.57770.64990.69310.52156
Shandong0.33200.52690.45830.59220.59590.60730.50170.51637
Liaoning0.46680.51780.54150.49920.60750.56320.37750.51058
Beijing0.61870.59940.57690.54550.37370.30260.27720.47059
Inner Mongolia0.26060.27040.29020.42980.72150.72640.51210.458710
Xinjiang0.33680.32150.44310.39030.55110.55410.52230.445611
Hebei0.33890.45170.41820.47710.45340.51290.41500.438212
Shanxi0.41330.41320.36890.48200.53940.37780.40110.428013
Hubei0.28800.36630.43870.33170.46880.51690.49150.414614
Heilongjiang0.44180.48480.55600.49920.47390.27970.14960.412115
Qinghai0.40370.27700.29830.29560.48590.57370.47180.400916
Jilin0.31140.32700.36930.38020.53410.57260.30760.400317
Henan0.21500.38180.30400.38020.48470.50450.47680.392418
Chongqing0.31220.41600.25570.29310.49090.42660.49780.384619
Shaanxi0.25670.27070.26960.30160.47580.52490.50580.372120
Hunan0.29810.27360.25530.37540.40500.49240.44480.363521
Anhui0.26180.39140.25730.26920.40790.47740.46730.361722
Yunnan0.35040.35200.28510.27800.35160.38150.51180.358623
Ningxia0.32090.27300.28890.31220.43020.42390.44390.356224
Jiangxi0.20840.24600.19920.34210.43550.51670.46800.345125
Sichuan0.13810.20200.25570.25870.43530.40360.33450.289726
Guangxi0.21030.32100.19470.20530.34100.45390.29510.288827
Gansu0.27550.27040.26140.25010.37700.29320.22610.279128
Guizhou0.26660.18860.15390.14610.29330.37020.39440.259029
Hainan0.39020.24770.11090.14830.21770.19200.27040.225330
Tibet0.06570.03710.11630.06110.10850.27250.40280.152031
the east0.44230.58970.53090.58850.54990.53990.4746
the middle0.30470.36050.34360.38250.46870.46730.4008
the west0.26650.26660.25940.26850.42180.45040.4265
Source: the authors calculated based on China Statistical Yearbook, China Industrial Statistical Yearbook, China Rural Statistical Yearbook, China Regional Economic Statistical Yearbook.
Table 4. China Agricultural Green Development Index.
ProvinceYearsLevelSort
1990199520002005201020152019
Tianjin0.75940.68940.65960.62490.60950.63750.63660.65961
Tibet0.53090.60010.63230.65540.61920.61890.70970.62382
Zhejiang0.59730.56110.58770.54800.63050.56240.55440.57733
Beijing0.68470.54020.69980.59800.58290.41470.48700.57254
Shanghai0.59690.49790.41310.44620.63770.56750.65390.54475
Jiangsu0.57030.47520.49280.48640.55720.56730.58540.53356
Hebei0.56820.50800.51800.55690.54240.51640.48410.52777
Hunan0.54400.51780.54120.45000.50250.51520.49280.50918
Qinghai0.55330.52710.43710.52610.50860.43810.48860.49709
Guangdong0.56710.50490.53110.41840.52360.44720.47410.495210
Shandong0.54790.42430.44320.45930.50320.49000.46120.475611
Xinjiang0.59560.50610.49340.44650.42810.40670.44680.474712
Henan0.54000.40870.49040.46160.48420.48010.45590.474413
Sichuan0.55830.45710.46700.42560.46230.48110.46320.473514
Jiangxi0.56080.51470.42850.44670.47640.43830.43250.471115
Anhui0.53850.40500.41150.41090.48470.46760.44570.45216
Chongqing0.51310.50170.45080.39170.44480.42010.44130.451917
Ningxia0.53880.45680.42520.41350.45360.40760.46160.451018
Inner Mongolia0.53970.46670.45880.44470.41360.40630.41750.449619
Heilongjiang0.51990.44420.42780.44230.40970.44070.46100.449420
Shanxi0.52950.47040.42820.40860.42120.44560.39080.442021
Guizhou0.42200.46230.46980.41440.38870.45160.46980.439822
Fujian0.50660.44070.41630.40160.44100.45390.40530.437923
Guangxi0.53230.42330.45000.38800.40060.41890.40930.431824
Hubei0.52520.43470.35690.34210.42490.45320.46290.428625
Yunnan0.51950.45440.46130.37280.34660.37250.39660.417726
Shaanxi0.51210.41530.39920.38880.40290.38060.42400.417627
Jilin0.50470.42920.35620.38730.37470.38980.38290.403528
Hainan0.55880.51460.48400.27730.32460.26430.34410.395429
Liaoning0.44440.38570.38980.39030.34890.37710.42050.393830
Gansu0.48810.43300.42180.35230.35850.30620.31120.381631
the east0.58200.50380.51230.47340.51830.48170.5006
the middle0.53220.45430.43900.43120.44540.45230.4403
the west0.51940.46940.45250.42630.43540.42960.4546
Source: the authors calculated based on China Statistical Yearbook, China Industrial Statistical Yearbook, China Rural Statistical Yearbook, China Regional Economic Statistical Yearbook.
Table 5. Global Moran index of coupling coordination degree of China’s industrialization and agricultural green development in some years.
YearIE (I)Sd (I)Zp-Value
19900.169−0.0330.0722.8150.002
19950.224−0.0330.0723.5880.000
20000.296−0.0330.0744.4520.000
20050.378−0.0330.0745.5220.000
20100.245−0.0330.0743.7650.000
20150.079−0.0330.0721.5620.059
20190.143−0.0330.0742.3900.008
Publisher’s Note: MDPI stays neutral with regard to jurisdictional claims in published maps and institutional affiliations.

