
Differences in Trajectories and Predictive Factors of Cognition over Time in a Sample of Cognitively Healthy Adults, in Zaragoza, Spain

 , , ,
, , ,
Abstract
:1. Introduction
2. Materials and Methods
2.1. Sample and Procedure
2.2. Assessment of Cognitive Function
2.3. Other Measurements
2.4. Data Analysis
3. Results
4. Discussion
5. Conclusions
Author Contributions
Funding
Institutional Review Board Statement
Informed Consent Statement
Data Availability Statement
Acknowledgments
Conflicts of Interest
References
- Depp, C.A.; Jeste, D.V. Definitions and predictors of successful aging: A comprehensive review of larger quantitative studies. Am. J. Geriatr. Psychiatry 2006, 14, 6–20. [Google Scholar] [CrossRef]
- Wang, X.J.; Xu, W.; Li, J.Q.; Cao, X.P.; Tan, L.; Yu, J.T. Early-Life Risk Factors for Dementia and Cognitive Impairment in Later Life: A Systematic Review and Meta-Analysis. J. Alzheimers Dis. 2019, 67, 221–229. [Google Scholar] [CrossRef]
- Besser, L.M.; McDonald, N.C.; Song, Y.; Kukull, W.A.; Rodriguez, D.A. Neighborhood Environment and Cognition in Older Adults: A Systematic Review. J. Prev. Med. 2017, 53, 241–251. [Google Scholar] [CrossRef] [Green Version]
- Peters, R.; Booth, A.; Rockwood, K.; Peters, J.; D’Este, C.; Anstey, K.J. Combining modifiable risk factors and risk of dementia: A systematic review and meta-analysis. BMJ Open 2019, 9, e022846. [Google Scholar] [CrossRef] [PubMed]
- Yu, J.; Collinson, S.L.; Liew, T.M.; Ng, T.-P.; Mahendran, R.; Kua, E.H.; Feng, L. Super-cognition in aging: Cognitive profiles and associated lifestyle factors. Appl. Neuropsychol. Adult 2019, 27, 497–503. [Google Scholar] [CrossRef] [PubMed]
- Nyberg, L.; Lövdén, M.; Riklund, K.; Lindenberger, U.; Bäckman, L. Memory aging and brain maintenance. Trends Cogn. Sci. 2021, 16, 292–305. [Google Scholar] [CrossRef] [PubMed] [Green Version]
- Elliott, M.L.; Caspi, A.; Houts, R.M.; Ambler, A.; Broadbent, J.M.; Hancox, R.J.; Harrington, H.; Hogan, S.; Keenan, R.; Knodt, A.; et al. Disparities in the pace of biological aging among midlife adults of the same chronological age have implications for future frailty risk and policy. Nat. Aging 2021, 1, 295–308. [Google Scholar] [CrossRef] [PubMed]
- Institute of Medicine. Cognitive Aging: Progress in Understanding and Opportunities for Action. Mil. Med. 2015, 180, 1111–1113. [Google Scholar] [CrossRef] [PubMed] [Green Version]
- Yaffe, K.; Peltz, C.B.; Ewing, S.K.; McCulloch, C.E.; Cummings, S.R.; A Cauley, J.; Hillier, T.A.; Ensrud, K. Long-term Cognitive Trajectories and Mortality in Older Women. J. Gerontol. Ser. A Boil. Sci. Med Sci. 2016, 71, 1074–1080. [Google Scholar] [CrossRef]
- Taniguchi, Y.; Kitamura, A.; Murayama, H.; Amano, H.; Shinozaki, T.; Yokota, I.; Seino, S.; Nofuji, Y.; Nishi, M.; Yokoyama, Y.; et al. Mini-Mental State Examination score trajectories and incident disabling dementia among community-dwelling older Japanese adults. Geriatr. Gerontol. Int. 2017, 17, 1928–1935. [Google Scholar] [CrossRef]
- Chen, T.-Y.; Chang, H.-Y. Developmental Patterns of Cognitive Function and Associated Factors among the Elderly in Taiwan. Sci. Rep. 2016, 6, 33486. [Google Scholar] [CrossRef] [PubMed] [Green Version]
- Park, S.; Kwon, E.; Lee, H. Life course trajectories of later-life cognitive functions: Does social engagement in old age matter? Int. J. Environ. Res. Public Heal. 2017, 14, 393. [Google Scholar] [CrossRef] [PubMed] [Green Version]
- Yu, J.; Feng, Q.; Yu, J.-T.; Zeng, Y.; Feng, L. Late-Life Cognitive Trajectories and their Associated Lifestyle Factors. J. Alzheimer’s Dis. 2020, 73, 1555–1563. [Google Scholar] [CrossRef]
- Terrera, G.M.; Brayne, C.; Matthews, F. One size fits all? Why we need more sophisticated analytical methods in the explanation of trajectories of cognition in older age and their potential risk factors. Int. Psychogeriatr. 2009, 22, 291–299. [Google Scholar] [CrossRef] [PubMed]
- McFall, G.P.; McDermott, K.L.; Dixon, R.A. Modifiable Risk Factors Discriminate Memory Trajectories in Non-Demented Aging: Precision Factors and Targets for Promoting Healthier Brain Aging and Preventing Dementia. J. Alzheimer’s Dis. 2019, 70, S101–S118. [Google Scholar] [CrossRef] [Green Version]
- Small, B.J.; Bäckman, L. Longitudinal trajectories of cognitive change in preclinical Alzheimer’s disease: A growth mixture modeling analysis. Cortex 2007, 43, 826–834. [Google Scholar] [CrossRef]
- Wu, Z.; Phyo, A.Z.Z.; Al-Harbi, T.; Woods, R.L.; Ryan, J. Distinct Cognitive Trajectories in Late Life and Associated Predictors and Outcomes: A Systematic Review. J. Alzheimer’s Dis. Rep. 2020, 4, 459–478. [Google Scholar] [CrossRef]
- Min, J.W. A longitudinal study of cognitive trajectories and its factors for koreans aged 60 and over: A latent growth mixture model. Int. J. Geriatr. Psychiatry 2018, 33, 755–762. [Google Scholar] [CrossRef] [PubMed]
- Howrey, B.T.; Raji, M.A.; Masel, M.M.; Peek, M.K. Stability in Cognitive Function Over 18 Years: Prevalence and Predictors Among Older Mexican Americans. Curr. Alzheimer Res. 2015, 12, 614–621. [Google Scholar] [CrossRef] [Green Version]
- Santabárbara, J.; Lopez-Anton, R.; De-la-Cámara, C.; Lobo, E.; Gracia-García, P.; Villagrasa, B.; Bueno-Notivol, J.; Marcos, G.; Lobo, A. Clinically significant anxiety as a risk factor for dementia in the elderly community. Acta Psychiatr. Scand. 2019, 139, 6–14. [Google Scholar] [CrossRef] [Green Version]
- Bayes-Marin, I.; Fernández, D.; Lara, E.; Martín-María, N.; Miret, M.; Moreno-Agostino, D.; Ayuso-Mateos, J.L.; Sanchez-Niubo, A.; Haro, J.M.; Olaya, B. Trajectories of immediate and delayed verbal memory in the Spanish general population of middle-aged and older adults. Brain Sci. 2020, 10, 249. [Google Scholar] [CrossRef] [PubMed] [Green Version]
- Marioni, R.E.; Proust-Lima, C.; Amieva, H.; Brayne, C.; Matthews, F.; Dartigues, J.-F.; Jacqmin-Gadda, H. Cognitive lifestyle jointly predicts longitudinal cognitive decline and mortality risk. Eur. J. Epidemiol. 2014, 29, 211–219. [Google Scholar] [CrossRef] [Green Version]
- Teipel, S.J.; Cavedo, E.; Lista, S.; Habert, M.O.; Potier, M.C.; Grothe, M.J.; Epelbaum, S.; Sambati, L.; Gagliardi, G.; Toschi, N.; et al. Effect of Alzheimer’s disease risk and protective factors on cognitive trajectories in subjective memory complainers: An INSIGHT-preAD study. Alzheimer’s Dement. 2018, 14, 1126–1136. [Google Scholar] [CrossRef] [PubMed]
- Fratiglioni, L.; Launer, L.J.; Andersen, K.; Breteler, M.M.; Copeland, J.R.; Dartigues, J.F.; Lobo, A.; Martinez-Lage, J.; Soininen, H.; Hofman, A. Incidence of dementia and major subtypes in Europe: A collaborative study of population-based cohorts. Neurology 2000, 54 (Suppl. 5), S4–S9. [Google Scholar]
- Lobo, A.; Lopez-Anton, R.; Santabárbara, J.; De-la-Cámara, C.; Ventura, T.; Quintanilla, M.A.; Roy, J.F.; Campayo, A.J.; Lobo, E.; Palomo, T.; et al. Incidence and lifetime risk of dementia and Alzheimer’s disease in a Southern European population. Acta Psychiatr. Scand. 2011, 124, 372–383. [Google Scholar] [CrossRef]
- Lobo, A.; Saz, P.; Marcos, G.; Día, J.L.; De-la-Cámara, C.; Ventura, T.; Montañés, J.A.; Lobo-Escolar, A.; Aznar, S. The ZARADEMP Project on the incidence, prevalence and risk factors of dementia (and depression) in the elderly community: II. Methods and first results. Eur. J. Psychiatry 2005, 19, 40–54. [Google Scholar] [CrossRef] [Green Version]
- Lobo, A.; Saz, P.; Marcos, G.; Día, J.L.; De-la-Cámara, C. The prevalence of dementia and depression in the elderly community in a southern European population. The Zaragoza study. Arch. Gen. Psychiatry 1995, 52, 497–506. [Google Scholar] [CrossRef] [PubMed]
- Folstein, M.F.; Folstein, S.E.; McHugh, P.R. “Mini-Mental-State”, a practical method for grading the cognitive state of patients for the clinician. J. Psychiatr. Res. 1975, 12, 189–198. [Google Scholar] [CrossRef]
- Lobo, A.; Saz, P.; Marcos, G.; Día, J.L.; De-la-Cámara, C.; Ventura, T.; Pascual, F.; Montanes, J.A.; Aznar, S. Revalidation and standardization of the cognition mini-exam (first Spanish version of the Mini-Mental Status Examination) in the general geriatric population. Med. Clin. 1999, 112, 767–774. [Google Scholar]
- Muthén, B.; Shedden, K. Finite mixture modeling with mixture outcomes using the EM algorithm. Biometrics 1999, 55, 463–469. [Google Scholar] [CrossRef]
- Ram, N.; Grimm, K.J. Methods and Measures: Growth mixture modeling: A method for identifying differences in longitudinal change among unobserved groups. Int. J. Behav. Dev. 2009, 33, 565–576. [Google Scholar] [CrossRef] [Green Version]
- Baltes, P.B.; Nesselroade, J.R. (Eds.) History and rationale of longitudinal research. In Longitudinal Research in the Study of Behavior and Development; Academic Press: New York, NY, USA, 1979; pp. 1–39. [Google Scholar]
- Proust-Lima, C.; Philipps, V.; Liquet, B. Estimation of extended mixed models using latent classes and latent processes: The R package lcmm. J. Stat. Softw. 2017, 78, 1–56. [Google Scholar] [CrossRef] [Green Version]
- Nagin, D.S. Analyzing developmental trajectories: A semiparametric, group-based approach. Psychol. Methods 1999, 4, 139–157. [Google Scholar] [CrossRef]
- Nagin, D.S.; Odgers, C.L. Group-based trajectory modeling in clinical research. Vol. 6, Annual Review of Clinical Psychology. Annu. Rev. Clin. Psychol. 2010, 6, 109–138. [Google Scholar] [CrossRef] [PubMed] [Green Version]
- Jung, T.; Wickrama, K.A.S. An Introduction to Latent Class Growth Analysis and Growth Mixture Modeling. Soc. Pers. Psychol. Compass 2007, 2, 302–317. [Google Scholar] [CrossRef]
- Makkar, S.R.; Lipnicki, D.M.; Crawford, J.D.; Kochan, N.A.; Castro-Costa, E.; Lima-Costa, M.F.; Diniz, B.S.; Brayne, C.; Stephan, B.; Matthews, F.; et al. Education and the moderating roles of age, sex, ethnicity and apolipoprotein epsilon 4 on the risk of cognitive impairment. Arch. Gerontol. Geriatr. 2020, 91, 104112. [Google Scholar] [CrossRef] [PubMed]
- Noble, C.; Medin, D.; Quail, Z.; Young, C.; Carter, M. How Does Participation in Formal Education or Learning for Older People Affect Wellbeing and Cognition? A Systematic Literature Review and Meta-Analysis. Gerontol. Geriatr. Med. 2021, 7, 7. [Google Scholar] [CrossRef] [PubMed]
- Lipnicki, D.M.; Makkar, S.R.; Crawford, J.D.; Thalamuthu, A.; Kochan, N.A.; Lima-Costa, M.F.; Castro-Costa, E.; Ferri, C.P.; Brayne, C.; Stephan, B.; et al. Determinants of cognitive performance and decline in 20 diverse ethno-regional groups: A COSMIC collaboration cohort study. PLoS Med. 2019, 16, e1002853. [Google Scholar] [CrossRef] [PubMed]
- Gracia-García, P.; De-la-Cámara, C.; Santabárbara, J.; Lopez-Anton, R.; Quintanilla, M.A.; Ventura, T.; Marcos, G.; Campayo, A.; Saz, P.; Lyketsos, C.; et al. Depression and incident alzheimer disease: The impact of disease severity. Am. J. Geriatr. Psychiatry 2015, 23, 119–129. [Google Scholar] [CrossRef] [Green Version]
- Cherbuin, N.; Kim, S.; Anstey, K.J. Dementia risk estimates associated with measures of depression: A systematic review and meta-analysis. BMJ Open 2015, 5, e008853. [Google Scholar] [CrossRef] [Green Version]
- Santabárbara, J.; Villagrasa, B.; Gracia-Garcia, P. Does depression increase the risk of dementia? Updated meta-analysis of prospective studies Study selection. Actas Esp. Psiquiatr. 2020, 48, 169–180. [Google Scholar] [PubMed]
- Ravdin, L.D.; Wilkins, V.M.; Kiosses, D. Late-life depression with comorbid cognitive impairment and disability: Nonpharmacological interventions. Clin. Interv. Aging 2010, 5, 323–331. [Google Scholar] [CrossRef] [Green Version]
- Schaub, R.T.; Linden, M.; Copeland, J.R.M. A comparison of GMS-A/AGECAT, DSM-III-R for dementia and depression, including subthreshold depression (SD)—Results from the Berlin Aging Study (BASE). Int. J. Geriatr. Psychiatry 2003, 18, 109–117. [Google Scholar] [CrossRef]
- Santabárbara, J.; Villagrasa, B.; López-Antón, R.; Olaya, B.; Bueno-Notivol, J.; De-la-Cámara, C.; Gracia-García, P.; Lobo, E.; Lobo, A. Clinically relevant anxiety and risk of Alzheimer’s disease in an elderly community sample: 4.5 years of follow-up. J. Affect. Disord. 2019, 250, 16–20. [Google Scholar] [CrossRef] [PubMed]
- Stein, M.B.; Kirk, P.; Prabhu, V.; Grott, M.; Terepa, M. Mixed anxiety-depression in a primary-care clinic. J. Affect. Disord. 1995, 34, 79–84. [Google Scholar] [CrossRef]
- Farias, S.T.; Chou, E.; Harvey, D.J.; Mungas, D.; Reed, B.; DeCarli, C.; Park, L.Q.; Beckett, L. Longitudinal trajectories of everyday function by diagnostic status. Psychol. Aging 2013, 28, 1070–1075. [Google Scholar] [CrossRef] [PubMed] [Green Version]
- Liu-Seifert, H.; Siemers, E.; Price, K.; Han, B.; Selzler, K.J.; Henley, D.; Sundell, K.; Aisen, P.; Cummings, J.; Raskin, J.; et al. Cognitive Impairment Precedes and Predicts Functional Impairment in Mild Alzheimer’s Disease. J. Alzheimer’s Dis. 2015, 47, 205–214. [Google Scholar] [CrossRef] [Green Version]
- Mungas, D.; Beckett, L.; Harvey, D.; Farias, S.T.; Reed, B.; Carmichael, O.; Olichney, J.; Miller, J.; DeCarli, C. Heterogeneity of cognitive trajectories in diverse older persons. Psychol. Aging 2010, 25, 606–619. [Google Scholar] [CrossRef] [Green Version]


| Total observations | 8406 | |
| N | 2403 | |
| nº classes | 2 | 3 |
| AIC 1 | 33,244.86 | 33,224.5 |
| BIC 2 | 33,308.49 | 33,311.26 |
| SABIC 3 | 33,273.54 | 33,263.61 |
| maximum log-likelihood | −16,611.43 | −16,597.25 |
| Entropy | 0.55 | 0.45 |
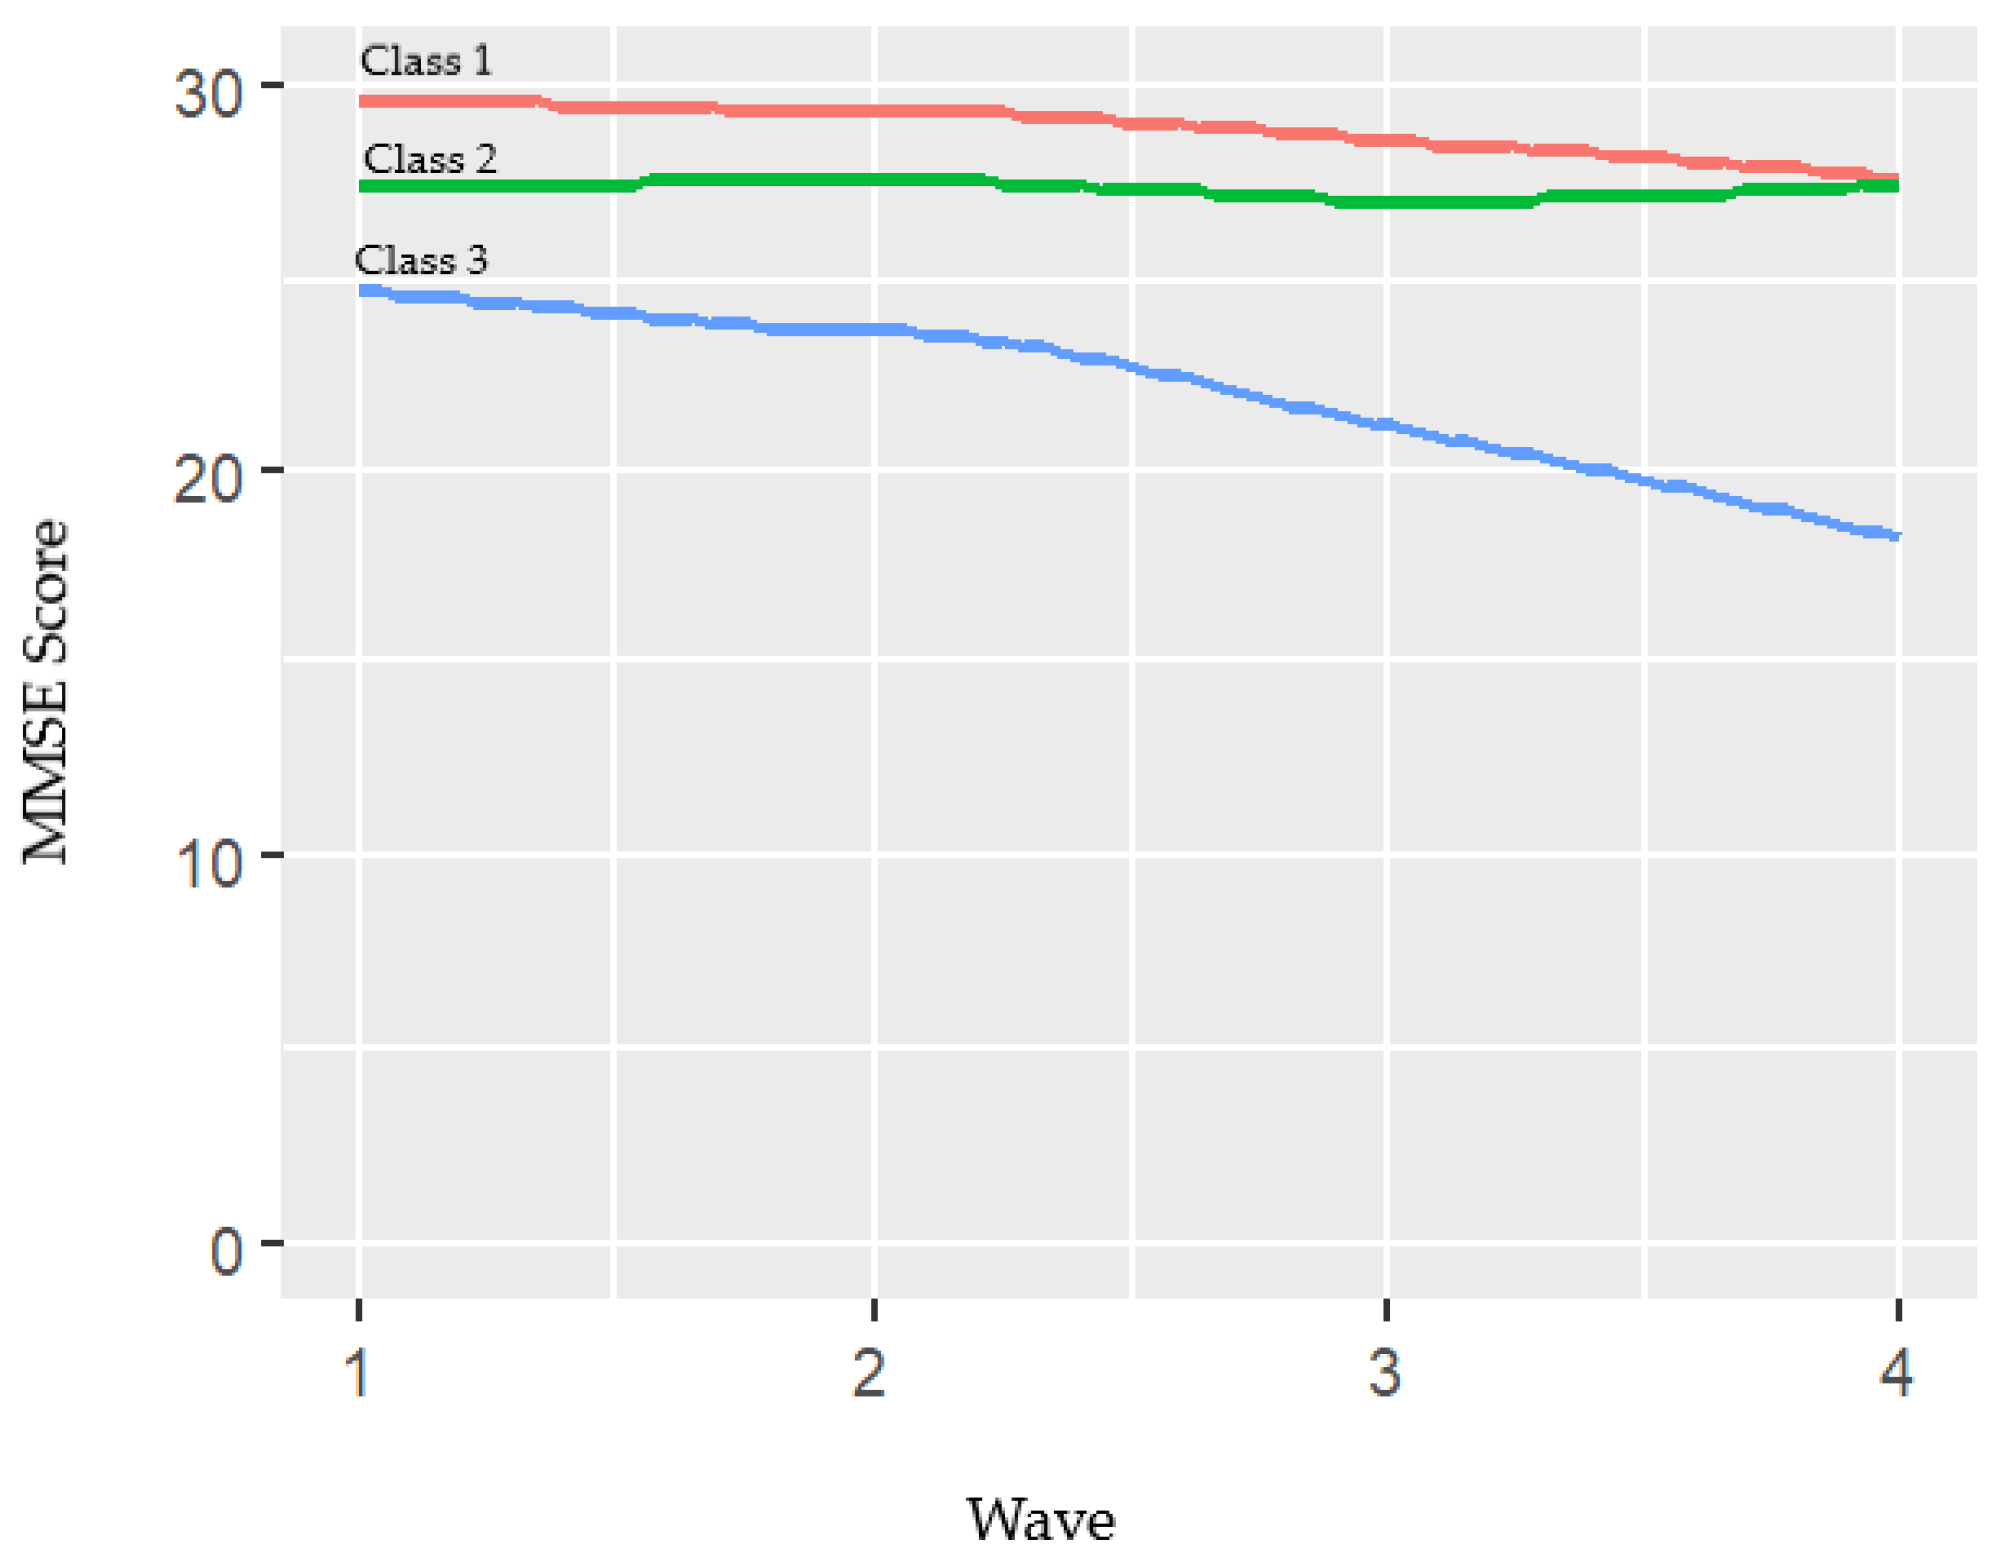
| Class | n (%) | Posterior Probability (%) | MMSE Scores | ||||
|---|---|---|---|---|---|---|---|
| Wave 1 (Baseline) | Wave 2 | Wave 3 | Wave 4 | ||||
| 1 | 510 (21.2) | 74.8 | Mean (SD) | 29.6 (0.6) | 29.3 (0.9) | 28.6 (1.7) | 27.6 (3.9) |
| Min-max | 27–30 | 25–30 | 18–30 | 0–30 | |||
| 2 | 1656 (68.9) | 73.8 | Mean (SD) | 27.4 (1.7) | 27.5 (1.9) | 27.0 (2.8) | 27.4 (3.0) |
| Min-max | 18–30 | 18–30 | 0–30 | 3–30 | |||
| 3 | 237 (9.9) | 69.8 | Mean (SD) | 24.6 (3.2) | 23.6 (4.5) | 21.1 (6.9) | 18.2 (8.1) |
| Min-max | 0–29 | 0–30 | 0–29 | 0–28 | |||
| Class 1 N = 510 (21.2%) | Class 2 N = 1656 (68.9%) | Class 3 N = 237 (9.9%) | p-Value | |
|---|---|---|---|---|
| Age | 69.6 (7.6) | 70.4 (8.1) | 70.4 (7.4) | 0.107 |
| Men | 259 (50.8) | 727 (43.9) | 75 (31.7) | <0.001 |
| Education | ||||
| Illiterate | 4 (0.8) | 105 (6.3) | 42 (17.7) | <0.001 |
| Primary | 286 (56.1) | 1301 (78.6) | 186 (78.5) | |
| Medium/High | 219 (42.9) | 239 (14.4) | 8 (3.4) | |
| Missing | 1 (0.2) | 11 (0.7) | 1 (0.4) | |
| Marital Status | ||||
| Single 1 | 60 (11.8) | 171 (10.3) | 20 (8.4) | |
| Couple | 370 (72.6) | 1105 (66.7) | 154 (65.0) | 0.003 |
| Widowed | 79 (15.5) | 376 (22.7) | 62 (26.3) | |
| Missing | 1 (0.2) | 4 (0.2) | 1 (0.4) | |
| Hypertension | 338 (66.3) | 1095 (66.1) | 177 (74.7) | 0.032 |
| Missing | 0 (0.0) | 3 (0.2) | 0 (0.0) | |
| Diabetes | 51 (10.0) | 193 (11.7) | 38 (16.0) | 0.054 |
| Missing | 2 (0.4) | 13 (0.8) | 2 (0.8) | |
| Depression | 49 (9.6) | 271 (16.4) | 59 (25.0) | <0.001 |
| Missing | 2 (0.4) | 53 (3.2) | 27 (11.4) | |
| Anxiety | 13 (2.6) | 62 (3.7) | 20 (8.4) | <0.001 |
| iADLs 2 | 24 (4.7) | 123 (7.4) | 35 (14.8) | <0.001 |
| Missing | 0 (0.0) | 1 (0.1) | 3 (1.3) | |
| bADLs 3 | 19 (3.7) | 71 (4.3) | 12 (5.1) | 0.688 |
| Missing | 1 (0.2) | 2 (0.1) | 1 (0.4) | |
| Alcohol | ||||
| Ex-drinker | 45 (8.8) | 186 (11.2) | 24 (10.1) | 0.002 |
| Habitual | 140 (27.5) | 396 (23.9) | 41 (17.3) | |
| Never | 289 (56.7) | 998 (60.3) | 166 (70.0) | |
| Ocassional | 35 (6.9) | 75 (4.5) | 6 (2.5) | |
| Missing | 1 (0.2) | 1 (0.1) | 0 (0.0) | |
| Smoking status | ||||
| Ex-smoker | 125 (24.5) | 361 (21.8) | 39 (16.5) | <0.001 |
| Non-smoker | 292 (57.3) | 1079 (65.2) | 175 (73.8) | |
| Smoker | 92 (18.0) | 216 (13.0) | 23 (9.7) | |
| Missing | 1 (0.2%) | 0 (0.0) | 0 (0.0) |
| Class 1 1 | Class 3 1 | |||||
|---|---|---|---|---|---|---|
| OR | 95% CI | p-Value | OR | 95% CI | p-Value | |
| Men | 0.93 | 0.72–1.21 | 0.657 | 0.72 | 0.47, 1.08 | 0.182 |
| Education (ref. Illiterate) | ||||||
| Primary | 5.12 | 2.19–11.96 | 0.002 | 0.36 | 0.25–0.52 | <0.001 |
| Higher | 20.33 | 8.62–47.95 | <0.001 | 0.11 | 0.05–0.22 | <0.001 |
| Marital Status (ref. Coupled) | ||||||
| Single 2 | 0.99 | 0.74–1.32 | 0.938 | 0.77 | 0.49–1.20 | 0.332 |
| Widowed | 0.82 | 0.63–1.05 | 0.187 | 0.81 | 0.59–1.10 | 0.259 |
| Hypertension | 1.10 | 0.91–1.33 | 0.396 | 1.38 | 1.04–1.84 | 0.061 |
| Depression | 0.62 | 0.46–0.83 | 0.007 | 1.50 | 1.11–2.02 | 0.027 |
| Anxiety | 0.86 | 0.50–1.48 | 0.645 | 1.60 | 0.98–2.62 | 0.114 |
| iADLs Dependency 3 | 0.79 | 0.52–1.18 | 0.329 | 1.85 | 1.26–2.70 | 0.008 |
| Alcohol (ref. Never) | ||||||
| Ex-drinker | 0.81 | 0.58–1.32 | 0.305 | 0.94 | 0.59–1.49 | 0.830 |
| Habitual | 0.98 | 0.77–1.24 | 0.878 | 0.92 | 0.63–1.33 | 0.704 |
| Ocassional | 1.10 | 0.75–1.63 | 0.679 | 0.68 | 0.31–1.52 | 0.434 |
| Smoking Status (ref. Non-smoker) | ||||||
| Ex-smoker | 0.99 | 0.76–1.30 | 0.967 | 1.06 | 0.69–1.65 | 0.818 |
| Smoker | 1.18 | 0.88–1.59 | 0.350 | 0.94 | 0.56–1.58 | 0.850 |
Publisher’s Note: MDPI stays neutral with regard to jurisdictional claims in published maps and institutional affiliations. |
© 2021 by the authors. Licensee MDPI, Basel, Switzerland. This article is an open access article distributed under the terms and conditions of the Creative Commons Attribution (CC BY) license (https://creativecommons.org/licenses/by/4.0/).
Share and Cite
Lobo, E.; Gracia-García, P.; Lobo, A.; Saz, P.; De-la-Cámara, C. Differences in Trajectories and Predictive Factors of Cognition over Time in a Sample of Cognitively Healthy Adults, in Zaragoza, Spain. Int. J. Environ. Res. Public Health 2021, 18, 7092. https://doi.org/10.3390/ijerph18137092
Lobo E, Gracia-García P, Lobo A, Saz P, De-la-Cámara C. Differences in Trajectories and Predictive Factors of Cognition over Time in a Sample of Cognitively Healthy Adults, in Zaragoza, Spain. International Journal of Environmental Research and Public Health. 2021; 18(13):7092. https://doi.org/10.3390/ijerph18137092
Chicago/Turabian StyleLobo, Elena, Patricia Gracia-García, Antonio Lobo, Pedro Saz, and Concepción De-la-Cámara. 2021. "Differences in Trajectories and Predictive Factors of Cognition over Time in a Sample of Cognitively Healthy Adults, in Zaragoza, Spain" International Journal of Environmental Research and Public Health 18, no. 13: 7092. https://doi.org/10.3390/ijerph18137092