
The Mortality Effect of Apparent Temperature: A Multi-City Study in Asia

 ,
,  and
and
Abstract
:1. Introduction
2. Materials and Methods
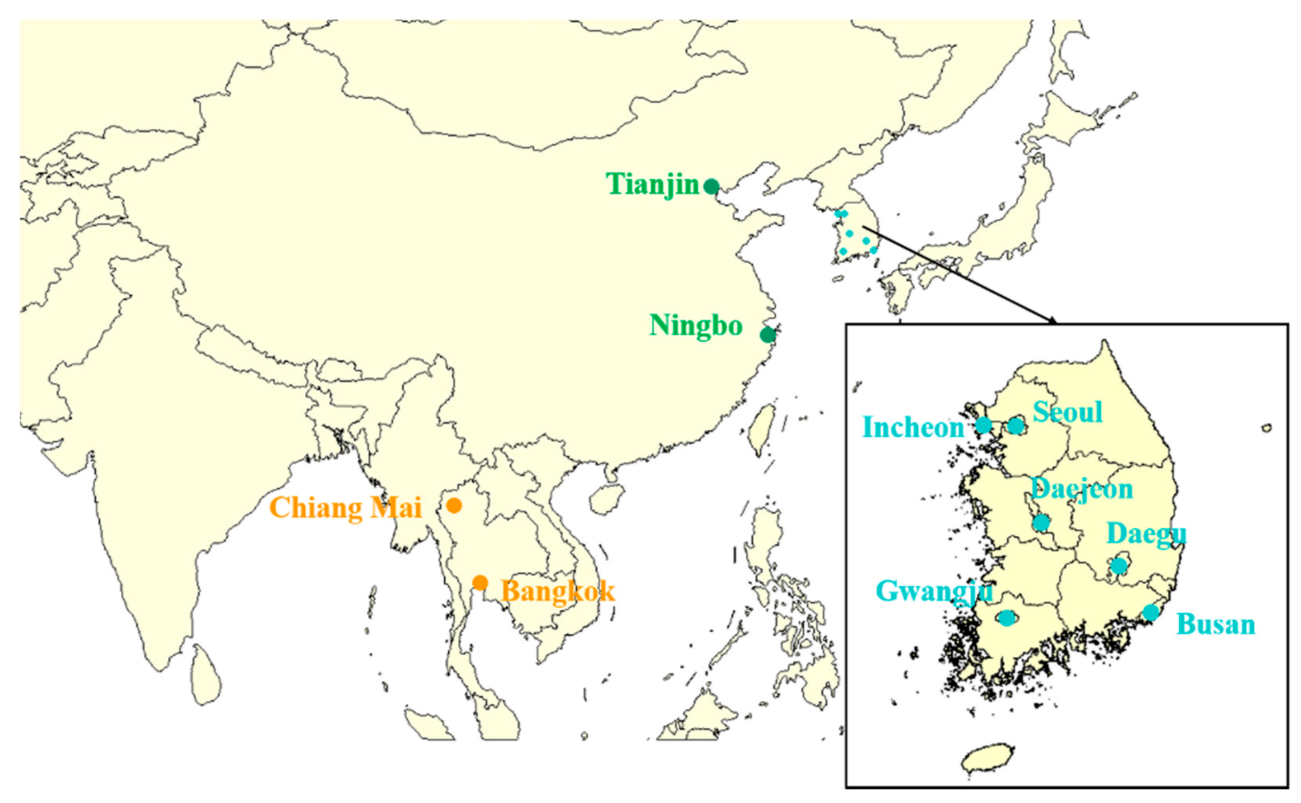
2.1. Data Source
2.2. Statistical Analysis
2.3. Sensitivity Analysis
3. Results
4. Discussion
5. Conclusions
Supplementary Materials
Author Contributions
Funding
Institutional Review Board Statement
Informed Consent Statement
Data Availability Statement
Acknowledgments
Conflicts of Interest
References
- Watts, N.; Amann, M.; Arnell, N.; Ayeb-Karlsson, S.; Belesova, K.; Berry, H.; Bouley, T.; Boykoff, M.; Byass, P.; Cai, W.; et al. The 2018 report of the Lancet Countdown on health and climate change: Shaping the health of nations for centuries to come. Lancet 2018, 392, 2479–2514. [Google Scholar] [CrossRef]
- Li, Y.; Li, G.; Zeng, Q.; Liang, F.; Pan, X. Projecting temperature-related years of life lost under different climate change scenarios in one temperate megacity, China. Environ. Pollut. 2018, 233, 1068–1075. [Google Scholar] [CrossRef] [PubMed]
- Ye, X.; Wolff, R.; Yu, W.; Vaneckova, P.; Pan, X.; Tong, S. Ambient Temperature and Morbidity: A Review of Epidemiological Evidence. Environ. Health Perspect. 2012, 120, 19–28. [Google Scholar] [CrossRef] [PubMed] [Green Version]
- Li, G.; Li, Y.; Tian, L.; Guo, Q.; Pan, X. Future temperature-related years of life lost projections for cardiovascular disease in Tianjin, China. Sci. Total Environ. 2018, 630, 943–950. [Google Scholar] [CrossRef]
- Li, G.; Guo, Q.; Liu, Y.; Li, Y.; Pan, X. Projected Temperature-Related Years of Life Lost from Stroke Due to Global Warming in a Temperate Climate City, Asia. Stroke 2018, 49, 828–834. [Google Scholar] [CrossRef]
- Fowler, D.R.; Mitchell, C.S.; Brown, A.; Pollock, T.; Bratka, L.A.; Paulson, J.; Noller, A.C.; Mauskapf, R.; Oscanyan, K.; Vaidyanathan, A.; et al. Heat-related deaths after an extreme heat event–Four states, 2012, and United States, 1999–2009. MMWR Morb. Mortal. Wkly. Rep. 2012, 62, 433–436. [Google Scholar]
- Chen, R.; Yin, P.; Wang, L.; Liu, C.; Niu, Y.; Wang, W.; Jiang, Y.; Liu, Y.; Liu, J.; Qi, J.; et al. Association between ambient temperature and mortality risk and burden: Time series study in 272 main Chinese cities. BMJ 2018, 363, k4306. [Google Scholar] [CrossRef] [Green Version]
- The Eurowinter Group. Cold exposure and winter mortality from ischaemic heart disease, cerebrovascular disease, respiratory disease, and all causes in warm and cold regions of Europe. Lancet 1997, 349, 1341–1346. [Google Scholar] [CrossRef]
- Gasparrini, A.; Guo, Y.; Hashizume, M.; Lavigne, E.; Zanobetti, A.; Schwartz, J.; Tobias, A.; Tong, S.; Rocklöv, J.; Forsberg, B.; et al. Mortality risk attributable to high and low ambient temperature: A multicountry observational study. Lancet 2015, 386, 369–375. [Google Scholar] [CrossRef]
- Sera, F.; Hashizume, M.; Honda, Y.; Lavigne, E.; Schwartz, J.; Zanobetti, A.; Tobias, A.; Iñiguez, C.; Vicedo-Cabrera, A.M.; Blangiardo, M.; et al. Air Conditioning and Heat-related Mortality. Epidemiology 2020, 31, 779–787. [Google Scholar] [CrossRef]
- Anderson, B.G.; Bell, M.L. Weather-Related Mortality. Epidemiology 2009, 20, 205–213. [Google Scholar] [CrossRef] [Green Version]
- Aklilu, D.; Wang, T.; Amsalu, E.; Feng, W.; Li, Z.; Li, X.; Tao, L.; Luo, Y.; Guo, M.; Liu, X.; et al. Short-term effects of extreme temperatures on cause specific cardiovascular admissions in Beijing, China. Environ. Res. 2020, 186, 109455. [Google Scholar] [CrossRef]
- Huang, C.; Barnett, A.G.; Wang, X.; Tong, S. Effects of Extreme Temperatures on Years of Life Lost for Cardiovascular Deaths: A Time Series Study in Brisbane, Australia. Circ. Cardiovasc. Qual. Outcomes 2012, 5, 609–614. [Google Scholar] [CrossRef] [Green Version]
- Dong, W.; Zeng, Q.; Ma, Y.; Li, G.; Pan, X. Impact of Heat Wave Definitions on the Added Effect of Heat Waves on Cardiovascular Mortality in Beijing, China. Int. J. Environ. Res. Public Health 2016, 13, 933. [Google Scholar] [CrossRef] [Green Version]
- Dang, T.N.; Honda, Y.; Van Do, D.; Pham, A.L.T.; Chu, C.; Huang, C.; Phung, D.; Van, D.D. Effects of Extreme Temperatures on Mortality and Hospitalization in Ho Chi Minh City, Vietnam. Int. J. Environ. Res. Public Health 2019, 16, 432. [Google Scholar] [CrossRef] [Green Version]
- Palazzo, C.; Yokota, R.T.C.; Ferguson, J.; Tafforeau, J.; Ravaud, J.-F.; Van Oyen, H.; Nusselder, W.J. Methods to assess the contribution of diseases to disability using cross-sectional studies: Comparison of different versions of the attributable fraction and the attribution method. Int. J. Epidemiol. 2018, 48, 559–570. [Google Scholar] [CrossRef]
- Yang, J.; Yin, P.; Zhou, M.; Ou, C.Q.; Guo, Y.; Gasparrini, A.; Liu, Y.; Yue, Y.; Gu, S.; Sang, S.; et al. Cardiovascular mortality risk attributable to ambient temperature in China. Heart 2015, 101, 1966–1972. [Google Scholar] [CrossRef]
- Zhang, B.; Li, G.; Ma, Y.; Pan, X. Projection of temperature-related mortality due to cardiovascular disease in beijing under different climate change, population, and adaptation scenarios. Environ. Res. 2018, 162, 152–159. [Google Scholar] [CrossRef]
- Zanobetti, A.; O’Neill, M.S.; Gronlund, C.J.; Schwartz, J.D. Susceptibility to mortality in weather extremes: Effect modification by personal and small-area characteristics. Epidemiology 2013, 24, 809–819. [Google Scholar] [CrossRef] [Green Version]
- Kovats, S.; Hajat, S. Heat stress and public health: A critical review. Annu. Rev. Public Health 2008, 29, 41–55. [Google Scholar] [CrossRef]
- Wong, H.T.; Wang, J.; Yin, Q.; Chen, S.; Lai, P.C. The potential benefits of location-specific biometeorological indexes. Int. J. Biometeorol. 2017, 61, 1695–1698. [Google Scholar] [CrossRef] [Green Version]
- Ho, H.C.; Knudby, A.; Xu, Y.; Hodul, M.; Aminipouri, M. A comparison of urban heat islands mapped using skin temperature, air temperature, and apparent temperature (Humidex), for the greater Vancouver area. Sci. Total Environ. 2016, 544, 929–938. [Google Scholar] [CrossRef]
- Chung, Y.; Noh, H.; Honda, Y.; Hashizume, M.; Bell, M.L.; Guo, Y.-L.L.; Kim, H. Temporal Changes in Mortality Related to Extreme Temperatures for 15 Cities in Northeast Asia: Adaptation to Heat and Maladaptation to Cold. Am. J. Epidemiol. 2017, 185, 907–913. [Google Scholar] [CrossRef]
- Chung, J.-Y.; Honda, Y.; Hong, Y.-C.; Pan, X.-C.; Guo, Y.-L.; Kim, H. Ambient temperature and mortality: An international study in four capital cities of East Asia. Sci. Total Environ. 2009, 408, 390–396. [Google Scholar] [CrossRef]
- Peng, R.D.; Bobb, J.F.; Tebaldi, C.; McDaniel, L.; Bell, M.L.; Dominici, F. Toward a Quantitative Estimate of Future Heat Wave Mortality under Global Climate Change. Environ. Health Perspect. 2011, 119, 701–706. [Google Scholar] [CrossRef] [Green Version]
- Gasparrini, A.; Armstrong, B.; Kenward, M.G. Multivariate meta-analysis for non-linear and other multi-parameter associations. Stat. Med. 2012, 31, 3821–3839. [Google Scholar] [CrossRef] [Green Version]
- Basagaña, X.; Sartini, C.; Barrera-Gómez, J.; Dadvand, P.; Cunillera, J.; Ostro, B.; Sunyer, J.; Medina-Ramón, M. Heat Waves and Cause-specific Mortality at all Ages. Epidemiology 2011, 22, 765–772. [Google Scholar] [CrossRef]
- Basu, R.; Ostro, B.D. A Multicounty Analysis Identifying the Populations Vulnerable to Mortality Associated with High Ambient Temperature in California. Am. J. Epidemiol. 2008, 168, 632–637. [Google Scholar] [CrossRef]
- Huang, Z.; Lin, H.; Liu, Y.; Zhou, M.; Liu, T.; Xiao, J.; Zeng, W.; Li, X.; Zhang, Y.; Ebi, K.L.; et al. Individual-level and community-level effect modifiers of the temperature–mortality relationship in 66 Chinese communities. BMJ Open 2015, 5, e009172. [Google Scholar] [CrossRef] [Green Version]
- Zeng, Q.; Li, G.; Cui, Y.; Jiang, G.; Pan, X. Estimating Temperature-Mortality Exposure-Response Relationships and Optimum Ambient Temperature at the Multi-City Level of China. Int. J. Environ. Res. Public Health 2016, 13, 279. [Google Scholar] [CrossRef] [Green Version]
- Clark, J.S.; Melillo, J.; Mohan, J.; Salk, C. The seasonal timing of warming that controls onset of the growing season. Glob. Chang. Biol. 2013, 20, 1136–1145. [Google Scholar] [CrossRef] [PubMed]
- Wang, B.; Chai, G.; Sha, Y.; Zha, Q.; Su, Y.; Gao, Y. Impact of ambient temperature on cardiovascular disease hospital admissions in farmers in China’s Western suburbs. Sci. Total. Environ. 2021, 761, 143254. [Google Scholar] [CrossRef] [PubMed]
- Guo, Y.; Punnasiri, K.; Tong, S. Effects of temperature on mortality in Chiang Mai city, Thailand: A time series study. Environ. Health 2012, 11, 1–9. [Google Scholar] [CrossRef] [PubMed] [Green Version]
- He, Y.; Cheng, L.; Bao, J.; Deng, S.; Liao, W.; Wang, Q.; Tawatsupa, B.; Hajat, S.; Huang, C. Geographical disparities in the impacts of heat on diabetes mortality and the protective role of greenness in Thailand: A nationwide case-crossover analysis. Sci. Total. Environ. 2020, 711, 135098. [Google Scholar] [CrossRef]
- Phosri, A.; Sihabut, T.; Jaikanlaya, C. Short-term effects of diurnal temperature range on hospital admission in Bangkok, Thailand. Sci. Total. Environ. 2020, 717, 137202. [Google Scholar] [CrossRef]
- Tawatsupa, B.; Yiengprugsawan, V.; Kjellstrom, T.; Seubsman, S.-A.; Sleigh, A.; The Thai Cohort Study Team. Heat stress, health and well-being: Findings from a large national cohort of Thai adults. BMJ Open 2012, 2, e001396. [Google Scholar] [CrossRef] [Green Version]
- Ballester, J.; Robine, J.-M.; Herrmann, F.R.; Rodó, X. Long-term projections and acclimatization scenarios of temperature-related mortality in Europe. Nat. Commun. 2011, 2, 358. [Google Scholar] [CrossRef] [Green Version]
- Li, T.; Horton, R.M.; Kinney, P.L. Projections of seasonal patterns in temperature-related deaths for Manhattan, New York. Nat. Clim. Chang. 2013, 3, 717–721. [Google Scholar] [CrossRef] [Green Version]
- Vicedo-Cabrera, A.M.; Sera, F.; Guo, Y.; Chung, Y.; Arbuthnott, K.; Tong, S.; Tobias, A.; Lavigne, E.; Coelho, M.D.S.Z.S.; Saldiva, P.H.N.; et al. A multi-country analysis on potential adaptive mechanisms to cold and heat in a changing climate. Environ. Int. 2018, 111, 239–246. [Google Scholar] [CrossRef]
- Davis, R.E.; Knappenberger, P.C.; Michaels, P.J.; Novicoff, W.M. Changing heat-related mortality in the United States. Environ. Health Perspect. 2003, 111, 1712–1718. [Google Scholar] [CrossRef]
- Ren, C.; O’Neill, M.S.; Park, S.K.; Sparrow, D.; Vokonas, P.; Schwartz, J. Ambient Temperature, Air Pollution, and Heart Rate Variability in an Aging Population. Am. J. Epidemiol. 2011, 173, 1013–1021. [Google Scholar] [CrossRef] [Green Version]
- Eccles, R. An Explanation for the Seasonality of Acute Upper Respiratory Tract Viral Infections. Acta Oto-Laryngol. 2002, 122, 183–191. [Google Scholar] [CrossRef]
- Ma, C.; Yang, J.; Nakayama, S.F.; Honda, Y. The association between temperature variability and cause-specific mortality: Evidence from 47 Japanese prefectures during 1972–2015. Environ. Int. 2019, 127, 125–133. [Google Scholar] [CrossRef]
- Cheng, J.; Zhu, R.; Xu, Z.; Xu, X.; Wang, X.; Li, K.; Su, H. Temperature variation between neighboring days and mortality: A distributed lag non-linear analysis. Int. J. Public Health 2014, 59, 923–931. [Google Scholar] [CrossRef]
- Lim, Y.H.; Reid, C.E.; Mann, J.K.; Jerrett, M.; Kim, H. Diurnal temperature range and short-term mortality in large US communities. Int. J. Biometeorol. 2015, 59, 1311–1319. [Google Scholar] [CrossRef]
- Liang, W.-M.; Liu, W.-P.; Kuo, H.-W. Diurnal temperature range and emergency room admissions for chronic obstructive pulmonary disease in Taiwan. Int. J. Biometeorol. 2008, 53, 17–23. [Google Scholar] [CrossRef]
- Vicedo-Cabrera, A.M.; Forsberg, B.; Tobías, A.; Zanobetti, A.; Schwartz, J.; Armstrong, B.; Gasparrini, A. Associations of Inter- and Intraday Temperature Change with Mortality. Am. J. Epidemiol. 2016, 183, 286–293. [Google Scholar] [CrossRef] [Green Version]
- Murtas, R.; Russo, A.G. Effects of pollution, low temperature and influenza syndrome on the excess mortality risk in winter 2016–2017. BMC Public Health 2019, 19, 1445. [Google Scholar] [CrossRef]
- Buckley, J.P.; Samet, J.M.; Richardson, D.B. Commentary. Epidemiology 2014, 25, 242–245. [Google Scholar] [CrossRef]
- Armstrong, B.; Bell, M.L.; Coelho, M.D.S.Z.S.; Guo, Y.-L.L.; Guo, Y.; Goodman, P.; Hashizume, M.; Honda, Y.; Kim, H.; Lavigne, E.; et al. Longer-Term Impact of High and Low Temperature on Mortality: An International Study to Clarify Length of Mortality Displacement. Environ. Health Perspect. 2017, 125, 107009. [Google Scholar] [CrossRef] [Green Version]
- Buzan, J.R.; Oleson, K.W.; Huber, M.L. Implementation and comparison of a suite of heat stress metrics within the Community Land Model version 4.5. Geosci. Model Dev. 2015, 8, 151–170. [Google Scholar] [CrossRef] [Green Version]
- Santurtún, A.; Almendra, R.; Silva, G.L.; Fdez-Arroyabe, P.; Santurtún, M.; Santana, P. Suicide and Apparent Temperature in the Two Capitals Cities in the Iberian Peninsula. Soc. Sci. Med. 2020, 265, 113411. [Google Scholar] [CrossRef] [PubMed]
- Zhang, K.; Li, Y.; Schwartz, J.D.; O’neill, M.S. What weather variables are important in predicting heat-related mortality? A new application of statistical learning methods. Environ. Res. 2014, 132, 350–359. [Google Scholar] [CrossRef] [PubMed] [Green Version]


| Country | City | Study Period | Death Counts | Apparent Temperature (°C) (Range) | Relative Humidity (%) (Range) |
|---|---|---|---|---|---|
| Thailand | Chiang Mai | 2013–2016 | 34,195 | 31.0 (10.3–39.7) | 69.4 (38.9–95.5) |
| Thailand | Bangkok | 2013–2016 | 183,275 | 35.2 (18.2–42.3) | 74.2 (46.0–97.0) |
| Thailand | - * | 2013–2016 | 217,470 | 33.1 (10.3–42.3) | 71.8 (38.9–97.0) |
| Korea | Seoul | 2000–2010 | 375,082 | 12.6 (−10.4–35.7) | 61.8 (19.4–96.5) |
| Korea | Busan | 2000–2010 | 183,275 | 14.9 (−4.8–38.4) | 62.7 (16.2–99.0) |
| Korea | Daegu | 2000–2010 | 111,032 | 14.3 (−5.4–37.3) | 57.5 (16.9–95.9) |
| Korea | Incheon | 2000–2010 | 106,282 | 12.5 (−10.8–36.1) | 67.3 (26.0–98.4) |
| Korea | Gwangju | 2000–2010 | 57,216 | 13.9 (−8.7–36.9) | 66.6 (19.6–98.1) |
| Korea | Daejeon | 2000–2010 | 56,098 | 12.8 (−10.4–35.2) | 65.7 (24.2–97.6) |
| Korea | - | 2000–2010 | 888,985 | 13.5 (−10.8–38.4) | 63.6 (16.2–99.0) |
| China | Tianjin | 2008–2011 | 245,847 | 17.0 (−9.9–39.0) | 72.1 (15.0–97.0) |
| China | Ningbo | 2008–2011 | 128,295 | 19.2 (−2.8–42.1) | 72.2 (19.0–95.0) |
| China | - | 2008–2011 | 374,142 | 15.7 (−9.9–42.1) | 64.4 (15.0–97.0) |
| Total | 1,416,091 | 15.6 (−10.8–42.3) | 64.5 (15.0–99.0) | ||
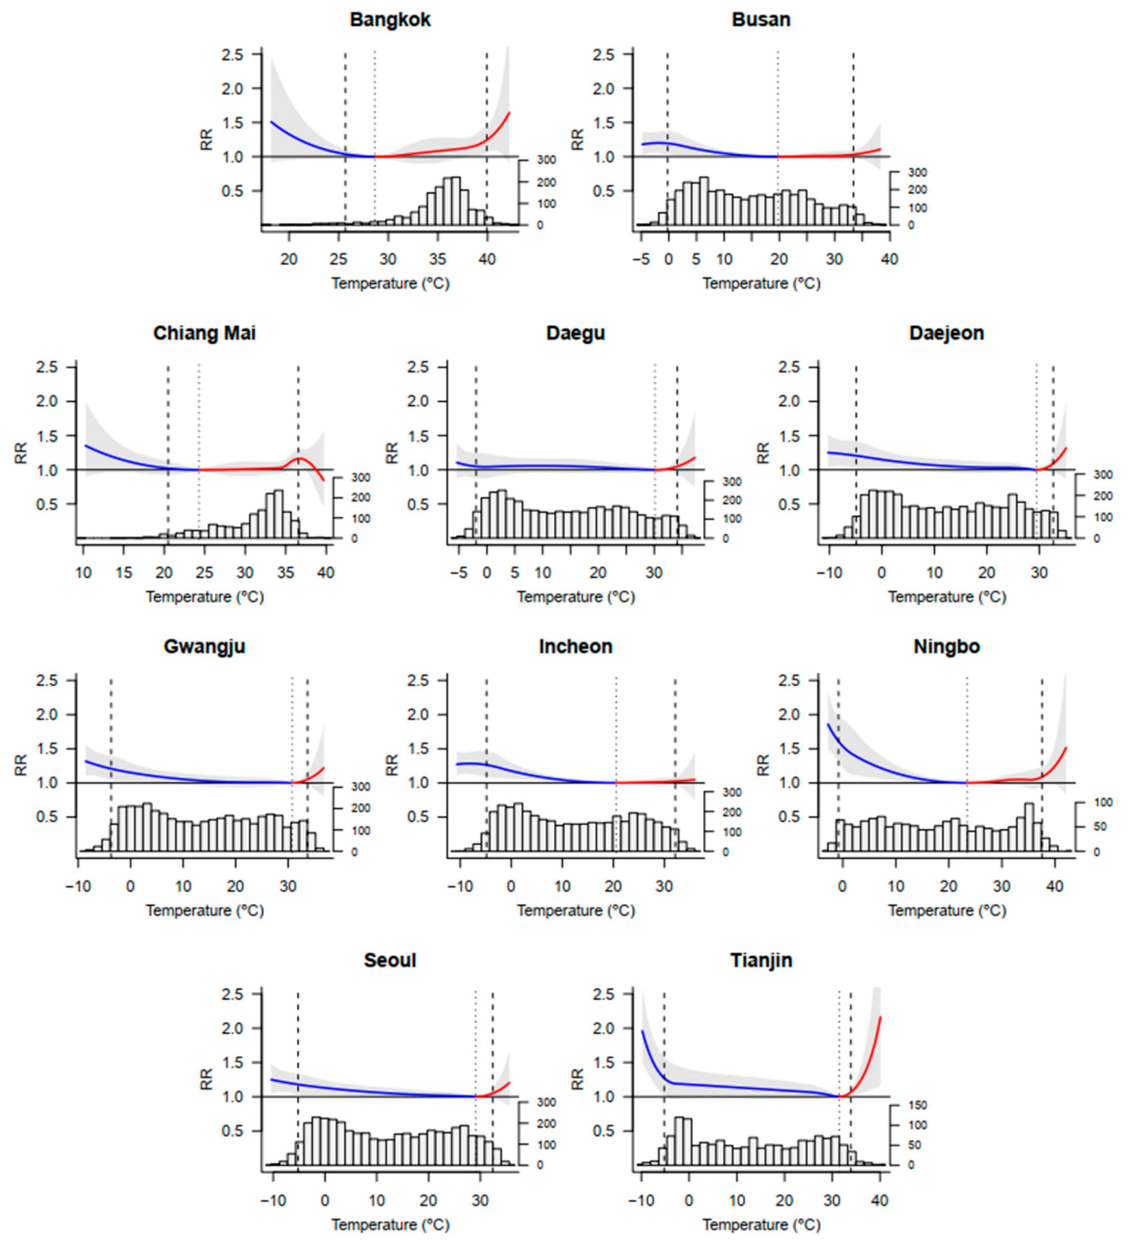
| Country | City | Minimum Mortality Percentile | Minimum Mortality Temperature (°C) | Total (%) (95% CI) | Cold (%) (95% CI) | Heat (%) (95% CI) |
|---|---|---|---|---|---|---|
| Thailand | Chiang Mai | 10 | 24.32 | 2.84 (−3.89, 8.83) | 0.17 (−0.40, 0.71) | 2.67 (−4.51, 9.09) |
| Thailand | Bangkok | 5 | 28.66 | 8.91 (−3.82, 19.78) | 0.31 (−0.06, 0.67) | 8.61 (−3.74, 19.45) |
| Korea | Seoul | 91 | 29.12 | 6.46 (0.80, 11.11) | 6.18 (0.98, 11.19) | 0.28 (−0.15, 0.68) |
| Korea | Busan | 65 | 19.71 | 5.13 (0.55, 8.79) | 4.74 (1.12, 8.34) | 0.39 (−0.70, 1.44) |
| Korea | Daegu | 90 | 30.17 | 3.96 (−3.56, 10.42) | 3.68 (−4.15, 10.67) | 0.28 (−0.33, 0.81) |
| Korea | Incheon | 66 | 20.56 | 6.77 (2.91, 10.16) | 6.48 (2.60, 9.74) | 0.29 (−0.62, 1.34) |
| Korea | Gwangju | 91 | 30.74 | 6.05 (0.15, 11.66) | 5.75 (−0.85, 11.10) | 0.30 (−0.21, 0.78) |
| Korea | Daejeon | 91 | 29.45 | 7.62 (0.67, 13.92) | 7.15 (0.01,13.03) | 0.46 (−0.21, 1.03) |
| China | Tianjin | 93 | 31.46 | 11.54 (1.12, 20.38) | 11.08 (0.37, 19.60) | 0.46 (0.13, 0.72) |
| China | Ningbo | 63 | 23.48 | 11.78 (4.62, 18.12) | 10.48 (4.28, 15.68) | 1.30 (−0.92, 3.35) |
| Asia | 79.5 | - | 7.62 (4.95, 9.83) | 6.44 (3.97, 8.63) | 1.18 (0.14, 2.15) | |
| Model | Predictor | Test for Predictor | Q Test | I2 Statistic |
|---|---|---|---|---|
| random-effects meta-regression | Average temperature | 0.0316 | 0.0162 | 36.6% |
| Temperature variation | 0.0348 |
Publisher’s Note: MDPI stays neutral with regard to jurisdictional claims in published maps and institutional affiliations. |
© 2021 by the authors. Licensee MDPI, Basel, Switzerland. This article is an open access article distributed under the terms and conditions of the Creative Commons Attribution (CC BY) license (https://creativecommons.org/licenses/by/4.0/).
Share and Cite
Cao, R.; Wang, Y.; Huang, J.; He, J.; Ponsawansong, P.; Jin, J.; Xu, Z.; Yang, T.; Pan, X.; Prapamontol, T.; et al. The Mortality Effect of Apparent Temperature: A Multi-City Study in Asia. Int. J. Environ. Res. Public Health 2021, 18, 4675. https://doi.org/10.3390/ijerph18094675
Cao R, Wang Y, Huang J, He J, Ponsawansong P, Jin J, Xu Z, Yang T, Pan X, Prapamontol T, et al. The Mortality Effect of Apparent Temperature: A Multi-City Study in Asia. International Journal of Environmental Research and Public Health. 2021; 18(9):4675. https://doi.org/10.3390/ijerph18094675
Chicago/Turabian StyleCao, Ru, Yuxin Wang, Jing Huang, Jie He, Pitakchon Ponsawansong, Jianbo Jin, Zhihu Xu, Teng Yang, Xiaochuan Pan, Tippawan Prapamontol, and et al. 2021. "The Mortality Effect of Apparent Temperature: A Multi-City Study in Asia" International Journal of Environmental Research and Public Health 18, no. 9: 4675. https://doi.org/10.3390/ijerph18094675