
Serum Concentration of Fluoride in Patients with Alcoholic Liver Cirrhosis from the Lublin Region in Eastern Poland

 ,
,  , ,
, ,
Abstract
:1. Introduction
2. Experimental Section
2.1. Patients
2.2. Instrumentation and Reagents
2.3. Statistical Analysis
3. Results
4. Discussion
Author Contributions
Funding
Institutional Review Board Statement
Informed Consent Statement
Data Availability Statement
Conflicts of Interest
References
- Adiamah, A.; Ban, L.; Hammond, J.; Jepsen, P.; West, J.; Humes, D.J. Mortality after extrahepatic gastrointestinal and abdominal wall surgery in patients with alcoholic liver disease: A systematic review and meta-analysis. Alcohol Alcohol. 2020, 55, 497–511. [Google Scholar] [CrossRef] [PubMed]
- Zatonski, W.A.; Sulkowska, U.; Manczuk, M.; Rehm, J.; Boffetta, P.; Lowenfels, A.B.; La Vecchia, C. Liver cirrhosis mortality in Europe, with special attention to Central and Eastern Europe. Eur. Addict Res. 2010, 16, 193–201. [Google Scholar] [CrossRef] [PubMed]
- Whitford, G.M.; Pashley, D.H.; Reynolds, K.E. Fluoride tissue distribution: Short-term kinetics. Am. J. Physiol. 1979, 236, F141–F148. [Google Scholar] [CrossRef] [PubMed]
- Prystupa, A.; Szpetnar, M.; Boguszewska-Czubara, A.; Grzybowski, A.; Sak, J.; Załuska, W. Activity of MMP1 and MMP13 and amino acid metabolism in patients with alcoholic liver cirrhosis. Med. Sci. Monit. 2015, 21, 1008–1014. [Google Scholar]
- Prystupa, A.; Błażewicz, A.; Kiciński, P.; Sak, J.J.; Niedziałek, J.; Załuska, W. Serum concentrations of selected heavy metals in patients with alcoholic liver cirrhosis from the Lublin region in Eastern Poland. Int. J. Environ. Res. Public Health 2016, 13, 582. [Google Scholar] [CrossRef]
- European Association for the Study of Liver. EASL clinical practical guidelines: Management of alcoholic liver disease. J. Hepatol. 2012, 57, 399–420. [Google Scholar] [CrossRef]
- Zuo, H.; Chen, L.; Kong, M.; Qiu, L.; Lü, P.; Wu, P.; Yang, Y.; Chen, K. Toxic effects of fluoride on organisms. Life Sci. 2018, 198, 18–24. [Google Scholar] [CrossRef]
- Błaszczyk, I.; Birkner, E.; Gutowska, I.; Romuk, E.; Chlubek, D. Influence of methionine and vitamin E on fluoride concentration in bones and teeth of rats exposed to sodium fluoride in drinking water. Biol. Trace Elem. Res. 2012, 146, 335–339. [Google Scholar] [CrossRef]
- Niu, Q.; He, P.; Xu, S.; Ma, R.; Ding, Y.; Mu, L.; Li, S. Fluoride-induced iron overload contributes to hepatic oxidative damage in mouse and the protective role of grape seed proanthocyanidin extract. J. Toxicol. Sci. 2018, 43, 311–319. [Google Scholar] [CrossRef] [Green Version]
- Liang, C.; Gao, Y.; Zhao, Y.; Manthari, R.K.; Ma, J.; Niu, R.; Wang, J.; Zhang, J.; Wang, J. Effects of fluoride and/or sulfur dioxide on morphology and DNA integrity in rats’ hepatic tissue. Biol. Trace Elem. Res. 2018, 183, 335–341. [Google Scholar] [CrossRef]
- Lu, Y.; Luo, Q.; Cui, H.; Deng, H.; Kuang, P.; Liu, H.; Fang, J.; Zuo, Z.; Deng, J.; Li, Y.; et al. Sodium fluoride causes oxidative stress and apoptosis in the mouse liver. Aging 2017, 9, 1623–1639. [Google Scholar] [CrossRef] [Green Version]
- Zhao, Y.; Li, Y.; Wang, J.; Manthari, R.K.; Wang, J. Fluoride induces apoptosis and autophagy through the IL-17 signaling pathway in mice hepatocytes. Arch. Toxicol. 2018, 92, 3277–3289. [Google Scholar] [CrossRef]
- Girardi, P.; Merler, E. A mortality study on male subjects exposed to polyfluoroalkyl acids with high internal dose of perfluorooctanoic acid. Environ. Res. 2019, 179, 108743. [Google Scholar] [CrossRef]
- Municipal Water and Sewerage Company in Lublin [Miejskie Przedsiębiorstwo Wodociągów i Kanalizacji w Lublinie Sp. z o.o. (MPWiK)]. 2020. Available online: http://www.mpwik.lublin.pl/index.php?option=site&id=5&sid=24 (accessed on 15 October 2020).
- Stockbridge, R.B.; Lim, H.H.; Otten, R.; Williams, C.; Shane, T.; Weinberg, Z.; Miller, C. Fluoride resistance and transport by ribiswitch-controlled CLC antiporters. Proc. Natl. Acad. Sci. USA 2012, 109, 15289–15294. [Google Scholar] [CrossRef] [Green Version]
- Zohoori, F.V.; Innerd, A.; Azevedo, L.B.; Whitford, G.M.; Maguire, A. Effect of exercise on fluoride metabolism in adult humans: A pilot study. Sci. Rep. 2015, 5, 16905. [Google Scholar] [CrossRef] [Green Version]
- Li, L. The biochemistry and physiology of metallic fluoride: Action, mechanism and implications. Crit. Rev. Oral. Biol. Med. 2003, 14, 100–114. [Google Scholar] [CrossRef] [Green Version]
- Gazzano, E.; Bergandi, L.; Riganti, C.; Aldieri, E.; Doublier, S.; Costamagna, C.; Bosia, A.; Ghigo, D. Fluoride effects: The two faces of janus. Curr. Med. Chem. 2010, 17, 2431–2441. [Google Scholar] [CrossRef]
- Buzalaf, M.A.R.; Whitford, G.M. Fluoride metabolism. Monogr. Oral. Sci. 2011, 22, 20–36. [Google Scholar]
- Buzalaf, C.P.; de L. Leite, A.; Buzalaf, M.A.R. Fluoride Metabolism. In Fluorine: Chemistry, Analysis, Function and Effects; Preedy, V.R., Ed.; The Royal Society of Chemistry: Cambridge, UK, 2015. [Google Scholar]
- Sharma, R.; Tsuchiya, M.; Skobe, Z.; Tannous, B.A.; Bartlett, J.D. The acid test of fluoride: How pH modulates toxicity. PLoS ONE 2010, 5, e10895. [Google Scholar] [CrossRef] [Green Version]
- Yoo, J.J.; Kim, S.G.; Kim, Y.S.; Lee, B.; Lee, M.H.; Jeong, S.W.; Jang, J.Y.; Lee, S.H.; Kim, H.S.; Kim, Y.D.; et al. Estimation of renal function in patients with liver cirrhosis: Impact of muscle mass and sex. J. Hepatol. 2019, 70, 847–854. [Google Scholar] [CrossRef]
- Kupnicka, P.; Listos, J.; Tarnowski, M.; Kolasa-Wołosiuk, A.; Wąsik, A.; Łukomska, A.; Barczak, K.; Gutowska, I.; Chlubek, D.; Baranowska-Bosiacka, I. Fluoride affects dopamine metabolism and causes changes in the expression of dopamine receptors (D1R and D2R) in chosen brain structures of morphine-dependent rats. Int. J. Mol. Sci. 2020, 21, 2361. [Google Scholar] [CrossRef] [Green Version]
- Saeed, M.; Malik, R.N.; Kamal, A. Fluorosis and cognitive development among children (6–14 years of age) in the endemic areas of the world: A review and critical analysis. Environ. Sci. Pollut. Res. 2020, 27, 2566–2579. [Google Scholar] [CrossRef]
- Riddell, J.K.; Malin, A.J.; Flora, D.; McCague, H.; Till, C. Association of water fluoride and urinary fluoride concentrations with attention deficit hyperactivity disorder in Canadian youth. Environ. Int. 2019, 133, 105190. [Google Scholar] [CrossRef]
- Zhang, S.; Jiang, C.; Liu, H.; Guan, Z.; Zeng, Q.; Zhang, C.; Lei, R.; Xia, T.; Gao, H.; Yang, L.; et al. Fluoride-elicited developmental testicular toxicity in rats: Roles of endoplasmic reticulum stress and inflammatory response. Toxicol. Appl. Pharmacol. 2013, 271, 206–215. [Google Scholar] [CrossRef]
- Ma, Q.; Huang, H.; Sun, L.; Zhou, T.; Zhu, J.; Cheng, X.; Duan, L.; Li, Z.; Cui, L.; Ba, Y. Gene-environment interaction: Does fluoride influence the reproductive hormones in male farmers modified by ERα gene polymorphisms? Chemosphere 2017, 188, 525–531. [Google Scholar] [CrossRef]
- Pramanik, S.; Saha, D. The genetic influence in fluorosis. Environ. Toxicol. Pharmacol. 2017, 56, 157–162. [Google Scholar] [CrossRef]
- Sak, J.; Pawlikowski, J.; Goniewicz, M.; Witt, M. Population biobanking in selected European countries and proposed model for a Polish national DNA bank. J. Appl. Genet. 2012, 53, 159–165. [Google Scholar] [CrossRef] [Green Version]
- Witoń, M.; Strapagiel, D.; Gleńska-Olender, J.; Chróścicka, A.; Ferdyn, K.; Skokowski, J.; Kalinowski, L.; Pawlikowski, J.; Marciniak, B.; Pasterk, M.; et al. Organization of BBMRI.pl: The Polish biobanking network. Biopreserv Biobank. 2017, 15, 264–269. [Google Scholar] [CrossRef]
- Taves, D.R. Normal human serum fluoride concentrations. Nature 1966, 211, 192–193. [Google Scholar] [CrossRef]
- Singer, L.; Armstrong, W.D. Regulation of human plasma fluoride concentration. J. App. Physiol. 1960, 15, 508–510. [Google Scholar] [CrossRef] [Green Version]
- Paz, S.; Jaudenes, J.R.; Gutiérrez, A.J.; Rubio, C.; Hardisson, A.; Revert, C. Determination of fluoride in organic and non-organic wines. Biol. Trace Elem. Res. 2017, 178, 153–159. [Google Scholar] [CrossRef] [PubMed]
- Martínez, O.B.; Díaz, C.; Borges, T.M.; Díaz, E.; Pérez, J.P. Concentrations of fluoride in wines from the Canary Islands. Food Addit. Contam. 1998, 15, 893–897. [Google Scholar] [CrossRef] [PubMed]
- Styburski, D.; Baranowska-Bosiacka, I.; Goschorska, M.; Chlubek, D.; Gutowska, I. Beer as a rich source of fluoride delivered into the body. Biol. Trace Elem. Res. 2017, 177, 404–408. [Google Scholar] [CrossRef] [PubMed] [Green Version]
- Goschorska, M.; Gutowska, I.; Baranowska-Bosiacka, I.; Rać, M.E.; Chlubek, D. Fluoride content in alcoholic drinks. Biol. Trace Elem. Res. 2016, 171, 468–471. [Google Scholar] [CrossRef] [Green Version]
- Shanthakumari, D.; Srinivasalu, S.; Subramanian, S. Effects of fluoride intoxication on lipidperoxidation and antioxidant status in experimental rats. Toxicology 2004, 204, 219–228. [Google Scholar] [CrossRef]


| Characteristics | Control Group | Alcoholic Liver Cirrhosis | ||
|---|---|---|---|---|
| Pugh-Chile (P-Ch) A | P-Ch B | P-Ch C | ||
| Age (years) | 44.6 ± 15.9 * | 55.2 ± 12.6 * | 54.4 ± 11.5 * | 58.5 ± 7.6 * |
| Male (%) | 64.3% | 75% | 67.5% | 61.5% |
| Body mass (kg) | 68.1 ± 9.8 | 68.4 ± 14.6 | 69.7 ± 11.9 | 70.8 ± 12.5 |
| Time of alcohol abuse (years) | N/A | 12.9 ± 4.8 † | 14.6 ± 5.1 | 15.8 ± 5.5 † |
| Complications: | ||||
| Esophageal varices | N/A | 29.6% †,¥ | 65% †,# | 87.2% ¥,# |
| Ascites | N/A | 22.2% †,¥ | 48.7% †,# | 92.1% ¥,# |
| Encephalopathy | N/A | 18.5% †,¥ | 51.3% †,# | 84.6% ¥,# |
| Variables | Control Group | Alcoholic Liver Cirrhosis | ||
|---|---|---|---|---|
| P-Ch A | P-Ch B | P-Ch C | ||
| Total bilirubin (mg/dL) | 0.55 ± 0.28 * | 3.9 ± 8.3 *,† | 3.8 ± 2.9 *,¥ | 8.2 ± 8.8 *,†,¥ |
| Albumin (g/dL) | - | 3.25 ± 0.81 † | 2.9 ± 0.39 | 2.49 ± 0.51 † |
| Total protein (g/dL) | 6.3 ± 0.3 | 6.1 ± 0.9 | 5.9 ± 1 | 5.8 ± 0.9 |
| Blood platelets (g/L) | 235.7 ± 31.5 * | 183.8 ± 77.4 †,¥ | 138.1 ± 76.9 *,† | 142 ± 77.7 *,†,¥ |
| Mean Cell Volume (MCV) (fl) | 84.8 ± 3.8 * | 91.3 ± 7.2 | 91.6 ± 10.9 | 95.8 ± 7.5 * |
| INR | - | 1.26 ± 0.33 †,¥ | 1.45 ± 0.22 † | 1.55 ± 0.34 ¥ |
| ALT (U/L) | 18.1 ± 6.8 * | 92.1 ± 189.8 *,†,¥ | 36.1 ± 25 *,†,¥ | 41.7 ± 29.5 *,†,¥ |
| AST (U/L) | 18.1 ± 7.1 * | 123.1 ± 202.3 *,†,¥ | 82.3 ± 65.9 *,†,¥ | 90.6 ± 62.4 *,†,¥ |
| Urea (mg/dL) | - | 33.3 ± 19.9 †,¥ | 22.6 ± 15.8 †,# | 42.7 ± 35.9 ¥,# |
| Sodium (mmol/L) | 139.8 ± 3.7 | 133.7 ± 5.7 | 135 ± 3.4 | 134.1 ± 5.7 |
| Potassium (mmol/L) | 4.44 ± 0.42 * | 4 ± 0.6 * | 4 ± 0.63 * | 3.9 ± 0.6 * |
| C-reactive protein (mg/L) | 2.17 ± 1.86 * | 14.7 ± 17.2 *,†,¥ | 29.2 ± 51.6 *,† | 25.7 ± 20.1 *,¥ |
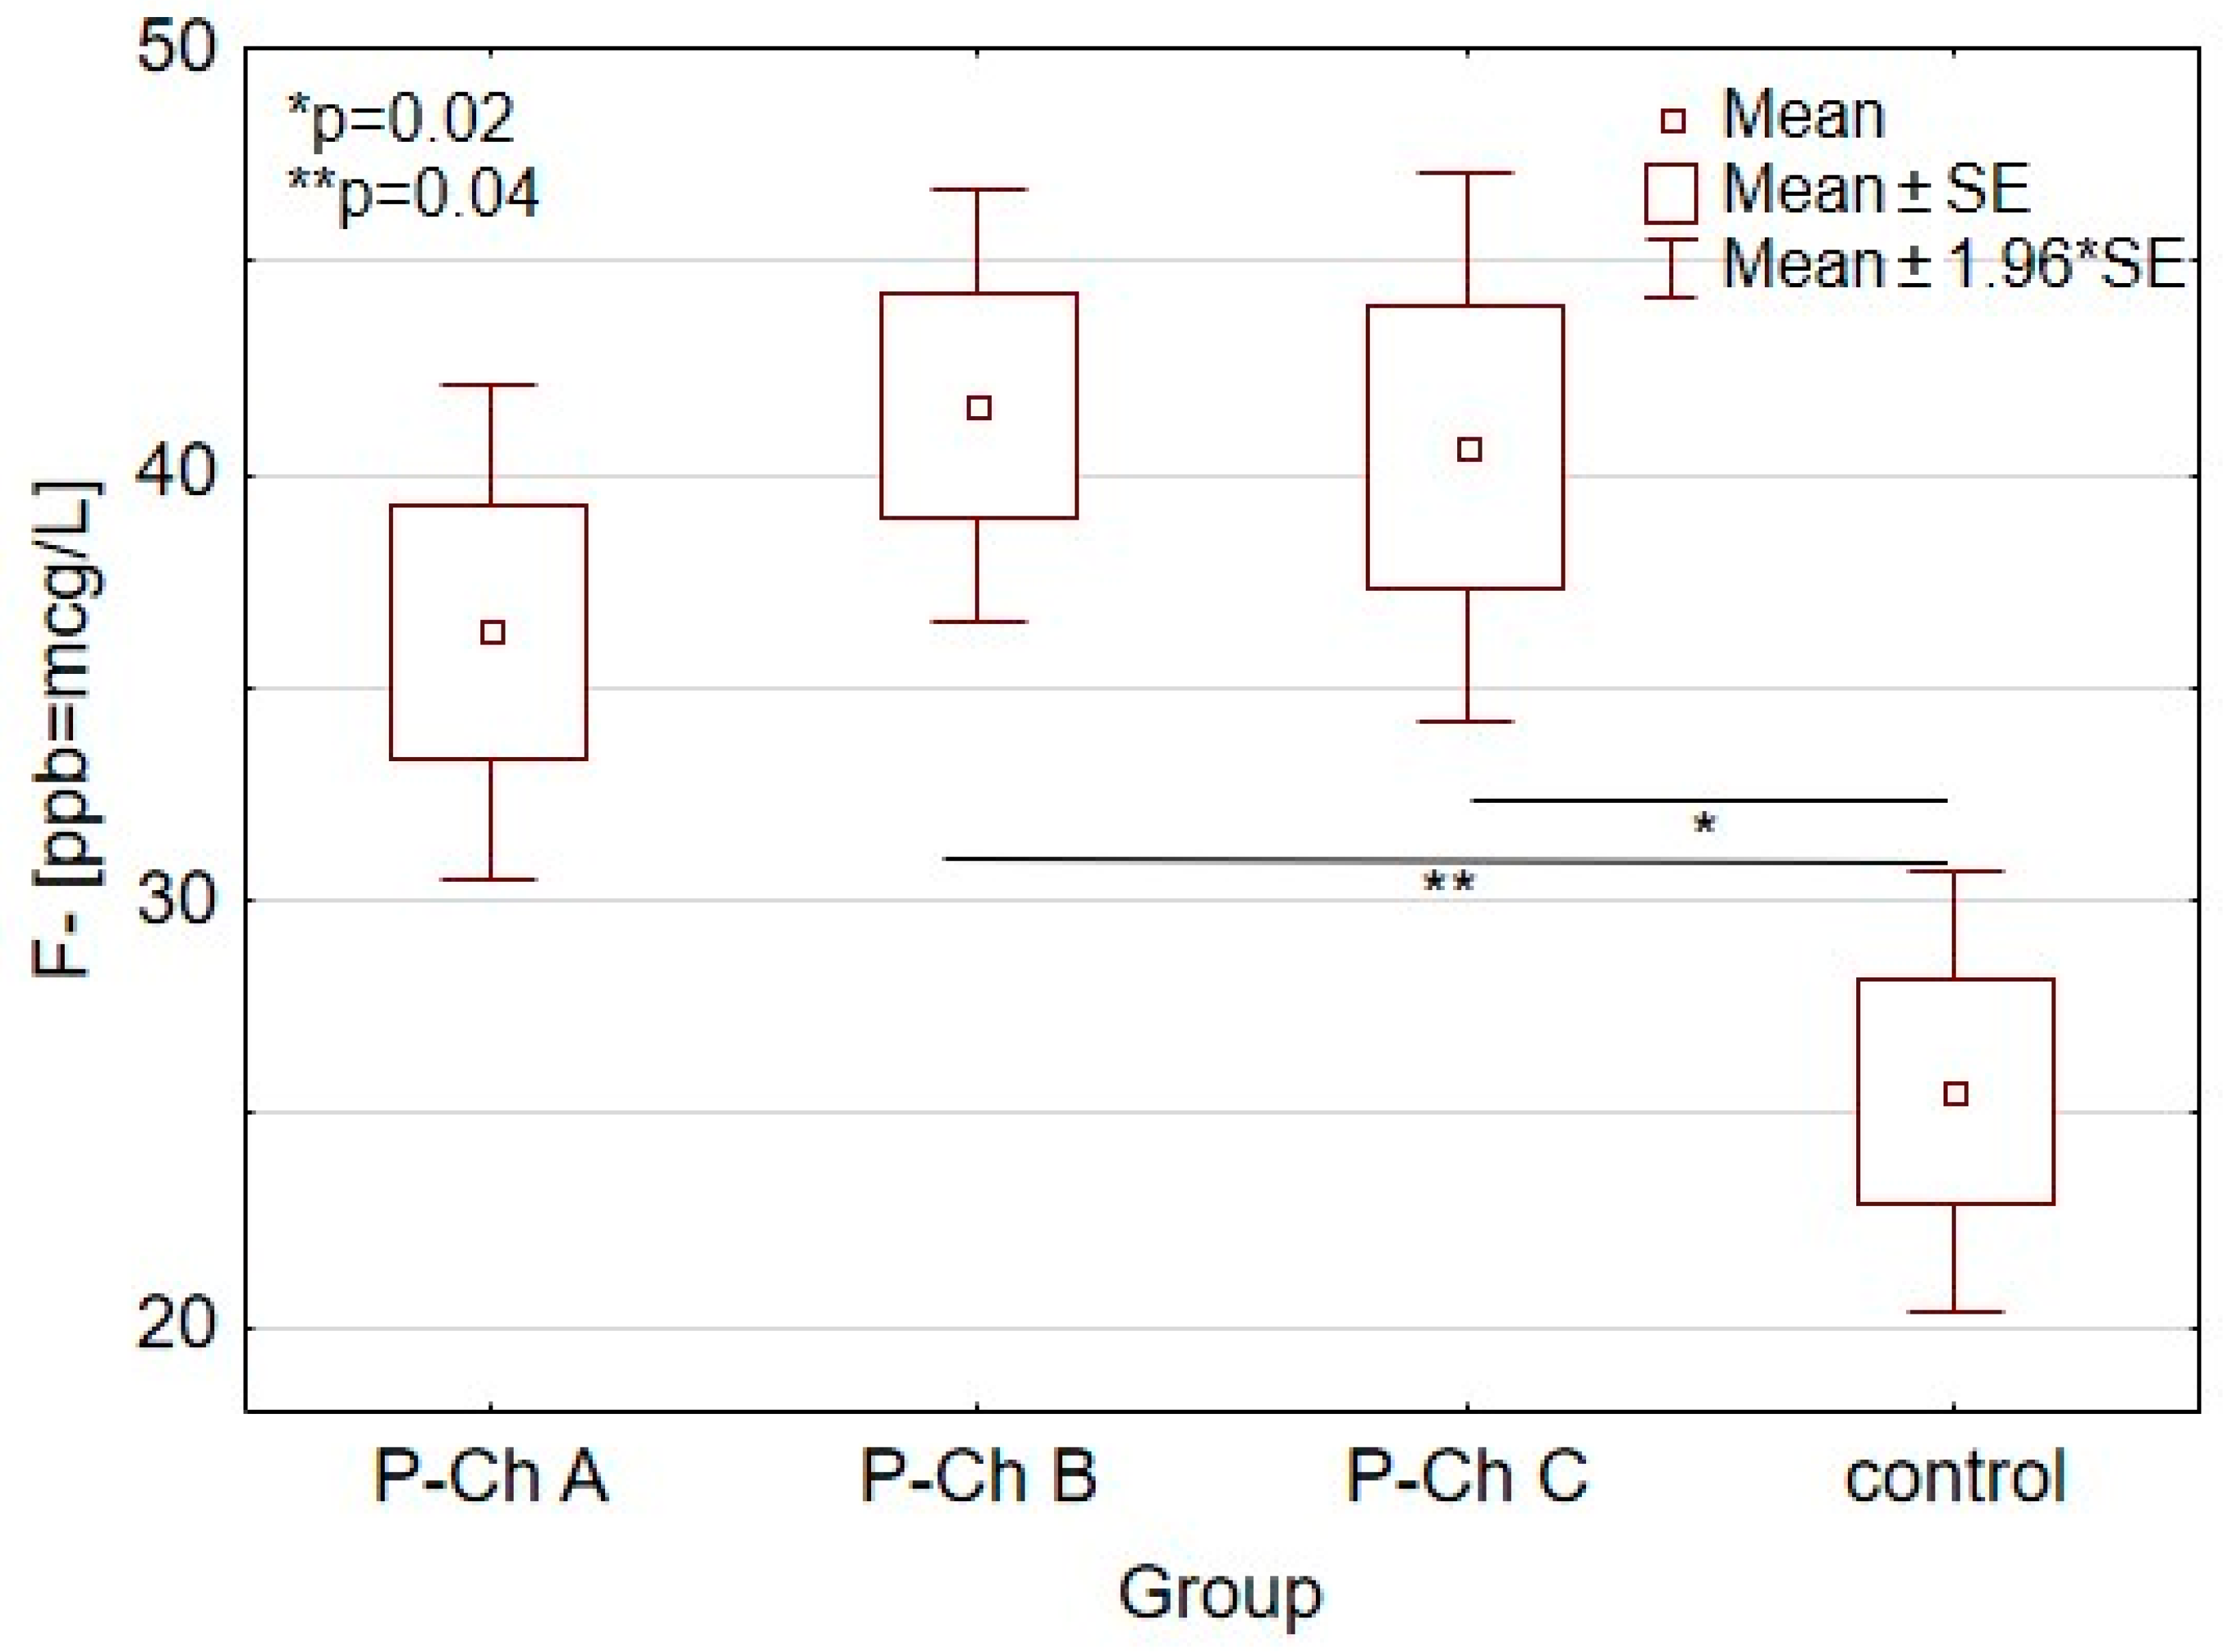
| Control Group (n = 15) | Alcoholic Liver Cirrhosis (n = 72) | p | |||
|---|---|---|---|---|---|
| P-Ch A (n = 21) | P-Ch B (n = 23) | P-Ch C (n = 28) | |||
| (F-[ppb = µg/L) | 25.5 ± 17.7 * | 36.3 ± 10.2 | 41.6 ± 15.6 * | 40.6 ± 20.5 * | 0.01 |
| Variables | Correlation Coefficient p-Value | |
|---|---|---|
| Fluoride [ppb = µg/L] | Total bilirubin (mg/dL) | r = 0.21 |
| p = 0.02 | ||
| Mean cell volume (MCV) | r = 0.25 | |
| p = 0.01 | ||
| Alanine aminotransferase (ALT) | r = 0.19 | |
| p = 0.045 | ||
Publisher’s Note: MDPI stays neutral with regard to jurisdictional claims in published maps and institutional affiliations. |
© 2021 by the authors. Licensee MDPI, Basel, Switzerland. This article is an open access article distributed under the terms and conditions of the Creative Commons Attribution (CC BY) license (http://creativecommons.org/licenses/by/4.0/).
Share and Cite
Prystupa, A.; Sak, J.; Kiciński, P.; Stenzel-Bembenek, A.; Błażewicz, A. Serum Concentration of Fluoride in Patients with Alcoholic Liver Cirrhosis from the Lublin Region in Eastern Poland. Int. J. Environ. Res. Public Health 2021, 18, 1115. https://doi.org/10.3390/ijerph18031115
Prystupa A, Sak J, Kiciński P, Stenzel-Bembenek A, Błażewicz A. Serum Concentration of Fluoride in Patients with Alcoholic Liver Cirrhosis from the Lublin Region in Eastern Poland. International Journal of Environmental Research and Public Health. 2021; 18(3):1115. https://doi.org/10.3390/ijerph18031115
Chicago/Turabian StylePrystupa, Andrzej, Jarosław Sak, Paweł Kiciński, Agnieszka Stenzel-Bembenek, and Anna Błażewicz. 2021. "Serum Concentration of Fluoride in Patients with Alcoholic Liver Cirrhosis from the Lublin Region in Eastern Poland" International Journal of Environmental Research and Public Health 18, no. 3: 1115. https://doi.org/10.3390/ijerph18031115