The Implication of Wearables and the Factors Affecting Their Usage among Recreationally Active People


Abstract
:1. Introduction
The Current Study
2. Methods
2.1. Participants
2.2. Measures
2.3. Procedure and Intervention
2.4. Statistical Analysis
3. Results
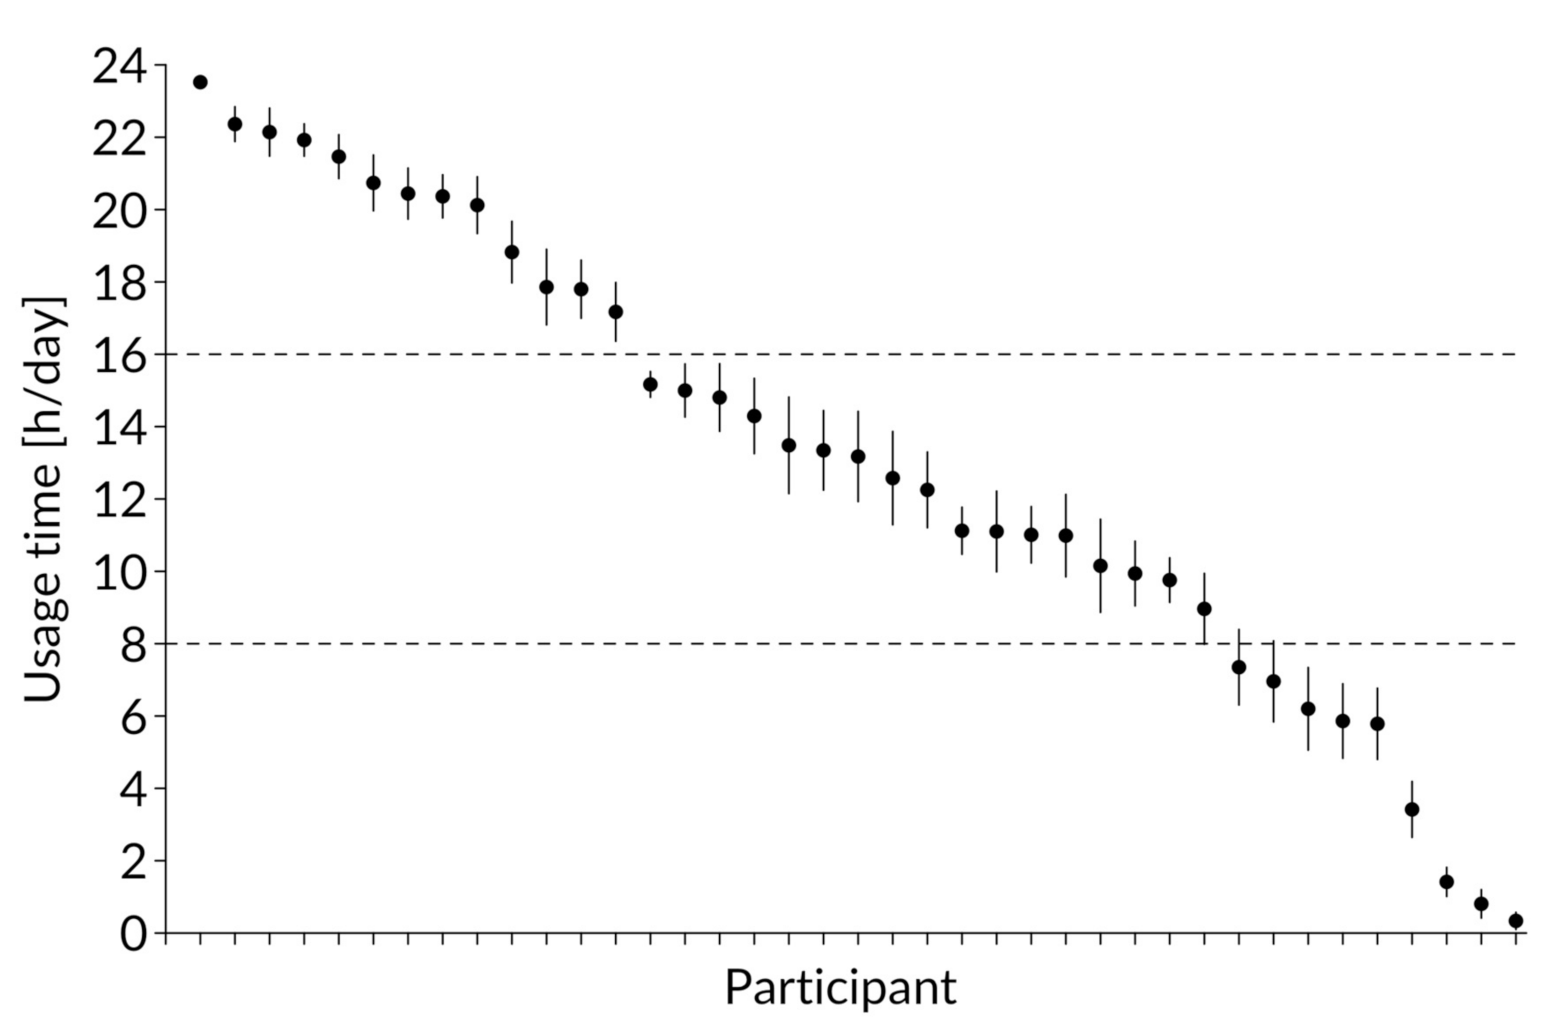
3.1. Usage Behavior
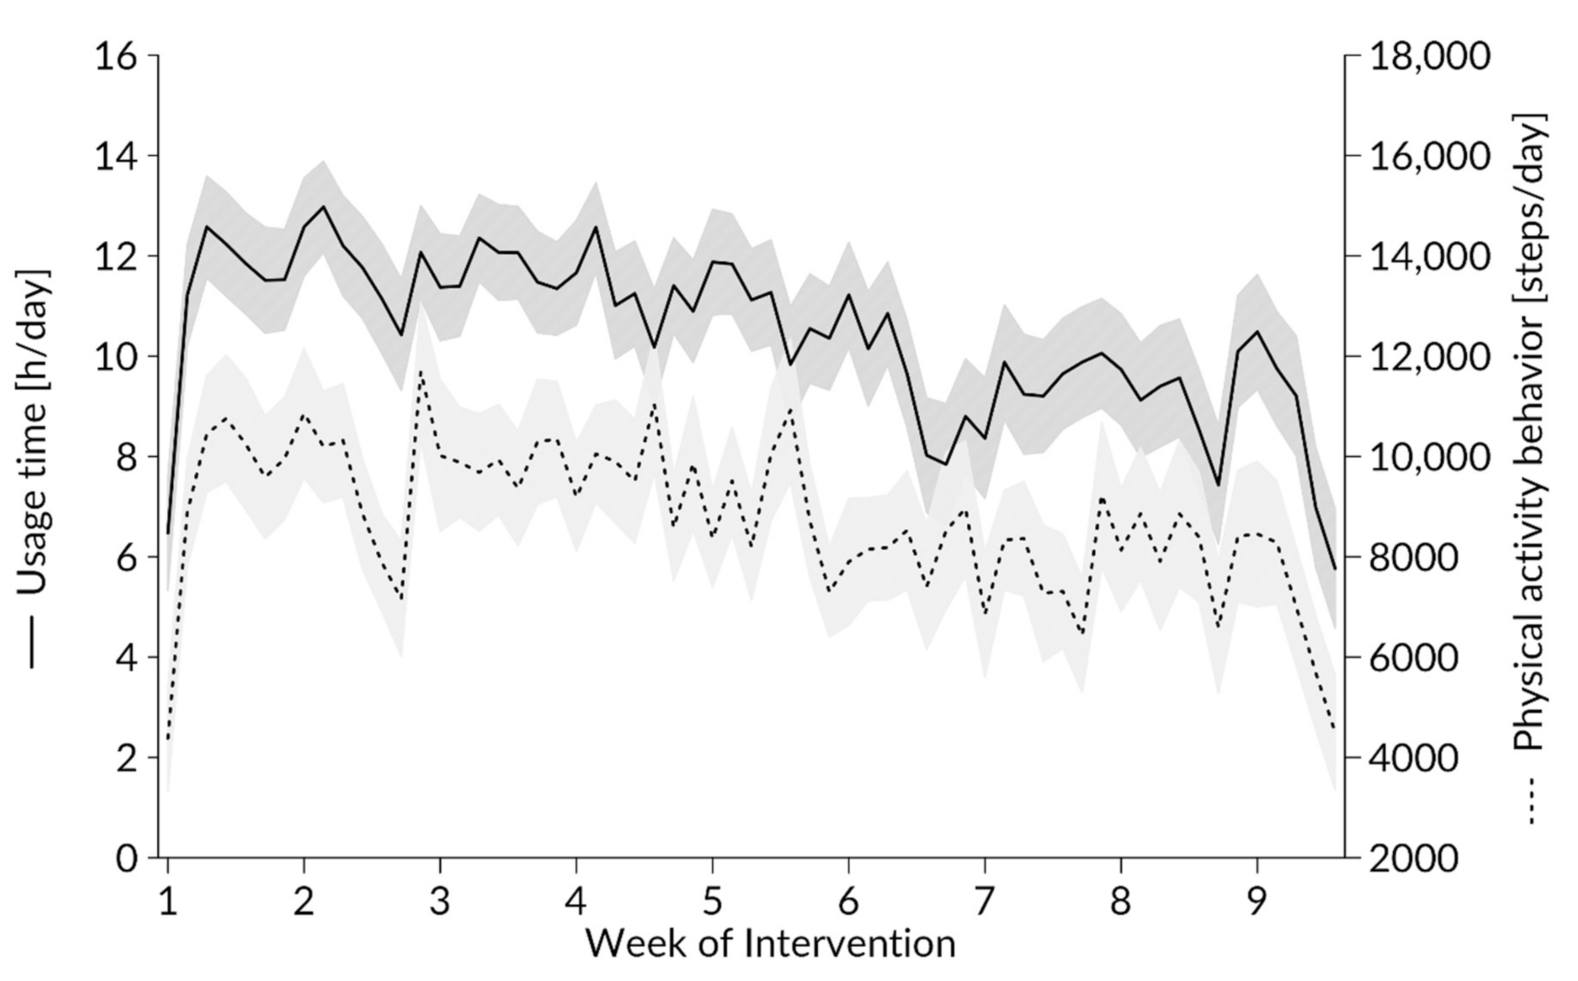
3.1.1. Effect of the Study Week on Usage Behavior
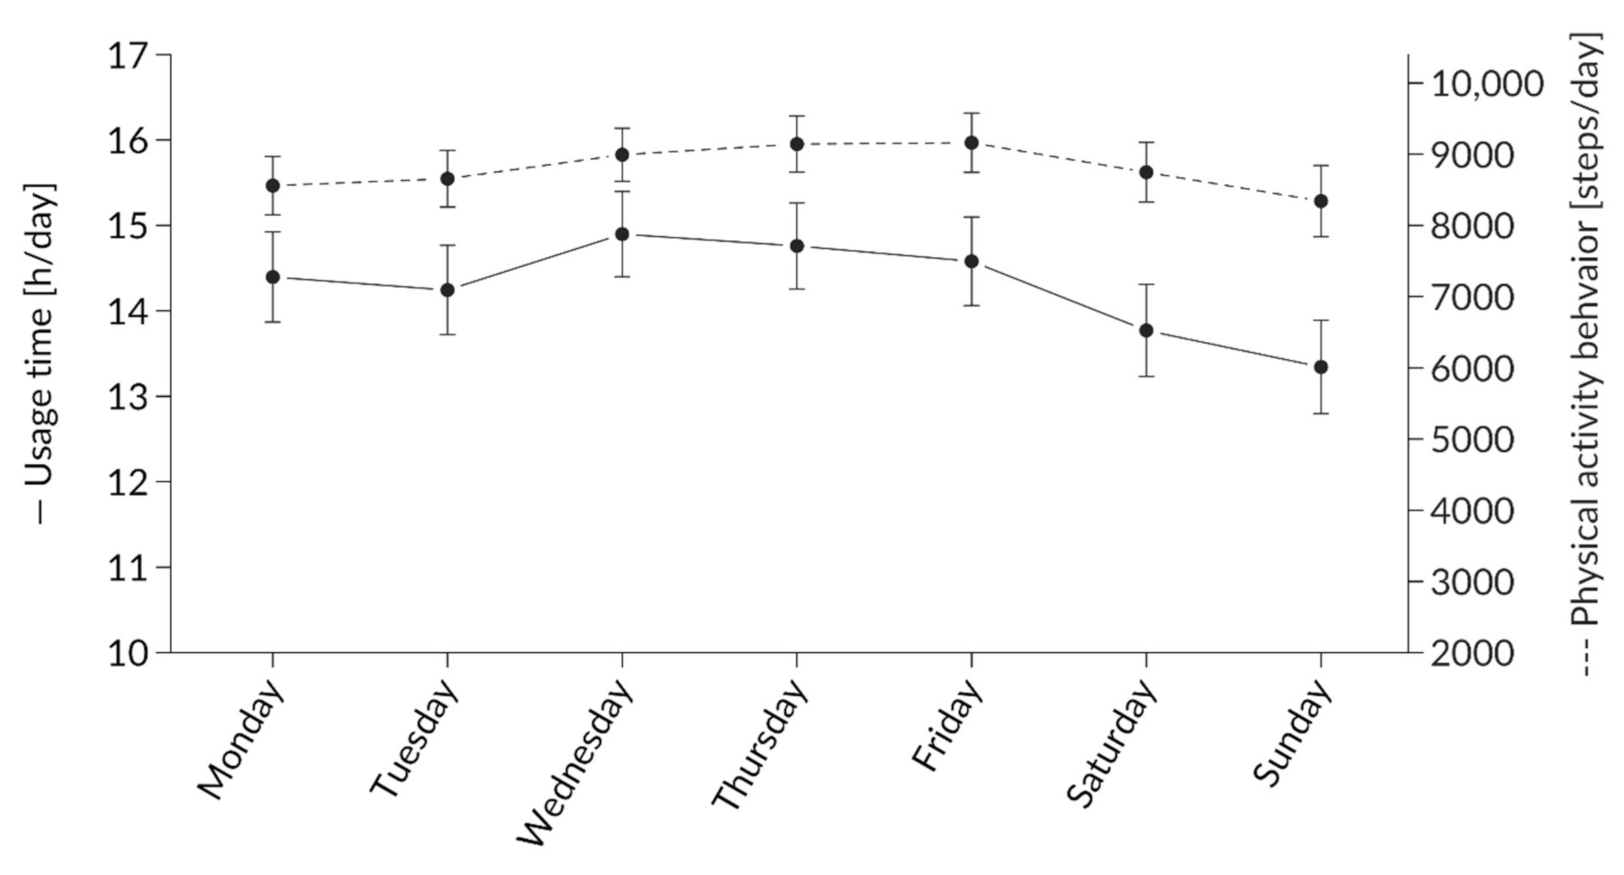
3.1.2. Effect of Weekday on Usage Behavior
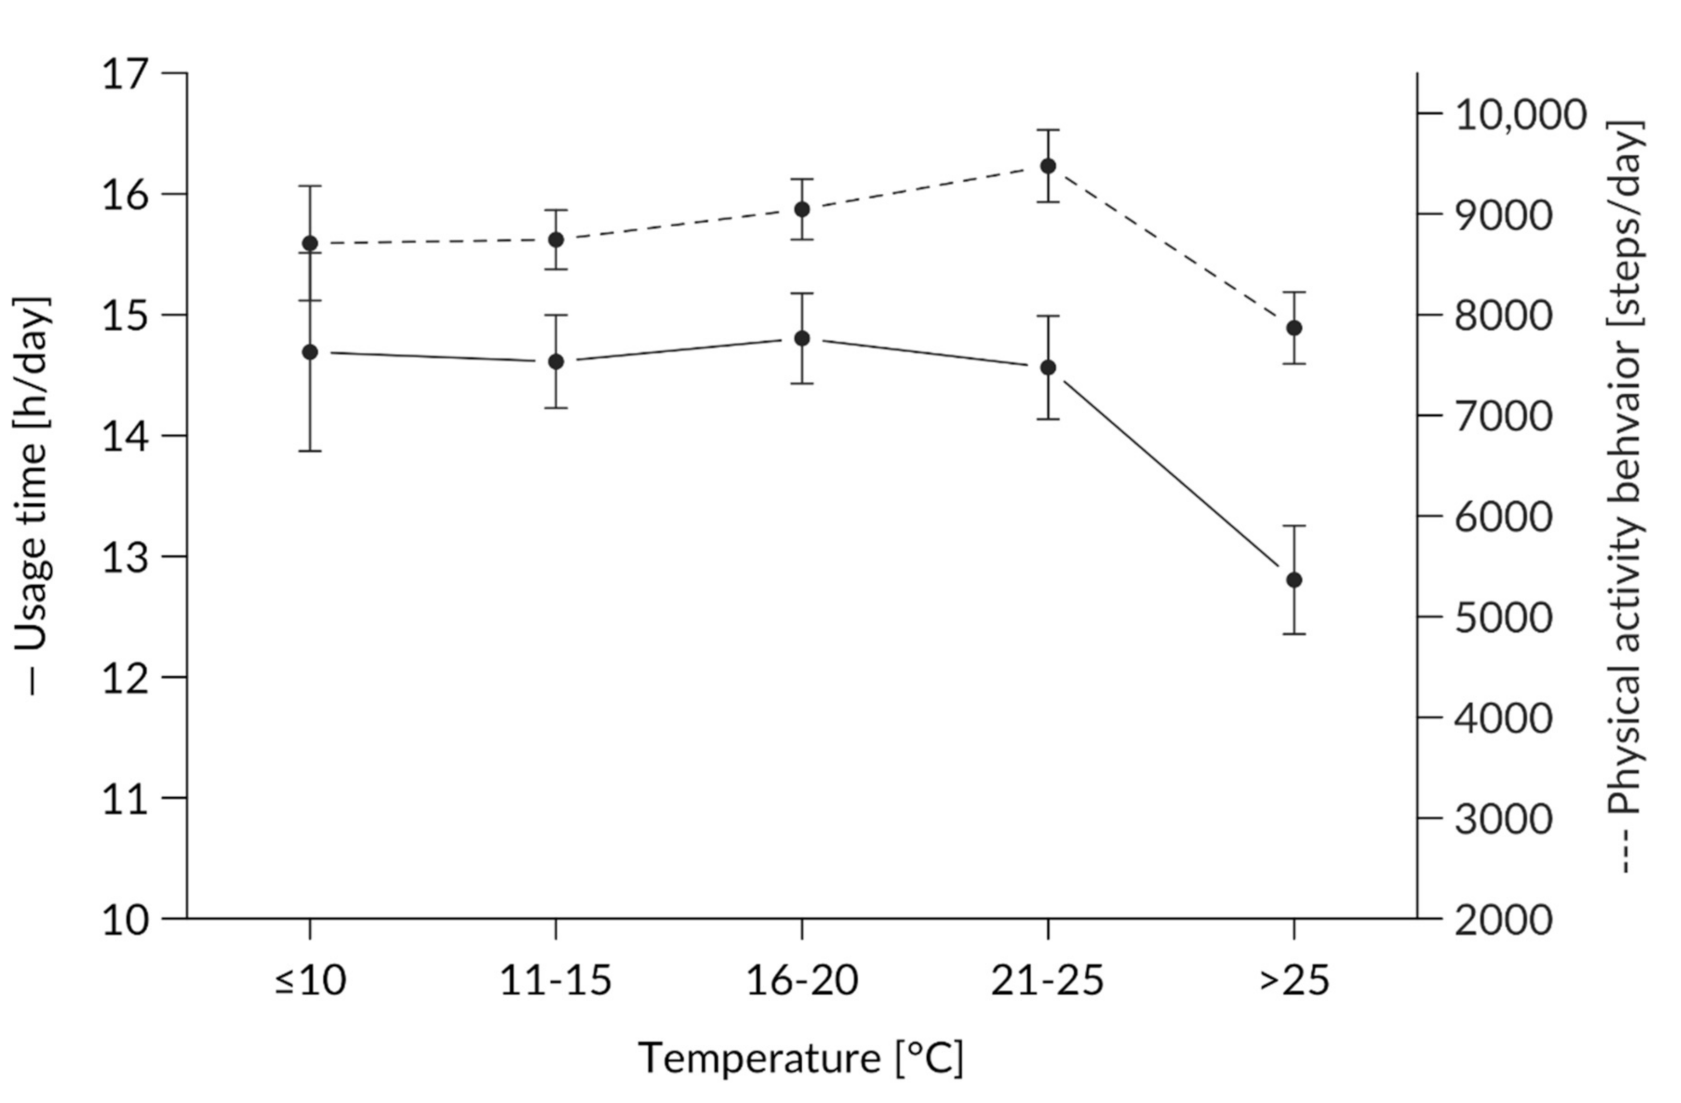
3.1.3. Effect of Temperature on Usage Behavior
3.1.4. Effect of Sunshine Hours on Usage Behavior
3.1.5. Full Model: Effects of Weeks, Weekdays, Temperatures, and Sunshine Hours on Usage Behavior
3.2. Cadence
3.2.1. Effects of Weeks, Weekdays, Temperatures, and Sunshine Hours on Cadence
3.2.2. Full Model: Effects of Weeks, Weekdays, Temperatures, and Sunshine Hours on Steps per Hour
4. Discussion
4.1. Usage Behavior
4.2. Cadence
4.3. Influencing Factors
4.4. Weekday
4.5. Weather
5. Conclusions
Author Contributions
Funding
Acknowledgments
Conflicts of Interest
References
- Blair, S.N. Physical inactivity: The biggest public health problem of the 21st century. Br. J. Sports Med. 2009, 43, 1–2. [Google Scholar] [PubMed]
- Haskell, W.L.; Lee, I.M.; Pate, R.R.; Powell, K.E.; Blair, S.N.; Franklin, B.A.; Macera, C.A.; Heath, G.W.; Thompson, P.D.; Bauman, A. Physical activity and public health: Updated recommendation for adults from the American College of Sports Medicine and the American Heart Association. Med. Sci. Sports Exerc. 2007, 39, 1423–1434. [Google Scholar] [CrossRef] [PubMed] [Green Version]
- US Department of Health and Human Services, Office of Disease Prevention and Health Promotion. Physical Activity Guidelines for Americans; Office of the Assistant Secretary for Health, Office of the Secretary, U.S. Department of Health and Human Services: Rockville, MD, USA, 2018. [Google Scholar]
- Brownson, R.C.; Baker, E.A.; Housemann, R.A.; Brennan, L.K.; Bacak, S.J. Environmental and policy determinants of physical activity in the United States. Am. J. Public Health 2001, 91, 1995–2003. [Google Scholar] [CrossRef] [PubMed]
- Chan, C.B.; Ryan, D.A.J.; Tudor-Locke, C. Relationship between objective measures of physical activity and weather: A longitudinal study. Int. J. Behav. Nutr. Phys. Act. 2006, 3, 21. [Google Scholar] [CrossRef] [PubMed] [Green Version]
- Statista, & IKK Classic, & Brand eins. Marktentwicklung von Wearables und Fitness-Apps in Deutschland in den Jahren 2017 bis 2022 (in Millionen Nutzern) [Graph].: In Statista. Available online: https://de.statista.com/statistik/daten/studie/1046996/umfrage/marktentwicklung-von-wearables-und-fitness-apps-in-deutschland/ (accessed on 4 September 2020).
- Thompson, W.R. Worldwide survey of fitness trends for 2020. ACSM´s Health Fit. J. 2019, 23, 10–18. [Google Scholar] [CrossRef]
- Foster, C.; Richards, J.; Thorogood, M.; Hillsdon, M. Remote and web 2.0 interventions for promoting physical activity. Cochrane Database Syst. Rev. 2013, 9, CD010395. [Google Scholar] [CrossRef]
- Davies, C.A.; Spence, J.C.; Vandelanotte, C.; Caperchione, C.M.; Mummery, W.K. Meta-analysis of internet-delivered interventions to increase physical activity levels. Int. J. Behav. Nutr. Phys. Act. 2012, 9, 52. [Google Scholar] [CrossRef] [Green Version]
- Aalbers, T.; Baars, M.A.E.; Rikkert, M.G.M.O. Characteristics of effective Internet-mediated interventions to change lifestyle in people aged 50 and older: A systematic review. Ageing Res. Rev. 2011, 10, 487–497. [Google Scholar] [CrossRef]
- Norman, G.J.; Zabinski, M.F.; Adams, M.A.; Rosenberg, D.E.; Yaroch, A.L.; Atienza, A.A. A review of eHealth interventions for physical activity and dietary behavior change. Am. J. Prev. Med. 2007, 33, 336–345. [Google Scholar] [CrossRef] [Green Version]
- Krebs, P.; Prochaska, J.O.; Rossi, J.S. A meta-analysis of computer-tailored interventions for health behavior change. Prev. Med. 2010, 51, 214–221. [Google Scholar] [CrossRef] [Green Version]
- Lynch, C.; Bird, S.; Lythgo, N.; Selva-Raj, I. Changing the Physical Activity Behavior of Adults With Fitness Trackers: A Systematic Review and Meta-Analysis. Am. J. Health Promot. 2019, 418–430. [Google Scholar] [CrossRef] [PubMed]
- Sullivan, A.N.; Lachman, M.E. Behavior Change with Fitness Technology in Sedentary Adults: A Review of the Evidence for Increasing Physical Activity. Front. Public Health 2016, 4, 289. [Google Scholar] [CrossRef] [PubMed] [Green Version]
- Maher, C.; Ryan, J.; Ambrosi, C.; Edney, S. Users’ experiences of wearable activity trackers: A cross-sectional study. BMC Public Health 2017, 17, 880. [Google Scholar] [CrossRef] [PubMed] [Green Version]
- Cadmus-Bertram, L.A.; Marcus, B.H.; Patterson, R.E.; Parker, B.A.; Morey, B.L. Randomized Trial of a Fitbit-Based Physical Activity Intervention for Women. Am. J. Prev. Med. 2015, 49, 414–418. [Google Scholar] [CrossRef] [PubMed] [Green Version]
- Ellingson, L.D.; Lansing, J.E.; DeShaw, K.J.; Peyer, K.L.; Bai, Y.; Perez, M.; Phillips, L.A.; Welk, G.J. Evaluating Motivational Interviewing and Habit Formation to Enhance the Effect of Activity Trackers on Healthy Adults’ Activity Levels: Randomized Intervention. JMIR mHealth uHealth 2019, 7, e10988. [Google Scholar] [CrossRef]
- Tudor-Locke, C.; Craig, C.L.; Brown, W.J.; Clemes, S.A.; de Cocker, K.; Giles-Corti, B.; Hatano, Y.; Inoue, S.; Matsudo, S.M.; Mutrie, N.; et al. How many steps/day are enough? For adults. Int. J. Behav. Nutr. Phys. Act. 2011, 8, 79. [Google Scholar] [CrossRef] [Green Version]
- Chiauzzi, E.; Hekler, E.B.; Lee, J.; Towner, A.; DasMahapatra, P.; Fitz-Randolph, M. In search of a daily physical activity "sweet spot": Piloting a digital tracking intervention for people with multiple sclerosis. Digit. Health 2019, 5. [Google Scholar] [CrossRef]
- Meyer, J.; Schnauber, J.; Heuten, W.; Wienbergen, H.; Hambrecht, R.; Appelrath, H.-J.; Boll, S.; von Ossietzy, C. Exploring Longitudinal Use of Activity Trackers. In Proceedings of the IEEE International Conference on Healthcare Informatics (ICHI), Chicago, IL, USA, 4–7 October 2016. [Google Scholar]
- Jeong, H.; Kim, H.; Kim, R.; Lee, U.; Jeong, Y. Smartwatch Wearing Behavior Analysis. Proc. ACM Interact. Mob. Wearable Ubiquitous Technol. 2017, 1, 1–31. [Google Scholar] [CrossRef]
- Lazar, A.; Koehler, C.; Tanenbaum, J.; Nguyen, D.H. Why We Use and Abandon Smart Devices. In Proceedings of the 2015 ACM International Joint Conference on Pervasive and Ubiquitous Computing, Osaka, Japan, 7–11 September 2015; pp. 635–646. [Google Scholar] [CrossRef]
- Ledger, D.; McCaffrey, D. Inside Wearables: How the Science of Human Behavior Change Offers the Secret to Long-Term Engagement; Endeavour Partners: Cambridge, MA, USA, 2014; pp. 1–17. [Google Scholar]
- Shih, P.C.; Han, K.; Poole, E.S.; Rosson, M.B.; Carroll, J.M. Use and Adoption Challenges of Wearable Activity Trackers. 2015. Available online: http://hdl.handle.net/2142/73649 (accessed on 3 September 2020).
- Bort-Roig, J.; Gilson, N.D.; Puig-Ribera, A.; Contreras, R.S.; Trost, S.G. Measuring and influencing physical activity with smartphone technology: A systematic review. Sports Med. 2014, 44, 671–686. [Google Scholar] [CrossRef]
- Payn, T.; Pfeiffer, K.A.; Hutto, B.; Vena, J.E.; LaMonte, M.J.; Blair, S.N.; Hooker, S.P. Daily steps in midlife and older adults: Relationship with demographic, self-rated health, and self-reported physical activity. Res. Q. Exerc. Sport 2008, 79, 128–132. [Google Scholar] [CrossRef]
- Rowe, D.A.; Kemble, C.D.; Robinson, T.S.; Mahar, M.T. Daily Walking in Older Adults: Day-to-Day Variability and Criterion-Referenced Validity of Total Daily Step Counts. J. Phys. Act. Health 2007, 4, 435–447. [Google Scholar] [CrossRef]
- Meyer, J.; von Holdt, K.; Beck, E.; Brandes, M.; Pischke, C.R.; Voelcker-Rehage, C. Toy or Tool? Activity Trackers for the Assessment of Physical Activity in the Wild. In Proceedings of the IEEE International Conference on Healthcare Informatics (ICHI), Xi’an, China, 10–13 June 2019; pp. 1–9. [Google Scholar] [CrossRef]
- Tudor-Locke, C.; Rowe, D.A. Using cadence to study free-living ambulatory behaviour. Sports Med. 2012, 42, 381–398. [Google Scholar] [CrossRef] [PubMed]
- Tudor-Locke, C.; Han, H.; Aguiar, E.J.; Barreira, T.V.; Schuna, J.M.; Kang, M.; Rowe, D.A. How fast is fast enough? Walking cadence (steps/min) as a practical estimate of intensity in adults: A narrative review. Br. J. Sports Med. 2018, 52, 776–788. [Google Scholar] [CrossRef] [PubMed]
- Bouchard, D.R.; Langlois, M.-F.; Boisvert-Vigneault, K.; Farand, P.; Paulin, M.; Baillargeon, J.-P. Pilot study: Can older inactive adults learn how to reach the required intensity of physical activity guideline? Clin. Interv. Aging 2013, 8, 501–508. [Google Scholar] [CrossRef] [Green Version]
- Mansfield, A.; Wong, J.S.; Bryce, J.; Brunton, K.; Inness, E.L.; Knorr, S.; Jones, S.; Taati, B.; McIlroy, W.E. Use of Accelerometer-Based Feedback of Walking Activity for Appraising Progress With Walking-Related Goals in Inpatient Stroke Rehabilitation: A Randomized Controlled Trial. Neurorehabil. Neural Repair 2015, 29, 847–857. [Google Scholar] [CrossRef]
- Oliveira, J.S.; Sherrington, C.; R Y Zheng, E.; Franco, M.R.; Tiedemann, A. Effect of interventions using physical activity trackers on physical activity in people aged 60 years and over: A systematic review and meta-analysis. Br. J. Sports Med. 2019. [Google Scholar] [CrossRef]
- Hallal, P.C.; Andersen, L.B.; Bull, F.C.; Guthold, R.; Haskell, W.; Ekelund, U. Global physical activity levels: Surveillance progress, pitfalls, and prospects. Lancet 2012, 380, 247–257. [Google Scholar] [CrossRef]
- Wolschewski, A.; Ivanova, G.; Handel, T.; Schreiber, M. Method for estimation of weather and weekday effects on activity behavior acquired using wearable sensors. In Proceedings of the 2019 IEEE Sensors Applications Symposium, Sophia Antipolis, France, 11–13 March 2019; IEEE: Piscataway, NJ, USA, 2019; pp. 1–6, ISBN 978-1-5386-7713-1. [Google Scholar]
- Tucker, P.; Gilliland, J. The effect of season and weather on physical activity: A systematic review. Public Health 2007, 121, 909–922. [Google Scholar] [CrossRef]
- Eisenberg, D.; Okeke, E. Too Cold for a Jog? Weather, Exercise, and Socioeconomic Status. BE J. Econ. Anal. Policy 2009, 9, 25. [Google Scholar] [CrossRef] [Green Version]
- Wagner, A.L.; Keusch, F.; Yan, T.; Clarke, P.J. The impact of weather on summer and winter exercise behaviors. J. Sport Health Sci. 2019, 8, 39–45. [Google Scholar] [CrossRef]
- Klenk, J.; Büchele, G.; Rapp, K.; Franke, S.; Peter, R. Walking on sunshine: Effect of weather conditions on physical activity in older people. J. Epidemiol. Commun. Health 2012, 66, 474–476. [Google Scholar] [CrossRef] [PubMed]
- Wu, R.C.; Ginsburg, S.; Son, T.; Gershon, A.S. Using wearables and self-management apps in patients with COPD: A qualitative study. ERJ Open Res. 2019, 5. [Google Scholar] [CrossRef] [PubMed] [Green Version]
- Aspvik, N.P.; Viken, H.; Ingebrigtsen, J.E.; Zisko, N.; Mehus, I.; Wisløff, U.; Stensvold, D. Do weather changes influence physical activity level among older adults? - The Generation 100 study. PLoS ONE 2018, 13, e0199463. [Google Scholar] [CrossRef] [PubMed]
- Mandyuk, A. Use of fitness trackers to determine the volume of physical activity of students in secondary schools aged 15–16 years. Slobozhanskyi Her. Sci. Sport 2019, 7, 25–28. [Google Scholar] [CrossRef]
- McCallum, C.; Rooksby, J.; Gray, C.M. Evaluating the Impact of Physical Activity Apps and Wearables: Interdisciplinary Review. JMIR mHealth uHealth 2018, 6, e58. [Google Scholar] [CrossRef] [Green Version]
- Dominick, G.M.; Winfree, K.N.; Pohlig, R.T.; Papas, M.A. Physical Activity Assessment Between Consumer- and Research-Grade Accelerometers: A Comparative Study in Free-Living Conditions. JMIR mHealth uHealth 2016, 4, e110. [Google Scholar] [CrossRef]
- Fitbit. How Does My Fitbit Device Calculate My Daily Activity? Available online: https://help.fitbit.com/articles/en_US/Help_article/1141.htm (accessed on 3 September 2020).
- R Core Team. R: A Language and Environment for Statistical Computing. R Foundation for Statistical Computing. Available online: https://www.R-project.org/ (accessed on 12 November 2020).
- Wetterkontor. Höchst- und Tiefstwerte in Deutschland am. Available online: https://www.wetterkontor.de/de/wetter/deutschland/extremwerte.asp?id=20200902 (accessed on 30 August 2020).
- Fitbit. The Magic of 10,000 Steps. Available online:https://blog.fitbit.com/the-magic-of-10000-steps (accessed on 7 September 2020).
- Kuznetsova, A.; Brockhoff, P.B.; Christensen, R.H.B. lmerTest Package: Tests in Linear Mixed Effects Models. J. Stat. Soft. 2017, 82. [Google Scholar] [CrossRef] [Green Version]
- Bates, D.; Mächler, M.; Bolker, B.; Walker, S. Fitting Linear Mixed-Effects Models Using lme4. J. Stat. Soft. 2015, 67. [Google Scholar] [CrossRef]
- Baranowski, T.; Thompson, W.O.; DuRant, R.H.; Baranowski, J.; Puhl, J. Observations on Physical Activity in Physical Locations: Age, Gender, Ethnicity and Month Effects. Res. Q. Exerc. Sport 1993, 64, 127–133. [Google Scholar] [CrossRef]
- Auerswald, T.; Meyer, J.; von Holdt, K.; Voelcker-Rehage, C. Application of Activity Trackers among Nursing Home Residents—A Pilot and Feasibility Study on Physical Activity Behavior, Usage Behavior, Acceptance, Usability and Motivational Impact. Int. J. Environ. Res. Public Health 2020, 17, 6683. [Google Scholar] [CrossRef]
- Tang, L.M.; Meyer, J.; Epstein, D.A.; Bragg, K.; Engelen, L.; Bauman, A.; Kay, J. Defining Adherence: Making sense of physical activity tracker data. Proc. ACM Interact. Mob. Wearable Ubiquitous Technol. 2018, 2, 1–22. [Google Scholar] [CrossRef]
- Muellmann, S.; Forberger, S.; Möllers, T.; Zeeb, H.; Pischke, C.R. Effectiveness of eHealth interventions for the promotion of physical activity in older adults: A systematic review protocol. Syst. Rev. 2016, 5, 47. [Google Scholar] [CrossRef] [PubMed] [Green Version]
- Wu, Y.-T.; Luben, R.; Wareham, N.; Griffin, S.; Jones, A.P. Weather, day length and physical activity in older adults: Cross-sectional results from the European Prospective Investigation into Cancer and Nutrition (EPIC) Norfolk Cohort. PLoS ONE 2017, 12, e0177767. [Google Scholar] [CrossRef] [PubMed] [Green Version]
- Kooiman, T.J.M.; Dontje, M.L.; Sprenger, S.R.; Krijnen, W.P.; van der Schans, C.P.; de Groot, M. Reliability and validity of ten consumer activity trackers. BMC Sports Sci. Med. Rehabil. 2015, 7, 24. [Google Scholar] [CrossRef] [PubMed] [Green Version]
- Wahl, Y.; Düking, P.; Droszez, A.; Wahl, P.; Mester, J. Criterion-Validity of Commercially Available Physical Activity Tracker to Estimate Step Count, Covered Distance and Energy Expenditure during Sports Conditions. Front. Physiol. 2017, 8, 725. [Google Scholar] [CrossRef] [PubMed]
- Middelweerd, A.; van der Ploeg, H.P.; van Halteren, A.; Twisk, J.W.R.; Brug, J.; Te Velde, S.J. A Validation Study of the Fitbit One in Daily Life Using Different Time Intervals. Med. Sci. Sports Exerc. 2017, 49, 1270–1279. [Google Scholar] [CrossRef] [Green Version]
- Evenson, K.R.; Goto, M.M.; Furberg, R.D. Systematic review of the validity and reliability of consumer-wearable activity trackers. Int. J. Behav. Nutr. Phys. Act. 2015, 12, 159. [Google Scholar] [CrossRef] [Green Version]


| Factors | Usage Time (h/Day) | Physical Activity Behavior (Steps/Day) | Cadence (Steps/h) | |||||||||||||
|---|---|---|---|---|---|---|---|---|---|---|---|---|---|---|---|---|
| N | Mean | Median | SD | SE | N | Mean | Median | SD | SE | N | Mean | Median | SD | SE | ||
| Total | 2373 | 10.45 | 15.10 | 6.82 | 0.14 | 2070 | 8813.9 | 8635.5 | 7119.7 | 156.5 | 2070 | 642.4 | 620.2 | 548.3 | 12.1 | |
| Week | 1 | 273 | 11.05 | 16.00 | 6.71 | 0.41 | 259 | 9187.9 | 9061.0 | 7443.8 | 462.5 | 259 | 632.2 | 625.7 | 504.6 | 31.4 |
| 2 | 273 | 11.88 | 16.00 | 6.28 | 0.38 | 255 | 9579.6 | 9468.0 | 7118.0 | 445.7 | 255 | 665.7 | 648.1 | 502.7 | 31.5 | |
| 3 | 273 | 11.72 | 16.00 | 5.98 | 0.36 | 253 | 9930.9 | 9357.0 | 7177.0 | 451.9 | 253 | 739.1 | 662.1 | 552.4 | 34.7 | |
| 4 | 273 | 11.28 | 15.40 | 6.39 | 0.39 | 239 | 9708.7 | 9887.0 | 6847.7 | 442.9 | 239 | 693.5 | 690.8 | 476.1 | 30.8 | |
| 5 | 273 | 10.98 | 14.70 | 6.57 | 0.40 | 231 | 8976.3 | 8744.0 | 6527.0 | 429.4 | 231 | 631.0 | 621.7 | 427.3 | 28.1 | |
| 6 | 273 | 9.50 | 12.83 | 6.99 | 0.42 | 225 | 8238.4 | 8137.0 | 6946.6 | 463.1 | 225 | 617.5 | 602.2 | 521.5 | 34.8 | |
| 7 | 273 | 9.47 | 13.43 | 7.06 | 0.43 | 228 | 7715.0 | 7230.0 | 6964.1 | 461.2 | 228 | 641.1 | 572.4 | 805.4 | 53.3 | |
| 8 | 273 | 9.12 | 12.43 | 7.23 | 0.44 | 225 | 8183.8 | 7171.0 | 7531.8 | 502.1 | 225 | 610.0 | 564.4 | 555.0 | 37.0 | |
| 9 | 273 | 8.41 | 11.12 | 7.47 | 0.54 | 155 | 6850.3 | 5750.0 | 6966.4 | 559.6 | 155 | 487.2 | 433.6 | 475.6 | 38.2 | |
| Day | Monday | 326 | 10.66 | 12.47 | 6.76 | 0.39 | 285 | 8558.4 | 8199.0 | 6907.3 | 409.2 | 285 | 638.6 | 591.0 | 520.1 | 30.8 |
| Tuesday | 339 | 10.51 | 15.37 | 6.82 | 0.37 | 293 | 8655.3 | 8724.0 | 6822.8 | 398.6 | 293 | 631.6 | 620.8 | 519.3 | 30.3 | |
| Wednesday | 351 | 11.14 | 15.55 | 6.63 | 0.37 | 319 | 8992.5 | 8923.0 | 6639.2 | 371.7 | 319 | 646.8 | 630.6 | 542.7 | 30.4 | |
| Thursday | 351 | 10.85 | 16.00 | 6.69 | 0.35 | 315 | 9142.5 | 8933.0 | 6993.1 | 394.0 | 315 | 673.2 | 629.1 | 527.2 | 29.7 | |
| Friday | 351 | 10.51 | 15.48 | 6.90 | 0.36 | 301 | 9161.2 | 9036.0 | 7221.9 | 416.3 | 301 | 626.1 | 622.0 | 473.1 | 27.3 | |
| Saturday | 334 | 9.97 | 15.50 | 6.95 | 0.37 | 290 | 8746.3 | 8812.0 | 7144.5 | 419.5 | 290 | 656.2 | 619.0 | 642.0 | 37.7 | |
| Sunday | 321 | 9.40 | 14.23 | 6.89 | 0.38 | 267 | 8341.4 | 6914.0 | 8179.7 | 500.6 | 267 | 620.6 | 550.6 | 609.0 | 37.3 | |
| Temperature (°C) | ≤10 | 134 | 9.90 | 13.09 | 6.76 | 0.58 | 111 | 8708.4 | 8537.0 | 5992.0 | 568.7 | 111 | 699.8 | 668.6 | 508.5 | 48.3 |
| 10–15 | 596 | 10.56 | 15.41 | 6.79 | 0.28 | 542 | 8744.5 | 8565.5 | 6847.0 | 294.1 | 542 | 667.6 | 622.7 | 636.2 | 27.3 | |
| 16–20 | 647 | 10.94 | 15.85 | 6.66 | 0.26 | 577 | 9046.6 | 8933.0 | 7212.0 | 300.2 | 577 | 641.2 | 629.1 | 499.3 | 20.8 | |
| 21–25 | 516 | 10.77 | 15.31 | 6.73 | 0.30 | 441 | 9477.0 | 9241.0 | 7517.0 | 358.0 | 441 | 656.5 | 626.4 | 523.5 | 24.9 | |
| >25 | 480 | 9.45 | 12.83 | 7.08 | 0.32 | 399 | 7867.9 | 7331.0 | 7117.0 | 356.3 | 399 | 578.5 | 534.8 | 521.0 | 26.1 | |
| Sunshine (hours) | 0 | 318 | 10.11 | 14.28 | 6.92 | 0.39 | 281 | 8163.0 | 8116.0 | 6354.4 | 379.1 | 281 | 641.5 | 566.7 | 566.7 | 33.8 |
| 1–4 | 716 | 10.83 | 15.74 | 6.72 | 0.25 | 639 | 9023.6 | 8578.0 | 7196.5 | 284.7 | 639 | 651.6 | 537.1 | 537.1 | 21.3 | |
| 5–8 | 530 | 10.27 | 14.69 | 6.89 | 0.30 | 459 | 8794.4 | 8825.0 | 7174.2 | 334.9 | 459 | 638.0 | 586.0 | 586.0 | 27.4 | |
| 9–12 | 564 | 10.89 | 15.39 | 6.61 | 0.28 | 489 | 9501.8 | 9483.0 | 1067.0 | 319.6 | 489 | 683.6 | 514.9 | 514.9 | 23.3 | |
| >12 | 245 | 9.12 | 12.37 | 7.15 | 0.46 | 202 | 7434.7 | 6279.5 | 7660.8 | 539.6 | 202 | 525.5 | 536.3 | 536.3 | 37.7 | |
| Usage Behavior (hours) | Steps per hour | ||||||
|---|---|---|---|---|---|---|---|
| Predictors | Estimates | CI | p | Estimates | CI | p | |
| (Intercept) | 9.56 | 7.68–11.45 | <0.001 | 623.02 | 467.25–778.79 | <0.001 | |
| Week | 1st | Reference | Reference | ||||
| 2nd | 0.77 | −0.09–1.64 | 0.078 | 13.05 | −68.00–94.11 | 0.752 | |
| 3rd | 0.56 | −0.31–1.43 | 0.208 | 78.21 | −3.62–160.04 | 0.061 | |
| 4th | 0.18 | −0.67–1.03 | 0.678 | 51.86 | −29.34–133.05 | 0.211 | |
| 5th | −0.03 | −0.88–0.83 | 0.950 | −1.90 | −84.41–80.60 | 0.964 | |
| 6th | −1.62 | −2.49–−0.76 | <0.001 | −36.62 | −121.05–47.80 | 0.395 | |
| 7th | −1.61 | −2.50–−0.71 | <0.001 | −0.30 | −87.72–87.12 | 0.995 | |
| 8th | −1.99 | −2.85–−1.13 | <0.001 | −43.51 | −127.00–39.97 | 0.307 | |
| 9th | −2.84 | −3.79–−1.89 | <0.001 | −175.86 | −269.86–−81.86 | <0.001 | |
| Weekday | Sunday | Reference | Reference | ||||
| Monday | 1.60 | 0.80–2.40 | <0.001 | 45.75 | −33.51–125.00 | 0.258 | |
| Tuesday | 1.57 | 0.78–2.36 | <0.001 | 41.71 | −36.59–120.00 | 0.296) | |
| Wednesday | 2.20 | 1.41–2.98 | <0.001 | 62.66 | −14.14–139.45 | 0.110 | |
| Thursday | 1.64 | 0.86–2.42 | <0.001 | 77.90 | 1.11–154.69 | 0.047 | |
| Friday | 1.38 | 0.60–2.17 | 0.001 | 23.43 | −54.20–101.06 | 0.554 | |
| Saturday | 0.94 | 0.15–1.74 | 0.020 | 49.37 | −29.59–128.34 | 0.220 | |
| Temperature (°C) | ≤10 | Reference | Reference | ||||
| 11–15 | 0.32 | −0.68–1.31 | 0.531 | −30.06 | −129.56–69.44 | 0.554 | |
| 16–20 | 0.24 | −0.85–1.32 | 0.667 | −78.67 | −187.19–29.84 | 0.155 | |
| 21–25 | 0.96 | −0.22–2.14 | 0.112 | −50.17 | −167.92–67.58 | 0.404 | |
| >25 | −0.30 | −1.51–0.91 | 0.626 | −135.85 | −256.04–−15.67 | 0.027 | |
| Sunshine (hours) | 0 | Reference | Reference | ||||
| 1–4 | 0.09 | −0.66–0.85 | 0.808 | 32.01 | −42.01–106.02 | 0.397 | |
| 5–8 | −0.41 | −1.28–0.47 | 0.363 | 37.32 | −48.42–123.06 | 0.394 | |
| 9–12 | −0.21 | −1.15–0.74 | 0.669 | 67.96 | −23.93–159.84 | 0.147 | |
| >12 | 0.10 | −1.00–1.20 | 0.855 | 48.69 | −59.98–157.35 | 0.380 | |
| Random Effects | |||||||
| σ2 | 25.44 | 211,520.76 | |||||
| τ00 | 19.19 id | 83,236.19 id | |||||
| ICC | 0.43 | 0.28 | |||||
| N | 39 id | 39 id | |||||
| Observations | 2373 | 2070 | |||||
| Marginal R2/Conditional R2 | 0.041/0.453 | 0.18/0.295 | |||||
Publisher’s Note: MDPI stays neutral with regard to jurisdictional claims in published maps and institutional affiliations. |
© 2020 by the authors. Licensee MDPI, Basel, Switzerland. This article is an open access article distributed under the terms and conditions of the Creative Commons Attribution (CC BY) license (http://creativecommons.org/licenses/by/4.0/).
Share and Cite
Hendker, A.; Jetzke, M.; Eils, E.; Voelcker-Rehage, C. The Implication of Wearables and the Factors Affecting Their Usage among Recreationally Active People. Int. J. Environ. Res. Public Health 2020, 17, 8532. https://doi.org/10.3390/ijerph17228532
Hendker A, Jetzke M, Eils E, Voelcker-Rehage C. The Implication of Wearables and the Factors Affecting Their Usage among Recreationally Active People. International Journal of Environmental Research and Public Health. 2020; 17(22):8532. https://doi.org/10.3390/ijerph17228532
Chicago/Turabian StyleHendker, Anna, Malte Jetzke, Eric Eils, and Claudia Voelcker-Rehage. 2020. "The Implication of Wearables and the Factors Affecting Their Usage among Recreationally Active People" International Journal of Environmental Research and Public Health 17, no. 22: 8532. https://doi.org/10.3390/ijerph17228532