Physical Activity Dimensions and Its Association with Risk of Diabetes in Middle and Older Aged Chinese People


Abstract
:1. Introduction
2. Materials and Methods
2.1. Study Population
2.2. Outcome Variable
2.3. Assessment of Physical Activity
2.4. Covariates
2.5. Data Analysis
3. Results
3.1. Demographic Characteristics
3.2. Volume of PA
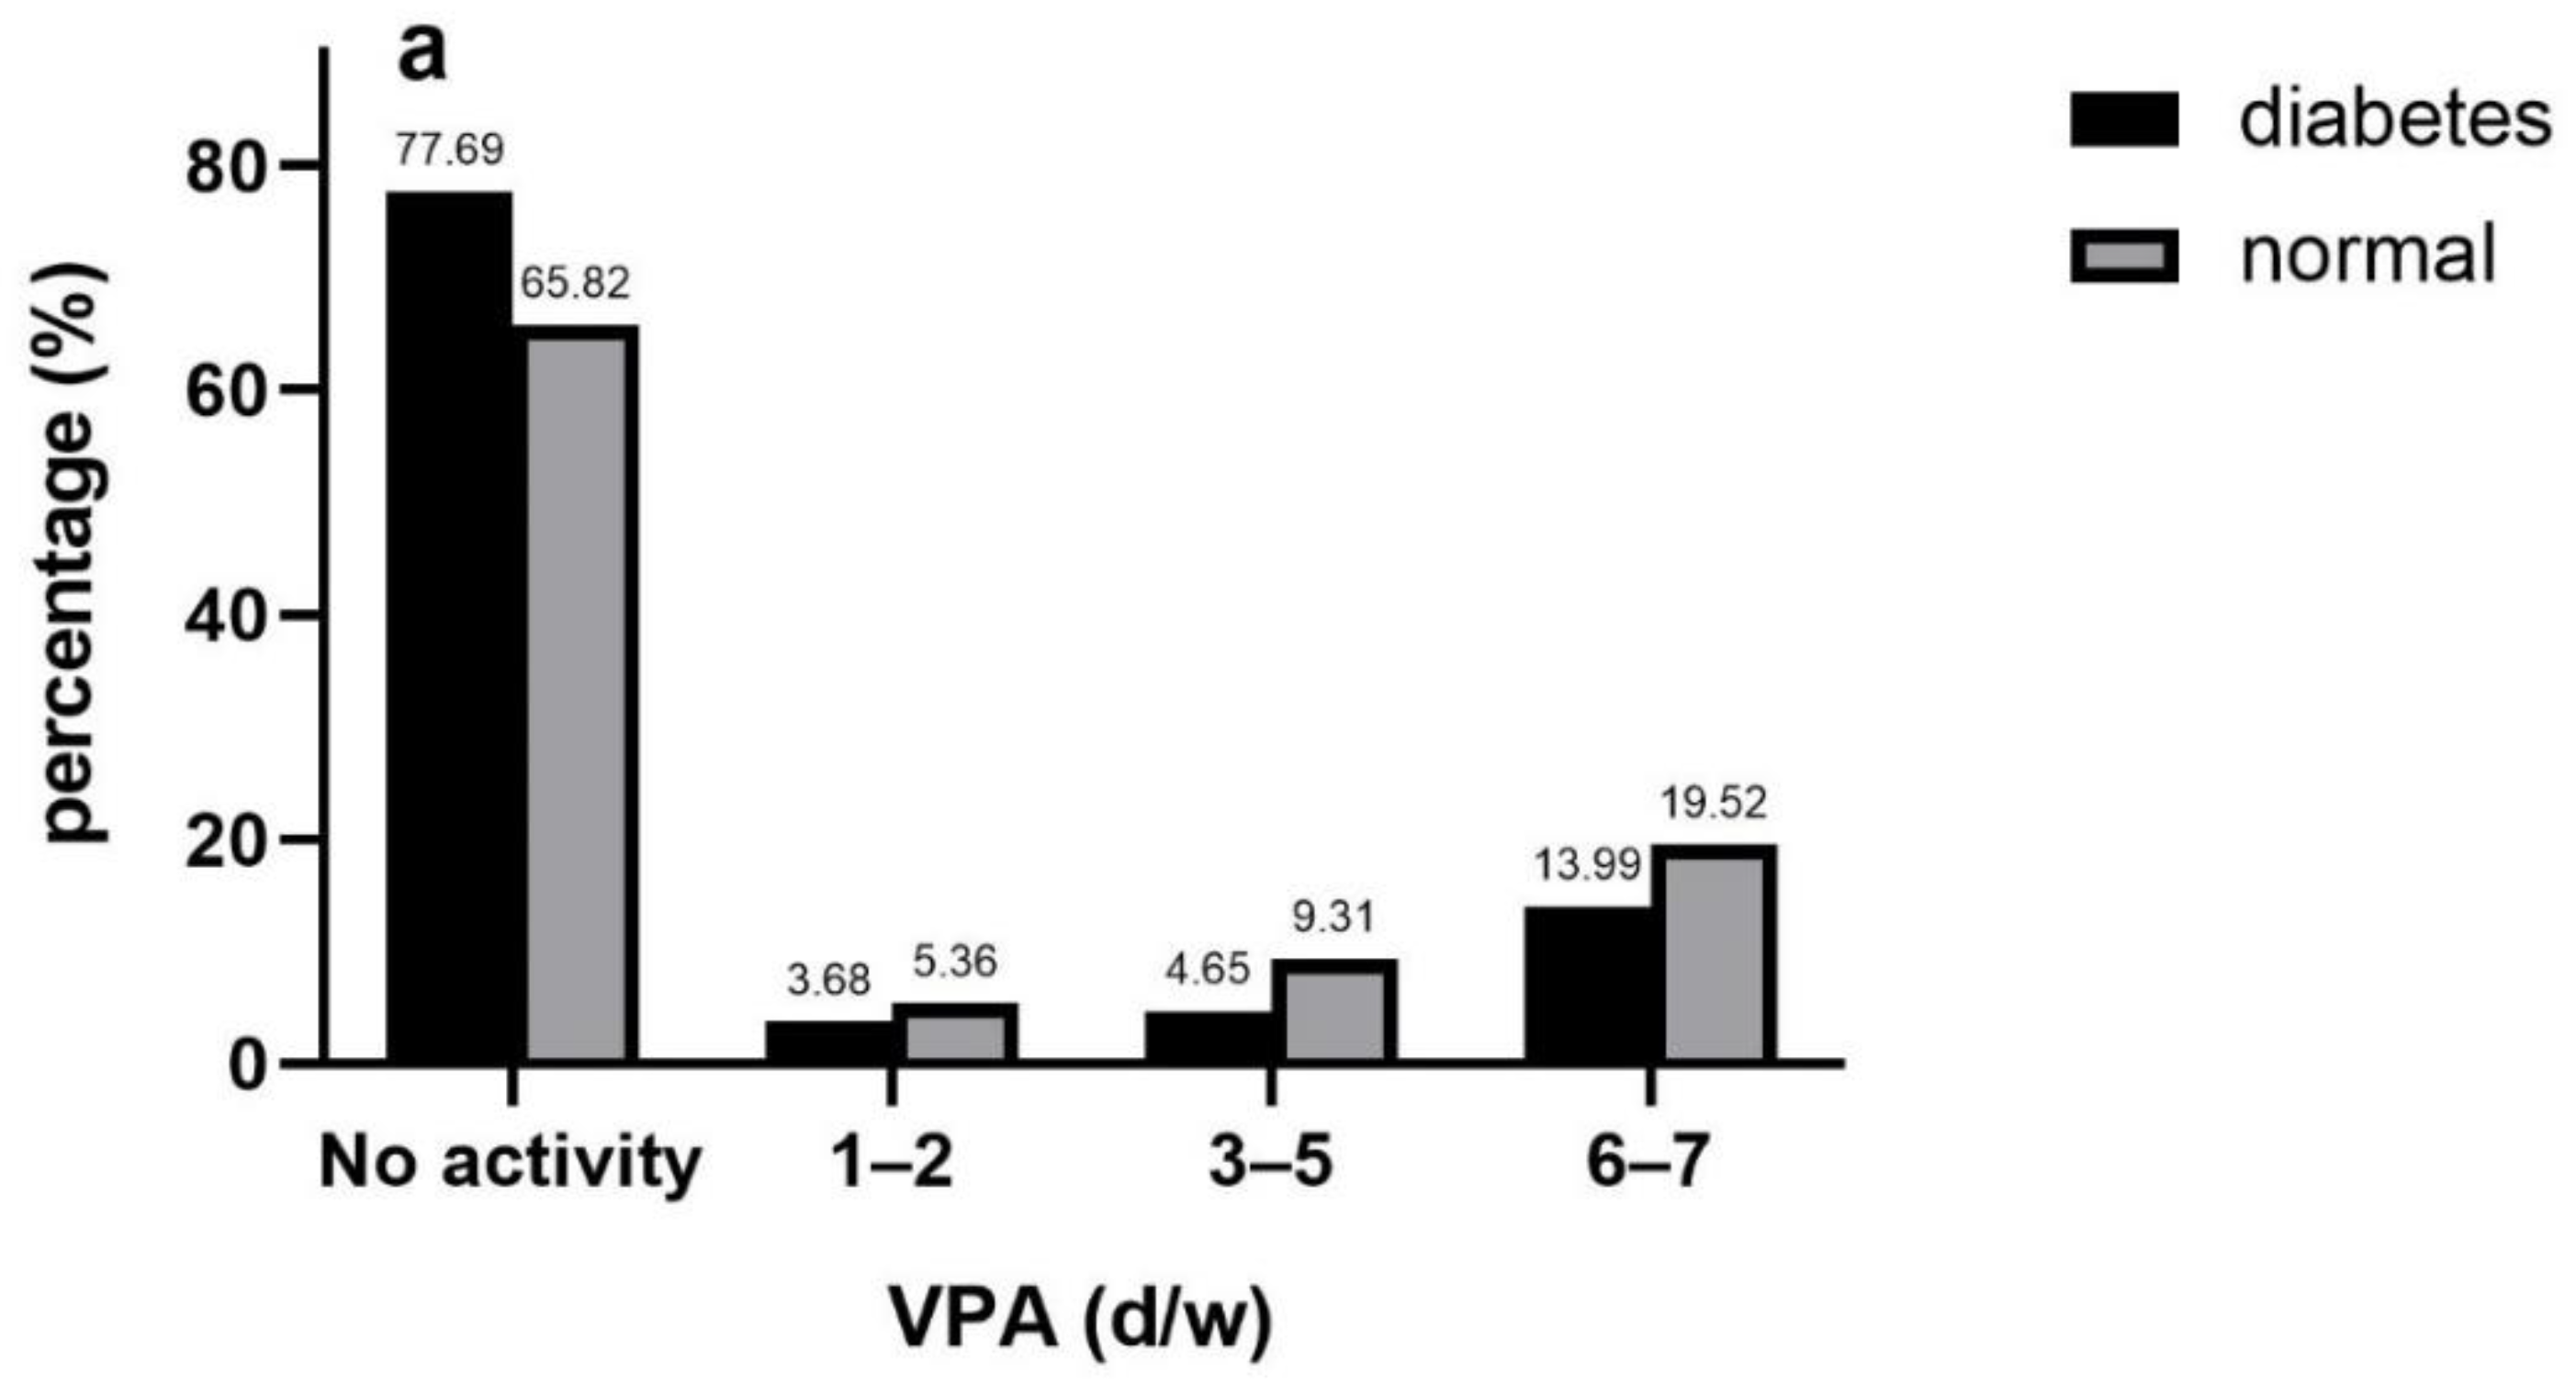
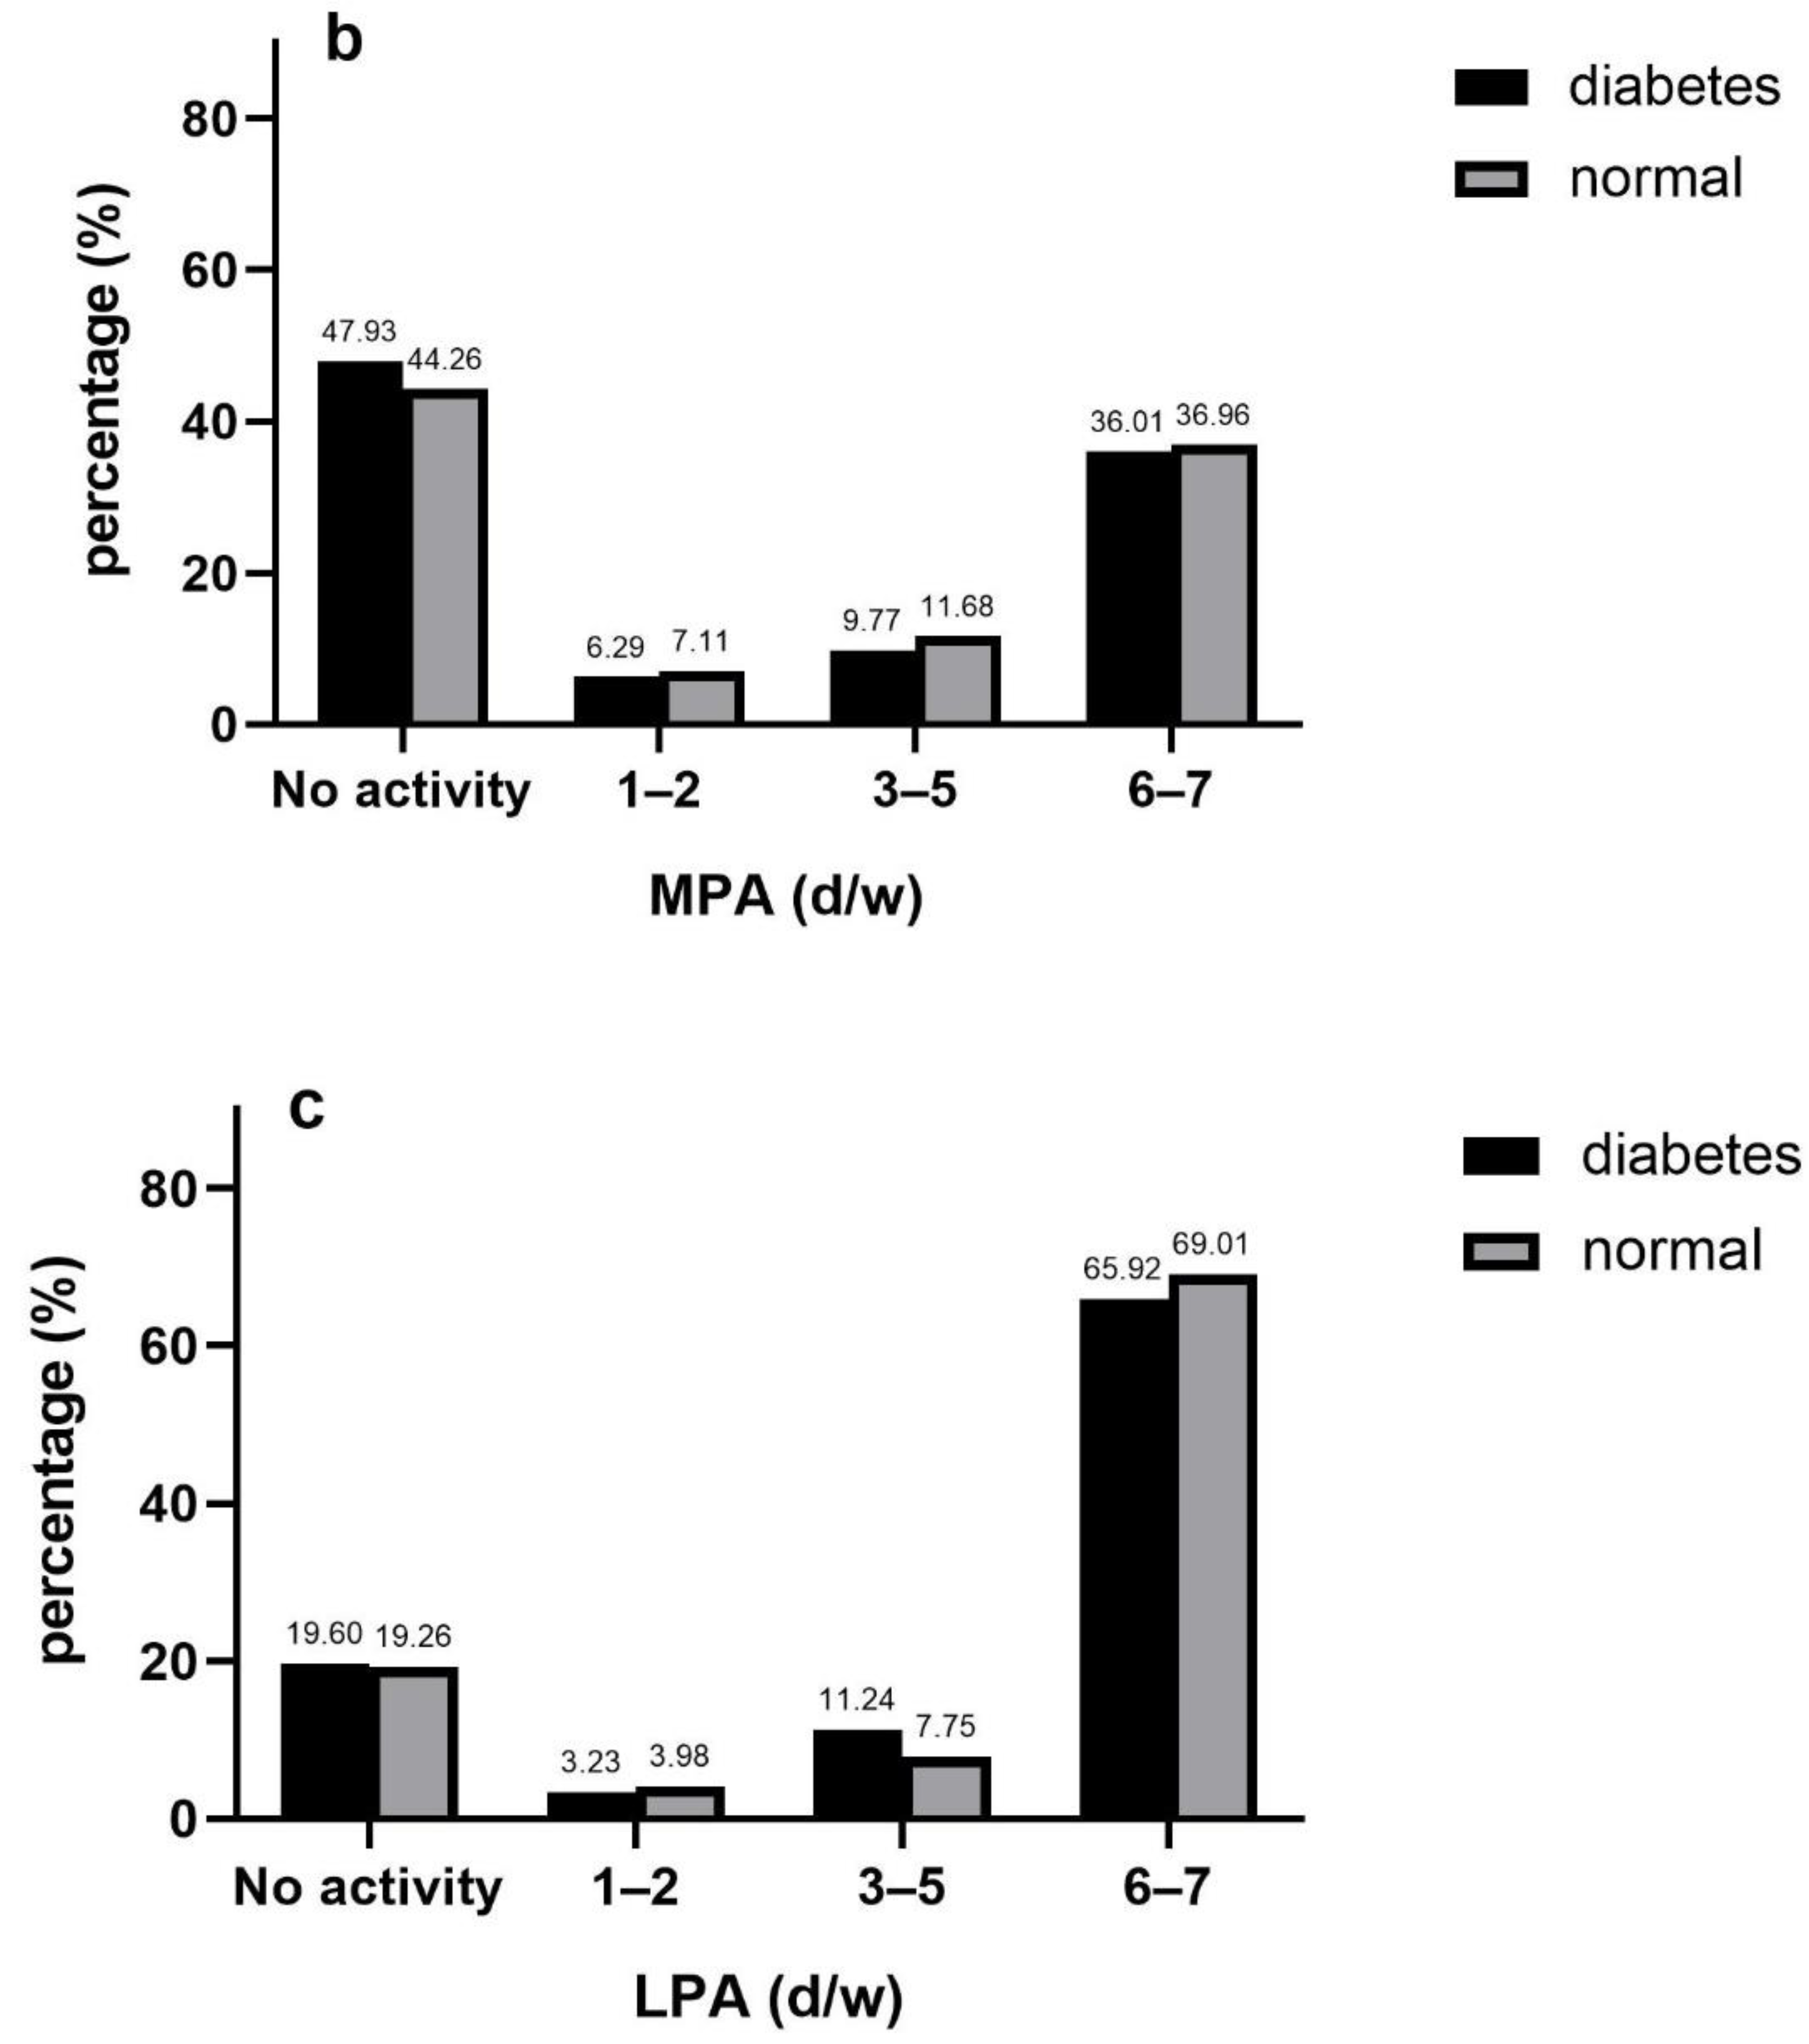
3.3. Frequency of PA
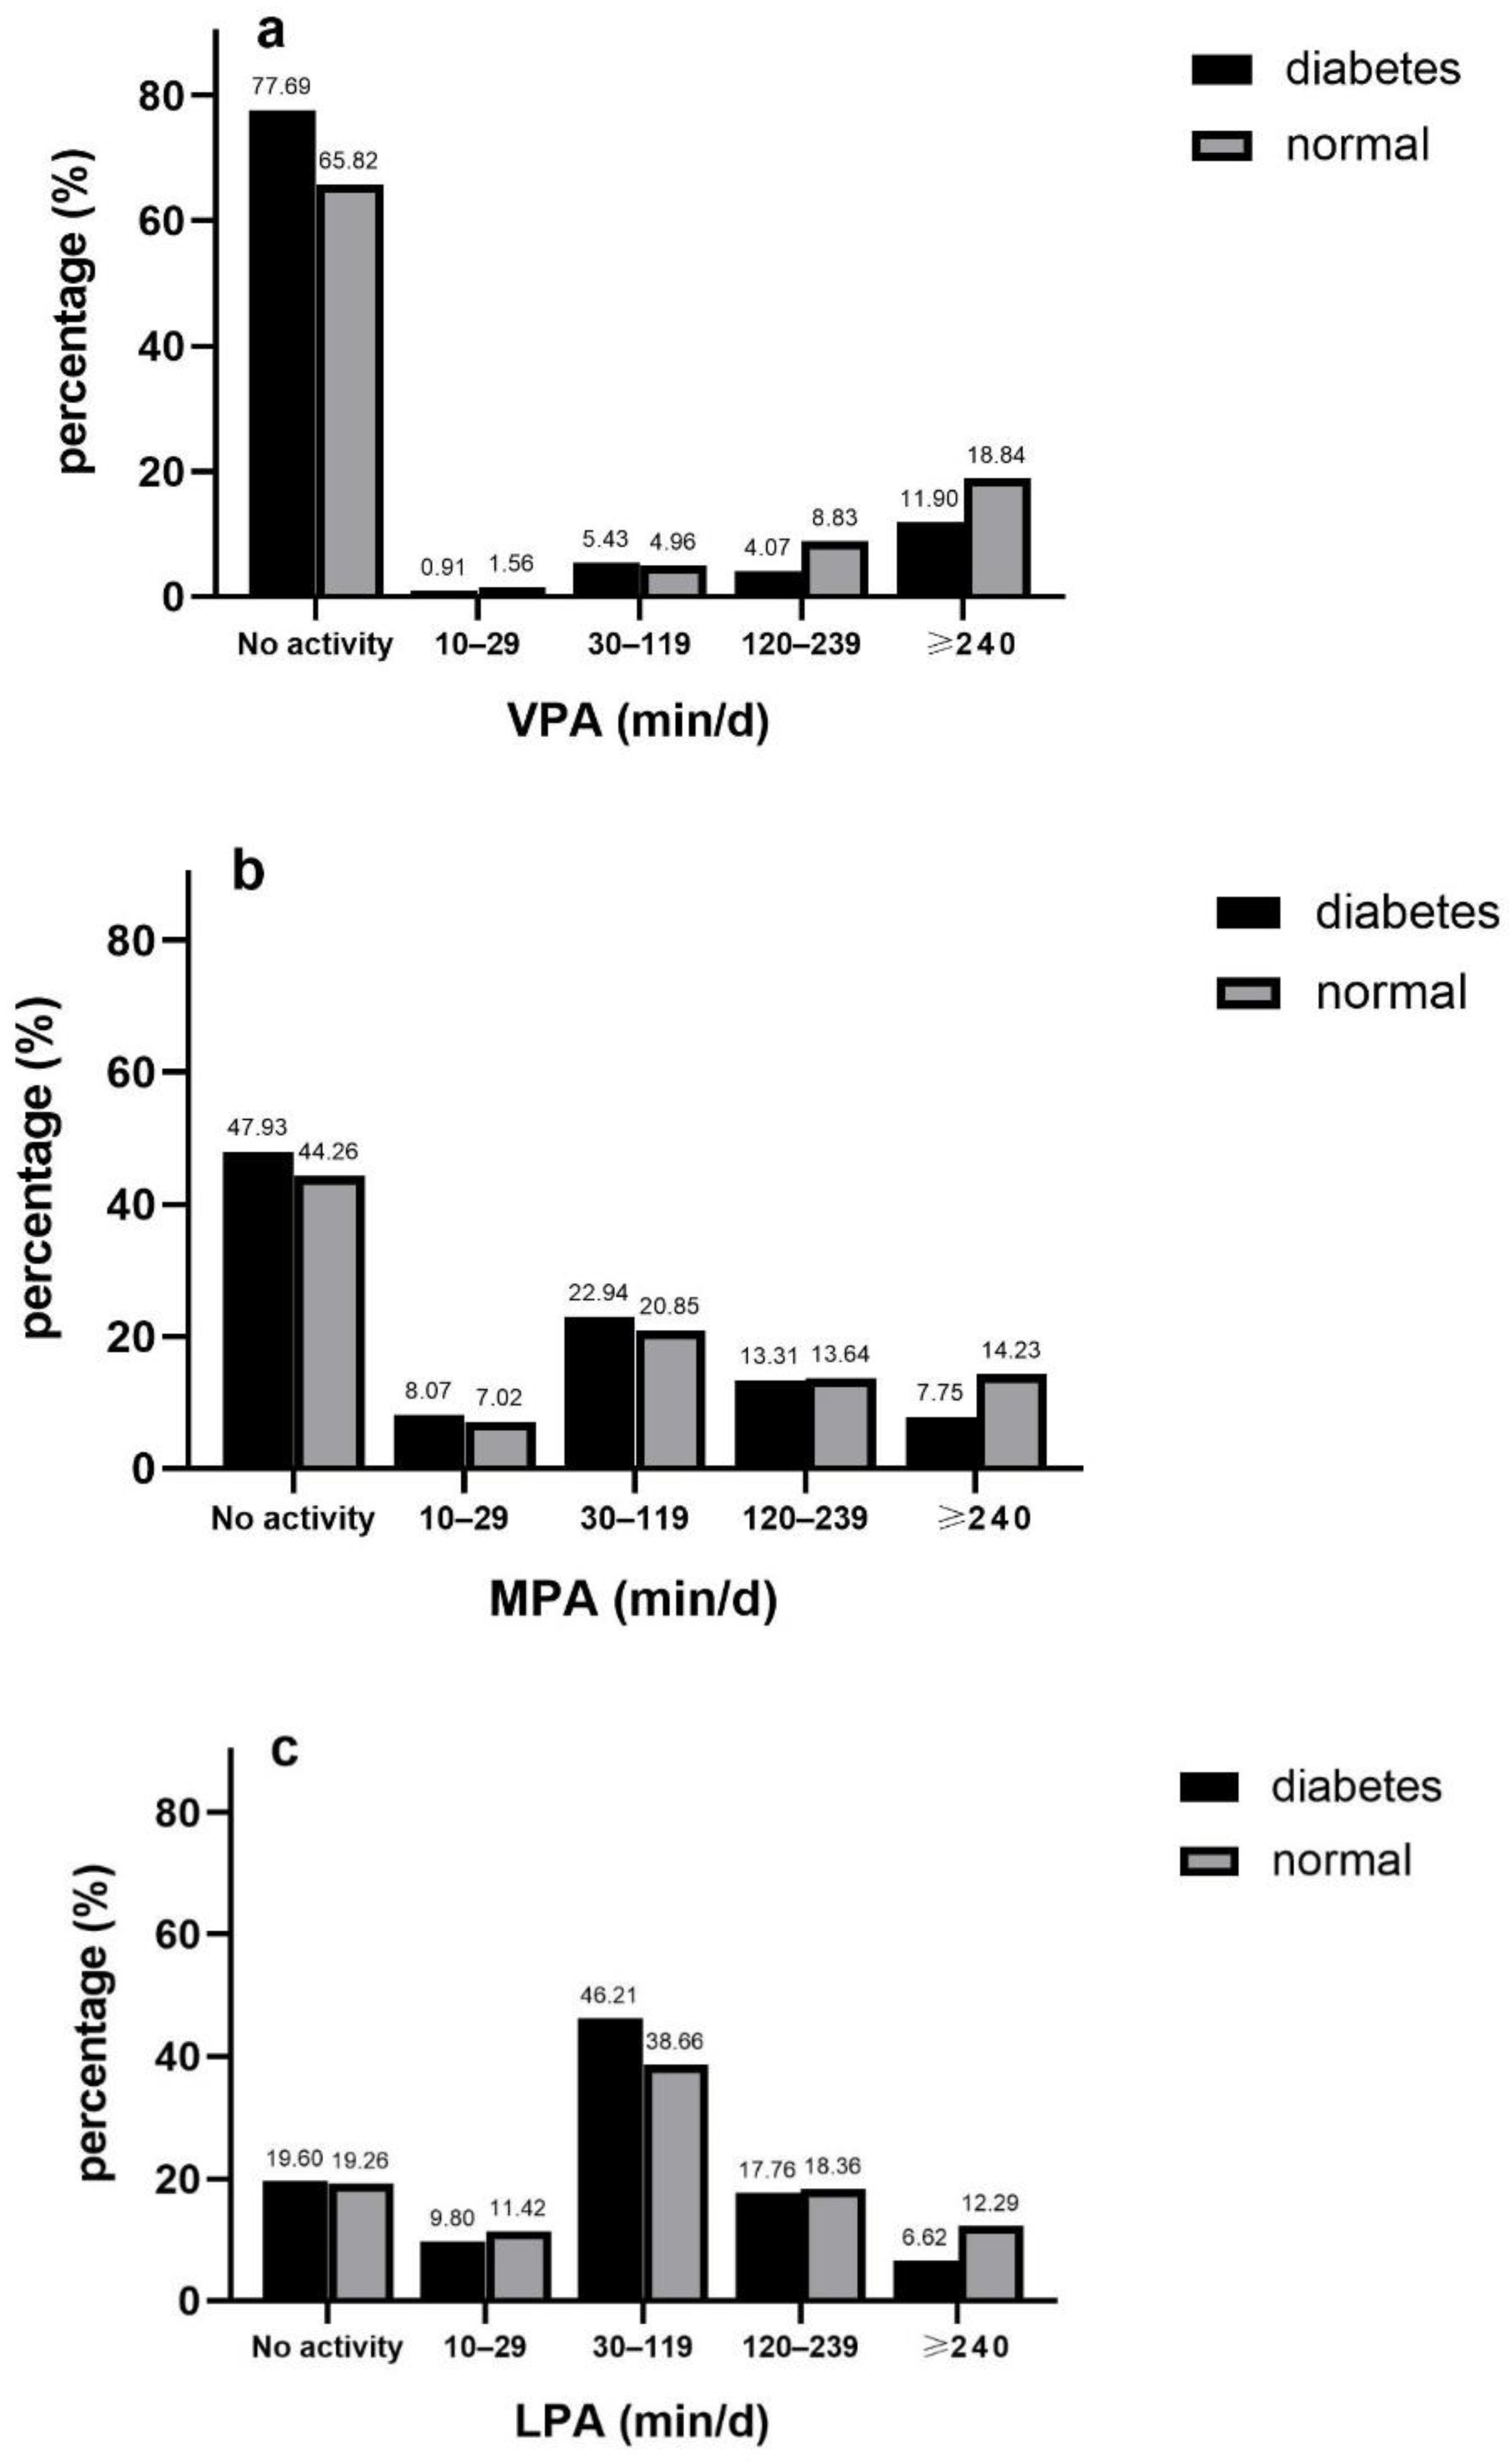
3.4. Duration of PA
3.5. Sensitivity and Subgroup Analysis
4. Discussion
5. Conclusions
Author Contributions
Funding
Conflicts of Interest
Appendix A

| Model1 | ||
|---|---|---|
| OR | 95%CI | |
| Frequency | ||
| VPA | ||
| No activity | 0.00 | |
| 1–2 d/w | 0.68 | 0.44, 1.07 |
| 3–5 d/w | 0.51 ** | 0.31, 0.84 |
| 6–7 d/w | 0.73 * | 0.54, 0.98 |
| MPA | ||
| No activity | 0.00 | |
| 1–2 d/w | 0.86 | 0.58, 1.26 |
| 3–5 d/w | 0.85 | 0.61, 1.19 |
| 6–7 d/w | 0.97 | 0.74, 1.26 |
| LPA | ||
| No activity | 0.00 | |
| 1–2 d/w | 0.82 | 0.50, 1.34 |
| 3–5 d/w | 1.45 | 0.88, 2.39 |
| 6–7 d/w | 0.90 | 0.70, 1.15 |
| Duration | ||
| VPA | ||
| No activity | 0.00 | |
| 10–29 min/d | 0.67 | 0.30, 1.53 |
| 30–119 min/d | 1.06 | 0.66, 1.71 |
| 120–239 min/d | 0.44 ** | 0.28, 0.71 |
| ≥240 min/d | 0.64 ** | 0.48, 0.87 |
| MPA | ||
| No activity | 0.00 | |
| 10–29 min/d | 1.06 | 0.73, 1.54 |
| 30–119 min/d | 1.02 | 0.73, 1.43 |
| 120–239 min/d | 1.02 | 0.74, 1.41 |
| ≥240 min/d | 0.61 ** | 0.43, 0.86 |
| LPA | ||
| No activity | 0.00 | |
| 10–29 min/d | 0.84 | 0.59, 1.18 |
| 30–119 min/d | 1.12 | 0.84, 1.49 |
| 120–239 min/d | 0.91 | 0.66, 1.24 |
| ≥240 min/d | 0.55 ** | 0.37, 0.82 |
| Volume | ||
| VPA | ||
| No activity | 0.00 | |
| 10–74 min/w | 0.48 | 0.14, 1.63 |
| 75–299 min/w | 0.91 | 0.50, 1.66 |
| ≥300 min/w | 0.59 *** | 0.46, 0.75 |
| MPA | ||
| No activity | 0.00 | |
| 10–149 min/w | 0.97 | 0.69, 1.38 |
| 150–299 min/w | 0.57 * | 0.35, 0.94 |
| ≥300 min/w | 0.88 | 0.69, 1.14 |
| LPA | ||
| No activity | 0.00 | |
| 10–105 min/w | 0.86 | 0.62, 1.21 |
| 106–525 min/w | 1.12 | 0.84, 1.49 |
| 526–1260 min/w | 0.94 | 0.69, 1.29 |
| >1260 min/w | 0.50 ** | 0.33, 0.75 |
| MVPA | ||
| No activity | 0.00 | |
| 45–675 METs | 0.85 | 0.58, 1.26 |
| 676–2250 METs | 0.84 | 0.57, 1.24 |
| ≥2250 METs | 0.61 *** | 0.48, 0.79 |
| Model 1 | e-Value | ||||
|---|---|---|---|---|---|
| OR | 95%CI | Point Estimate | CI | ||
| Frequency | |||||
| VPA | |||||
| No activity | 0.00 | ||||
| 1–2 d/w | 0.64 * | 0.41, 0.99 | 2.500 | 1.111 | |
| 3–5 d/w | 0.50 ** | 0.32, 0.79 | 3.414 | 1.846 | |
| 6–7 d/w | 0.76 * | 0.58, 0.99 | 1.960 | 1.111 | |
| MPA | |||||
| No activity | 0.00 | ||||
| 1–2 d/w | 0.88 | 0.61, 1.26 | —— | —— | |
| 3–5 d/w | 0.82 | 0.60, 1.12 | —— | —— | |
| 6–7 d/w | 0.94 | 0.73, 1.20 | —— | —— | |
| LPA | |||||
| No activity | 0.00 | ||||
| 1–2 d/w | 0.78 | 0.49, 1.26 | —— | —— | |
| 3–5 d/w | 1.38 | 0.85, 2.22 | —— | —— | |
| 6–7 d/w | 0.93 | 0.73,1.17 | —— | —— | |
| Duration | |||||
| VPA | |||||
| No activity | 0.00 | ||||
| 10–29 min/d | 0.59 | 0.26, 1.34 | —— | —— | |
| 30–119 min/d | 0.97 | 0.62, 1.53 | —— | —— | |
| 120–239 min/d | 0.46 *** | 0.30, 0.71 | 3.771 | 2.167 | |
| ≥240 min/d | 0.67 ** | 0.51, 0.89 | 2.350 | 1.496 | |
| MPA | |||||
| No activity | 0.00 | ||||
| 10–29 min/d | 1.10 | 0.78, 1.55 | —— | —— | |
| 30–119 min/d | 0.99 | 0.72, 1.36 | —— | —— | |
| 120–239 min/d | 0.98 | 0.73, 1.32 | —— | —— | |
| ≥240 min/d | 0.59 ** | 0.42, 0.82 | 2.780 | 1.737 | |
| LPA | |||||
| No activity | 0.00 | 0.59, 1.14 | |||
| 10–29 min/d | 0.82 | —— | —— | ||
| 30–119 min/d | 1.12 | 0.86, 1.47 | —— | —— | |
| 120–239 min/d | 0.94 | 0.70, 1.27 | —— | —— | |
| ≥240 min/d | 0.59 ** | 0.41, 0.85 | 2.780 | 1.632 | |
| Volume | |||||
| VPA | |||||
| No activity | 0.00 | ||||
| 10–74 min/w | 0.44 | 0.13, 1.46 | —— | —— | |
| 75–299 min/w | 0.88 | 0.49, 1.57 | —— | —— | |
| ≥300 min/w | 0.64 ** | 0.50, 0.83 | 2.500 | 1.702 | |
| MPA | |||||
| No activity | 0.00 | ||||
| 10–149 min/w | 1.11 | 0.80, 1.54 | —— | —— | |
| 150–299 min/w | 0.56 * | 0.34, 0.91 | 2.970 | 1.429 | |
| ≥300 min/w | 0.91 | 0.71, 1.15 | —— | —— | |
| LPA | |||||
| No activity | 0.00 | ||||
| 10–105 min/w | 0.83 | 0.60, 1.14 | —— | —— | |
| 106–525 min/w | 1.12 | 0.85, 1.47 | —— | —— | |
| 526–1260 min/w | 0.97 | 0.73, 1.30 | —— | —— | |
| >1260 min/w | 0.56 ** | 0.38, 0.81 | 2.970 | 1.429 | |
| MVPA | |||||
| No activity | 0.00 | ||||
| 45–675 METs | 0.99 | 0.69, 1.42 | —— | —— | |
| 676–2250 METs | 0.85 | 0.58, 1.24 | —— | —— | |
| ≥2250 METs | 0.67 ** | 0.52, 0.87 | 2.350 | 1.564 | |
| Model 1: Male | Model 2: Female | ||||
|---|---|---|---|---|---|
| OR | 95%CI | OR | 95%CI | ||
| Frequency | |||||
| VPA | |||||
| No activity | 0.00 | 0.00 | |||
| 1–2 d/w | 0.67 | 0.36, 1.23 | 0.61 | 0.33, 1.14 | |
| 3–5 d/w | 0.40 * | 0.17, 0.94 | 0.60 * | 0.37, 0.99 | |
| 6–7 d/w | 0.91 | 0.61, 1.35 | 0.62 * | 0.42, 0.90 | |
| MPA | |||||
| No activity | 0.00 | 0.00 | |||
| 1–2 d/w | 0.88 | 0.47, 1.63 | 0.87 | 0.56, 1.36 | |
| 3–5 d/w | 0.94 | 0.58, 1.54 | 0.72 | 0.48, 1.08 | |
| 6–7 d/w | 1.13 | 0.77, 1.66 | 0.83 | 0.60, 1.13 | |
| LPA | |||||
| No activity | 0.00 | 0.00 | |||
| 1–2 d/w | 0.63 | 0.28, 1.45 | 0.87 | 0.48, 1.58 | |
| 3–5 d/w | 1.88 | 0.92, 3.85 | 0.97 | 0.59, 1.59 | |
| 6–7 d/w | 0.84 | 0.59, 1.20 | 1.00 | 0.73, 1.35 | |
| Duration | |||||
| VPA | |||||
| No activity | 0.00 | 0.00 | |||
| 10–29 min/d | 0.36 | 0.08, 1.64 | 0.85 | 0.32, 2.26 | |
| 30–119 min/d | 1.26 | 0.67, 2.39 | 0.75 | 0.41, 1.38 | |
| 120–239 min/d | 0.40 * | 0.20, 0.78 | 0.51 * | 0.30, 0.89 | |
| ≥240 min/d | 0.75 | 0.49, 1.15 | 0.60 * | 0.41, 0.88 | |
| MPA | |||||
| No activity | 0.00 | 0.00 | |||
| 10–29 min/d | 1.14 | 0.62, 2.08 | 1.06 | 0.70, 1.62 | |
| 30–119 min/d | 1.06 | 0.67, 1.68 | 0.93 | 0.62, 1.41 | |
| 120–239 min/d | 1.31 | 0.83, 2.07 | 0.78 | 0.53, 1.14 | |
| ≥240 min/d | 0.76 | 0.46, 1.24 | 0.46 *** | 0.30, 0.73 | |
| LPA | |||||
| No activity | 0.00 | 0.00 | |||
| 10–29 min/d | 0.91 | 0.55, 1.50 | 0.77 | 0.49, 1.19 | |
| 30–119 min/d | 1.15 | 0.76, 1.76 | 1.11 | 0.78, 1.58 | |
| 120–239 min/d | 0.73 | 0.47, 1.14 | 1.10 | 0.75, 1.62 | |
| ≥240 min/d | 0.52 * | 0.29, 0.91 | 0.64 | 0.40, 1.03 | |
| Volume | |||||
| VPA | |||||
| No activity | 0.00 | 0.00 | |||
| 10–74 min/w | 0.26 | 0.03, 2.10 | 0.60 | 0.13, 2.72 | |
| 75–299 min/w | 1.06 | 0.44, 2.55 | 0.74 | 0.37, 1.49 | |
| ≥300 min/w | 0.69 | 0.47, 1.01 | 0.60 ** | 0.43, 0.83 | |
| MPA | |||||
| No activity | 0.00 | 0.00 | |||
| 10–149 min/w | 1.20 | 0.68, 2.14 | 1.04 | 0.70, 1.55 | |
| 150–299 min/w | 0.69 | 0.30, 1.57 | 0.47 * | 0.25, 0.88 | |
| ≥300 min/w | 1.07 | 0.74, 1.55 | 0.80 | 0.59, 1.08 | |
| LPA | |||||
| No activity | 0.00 | 0.00 | |||
| 10–105 min/w | 0.95 | 0.84, 1.55 | 0.76 | 0.49, 1.17 | |
| 106–525 min/w | 1.14 | 0.75, 1.75 | 1.11 | 0.78, 1.58 | |
| 526–1260 min/w | 0.73 | 0.47, 1.14 | 1.15 | 0.79, 1.68 | |
| >1260 min/w | 0.51* | 0.29, 0.91 | 0.59 * | 0.36, 0.97 | |
| MVPA | |||||
| No activity | 0.00 | 0.00 | |||
| 45–675 METs | 0.80 | 0.39, 1.61 | 1.06 | 0.69, 1.64 | |
| 676–2250 METs | 0.75 | 0.44, 1.28 | 0.90 | 0.56, 1.45 | |
| ≥2250 METs | 0.83 | 0.53, 1.30 | 0.56 *** | 0.42, 0.75 | |
References
- Saeedi, P.; Salpea, P.; Karuranga, S.; Petersohn, I.; Malanda, B.; Gregg, E.W.; Unwin, N.; Wild, S.H.; Williams, R. Mortality attributable to diabetes in 20–79 years old adults, 2019 estimates: Results from the International Diabetes Federation Diabetes Atlas, 9(th) edition. Diabetes Res. Clin. Pract. 2020, 162, 108086. [Google Scholar] [CrossRef] [PubMed] [Green Version]
- Saeedi, P.; Petersohn, I.; Salpea, P.; Malanda, B.; Karuranga, S.; Unwin, N.; Colagiuri, S.; Guariguata, L.; Motala, A.A.; Ogurtsova, K.; et al. Global and regional diabetes prevalence estimates for 2019 and projections for 2030 and 2045: Results from the International Diabetes Federation Diabetes Atlas, 9(th) edition. Diabetes Res. Clin. Pract. 2019, 157, 107843. [Google Scholar] [CrossRef] [PubMed] [Green Version]
- Sinclair, A.; Saeedi, P.; Kaundal, A.; Karuranga, S.; Malanda, B.; Williams, R. Diabetes and global ageing among 65–99-year-old adults: Findings from the International Diabetes Federation Diabetes Atlas, 9(th) edition. Diabetes Res. Clin. Pract. 2020, 162, 108078. [Google Scholar] [CrossRef] [PubMed] [Green Version]
- Nanditha, A.; Ma, R.C.; Ramachandran, A.; Snehalatha, C.; Chan, J.C.; Chia, K.S.; Shaw, J.E.; Zimmet, P.Z. Diabetes in Asia and the Pacific: Implications for the Global Epidemic. Diabetes care 2016, 39, 472–485. [Google Scholar] [CrossRef] [PubMed] [Green Version]
- Piercy, K.L.; Troiano, R.P.; Ballard, R.M.; Carlson, S.A.; Fulton, J.E.; Galuska, D.A.; George, S.M.; Olson, R.D. The Physical Activity Guidelines for Americans. JAMA 2018, 320, 2020–2028. [Google Scholar] [CrossRef]
- Zheng, Y.; Ley, S.H.; Hu, F.B. Global aetiology and epidemiology of type 2 diabetes mellitus and its complications. Nat. Rev. Endocrinol. 2018, 14, 88–98. [Google Scholar] [CrossRef]
- Balk, E.M.; Earley, A.; Raman, G.; Avendano, E.A.; Pittas, A.G.; Remington, P.L. Combined Diet and Physical Activity Promotion Programs to Prevent Type 2 Diabetes Among Persons at Increased Risk: A Systematic Review for the Community Preventive Services Task Force. Ann Intern Med. 2015, 163, 437–451. [Google Scholar] [CrossRef] [Green Version]
- Guthold, R.; Stevens, G.A.; Riley, L.M.; Bull, F.C. Worldwide trends in insufficient physical activity from 2001 to 2016: A pooled analysis of 358 population-based surveys with 1·9 million participants. Lancet Glob. Health 2018, 6, e1077–e1086. [Google Scholar] [CrossRef] [Green Version]
- Zou, Q.; Wang, H.; Du, W.; So, C.; Ouyang, Y.; Wang, Z.; Ding, G.; Zhang, B. Trends in Leisure-Time Physical Activity Among Chinese Adults-China, 2000–2015. China CDC Wkly. 2020, 2, 135–139. [Google Scholar] [CrossRef]
- Strath, S.J.; Kaminsky, L.A.; Ainsworth, B.E.; Ekelund, U.; Freedson, P.S.; Gary, R.A.; Richardson, C.R.; Smith, D.T.; Swartz, A.M. American Heart Association Physical Activity Committee of the Council on Lifestyle and Cardiometabolic Health and Cardiovascular, Exercise, Cardiac Rehabilitation and Prevention Committee of the Council on Clinical Cardiology, and Council. Guide to the assessment of physical activity: Clinical and research applications: A scientific statement from the American Heart Association. Circulation 2013, 128, 2259–2279. [Google Scholar]
- Wen, C.P.; Wai, J.P.; Tsai, M.K.; Yang, Y.C.; Cheng, T.Y.; Lee, M.C.; Chan, H.T.; Tsao, C.K.; Tsai, S.P.; Wu, X. Minimum amount of physical activity for reduced mortality and extended life expectancy: A prospective cohort study. Lancet 2011, 378, 1244–1253. [Google Scholar] [CrossRef]
- Lao, X.Q.; Deng, H.B.; Liu, X.; Chan, T.C.; Zhang, Z.; Chang, L.Y.; Yeoh, E.K.; Tam, T.; Wong, M.; Thomas, G.N. Increased leisure-time physical activity associated with lower onset of diabetes in 44 828 adults with impaired fasting glucose: A population-based prospective cohort study. Br. J. Sports Med. 2019, 53, 895–900. [Google Scholar] [CrossRef]
- Divney, A.A.; Murillo, R.; Rodrigue, F.; Mirzayi, C.A.; Tsui, E.K.; Echeverria, S.E. Diabetes Prevalence by Leisure-, Transportation-, and Occupation-Based Physical Activity Among Racially/Ethnically Diverse, U.S. Adults. Diabetes Care 2019, 42, 1241–1247. [Google Scholar] [CrossRef]
- Zhao, Y.; Hu, Y.; Smith, J.P.; Strauss, J.; Yang, G. Cohort profile: The China Health and Retirement Longitudinal Study (CHARLS). Int. J. Epidemiol. 2014, 43, 61–68. [Google Scholar] [CrossRef] [PubMed] [Green Version]
- American Diabetes Association. Standards of medical care in diabetes-2011. Diabetes Care 2011, 34 (Suppl. 1), S11–S61. [Google Scholar] [CrossRef] [PubMed] [Green Version]
- VanderWeele, T.J.; Ding, P. Sensitivity Analysis in Observational Research: Introducing the E-Value. Ann. Intern. Med. 2017, 167, 268–274. [Google Scholar] [CrossRef]
- He, X.; Pan, J.; Pan, M.; Wang, J.; Dong, J.; Yuan, H.; Zhou, L.; Chen, M.; Chen, Y.; Lu, Y.; et al. Dietary and physical activity of adult patients with type 2 diabetes in Zhejiang province of eastern China: Data from a cross-sectional study. J. Diabetes Investig. 2016, 7, 529–538. [Google Scholar] [CrossRef] [PubMed] [Green Version]
- Zhou, Y.; Wu, J.; Zhang, S.; Yan, S.; He, L.; Mkandawire, N.; Song, X.; Gan, Y.; Li, W.; Yang, T.; et al. Prevalence and risk factors of physical inactivity among middle-aged and older Chinese in Shenzhen: A cross-sectional study. BMJ 2018, 8, e019775. [Google Scholar] [CrossRef] [Green Version]
- Franco, M.R.; Tong, A.; Howard, K.; Sherrington, C.; Ferreira, P.H.; Pinto, R.Z.; Ferreira, M.L. Older people’s perspectives on participation in physical activity: A systematic review and thematic synthesis of qualitative literature. Br. J. Sports Med. 2015, 49, 268–276. [Google Scholar] [CrossRef]
- Samra, P.K.; Rebar, A.L.; Parkinson, L.; van Uffelen, J.; Schoeppe, S.; Power, D.; Schneiders, A.; Vandelanotte, C.; Alley, S. Physical Activity Attitudes, Preferences, and Experiences of Regionally-Based Australia Adults Aged 65 Years and Older. J. Aging Phys. Act. 2019, 27, 446–451. [Google Scholar] [CrossRef]
- McPhee, J.S.; French, D.P.; Jackson, D.; Nazroo, J.; Pendleton, N.; Degens, H. Physical activity in older age: Perspectives for healthy ageing and frailty. Biogerontology 2016, 17, 567–580. [Google Scholar] [CrossRef] [PubMed]
- Bangsbo, J.; Bangsbo, J.; Blackwell, J.; Boraxbekk, C.J.; Caserotti, P.; Dela, F.; Evans, A.B.; Jespersen, A.P.; Gliemann, L.; Kramer, A.F.; et al. Copenhagen Consensus statement 2019: Physical activity and ageing. Br. J. Sports Med. 2019, 53, 856–858. [Google Scholar] [CrossRef] [PubMed] [Green Version]
- Sylow, L.; Kleinert, M.; Richter, E.A.; Jensen, T. Exercise-stimulated glucose uptake—Regulation and implications for glycaemic control. Nat. Rev. Endocrinol. 2017, 13, 133–148. [Google Scholar] [CrossRef] [PubMed]
- Kang, J.; Fealy, C.E.; Foucher, J.A.; Scelsi, A.R.; Malin, S.K.; Pagadala, M.; Rocco, M.; Burguera, B.; Kirwan, J.P. Effect of exercise intensity on glucose and insulin metabolism in obese individuals and obese NIDDM patients. Diabetes Care 1996, 19, 341–349. [Google Scholar] [CrossRef]
- Shin, W.Y.; Lee, T.; Jeon, D.H.; Kim, H.C. Diabetes, Frequency of Exercise, and Mortality Over 12 Years: Analysis of the National Health Insurance Service-Health Screening (NHIS-HEALS) Database. J. Korean Med. Sci. 2018, 8, e60. [Google Scholar] [CrossRef] [Green Version]
- Wang, Y.; Lee, D.C.; Brellenthin, A.G.; Eijsvogels, T.; Sui, X.; Church, T.S.; Lavie, C.J.; Blair, S.N. Leisure-Time Running Reduces the Risk of Incident Type 2 Diabetes. Am. J. Med. 2019, 132, 1225–1232. [Google Scholar] [CrossRef]
- Welch, W.A.; Strath, S.J.; Brondino, M.; Walker, R.; Swartz, A.M. Duration-Response of Light-Intensity Physical Activity and Glucose Dynamics in Older Adults. J. Phys. Act. Health 2019, 16, 37–42. [Google Scholar] [CrossRef]
- Balducci, S.; D’Errico, V.; Haxhi, J.; Sacchetti, M.; Orlando, G.; Cardelli, P.; Vitale, M.; Bollanti, L.; Conti, F.; Zanuso, S.; et al. Effect of a Behavioral Intervention Strategy for Adoption and Maintenance of a Physically Active Lifestyle: The Italian Diabetes and Exercise Study 2 (IDES_2): A Randomized Controlled Trial. Diabetes Care 2017, 40, 1444–1452. [Google Scholar] [CrossRef] [Green Version]
- Wahid, A.; Manek, N.; Nichols, M.; Kelly, P.; Foster, C.; Webster, P.; Kaur, A.; Friedemann Smith, C.; Wilkins, E.; Rayner, M.; et al. Quantifying the Association Between Physical Activity and Cardiovascular Disease and Diabetes: A Systematic Review and Meta-Analysis. J. Am. Heart Assoc. 2016, 5, e002495. [Google Scholar] [CrossRef] [Green Version]
- McCarthy, M.; Edwardson, C.L.; Davies, M.J.; Henson, J.; Gray, L.; Khunti, K.; Yates, T. Change in Sedentary Time, Physical Activity, Bodyweight, and HbA1c in High-Risk Adults. Med. Sci. Sports Exerc. 2017, 49, 1120–1125. [Google Scholar] [CrossRef]
- Honda, T.; Kuwahara, K.; Nakagawa, T.; Yamamoto, S.; Hayashi, T.; Mizoue, T. Leisure-time, occupational, and commuting physical activity and risk of type 2 diabetes in Japanese workers: A cohort study. BMC Public Health 2015, 15, 1004. [Google Scholar] [CrossRef] [PubMed] [Green Version]
- Ikehara, S.; Iso, H.; Maruyama, K.; Ukawa, S.; Tamakoshi, A. Japan Collaborative Cohort Study. Television viewing time, walking time, and risk of type 2 diabetes in Japanese men and women: The Japan Collaborative Cohort Study. Prev. Med. 2019, 118, 220–225. [Google Scholar] [CrossRef] [PubMed]
- Wang, J.; Wu, Y.; Ning, F.; Zhang, C.; Zhang, D. The Association between Leisure-Time Physical Activity and Risk of Undetected Prediabetes. J. Diabetes Res. 2017, 2017, 4845108. [Google Scholar] [CrossRef] [PubMed] [Green Version]
- Colley, R.C.; Butler, G.; Garriguet, D.; Prince, S.A.; Roberts, K.C. Comparison of self-reported and accelerometer-measured physical activity in Canadian adults. Health Rep. 2018, 29, 3–15. [Google Scholar]
- Skender, S.; Ose, J.; Chang-Claude, J.; Paskow, M.; Brühmann, B.; Siegel, E.M.; Steindorf, K.; Ulrich, C.M. Accelerometry and physical activity questionnaires - a systematic review. BMC Public Health 2016, 16, 515. [Google Scholar] [CrossRef] [Green Version]
- Izawa, K.P.; Shibata, A.; Ishii, K.; Miyawaki, R.; Oka, K. Associations of low-intensity light physical activity with physical performance in community-dwelling elderly Japanese: A cross-sectional study. PLoS ONE 2017, 12, e0178654. [Google Scholar] [CrossRef] [PubMed] [Green Version]
- Ainsworth, B.E.; Haskell, W.L.; Herrmann, S.D.; Meckes, N.; Bassett, D.R., Jr.; Tudor-Locke, C.; Greer, J.L.; Vezina, J.; Whitt-Glover, M.C.; Leon, A.S. 2011 Compendium of Physical Activities: A second update of codes and MET values. Med. Sci. Sports Exerc. 2011, 43, 1575–1581. [Google Scholar] [CrossRef] [PubMed] [Green Version]


| Variables | Total (n = 6196) | Diabetes (n = 687) | Non-Diabetes (n = 5509) |
|---|---|---|---|
| Gender | |||
| female | 3290(52.62) | 404(58.62) | 2886(51.84) |
| male | 2906(47.38) | 283(41.38) | 2623(48.16) |
| Age | |||
| 45–64 | 4121(66.06) | 430(61.70) | 3691(66.63) |
| 65–93 | 2075(33.94) | 257(38.30) | 1818(33.37) |
| Educational level | |||
| junior high school or less | 4231(65.61) | 464(64.27) | 3767(65.78) |
| senior high school and vocational school | 1870(32.06) | 206(31.42) | 1664(32.14) |
| college or higher | 95(2.34) | 17(4.30) | 78(2.08) |
| Marital status | |||
| married or cohabiting | 5427(87.19) | 597(86.23) | 4830(87.31) |
| separated, divorced or widowed | 741(12.29) | 88(13.53) | 653(12.13) |
| never married | 28(0.52) | 2(0.24) | 26(0.56) |
| Drinking | |||
| never drinks | 3375(53.33) | 390(54.43) | 3070(53.19) |
| quit drinking | 687(10.99) | 106(17.10) | 837(10.20) |
| still drinks | 2134(35.67) | 191(28.47) | 1602(36.61) |
| Smoking | |||
| never smokes | 3483(55.98) | 413(59.02) | 2985(55.58) |
| quit smoking | 981(16.36) | 144(20.49) | 581(15.82) |
| still smokes | 1732(27.66) | 130(20.49) | 1943(28.60) |
| BMI | |||
| underweight | 369(5.88) | 24(3.58) | 345(6.18) |
| normal | 3594(57.80) | 308(45.51) | 3286(59.41) |
| overweight | 1896(31.28) | 288(42.63) | 1608(29.79) |
| obese | 337(5.04) | 67(8.27) | 270(4.62) |
| PA-performing | |||
| no | 669(9.91) | 96(13.12) | 573(9.49) |
| yes | 5527(90.09) | 591(86.88) | 4936(90.51) |
| Model 1 | Model 2 Middle Age | Model 3 Old Age | ||||
|---|---|---|---|---|---|---|
| OR | 95%CI | OR | 95%CI | OR | 95%CI | |
| Frequency | ||||||
| VPA | ||||||
| No activity | 0.00 | 0.00 | 0.00 | |||
| 1–2 d/w | 0.64 * | 0.41, 0.99 | 0.54 * | 0.32, 0.93 | 0.91 | 0.43, 1.93 |
| 3–5 d/w | 0.50 ** | 0.32, 0.79 | 0.53 * | 0.31, 0.92 | 0.35 ** | 0.16, 0.77 |
| 6–7 d/w | 0.76 * | 0.58, 0.99 | 0.60 ** | 0.43, 0.84 | 1.16 | 0.75, 1.81 |
| MPA | ||||||
| No activity | 0.00 | 0.00 | 0.00 | |||
| 1–2 d/w | 0.88 | 0.61, 1.26 | 0.76 | 0.47, 1.22 | 1.13 | 0.62, 2.06 |
| 3–5 d/w | 0.82 | 0.60, 1.12 | 0.74 | 0.50, 1.11 | 0.94 | 0.57, 1.54 |
| 6–7 d/w | 0.94 | 0.73, 1.20 | 0.94 | 0.68, 1.30 | 0.91 | 0.64, 1.29 |
| LPA | ||||||
| No activity | 0.00 | 0.00 | 0.00 | |||
| 1–2 d/w | 0.78 | 0.49, 1.26 | 1.00 | 0.57, 1.77 | 0.53 | 0.23, 1.22 |
| 3–5 d/w | 1.38 | 0.85, 2.22 | 1.61 | 0.86, 3.03 | 0.83 | 0.55, 1.98 |
| 6–7 d/w | 0.93 | 0.73, 1.17 | 0.98 | 0.73, 1.31 | 0.83 | 0.57, 1.22 |
| Duration | ||||||
| VPA | ||||||
| No activity | 0.00 | 0.00 | 0.00 | |||
| 10–29 min/d | 0.59 | 0.26, 1.34 | 0.48 | 0.19, 1.24 | 1.30 | 0.29, 5.89 |
| 30–119 min/d | 0.97 | 0.62, 1.53 | 1.10 | 0.65, 1.88 | 0.74 | 0.31, 1.78 |
| 120–239 min/d | 0.46 *** | 0.30, 0.71 | 0.42 ** | 0.24, 0.71 | 0.57 | 0.29, 1.12 |
| ≥240 min/d | 0.67 ** | 0.51, 0.89 | 0.52 *** | 0.37, 0.73 | 1.14 | 0.73, 1.80 |
| MPA | ||||||
| No activity | 0.00 | 0.00 | 0.00 | |||
| 10–29 min/d | 1.10 | 0.78, 1.55 | 1.05 | 0.68, 1.63 | 1.25 | 0.71, 2.21 |
| 30–119 min/d | 0.99 | 0.72, 1.36 | 0.99 | 0.64, 1.53 | 0.96 | 0.64, 1.44 |
| 120–239 min/d | 0.98 | 0.73, 1.32 | 0.92 | 0.64, 1.34 | 1.06 | 0.66, 1.69 |
| ≥240 min/d | 0.59 ** | 0.42, 0.82 | 0.58 ** | 0.39, 0.87 | 0.56 | 0.31, 1.00 |
| LPA | ||||||
| No activity | 0.00 | 0.00 | 0.00 | |||
| 10–29 min/d | 0.82 | 0.59, 1.14 | 0.93 | 0.61, 1.40 | 0.70 | 0.40, 1.23 |
| 30–119 min/d | 1.12 | 0.86, 1.47 | 1.29 | 0.91, 1.84 | 0.87 | 0.58, 1.32 |
| 120–239 min/d | 0.94 | 0.70, 1.27 | 0.80 | 0.54, 1.18 | 1.13 | 0.71, 1.80 |
| ≥240 min/d | 0.59 ** | 0.41, 0.85 | 0.75 | 0.49, 1.14 | 0.33 ** | 0.15, 0.69 |
| Volume | ||||||
| VPA | ||||||
| No activity | 0.00 | 0.00 | 0.00 | |||
| 10–74 min/w | 0.44 | 0.13, 1.46 | 0.58 | 0.17, 1.93 | N/A | |
| 75–299 min/w | 0.88 | 0.49, 1.57 | 0.90 | 0.46, 1.79 | 0.74 | 0.25, 2.24 |
| ≥300 min/w | 0.64 ** | 0.50, 0.83 | 0.53 *** | 0.3, 0.72 | 0.92 | 0.63, 1.35 |
| MPA | ||||||
| No activity | 0.00 | 0.00 | 0.00 | |||
| 10–149 min/w | 1.11 | 0.80, 1.54 | 1.11 | 0.73, 1.67 | 1.11 | 0.64, 1.93 |
| 150–299 min/w | 0.56 * | 0.34, 0.91 | 0.44 * | 0.22, 0.87 | 0.74 | 0.31, 1.73 |
| ≥300 min/w | 0.91 | 0.71, 1.15 | 0.88 | 0.64, 1.21 | 0.93 | 0.67, 1.29 |
| LPA | ||||||
| No activity | 0.00 | 0.00 | 0.00 | |||
| 10–105 min/w | 0.83 | 0.60, 1.14 | 0.97 | 0.65, 1.45 | 0.66 | 0.38, 1.15 |
| 106–525 min/w | 1.12 | 0.85, 1.47 | 1.27 | 0.89, 1.81 | 0.89 | 0.59, 1.35 |
| 526–1260 min/w | 0.97 | 0.73, 1.30 | 0.84 | 0.57, 1.24 | 1.12 | 0.71, 1.79 |
| >1260 min/w | 0.56 ** | 0.38, 0.81 | 0.70 | 0.46, 1.09 | 0.32 ** | 0.15, 0.69 |
| MVPA | ||||||
| No activity | 0.00 | 0.00 | 0.00 | |||
| 45–675 METs | 0.99 | 0.69, 1.42 | 0.95 | 0.60, 1.51 | 1.01 | 0.54, 1.87 |
| 676–2250 METs | 0.85 | 0.58, 1.24 | 0.78 | 0.47, 1.31 | 0.98 | 0.63, 1.52 |
| ≥2250 METs | 0.67 ** | 0.52, 0.87 | 0.58 ** | 0.42, 0.81 | 0.82 | 0.56, 1.18 |
Publisher’s Note: MDPI stays neutral with regard to jurisdictional claims in published maps and institutional affiliations. |
© 2020 by the authors. Licensee MDPI, Basel, Switzerland. This article is an open access article distributed under the terms and conditions of the Creative Commons Attribution (CC BY) license (http://creativecommons.org/licenses/by/4.0/).
Share and Cite
Zeng, Z.; Bian, Y.; Cui, Y.; Yang, D.; Wang, Y.; Yu, C. Physical Activity Dimensions and Its Association with Risk of Diabetes in Middle and Older Aged Chinese People. Int. J. Environ. Res. Public Health 2020, 17, 7803. https://doi.org/10.3390/ijerph17217803
Zeng Z, Bian Y, Cui Y, Yang D, Wang Y, Yu C. Physical Activity Dimensions and Its Association with Risk of Diabetes in Middle and Older Aged Chinese People. International Journal of Environmental Research and Public Health. 2020; 17(21):7803. https://doi.org/10.3390/ijerph17217803
Chicago/Turabian StyleZeng, Zixin, Yuqian Bian, Yiran Cui, Donghui Yang, Yafeng Wang, and Chuanhua Yu. 2020. "Physical Activity Dimensions and Its Association with Risk of Diabetes in Middle and Older Aged Chinese People" International Journal of Environmental Research and Public Health 17, no. 21: 7803. https://doi.org/10.3390/ijerph17217803