Analysis of Antibiotic Use Patterns and Trends Based on Procurement Data of Healthcare Institutions in Shaanxi Province, Western China, 2015–2018

 , and
, and
Abstract
:1. Introduction
2. Method
2.1. Study Setting
2.2. Data Source
2.3. Data Analysis
- Yi: The adjusted DDDs in a given year in a certain type of healthcare institution i;
- Mi: DDDs used in a given year in a certain type of healthcare institution i;
- ni: Number of a certain type of healthcare institution i in the procurement platform;
- Ni: The total number of a certain type of healthcare institution i in the Health Statistics Yearbook.
3. Results
4. Discussion
5. Conclusions
Author Contributions
Funding
Acknowledgments
Conflicts of Interest
References
- Goossens, H.; Ferech, M.; Stichele, R.V.; Elseviers, M.; Grp, E.P. Outpatient antibiotic use in Europe and association with resistance: A cross-national database study. Lancet 2005, 365, 579–587. [Google Scholar] [CrossRef]
- Hsu, L.Y.; Tan, T.Y.; Tam, V.H.; Kwa, A.; Fisher, D.A.; Koh, T.H. Surveillance and Correlation of Antibiotic Prescription and Resistance of Gram-Negative Bacteria in Singaporean Hospitals. Antimicrob. Agents Chemother. 2010, 54, 1173–1178. [Google Scholar] [CrossRef] [PubMed] [Green Version]
- Van Boeckel, T.P.; Gandra, S.; Ashok, A.; Caudron, Q.; Grenfell, B.T.; Levin, S.A.; Laxminarayan, R. Global antibiotic consumption 2000 to 2010: An analysis of Cross Mark 742 national pharmaceutical sales data. Lancet Infect. Dis. 2014, 14, 742–750. [Google Scholar] [CrossRef]
- Ghafur, A. Overconsumption of antibiotics. Lancet Infect. Dis. 2015, 15, 377. [Google Scholar] [CrossRef]
- O’Neill, J. Antimicrobial Resistance: Tackling a Crisis for the Health and Wealth of Nations. 2014. Available online: https://amr-review.org/ (accessed on 14 April 2020).
- WHO. Antimicrobial Resistance: No Action Today, No Cure Tomorrow. 2011. Available online: https://www.who.int/dg/speeches/detail/antimicrobial-resistance-no-action-today-no-cure-tomorrow (accessed on 26 January 2020).
- WHO. Global Action Plan on Antimicrobial Resistance. 2015. Available online: https://www.who.int/antimicrobial-resistance/publications/global-action-plan/en/ (accessed on 26 January 2020).
- G20 Summits. G20 Leaders’ Declaration: Shaping an Interconnected World. 2017. Available online: http://www.g20.utoronto.ca/2017/2017-G20-leaders-declaration.html (accessed on 26 January 2020).
- G20 Summits. Communiqué of the G20 Leaders, Hangzhou, China, 2016. 2016. Available online: http://www.g20chn.org/hywj/dncgwj/201609/t20160906_3392.html (accessed on 26 January 2020).
- WHO. United Nations High-Level Meeting on Antimicrobial Resistance. 2016. Available online: https://www.who.int/antimicrobial-resistance/events/UNGA-meeting-amr-sept2016/en/ (accessed on 26 January 2020).
- Goff, D.A.; Kullar, R.; Goldstein, E.J.C.; Gilchrist, M.; Nathwani, D.; Cheng, A.C.; Cairns, K.A.; Escandon-Vargas, K.; Villegas, M.V.; Brink, A.; et al. A global call from five countries to collaborate in antibiotic stewardship: United we succeed, divided we might fail. Lancet Infect. Dis 2017, 17, E56–E63. [Google Scholar] [CrossRef] [Green Version]
- Wallinga, D.; Rayner, G.; Lang, T. Antimicrobial resistance and biological governance: Explanations for policy failure. Public Health 2015, 129, 1314–1325. [Google Scholar] [CrossRef] [PubMed]
- Zhang, Q.Q.; Ying, G.G.; Pan, C.G.; Liu, Y.S.; Zhao, J.L. Comprehensive Evaluation of Antibiotics Emission and Fate in the River Basins of China: Source Analysis, Multimedia Modeling, and Linkage to Bacterial Resistance. Environ. Sci. Technol. 2015, 49, 6772–6782. [Google Scholar] [CrossRef] [PubMed]
- Ministry of Health of China. Nationwide Special Rectification of Clinical Application of Antibiotics. 2011. Available online: http://www.nhc.gov.cn/yzygj/new_index.shtml (accessed on 14 April 2020).
- Guan, X.D.; Liang, H.G.; Xue, Y.J.; Shi, L.W. An analysis of China’s national essential medicines policy. J. Public Health Policy 2011, 32, 305–319. [Google Scholar] [CrossRef] [PubMed]
- Yi, H.M.; Miller, G.; Zhang, L.X.; Li, S.P.; Rozelle, S. Intended and Unintended Consequences of China’s Zero Markup Drug Policy. Health Aff. (Millwood) 2015, 34, 1391–1398. [Google Scholar] [CrossRef] [PubMed] [Green Version]
- National Health and Family Planning Commission of the People’s Republic of China. China’s National Action Plan to Contain Antimicrobial Resistance. 2016. Available online: http://www.nhc.gov.cn/yzygj/s3593/201608/f1ed26a0c8774e1c8fc89dd481ec84d7.shtml (accessed on 14 April 2020).
- Health Commission of Shaanxi Province. Notice on the Issuance of the Catalogue of Hierarchical Management of Clinical Application of Antimicrobial Drugs in Shanxi Province. 2012. Available online: http://sxwjw.shaanxi.gov.cn/ (accessed on 14 April 2020).
- China Antimicrobial Resistance Surveillance System. China Antimicrobial Resistance Surveillance Report in 2018. 2019. Available online: http://www.carss.cn/Report/Details?aId=648 (accessed on 14 April 2020).
- Shaanxi Provincial Bureau of Statistics. Shaanxi Statistical Yearbook. 2019. Available online: http://tjj.shaanxi.gov.cn/upload/2020/pro/3sxtjnj/zk/indexch.htm (accessed on 14 April 2020).
- National Bureau of Statistics Gross Domestic Product. 2018. Available online: http://data.stats.gov.cn/easyquery.htm?cn=E0103 (accessed on 14 April 2020).
- National Health Commission of the People’s Republic of China. China Health Statistics Yearbook. 2019. Available online: http://www.nhc.gov.cn/wjw/index.shtml (accessed on 14 April 2020).
- WHO. Guidelines for ATC Classification and DDD Assignment 2017. 2017. Available online: https://www.whocc.no/atc_ddd_index/ (accessed on 26 January 2020).
- WHO. WHO Model List of Essential Medicines (20th List). 2017. Available online: https://www.who.int/medicines/publications/essentialmedicines/20th_EML2017.pdf?%20ua= (accessed on 26 January 2020).
- Adriaenssens, N.; Coenen, S.; Versporten, A.; Muller, A.; Vankerckhoven, V.; Goossens, H. European Surveillance of Antimicrobial Consumption (ESAC): Quality appraisal of antibiotic use in Europe. J. Antimicrob. Chemother. 2011, 66, 71–77. [Google Scholar] [CrossRef] [PubMed] [Green Version]
- European Centre for Disease Prevention and Control (ECDC). Quality Indicators for Antibiotic Consumption in the Community. 2018. Available online: https://ecdc.europa.eu/en/antimicrobial-consumption/database/quality-indicators (accessed on 26 January 2020).
- WHO. WHO Report on Surveillance of Antibiotic Consumption: 2016–2018 Early implementation. 2018. Available online: https://www.who.int/medicines/areas/rational_use/oms-amr-amc-report-2016–2018/en/ (accessed on 26 January 2020).
- Lin, H.; Dyar, O.J.; Rosales-Klintz, S.; Zhang, J.; Tomson, G.; Hao, M.; Stalsby Lundborg, C. Trends and patterns of antibiotic consumption in Shanghai municipality, China: A 6 year surveillance with sales records, 2009–14. J. Antimicrob. Chemother. 2016, 71, 1723–1729. [Google Scholar] [CrossRef] [PubMed] [Green Version]
- Yin, J.; Li, Q.W.; Sun, Q. Antibiotic consumption in Shandong Province, China: An analysis of provincial pharmaceutical centralized bidding procurement data at public healthcare institutions, 2012–16. J. Antimicrob. Chemother. 2018, 73, 814–820. [Google Scholar] [CrossRef] [PubMed]
- Zhang, X.; Cui, Y.; Liu, C.; Zuo, K.; Tang, Y. Antibiotic Sales in Primary Care in Hubei Province, China: An Analysis of 2012–2017 Procurement Records. Int. J. Environ. Res. Public Health 2019, 16, 3376. [Google Scholar] [CrossRef] [PubMed] [Green Version]
- Chang, J.; Xu, S.; Zhu, S.; Li, Z.J.; Yu, J.L.; Zhang, Y.; Zu, J.; Fang, Y.; Ross-Degnan, D. Assessment of non-prescription antibiotic dispensing at community pharmacies in China with simulated clients: A mixed cross-sectional and longitudinal study. Lancet Infect. Dis. 2019, 19, 1345–1354. [Google Scholar] [CrossRef]
- Coenen, S.; Muller, A.; Adriaenssens, N.; Vankerckhoven, V.; Hendrickx, E.; Goossens, H. European Surveillance of Antimicrobial Consumption (ESAC): Outpatient parenteral antibiotic treatment in Europe. J. Antimicrob. Chemother. 2009, 64, 200–205. [Google Scholar] [CrossRef] [PubMed]
- Reynolds, L.; McKee, M. Serve the people or close the sale? Profit-driven overuse of injections and infusions in China’s market-based healthcare system. Int. J. Health Plan. Manag. 2011, 26, 449–470. [Google Scholar] [CrossRef] [PubMed]
- Health Commission of Shaanxi Province. Notice on Strengthening the Management of Intravenous Infusion in Village Clinics. 2016. Available online: http://sxwjw.shaanxi.gov.cn/ (accessed on 14 April 2020).
- Xiao, Y.H. Antimicrobial Stewardship in China: Systems, Actions and Future Strategies. Clin. Infect. Dis. 2018, 67, S135–S141. [Google Scholar] [CrossRef] [PubMed]
- Robertson, J.; Iwamoto, K.; Hoxha, I.; Ghazaryan, L.; Abilova, V.; Cvijanovic, A.; Pyshnik, H.; Darakhvelidze, M.; Makalkina, L.; Jakupi, A.; et al. Antimicrobial Medicines Consumption in Eastern Europe and Central Asia—An Updated Cross-National Study and Assessment of Quantitative Metrics for Policy Action. Front. Pharmacol. 2019, 9, 1156. [Google Scholar] [CrossRef] [PubMed] [Green Version]
- Du, B.; Chen, D.C.; Liu, D.W.; Long, Y.; Shi, Y.; Wang, H.; Rui, X.; Cui, N. Restriction of third-generation cephalosporin use decreases infection-related mortality. Crit. Care Med. 2003, 31, 1088–1093. [Google Scholar] [CrossRef] [PubMed]


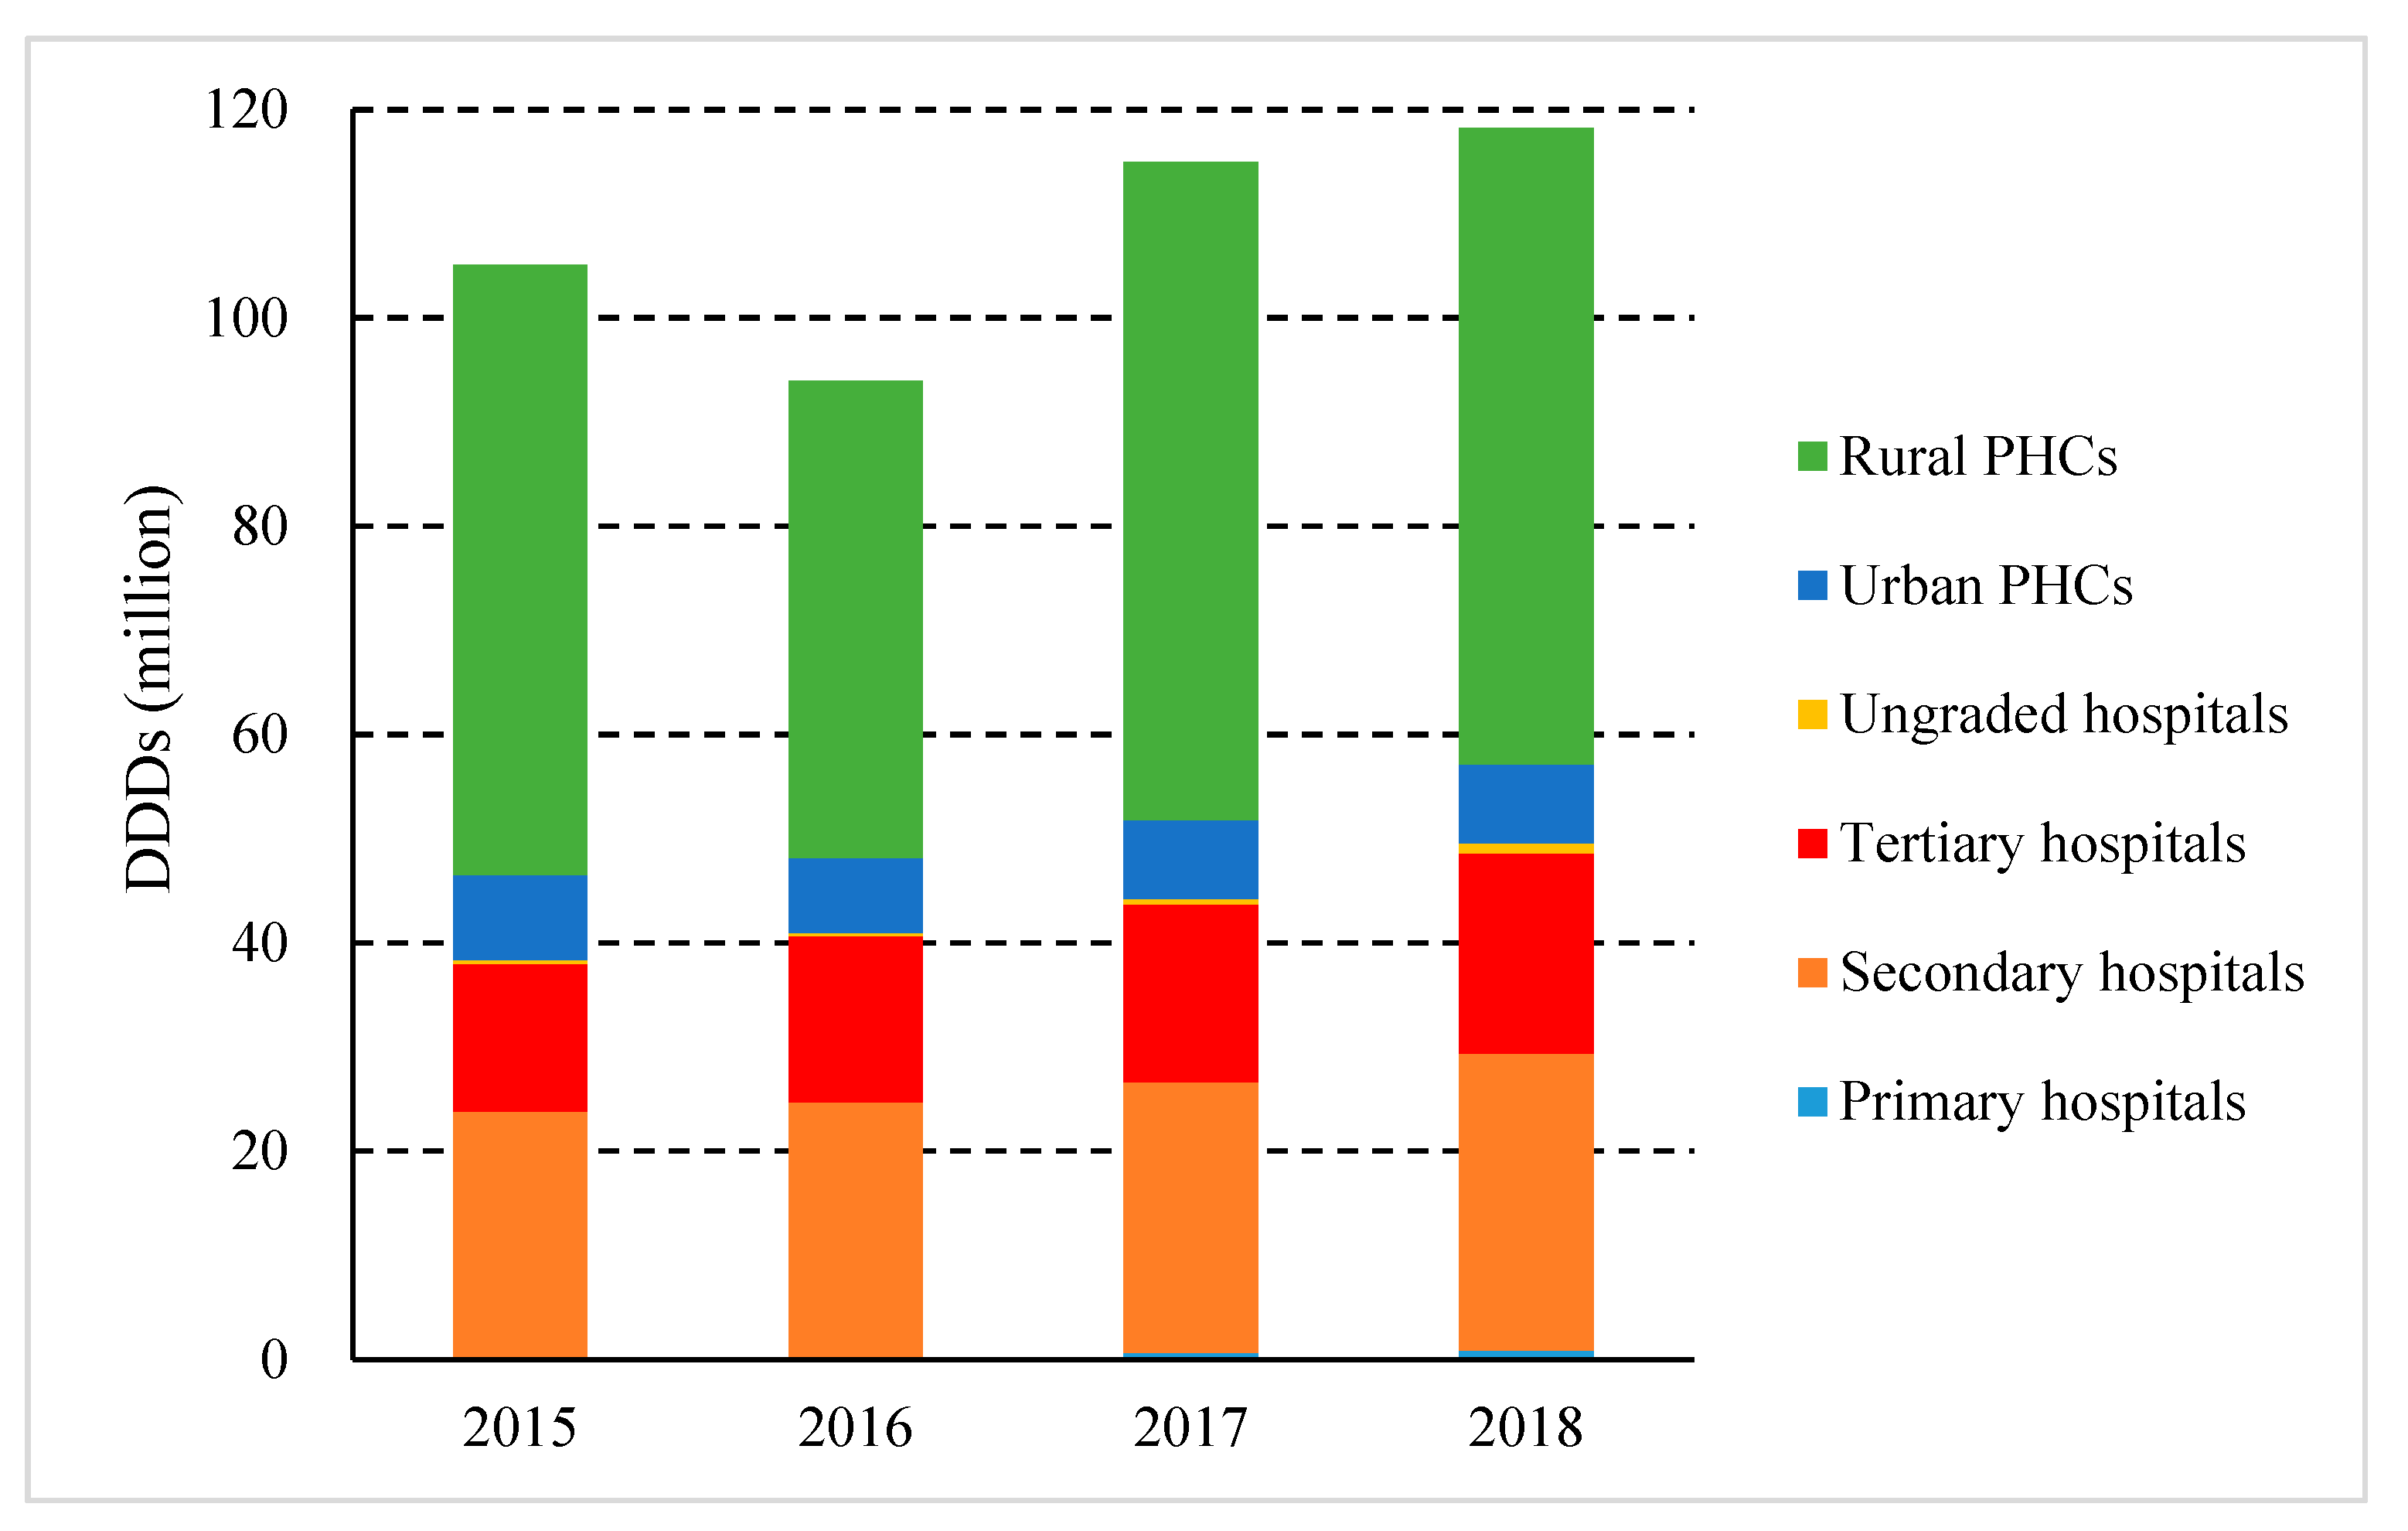
| Year | Primary Hospitals | Secondary Hospitals | Tertiary Hospitals | Ungraded Hospitals | Urban PHCs | Rural PHCs |
|---|---|---|---|---|---|---|
| 2015 | 9 | 217 | 48 | 15 | 149 | 1220 |
| 2016 | 9 | 224 | 47 | 14 | 150 | 1213 |
| 2017 | 62 | 235 | 48 | 28 | 162 | 1264 |
| 2018 | 54 | 231 | 48 | 23 | 155 | 1225 |
| Year | 2015 | 2016 | 2017 | 2018 | |
|---|---|---|---|---|---|
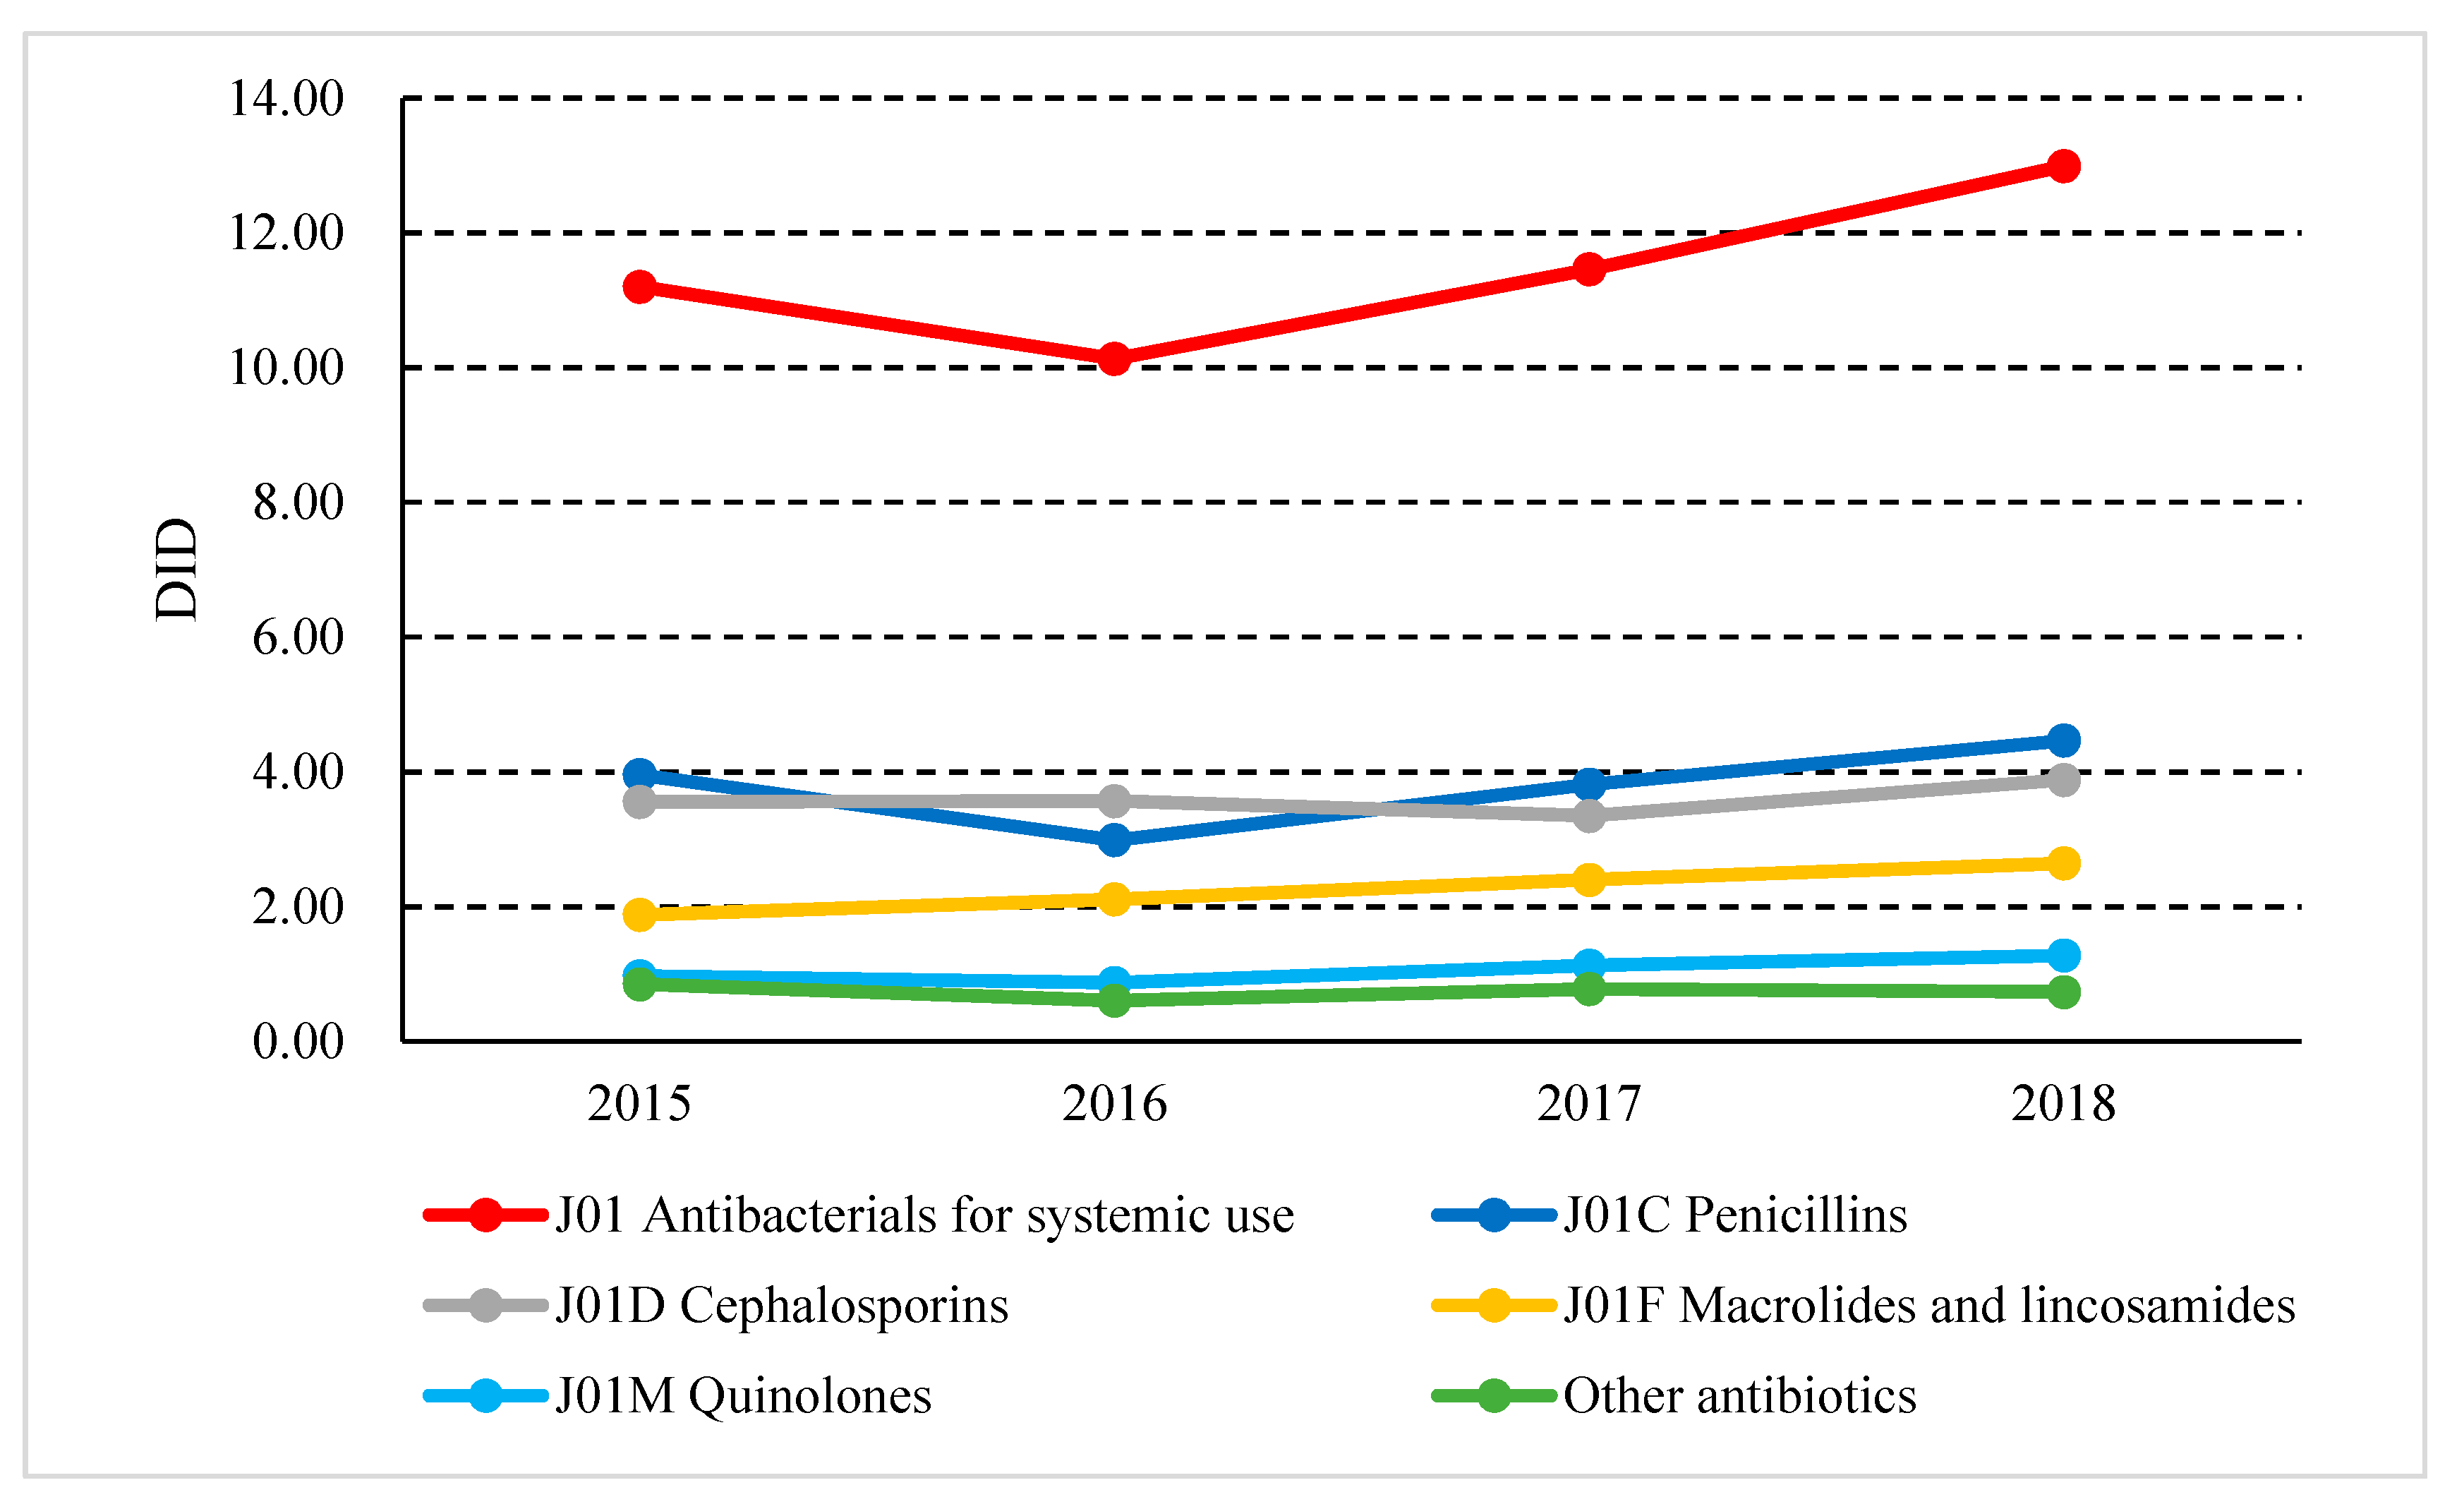
| Absolute Use | J01_DID | 11.20 | 10.13 | 11.46 | 12.99 |
| J01C_DID | 3.95 | 2.99 | 3.81 | 4.47 | |
| J01D_DID | 3.55 | 3.57 | 3.35 | 3.88 | |
| J01F_DID | 1.88 | 2.11 | 2.40 | 2.64 | |
| J01M_DID | 0.97 | 0.87 | 1.13 | 1.27 | |
| Relative Use | J01CE_% | 1.19% | 1.21% | 1.18% | 1.01% |
| J01CR_% | 4.82% | 6.30% | 7.59% | 8.07% | |
| J01DD + DE_% | 11.63% | 13.41% | 12.84% | 13.42% | |
| J01MA_% | 7.67% | 7.52% | 9.66% | 9.72% | |
| Broad/Narrow | J01_B/N | 3.41 | 5.74 | 5.76 | 6.24 |
| Seasonal Variations | J01_SV | 34.14% | 8.30% | 21.04% | N/A |
| J01M_SV | 9.44% | 1.36% | 11.09% | N/A | |
 values within the fourth quartile (i.e., p75–p100),
  values within the third quartile (i.e., p50–p75),
  values within the second quartile (i.e., p25–p50),
  values within the first quartile (i.e., p0–p25).
Publisher’s Note: MDPI stays neutral with regard to jurisdictional claims in published maps and institutional affiliations. |
© 2020 by the authors. Licensee MDPI, Basel, Switzerland. This article is an open access article distributed under the terms and conditions of the Creative Commons Attribution (CC BY) license (http://creativecommons.org/licenses/by/4.0/).
Share and Cite
Xu, S.; Yuan, S.; Kabba, J.A.; Chen, C.; Liu, W.; Chang, J.; Fang, Y. Analysis of Antibiotic Use Patterns and Trends Based on Procurement Data of Healthcare Institutions in Shaanxi Province, Western China, 2015–2018. Int. J. Environ. Res. Public Health 2020, 17, 7536. https://doi.org/10.3390/ijerph17207536
Xu S, Yuan S, Kabba JA, Chen C, Liu W, Chang J, Fang Y. Analysis of Antibiotic Use Patterns and Trends Based on Procurement Data of Healthcare Institutions in Shaanxi Province, Western China, 2015–2018. International Journal of Environmental Research and Public Health. 2020; 17(20):7536. https://doi.org/10.3390/ijerph17207536
Chicago/Turabian StyleXu, Sen, Shengfang Yuan, John Alimamy Kabba, Chen Chen, Wenchen Liu, Jie Chang, and Yu Fang. 2020. "Analysis of Antibiotic Use Patterns and Trends Based on Procurement Data of Healthcare Institutions in Shaanxi Province, Western China, 2015–2018" International Journal of Environmental Research and Public Health 17, no. 20: 7536. https://doi.org/10.3390/ijerph17207536