The Physiological Experimental Study on the Effect of Different Color of Safety Signs on a Virtual Subway Fire Escape—An Exploratory Case Study of Zijing Mountain Subway Station


Abstract
:1. Introduction
2. Materials and Methods
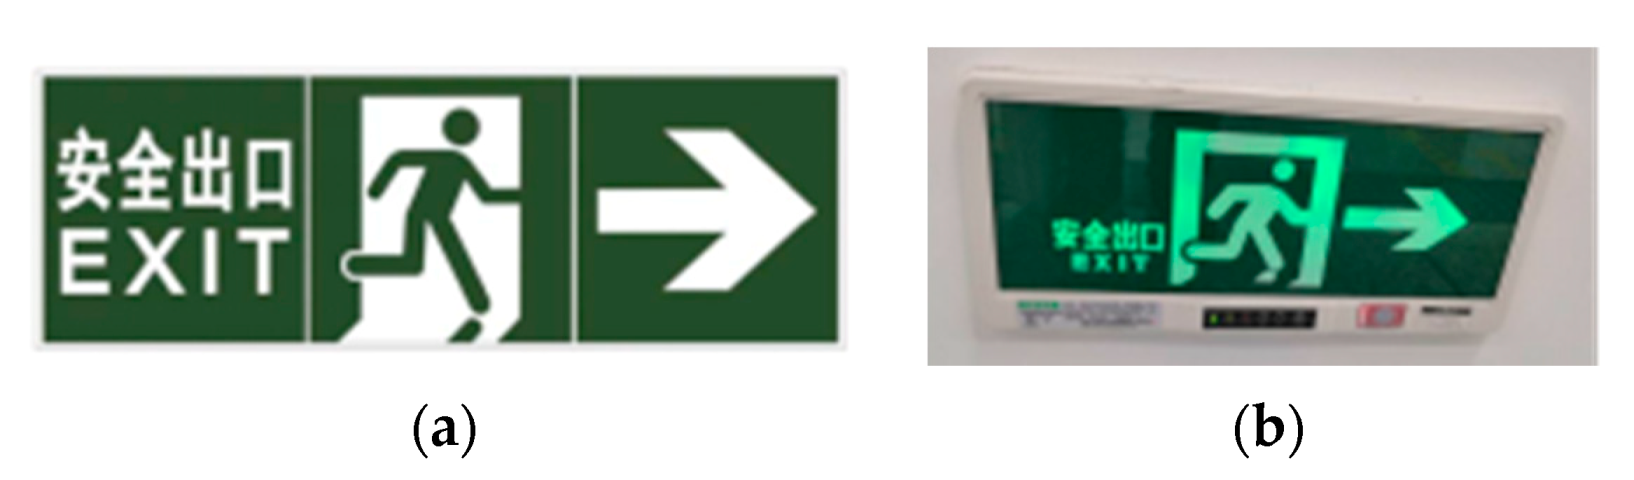
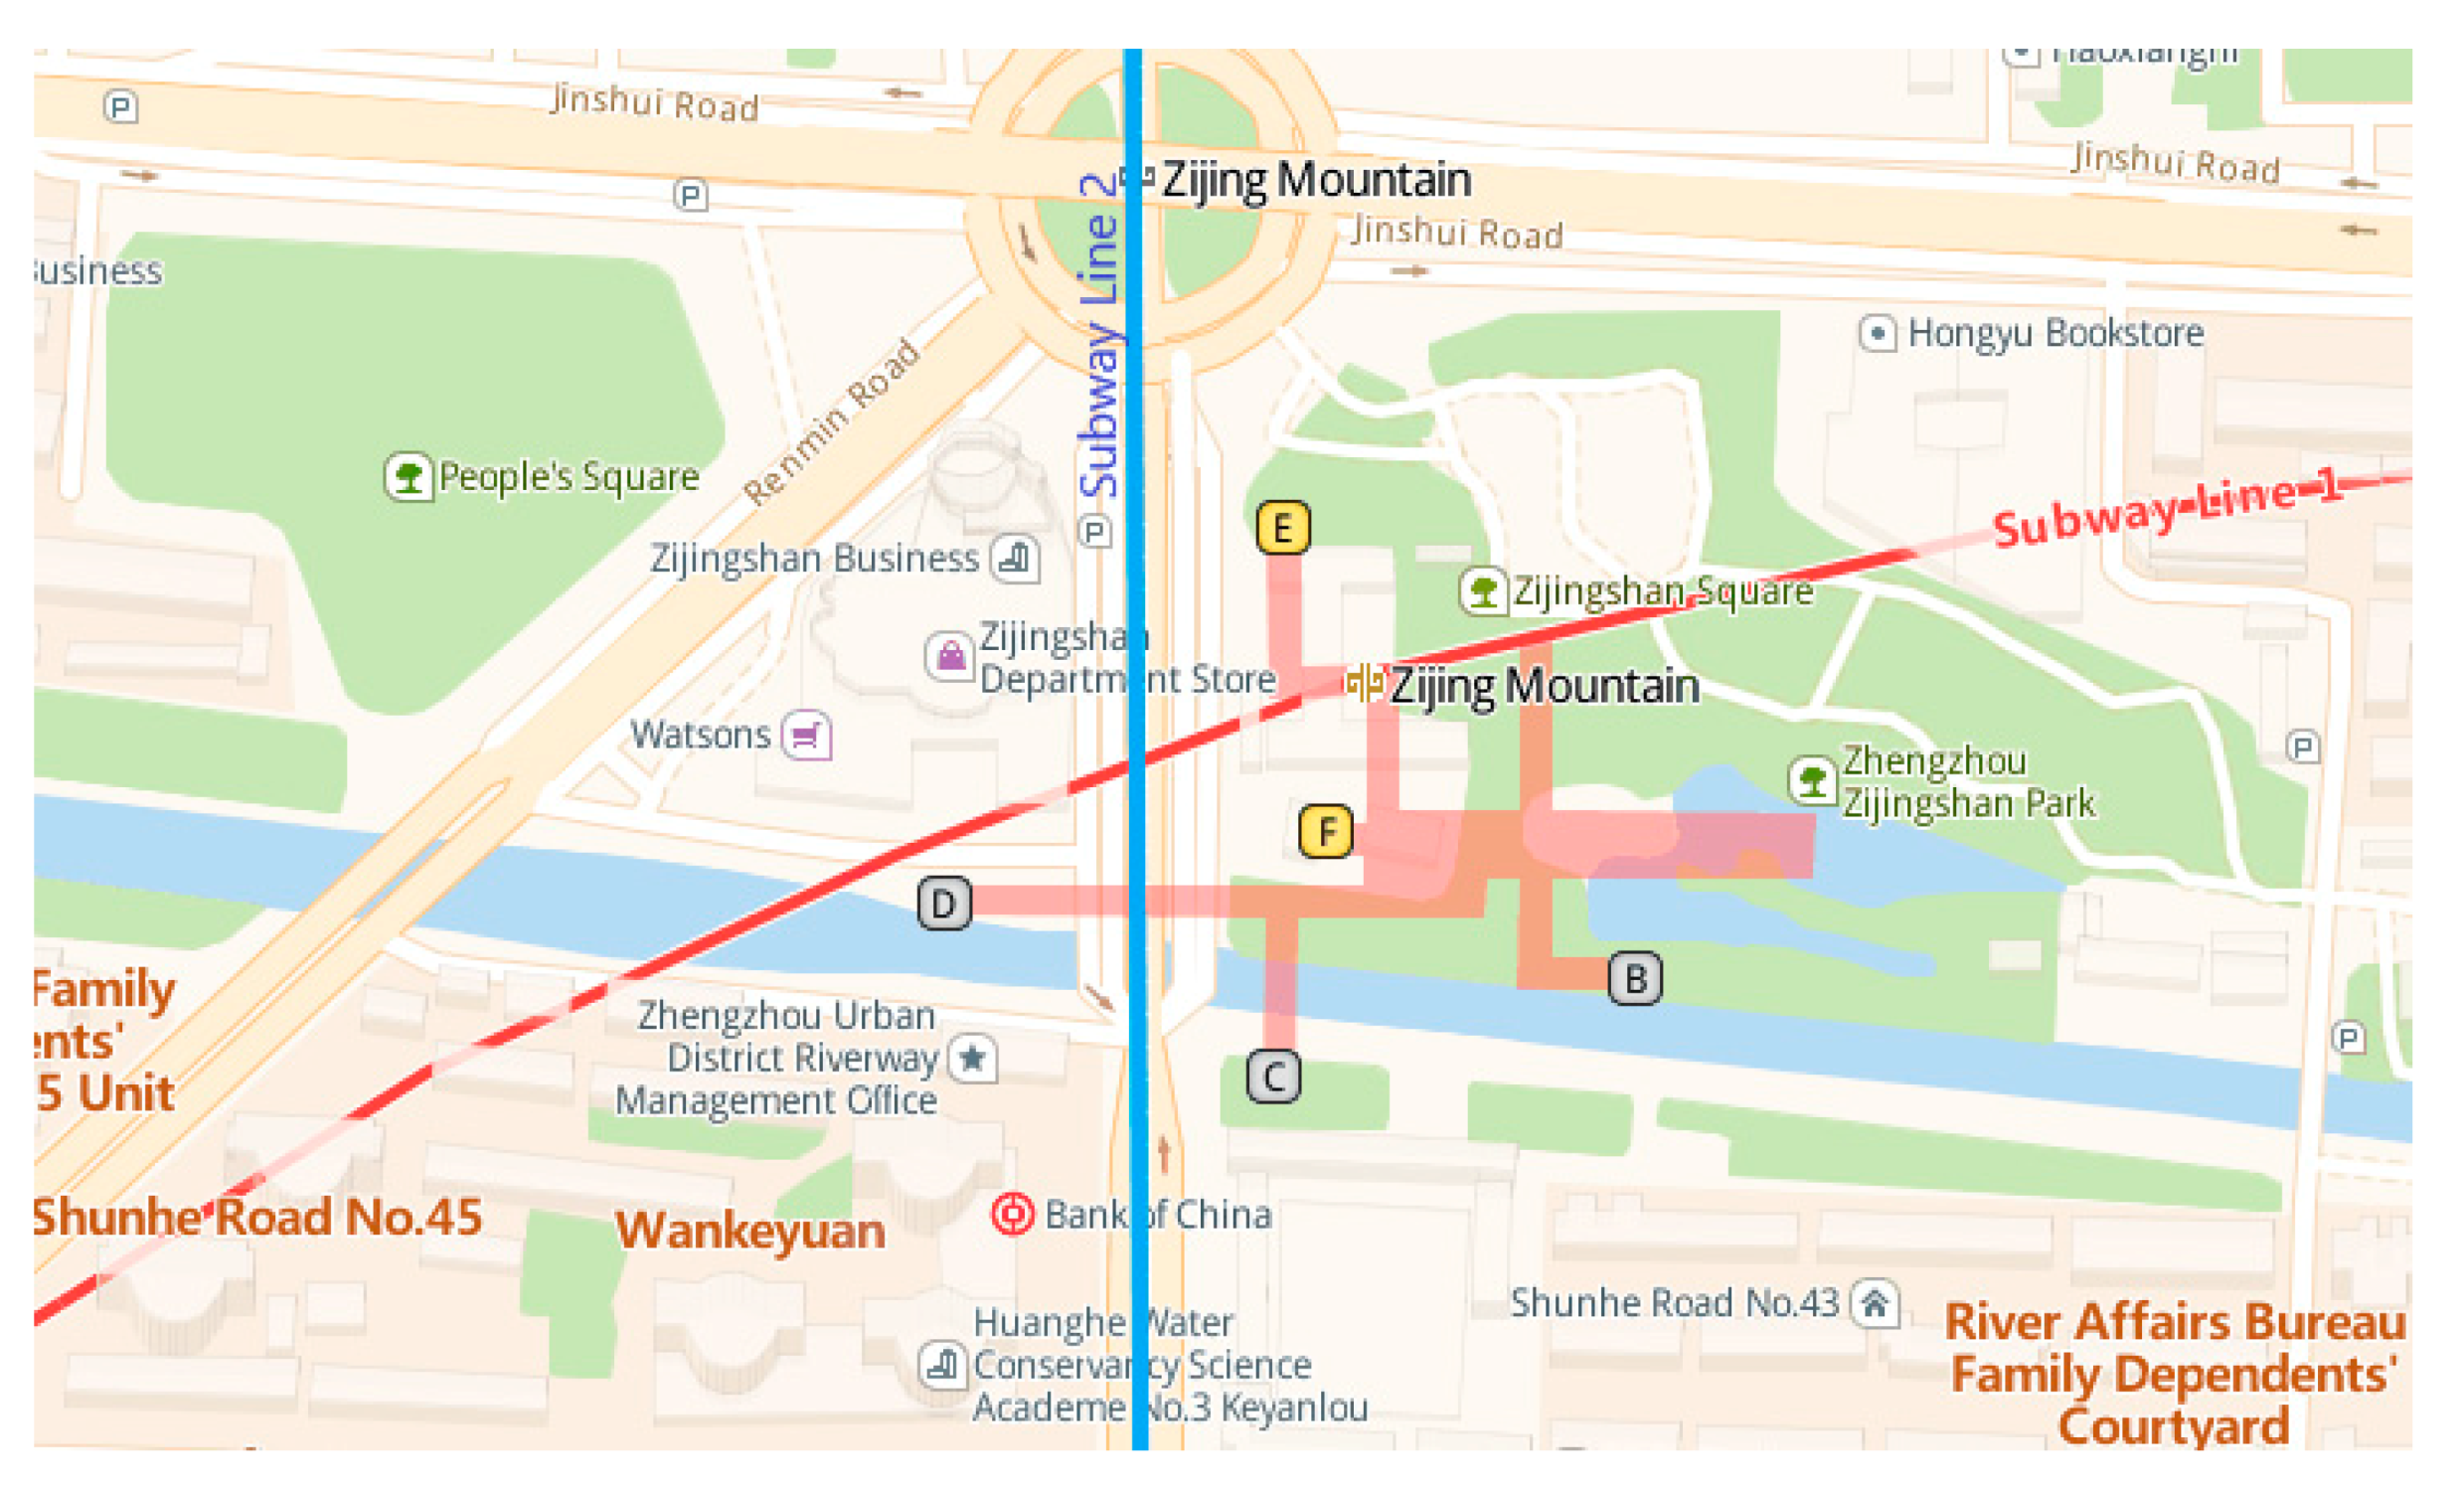
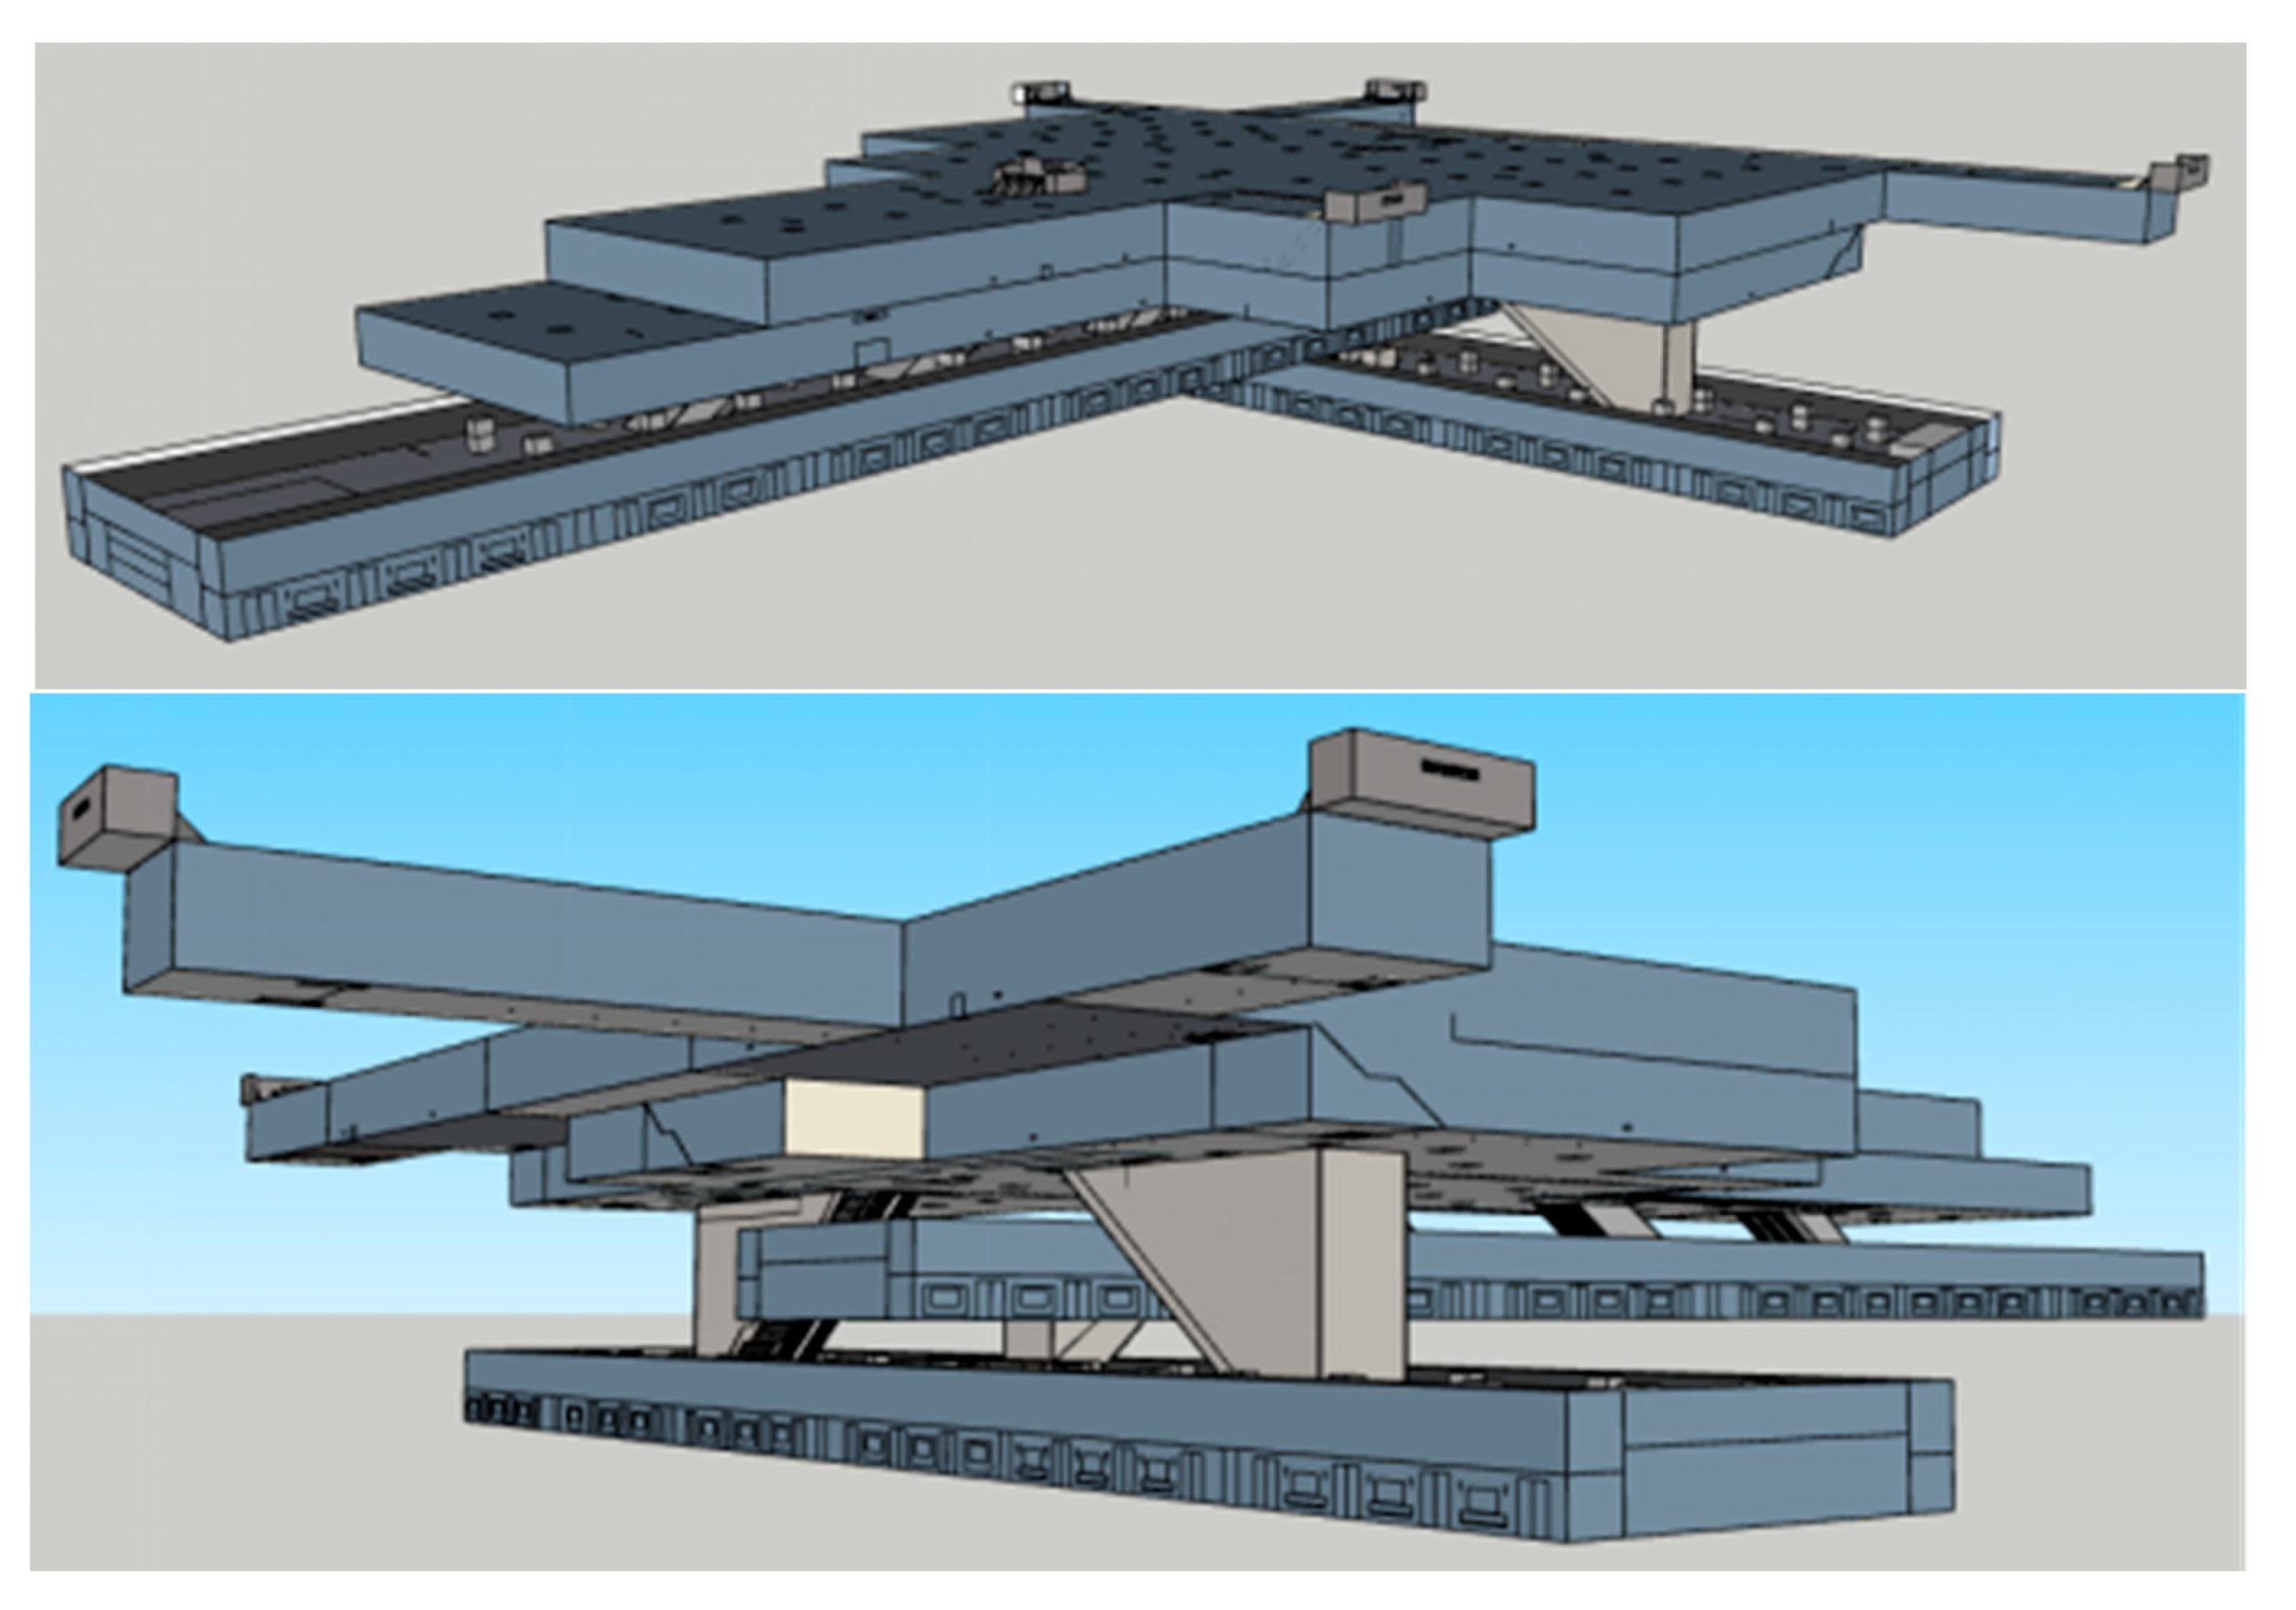
2.1. Case Study
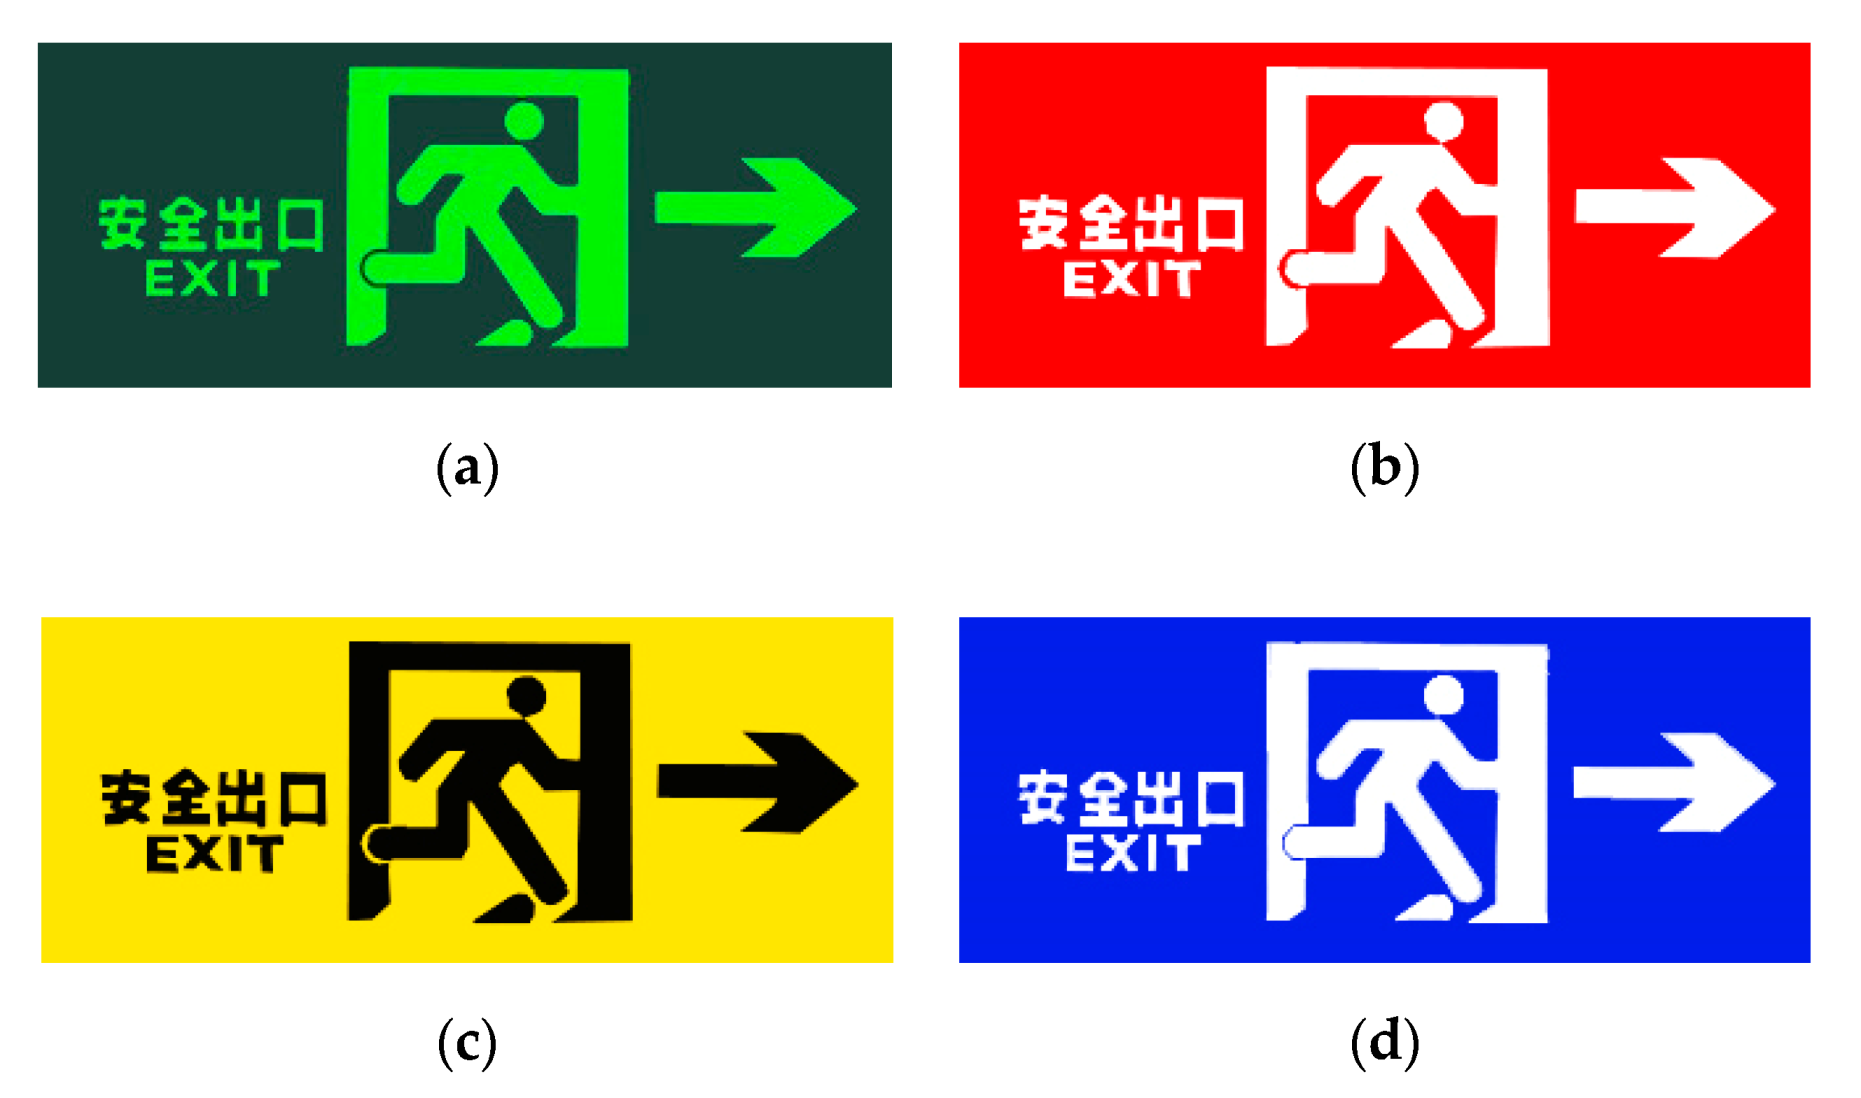
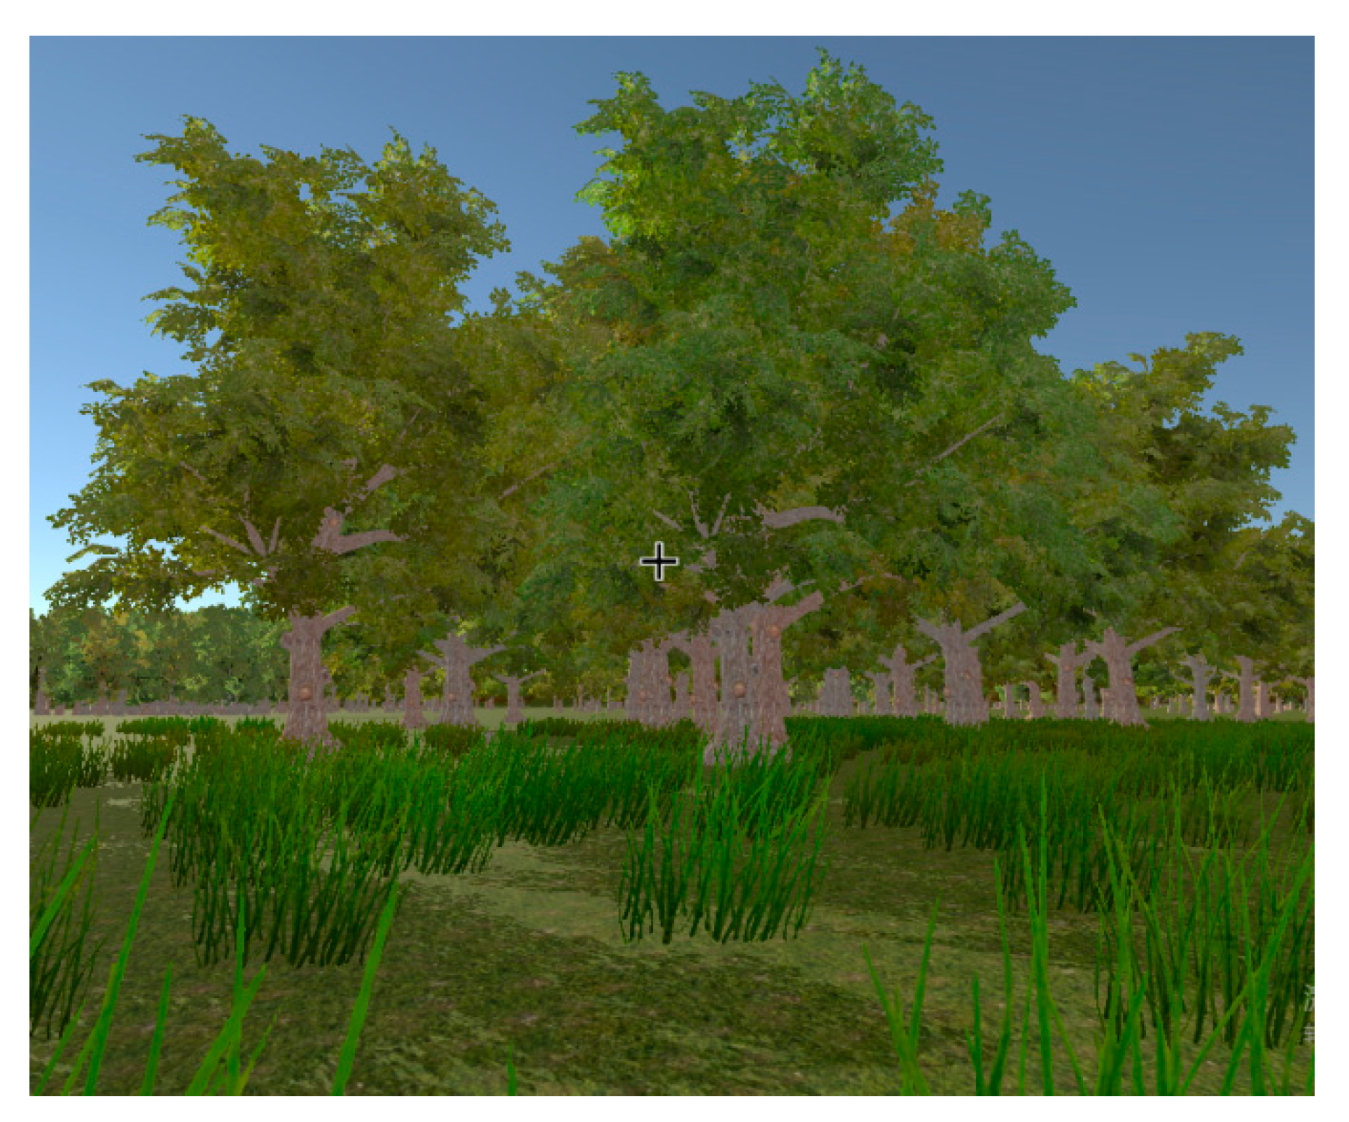
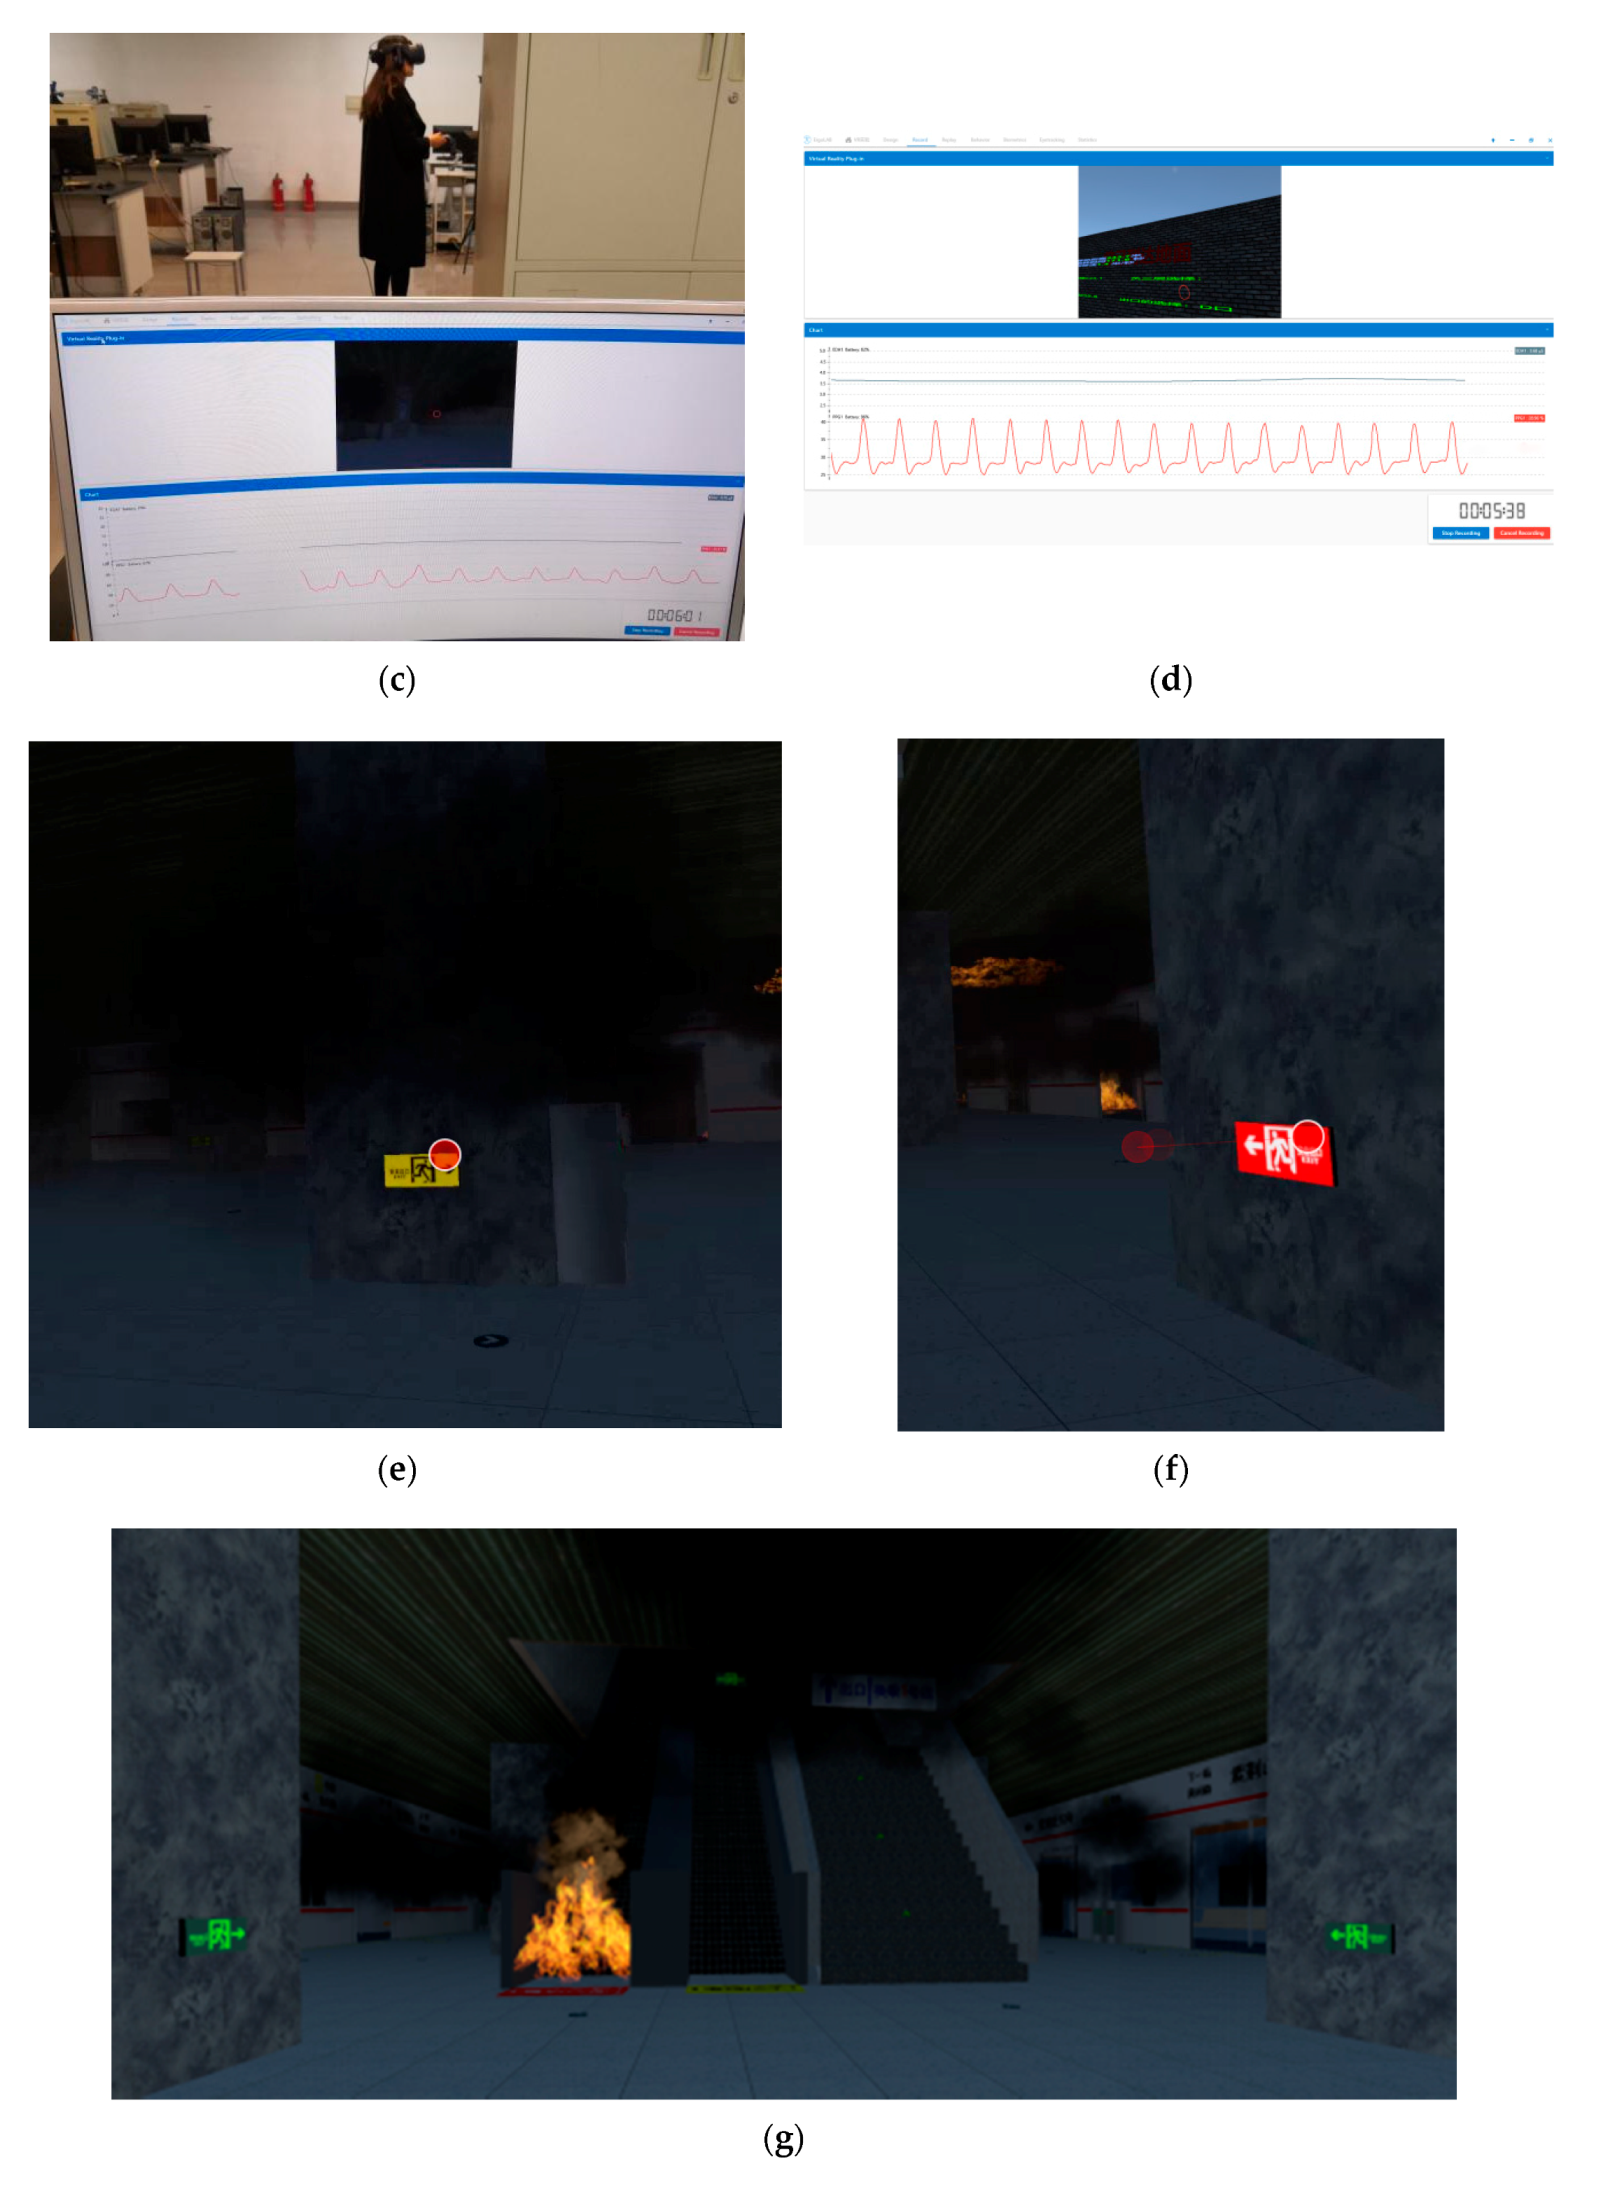
2.2. Virtual Scene Settings
- (1)
- The design of four different color combinations of safety signs
- (2)
- The illumination and brightness Settings
- (3)
- Moving speed Setting
- (4)
- Other Settings
2.3. Participants
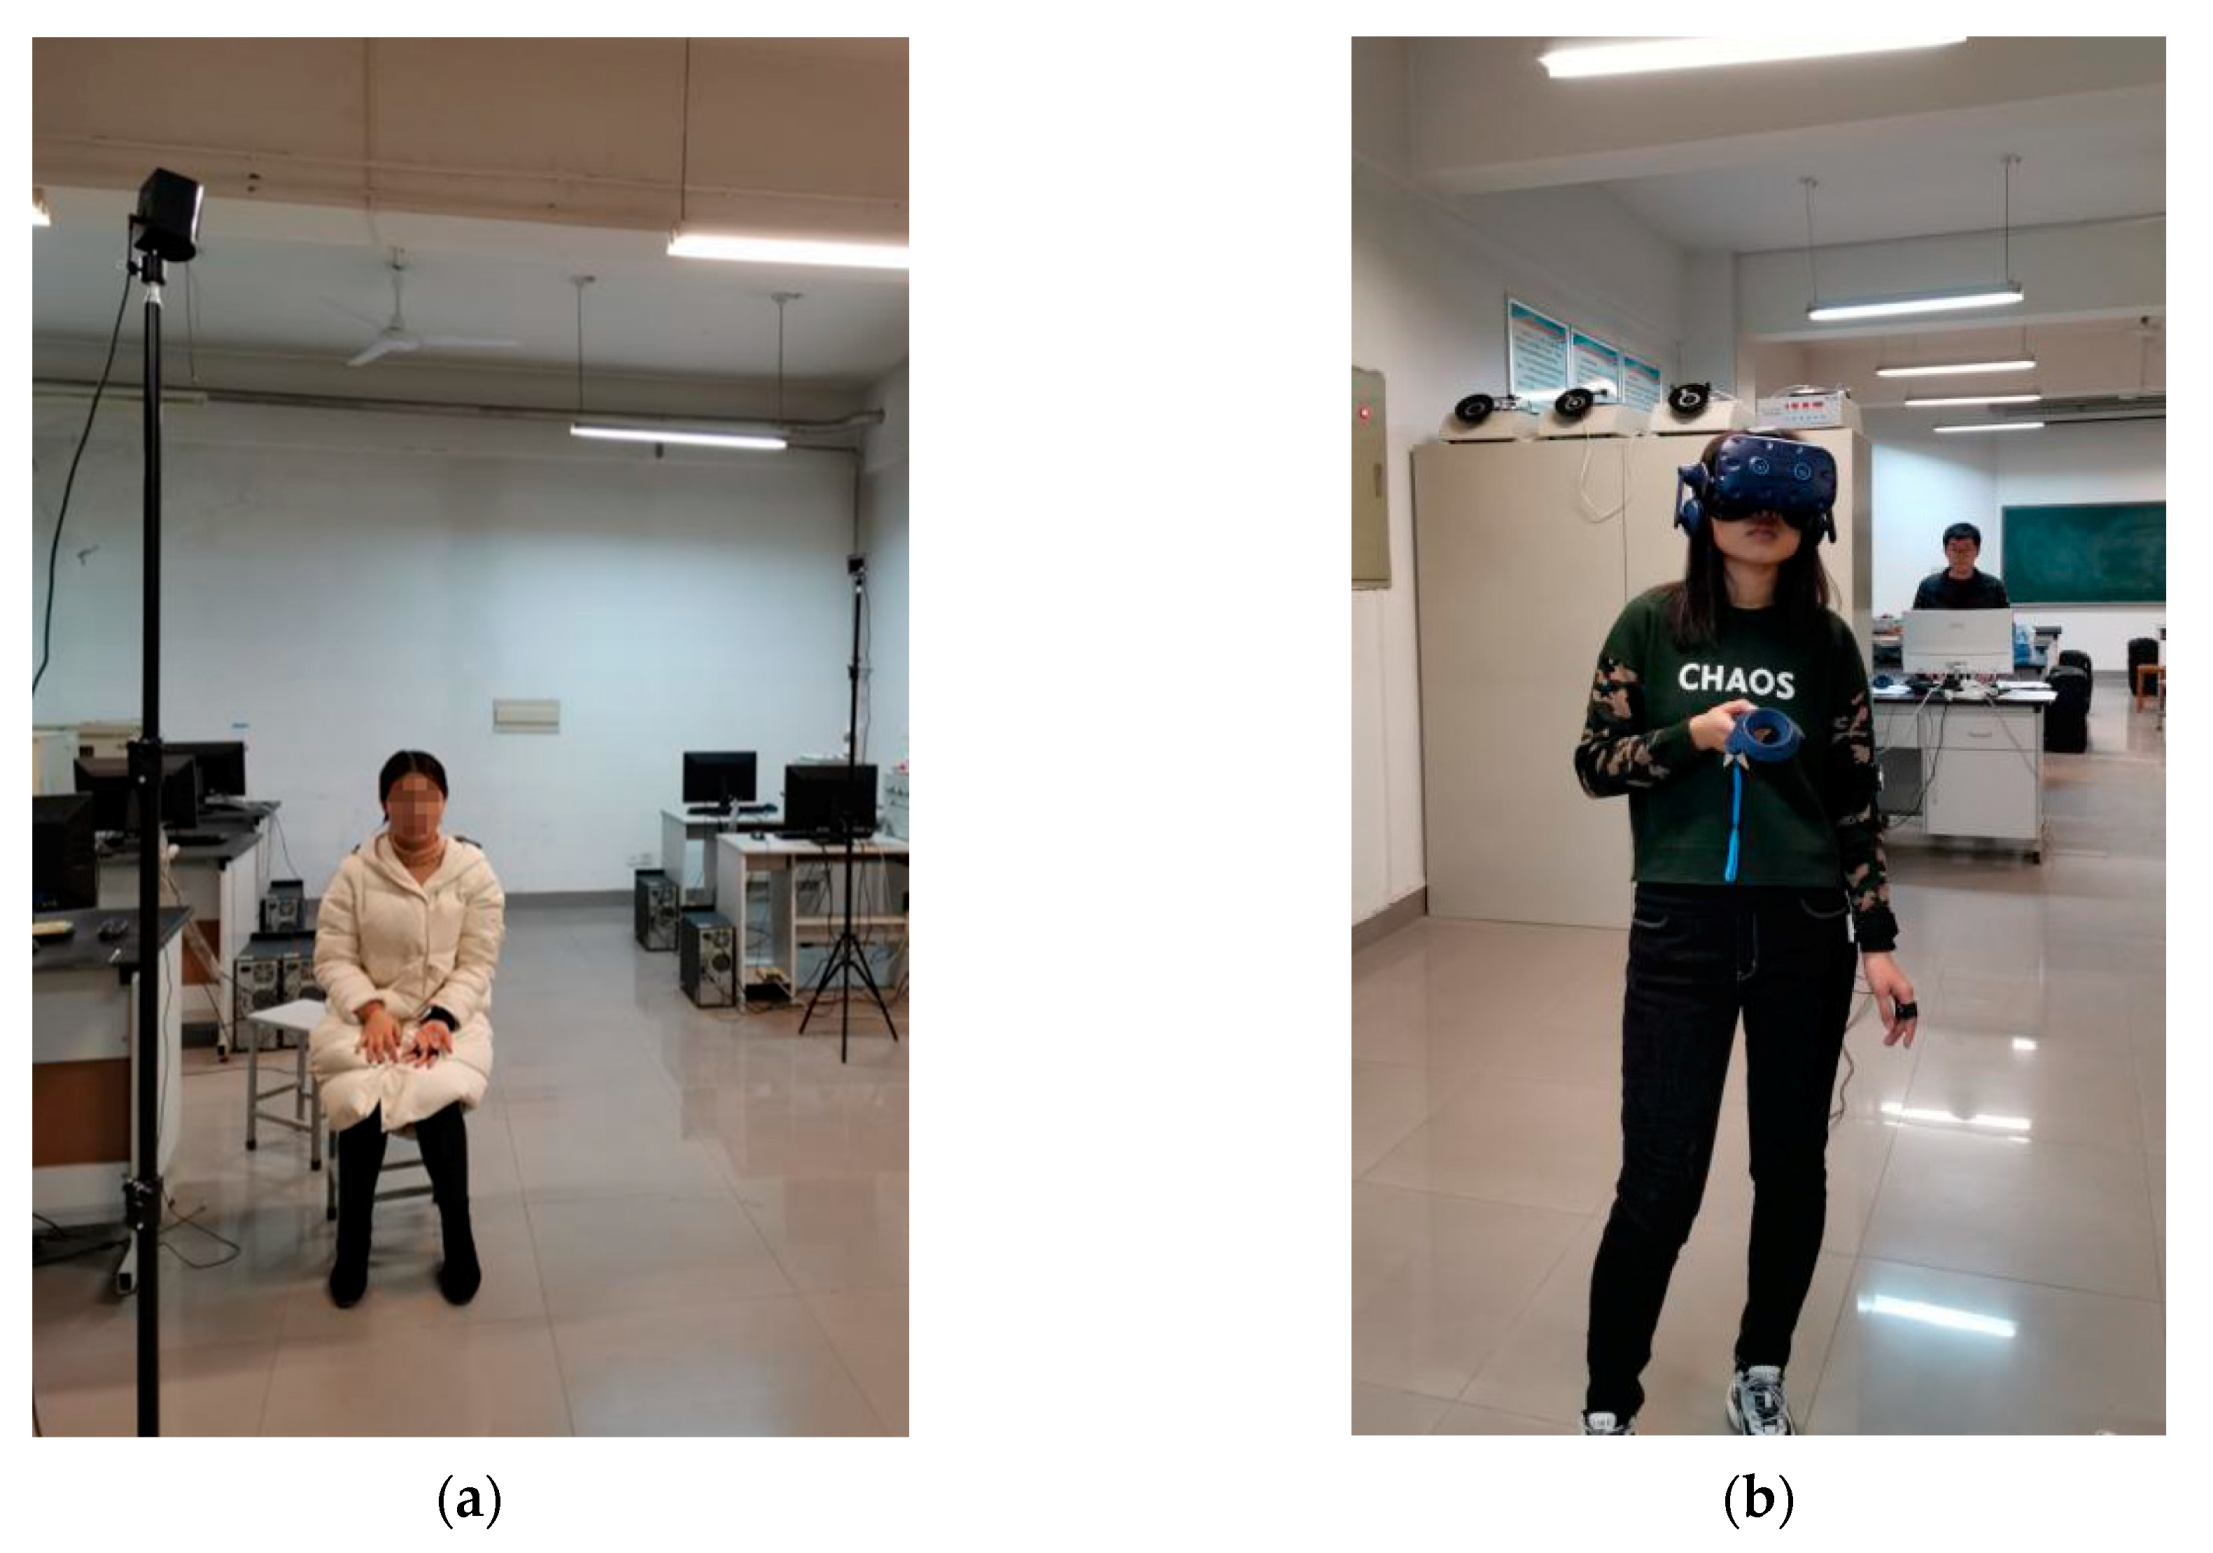
2.4. Apparatus
2.5. Experiment Design and Procedure
2.6. Variables
3. Results and Discussion
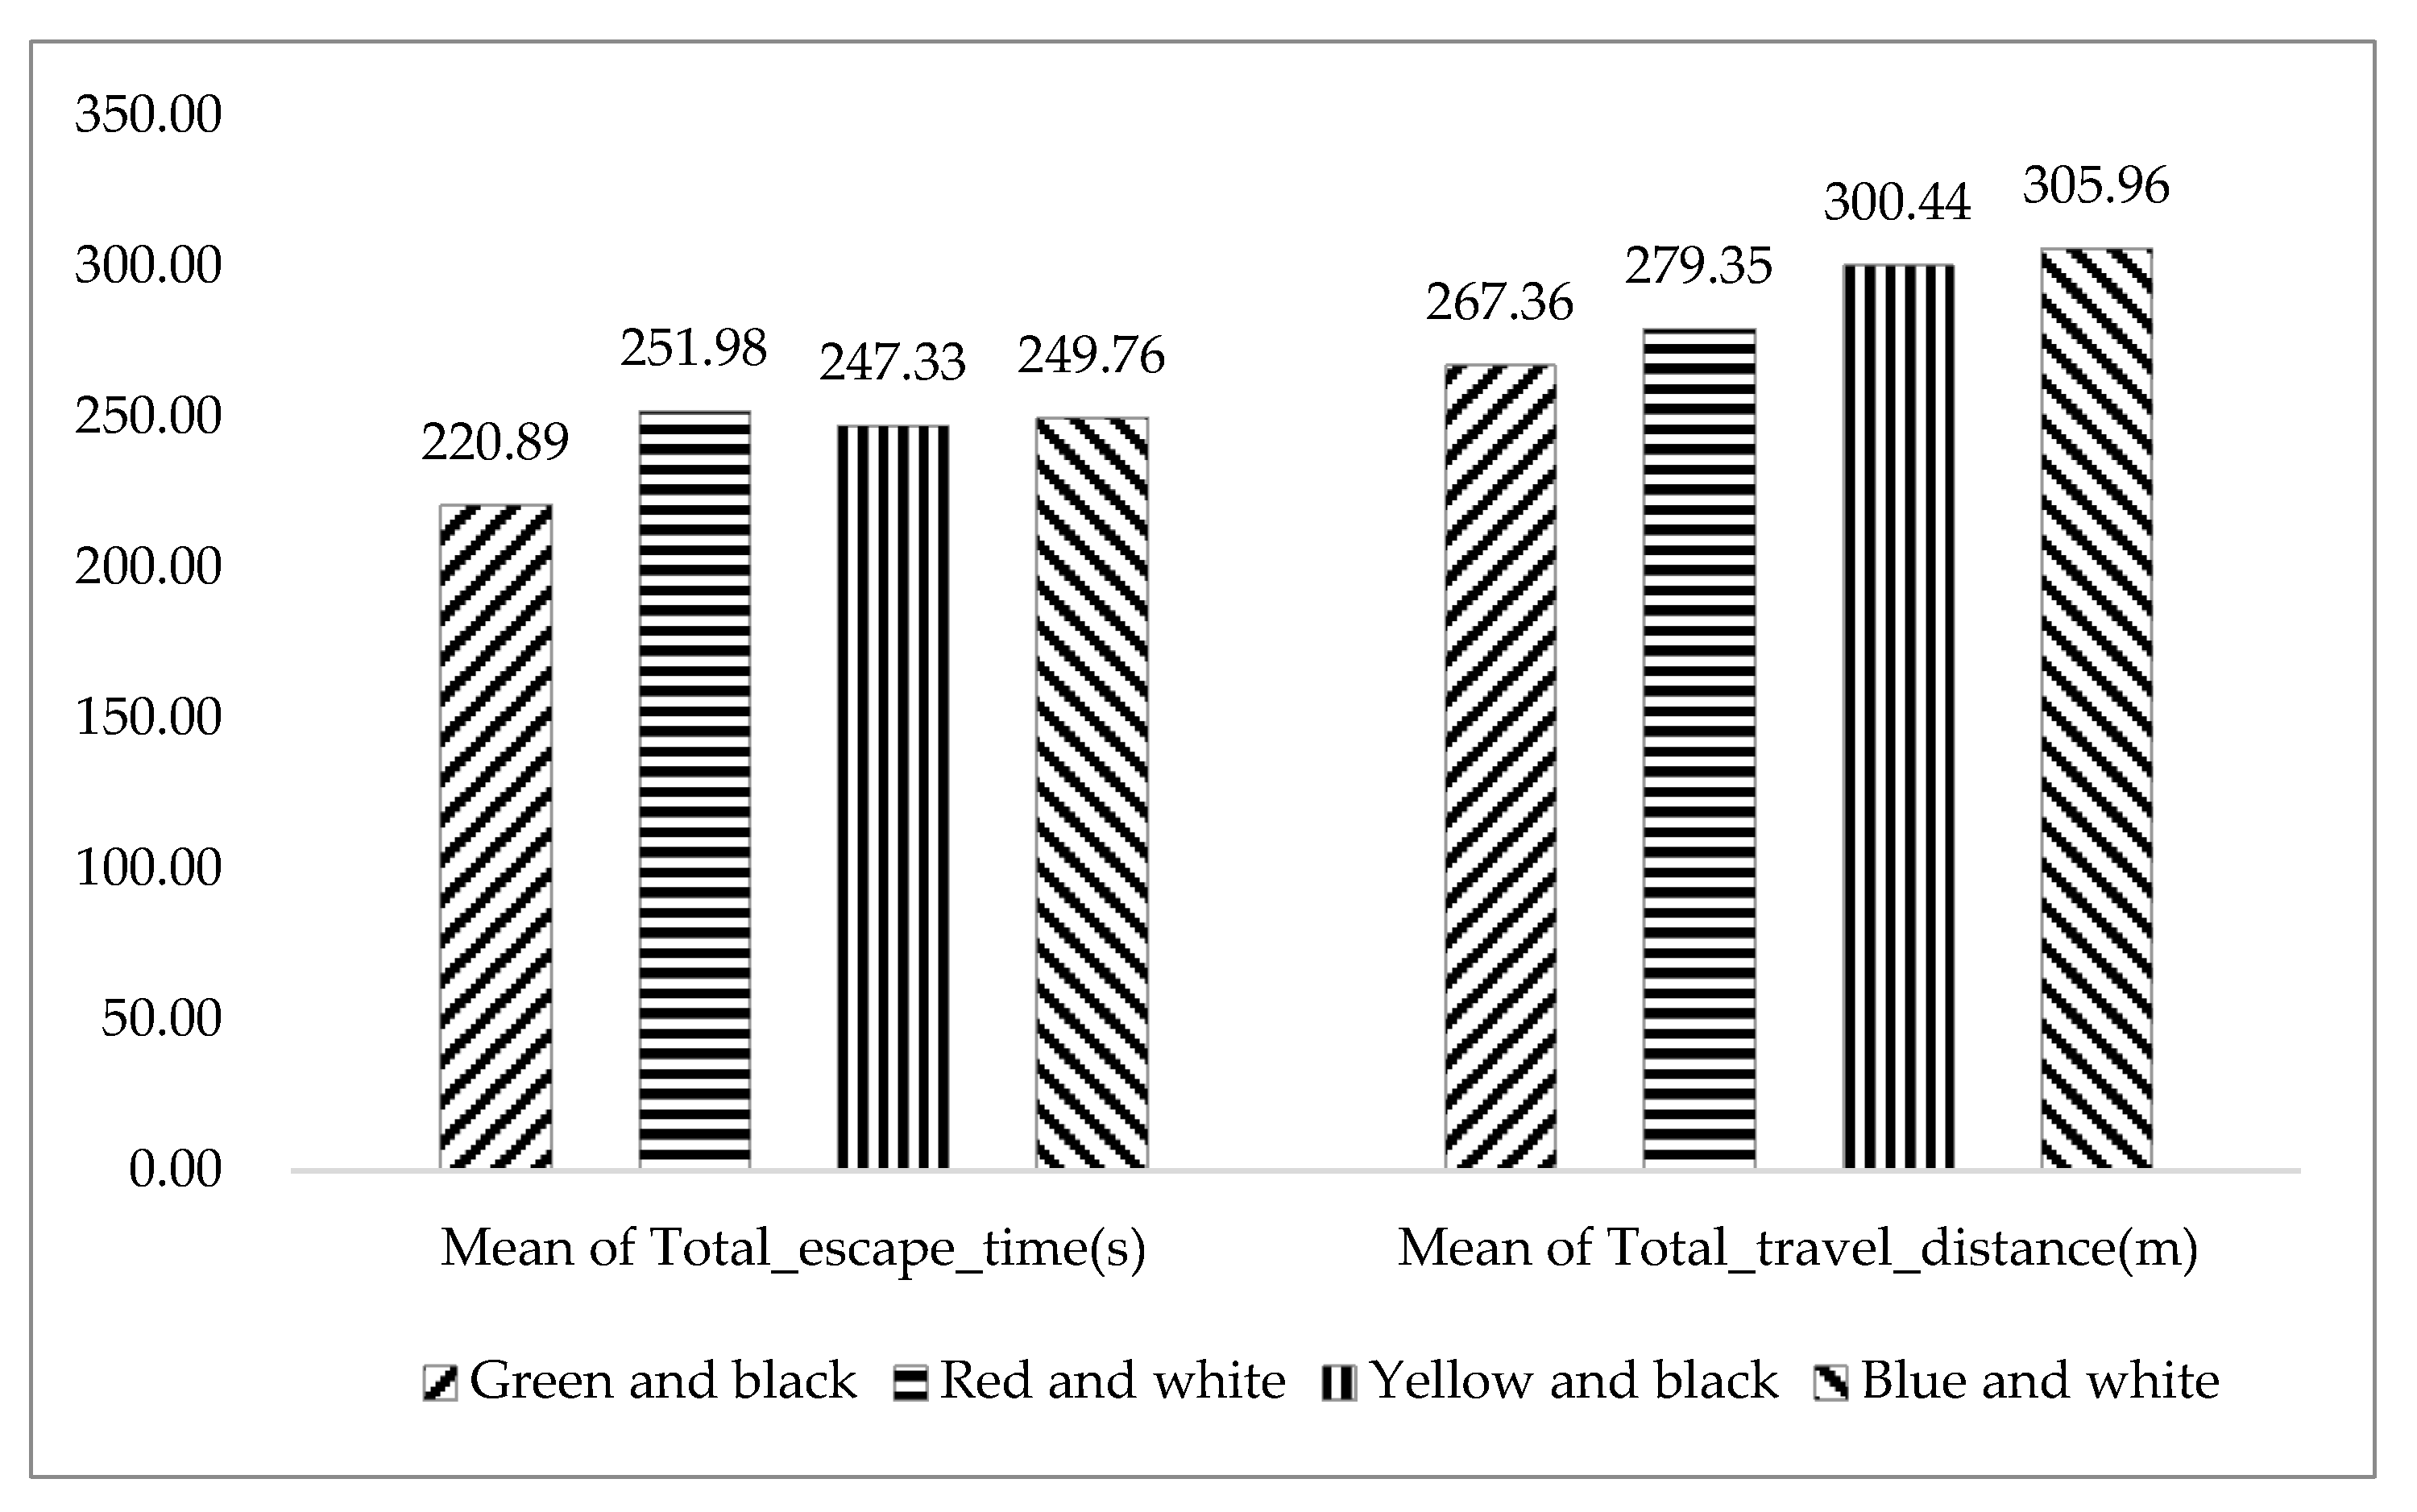
3.1. Relationship between Color_of_Safety_Sign and Escape Performance
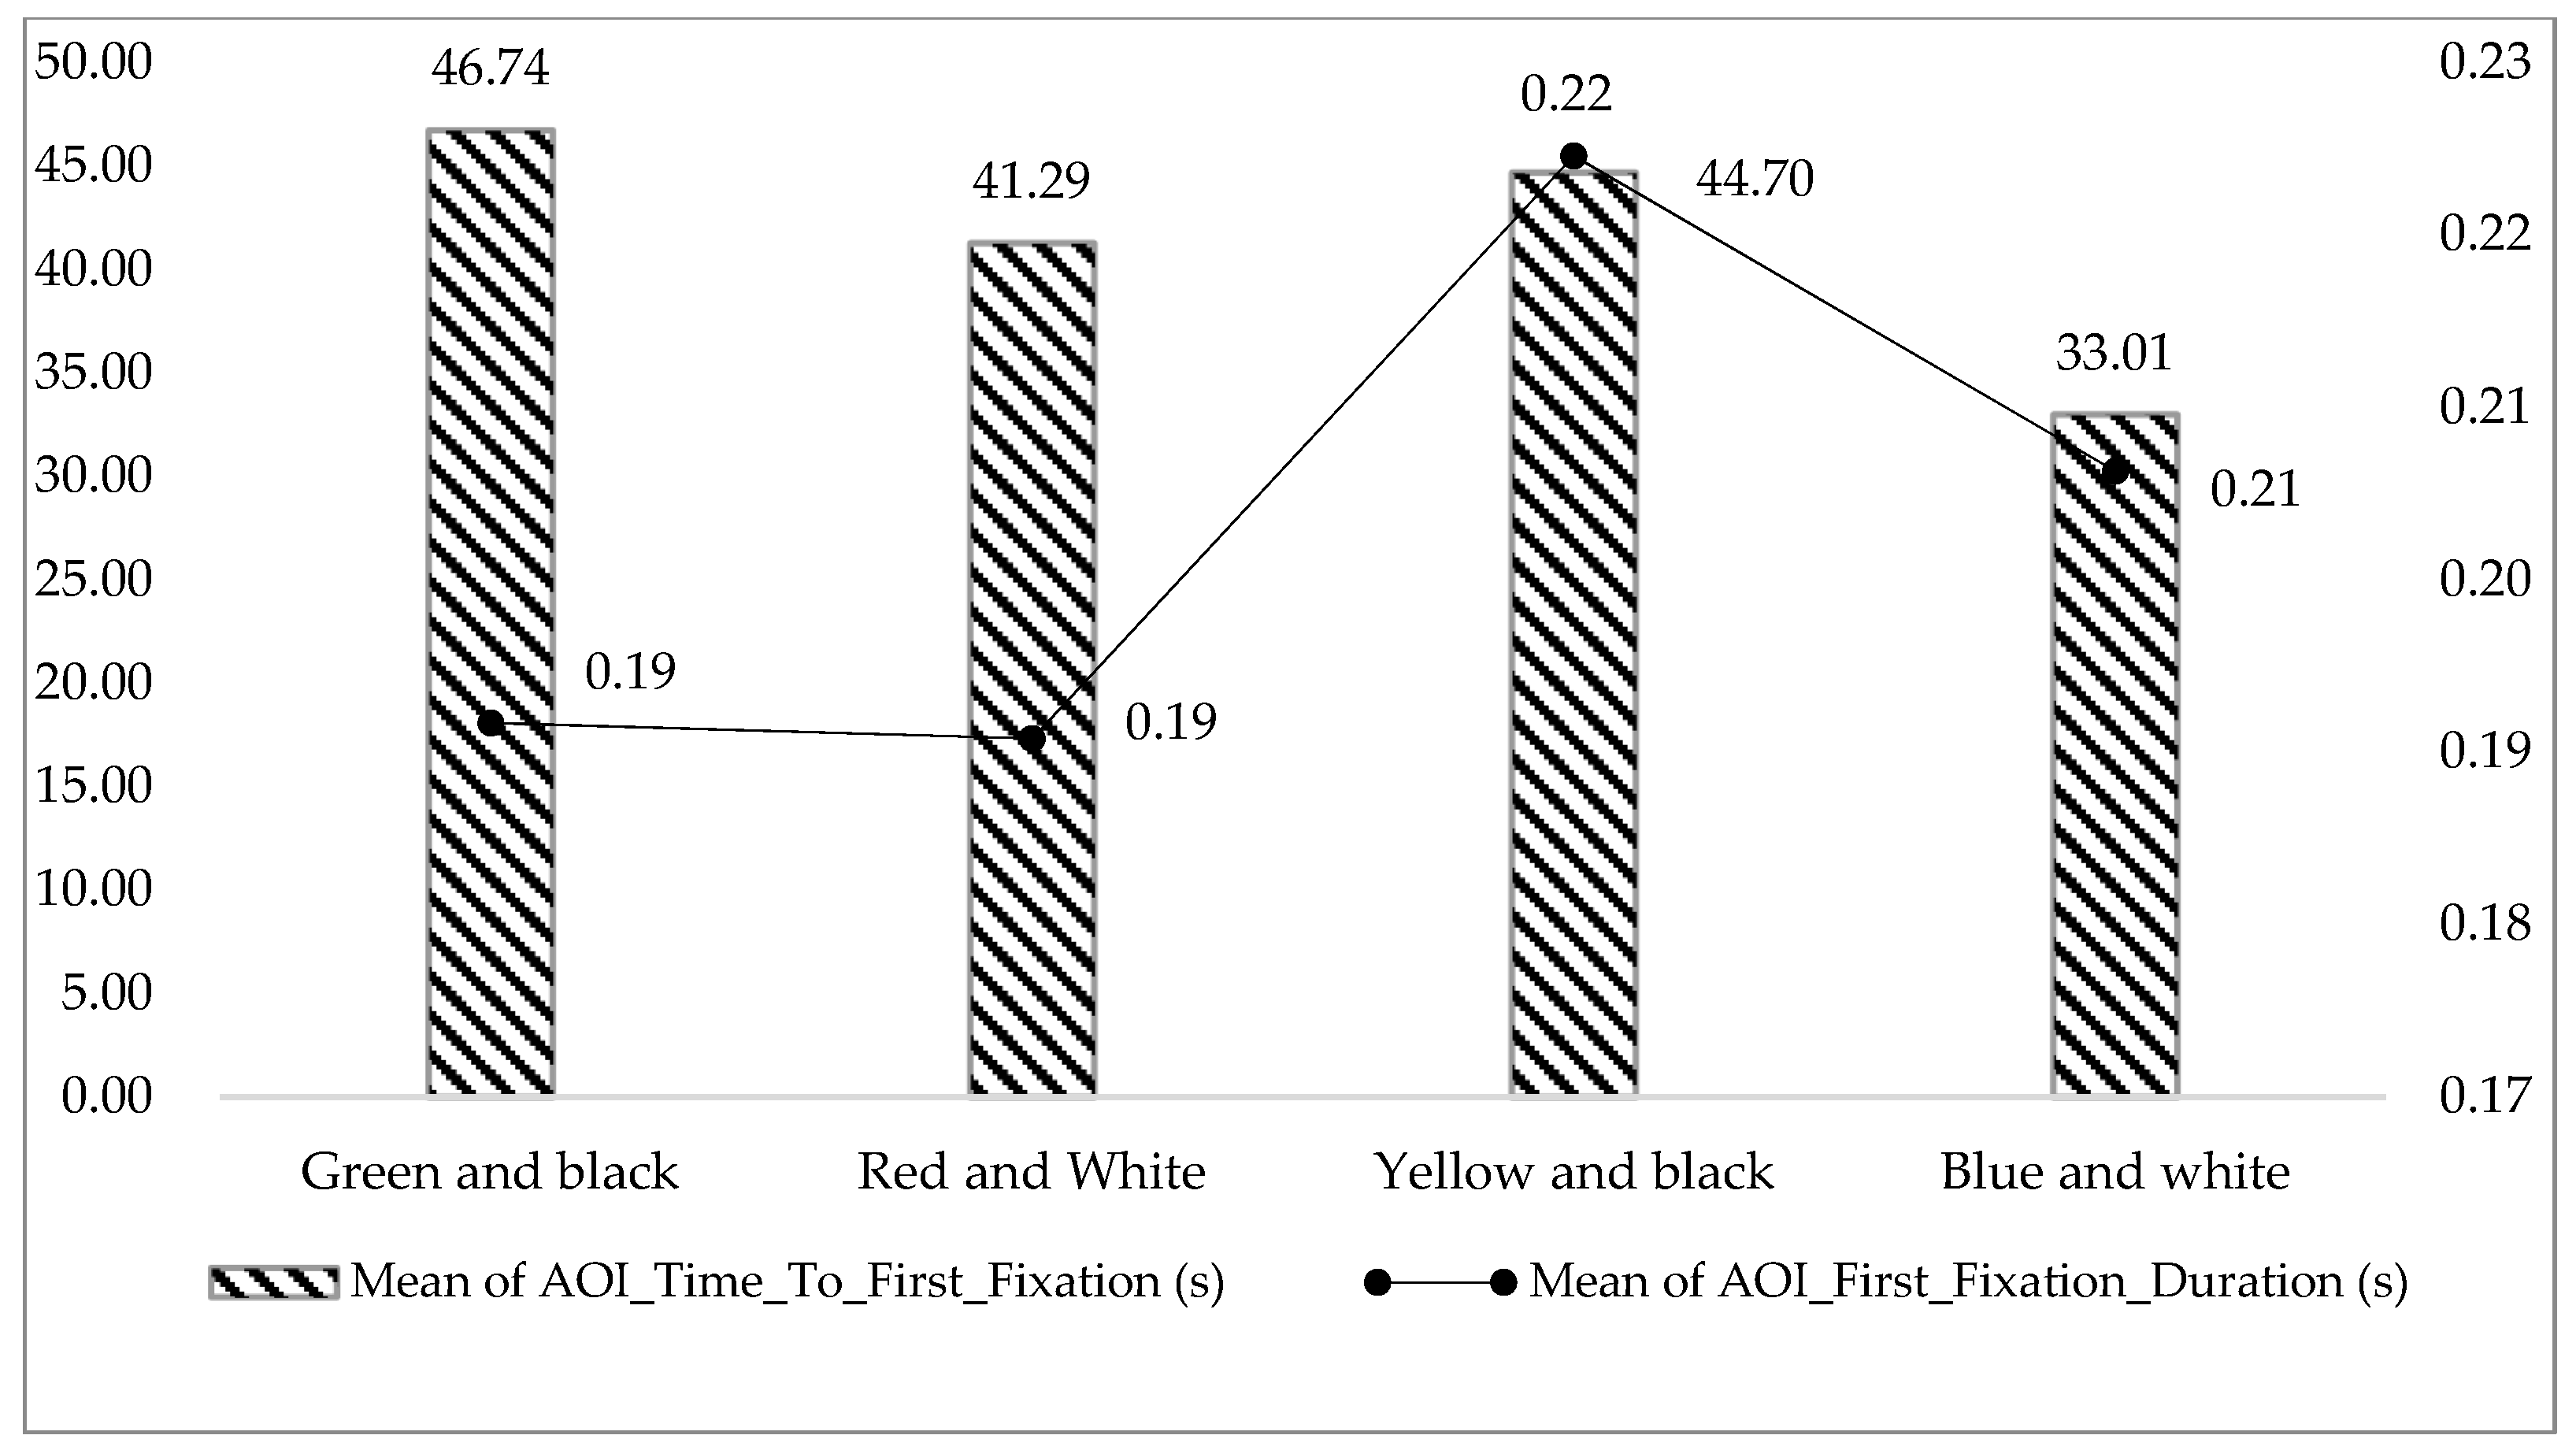
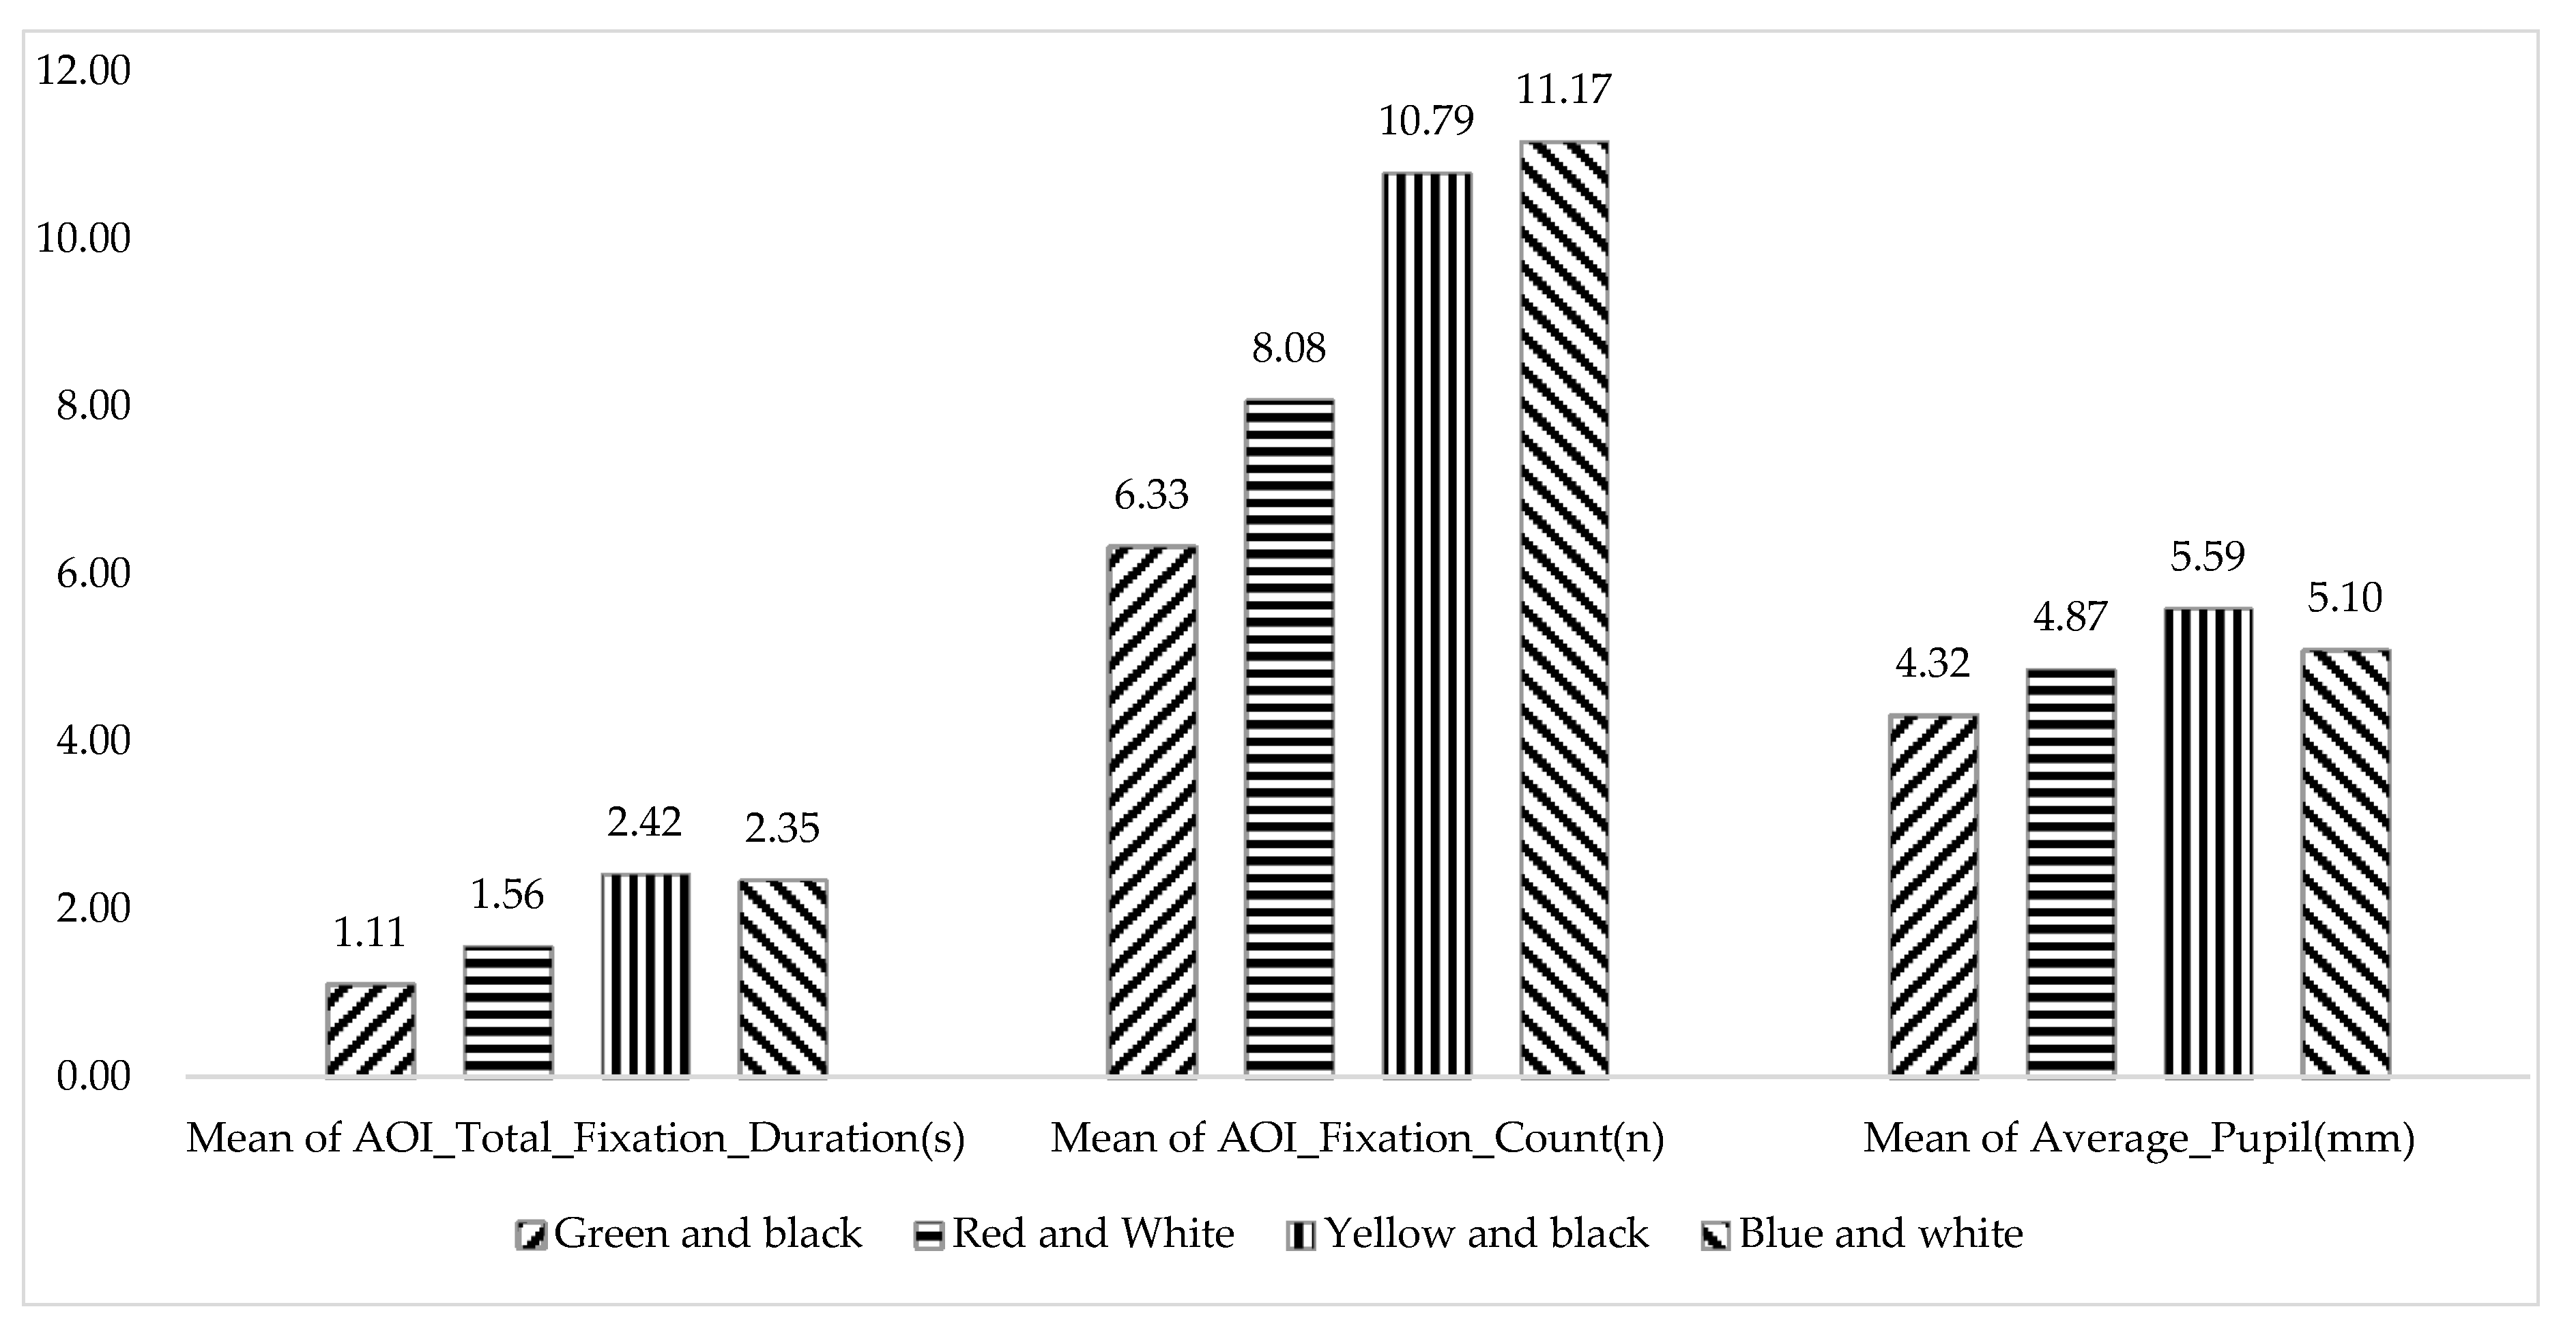
3.2. Relationship between Color_of_Safety_Sign and Eye-Tracking Indicators
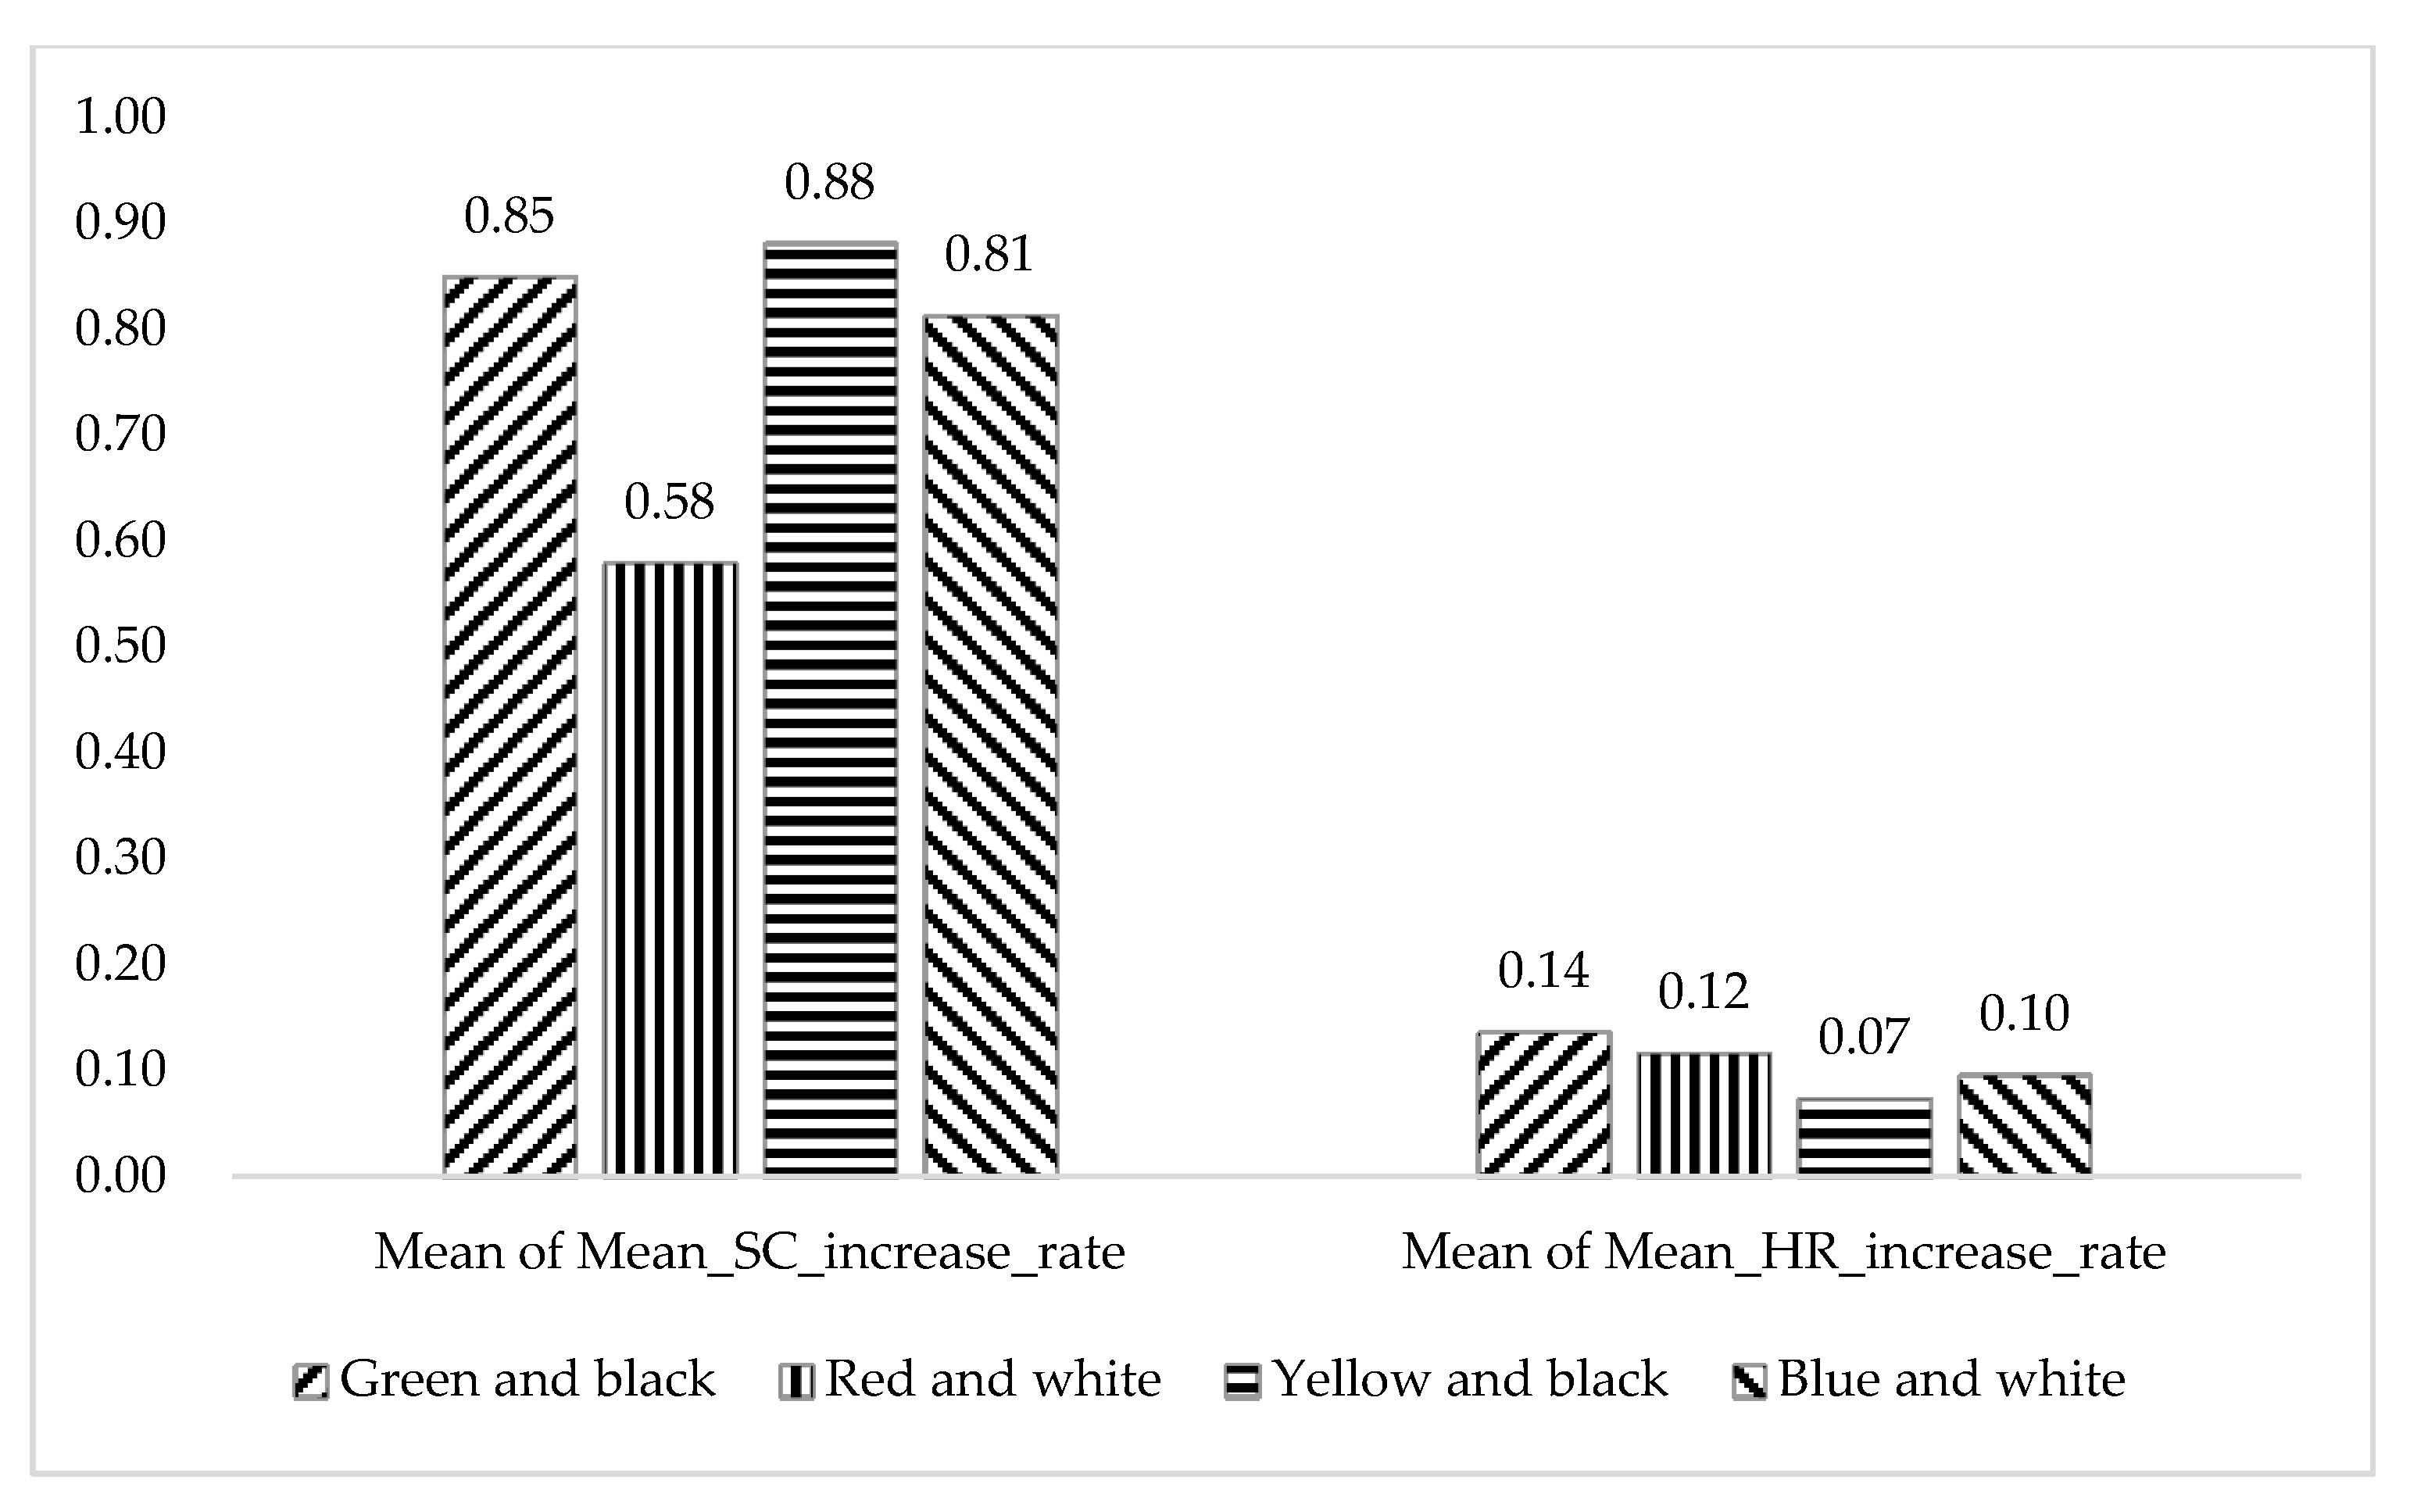
3.3. Relationship between Color_of_Safety_Sign and Physiological Indicators
- (1)
- Change of physiological indicators during virtual escape vs. baseline
- (2)
- Relationship between Color_of_safety_sign and SC, HR
3.4. Limitations
- (1)
- Virtual scene
- (2)
- Participants
- (3)
- Single case study
4. Conclusions
Author Contributions
Funding
Acknowledgments
Conflicts of Interest
References
- Mu, S.C.H.C. Assessing risk management capability of contractors in subway projects in mainland China. Int. J. Proj. Manag. 2014, 32, 452–460. [Google Scholar] [CrossRef]
- Li, P.X.W.Z. Risk identification and assessment in subway projects: Case study of Nanjing Subway Line 2. Constr. Manag. Econ. 2010, 28, 1219–1238. [Google Scholar]
- Zhang, L.; Liu, M.; Wu, X.; Zhong, J. Risk Analysis of Crowded Stampede Accident in Subway Stations Based on DEA Method. J. Civ. Eng. Manag. 2014, 31, 76–82. [Google Scholar]
- Zhang, L.; Wu, X.; Liu, M.; Liu, W.; Ashuri, B. Discovering worst fire scenarios in subway stations: A simulation approach. Autom. Constr. 2019, 99, 183–196. [Google Scholar] [CrossRef]
- Stec, A.; Hull, R. Fire Toxicity and Its Assessment. In Fire Retardancy of Polymeric Materials; CRC Press: London, UK, 2009; Volume 17, pp. 453–477. [Google Scholar]
- Yenumula, K.; Kolmer, C.; Pan, J.; Su, X. BIM-Controlled Signage System for Building Evacuation. Procedia Eng. 2015, 118, 284–289. [Google Scholar] [CrossRef] [Green Version]
- Tang, J. Assessment of Resilience in Complex Urban Systems. In Encyclopedia of the UN Sustainable Development Goals: Industry, Innovation and Infrastructure; Springer: Cham, Switzerland, 2019; pp. 1–10. [Google Scholar]
- Bobylev, N. Sustainability and Vulnerability Analysis of Critical Underground Infrastructure. In Managing Critical Infrastructure Risks; Springer: Dordrecht, Holland, 2007; pp. 445–469. [Google Scholar]
- Gernay, T.; Selamet, S.; Tondini, N.; Khorasani, N.E. Urban infrastructure resilience to fire disaster: An interview. Procedia Eng. 2016, 161, 1801–1805. [Google Scholar] [CrossRef] [Green Version]
- Tang, C.; Wu, W.; Lin, C. Using virtual reality to determine how emergency signs facilitate way-finding. Appl. Ergon. 2009, 40, 722–730. [Google Scholar] [CrossRef]
- Yasufuku, K.; Akizuki, Y.; Hokugo, A.; Takeuchi, Y.; Takashima, A.; Matsui, T.; Suzuki, H.; Pinheiro, A.T.K. Noticeability of illuminated route signs for tsunami evacuation. Fire Saf. J. 2017, 91, 926–936. [Google Scholar] [CrossRef]
- Wong, L.T.; Lo, K.C. Experimental study on visibility of exit signs in buildings. Build. Environ. 2007, 42, 1836–1842. [Google Scholar] [CrossRef]
- Kinateder, M.; Warren, W.H.; Schloss, K.B. What color are emergency exit signs? Egress behavior differs from verbal report. Appl. Ergon. 2019, 75, 155–160. [Google Scholar] [CrossRef]
- Olander, J.; Ronchi, E.; Lovreglio, R.; Nilsson, D. Dissuasive exit signage for building fire evacuation. Appl. Ergon. 2017, 59, 84–93. [Google Scholar] [CrossRef] [PubMed]
- Yamada, T.; Akizuki, Y. Visibility and Human Behavior in Fire Smoke. In SFPE Handbook of Fire Protection Engineering; Springer: New York, NY, USA, 2016; pp. 2181–2206. [Google Scholar]
- Nilsson, D.; Frantzich, H.; Saunders, W. Coloured flashing lights to mark emergency exits-experiences from evacuation experiments. Fire Saf. Sci. 2005, 8, 569–579. [Google Scholar] [CrossRef] [Green Version]
- Galea, E.; Xie, H.; Lawrence, P. Experimental and Survey Studies on the Effectiveness of Dynamic Signage Systems. Fire Saf. Sci. 2014, 11, 1129–1143. [Google Scholar] [CrossRef] [Green Version]
- Ronchi, E.; Nilsson, D.; Kojić, S.; Eriksson, J.; Lovreglio, R.; Modig, H.; Walter, A.L. A Virtual Reality Experiment on Flashing Lights at Emergency Exit Portals for Road Tunnel Evacuation. Fire Technol. 2016, 52, 623–647. [Google Scholar] [CrossRef]
- Galea, E.R.; Xie, H.; Deere, S.; Cooney, D.; Filippidis, L. An international survey and full-scale evacuation trial demonstrating the effectiveness of the active dynamic signage system concept. Fire Mater. 2017, 41, 493–513. [Google Scholar] [CrossRef] [Green Version]
- Galea, E.R.; Xie, H.; Deere, S.; Cooney, D.; Filippidis, L. Evaluating the effectiveness of an improved active dynamic signage system using full scale evacuation trials. Fire Saf. J. 2017, 91, 908–917. [Google Scholar] [CrossRef]
- Ronchi, E.; Nilsson, D.; Modig, H.; Walter, A.L. Variable Message Signs for road tunnel emergency evacuations. Appl. Ergon. 2016, 52, 253–264. [Google Scholar] [CrossRef]
- Kwee-Meier, S.T.; Mertens, A.; Jeschke, S. Recommendations for the design of digital escape route signage from an age-differentiated experimental study. Fire Saf. J. 2019, 110, 102888. [Google Scholar] [CrossRef]
- Xie, H.; Filippidis, L.; Galea, E.R.; Blackshields, D.; Lawrence, P.J. Experimental analysis of the effectiveness of emergency signage and its implementation in evacuation simulation. Fire Mater. 2012, 36, 367–382. [Google Scholar] [CrossRef]
- Fu, L.; Cao, S.; Song, W.; Fang, J. The influence of emergency signage on building evacuation behavior: An experimental study. Fire Mater. 2019, 43, 22–33. [Google Scholar] [CrossRef] [Green Version]
- Li, H.; Chan, G.; Skitmore, M. Multiuser Virtual Safety Training System for Tower Crane Dismantlement. J. Comput. Civ. Eng. 2012, 26, 638–647. [Google Scholar] [CrossRef] [Green Version]
- Wang, P.; Wu, P.; Wang, J.; Chi, H.; Wang, X. A Critical Review of the Use of Virtual Reality in Construction Engineering Education and Training. Int. J. Environ. Res. Public Health 2018, 15, 1204. [Google Scholar] [CrossRef] [PubMed] [Green Version]
- Duarte, E.; Rebelo, F.; Teles, J.; Wogalter, M.S. Behavioral compliance for dynamic versus static signs in an immersive virtual environment. Appl. Ergon. 2014, 45, 1367–1375. [Google Scholar] [CrossRef] [PubMed]
- Occhialini, M.; Bernardini, G.; Ferracuti, F.; Iarlori, S.; D Orazio, M.; Longhi, S. Fire exit signs: The use of neurological activity analysis for quantitative evaluations on their perceptiveness in a virtual environment. Fire Saf. J. 2016, 82, 63–75. [Google Scholar] [CrossRef]
- Vilar, E.; Rebelo, F.; Noriega, P.; Duarte, E.; Mayhorn, C.B. Effects of competing environmental variables and signage on route-choices in simulated everyday and emergency wayfinding situations. Ergonomics 2014, 57, 511–524. [Google Scholar] [CrossRef]
- Meißner, M.; Pfeiffer, J.; Pfeiffer, T.; Oppewal, H. Combining virtual reality and mobile eye tracking to provide a naturalistic experimental environment for shopper research. J. Bus. Res. 2019, 100, 445–458. [Google Scholar] [CrossRef]
- Tang, M.; Auffrey, C. Advanced Digital Tools for Updating Overcrowded Rail Stations: Using Eye Tracking, Virtual Reality, and Crowd Simulation to Support Design Decision-making. Urban Rail Transit 2018, 4, 249–256. [Google Scholar] [CrossRef] [Green Version]
- Tucker, A.; Marsh, K.L.; Gifford, T.; Lu, X.; Luh, P.B.; Astur, R.S. The effects of information and hazard on evacuee behavior in virtual reality. Fire Saf. J. 2018, 99, 1–11. [Google Scholar] [CrossRef]
- Lin, J.; Cao, L.; Li, N. Assessing the influence of repeated exposures and mental stress on human wayfinding performance in indoor environments using virtual reality technology. Adv. Eng. Inform. 2019, 39, 53–61. [Google Scholar] [CrossRef]
- Meng, F.; Zhang, W. Way-finding during a fire emergency: An experimental study in a virtual environment. Ergonomics 2014, 57, 816–827. [Google Scholar] [CrossRef]
- Yin, R.K. Case Study Research: Design and Methods, 2nd ed.; SAGE: Newbury Park, CA, USA, 1994. [Google Scholar]
- Eisenhardt, K.M.; Graebner, M.E. Theory Building from Cases: Opportunities and Challenges. Acad. Manag. J. 2007, 50, 25–72. [Google Scholar] [CrossRef]
- Walkowiak, S.; Foulsham, T.; Eardley, A.F. Individual differences and personality correlates of navigational performance in the virtual route learning task. Comput. Hum. Behav. 2015, 45, 402–410. [Google Scholar] [CrossRef] [Green Version]
- Sub-Technical Committee on Basic Standards of China National Fire Standardization Technical Committee. Fire Safety Signs-Part 1: Signs; GB 13495.1-2015; Standards Press of China: Beijing, China, 2015. [Google Scholar]
- China National Standardization Technical Committee on Urban Rail Transit. The Passenger Service Signs for Urban Rail Transit; GB/T 18574-2008; Standards Press of China: Beijing, China, 2008. [Google Scholar]
- China National Standardization Technical Committee on Graphic Symbols. Safety Way Guidance Systems-Setting Principles and Requirement; GB/T 23809-2009; Standards Press of China: Beijing, China, 2009. [Google Scholar]
- China National Standardization Technical Committee on Work Safety. Safety Signs and Guideline for the Use; GB 2849-2008; Standards Press of China: Beijing, China, 2009. [Google Scholar]
- China National Standardization Technical Committee on Work Safety. Safety Colours; GB 2893-2008; Standards Press of China: Beijing, China, 2008. [Google Scholar]
- American National Standards Institute. Standard for Fire Safety and Emergency Symbols; NFPA 170-2018; National Fire Protection Association: Quincy, MA, USA, 2018. [Google Scholar]
- Vilar, E.; Rebelo, F.; Noriega, P.; Teles, J.; Mayhorn, C. The influence of environmental features on route selection in an emergency situation. Appl. Ergon. 2013, 44, 618–627. [Google Scholar] [CrossRef] [PubMed]
- Cosma, G.; Ronchi, E.; Nilsson, D.; Division, O.F.S.E.; Lund, U.; Lunds, U.; Avdelningen, F.B. Way-finding lighting systems for rail tunnel evacuation: A virtual reality experiment with Oculus Rift. J. Transp. Saf. Secur. 2016, 8, 101–117. [Google Scholar] [CrossRef]
- Kinateder, M.; Müller, M.; Jost, M.; Mühlberger, A.; Pauli, P. Social influence in a virtual tunnel fire—Influence of conflicting information on evacuation behavior. Appl. Ergon. 2014, 45, 1649–1659. [Google Scholar] [CrossRef] [PubMed]
- Kinateder, M.; Ronchi, E.; Gromer, D.; Müller, M.; Jost, M.; Nehfischer, M.; Mühlberger, A.; Pauli, P. Social influence on route choice in a virtual reality tunnel fire. Transp. Res. Part F Traffic Psychol. Behav. 2014, 26, 116–125. [Google Scholar] [CrossRef]
- Kinateder, M.; Comunale, B.; Warren, W.H. Exit choice in an emergency evacuation scenario is influenced by exit familiarity and neighbor behavior. Saf. Sci. 2018, 106, 170–175. [Google Scholar] [CrossRef]
- Heliövaara, S.; Kuusinen, J.; Rinne, T.; Korhonen, T.; Ehtamo, H. Pedestrian behavior and exit selection in evacuation of a corridor—An experimental study. Saf. Sci. 2012, 50, 221–227. [Google Scholar] [CrossRef]
- Cao, L.; Lin, J.; Li, N. A virtual reality based study of indoor fire evacuation after active or passive spatial exploration. Comput. Hum. Behav. 2019, 90, 37–45. [Google Scholar] [CrossRef]
- Jeon, G.; Hong, W. An experimental study on how phosphorescent guidance equipment influences on evacuation in impaired visibility. J. Loss Prev. Process 2009, 22, 934–942. [Google Scholar] [CrossRef]
- Hallman, D.M.; Srinivasan, D.; Mathiassen, S.E. Short- and long-term reliability of heart rate variability indices during repetitive low-force work. Eur. J. Appl. Physiol. 2015, 115, 803–812. [Google Scholar] [CrossRef] [PubMed]
- Clark, D.W.A.L. Development and Validation of Brief Measures of Positive and Negative Affect: The PANAS Scales. J. Personal. Soc. Psychol. 1988, 54, 1063–1070. [Google Scholar]
- Poole, A.; Ball, L.J. Eye tracking in HCI and usability research. In Encyclopedia of Human Computer Interaction; IGI Global: Hershey, PA, USA, 2006; Volume 1, pp. 211–219. [Google Scholar]
- Hyönä, J.T.J.A. Pupil Dilation as a Measure of Processing Load in Simultaneous Interpretation. Q. J. Exp. Psychol-A. 1995, 48, 598–612. [Google Scholar]
- Peysakhovich, V.; Dehais, F.; Causse, M. Pupil Diameter as a Measure of Cognitive Load during Auditory-visual Interference in a Simple Piloting Task. Procedia Manuf. 2015, 3, 5199–5205. [Google Scholar] [CrossRef] [Green Version]
- Henderson, J.M.; Ferreira, F. Effects of foveal processing difficulty on the perceptual span in reading: Implications for attention and eye movement control. J. Exp. Psychol. Learn. Mem. Cogn. 1990, 16, 417–429. [Google Scholar] [CrossRef] [PubMed]
- Labbé, E.; Schmidt, N.; Babin, J.; Pharr, M. Coping with Stress: The Effectiveness of Different Types of Music. Appl. Psychophysiol. Biofeedback 2007, 32, 163–168. [Google Scholar] [CrossRef]
- Cheng, K.S.; Croarkin, P.E.; Lee, P.F. Heart Rate Variability of Various Video-Aided Mindful Deep Breathing Durations and Its Impact on Depression, Anxiety, and Stress Symptom Severity. Mindfulness 2019, 10, 2082–2094. [Google Scholar] [CrossRef]
- Kinateder, M.; Gromer, D.; Gast, P.; Buld, S.; Müller, M.; Jost, M.; Nehfischer, M.; Mühlberger, A.; Pauli, P. The effect of dangerous goods transporters on hazard perception and evacuation behavior—A virtual reality experiment on tunnel emergencies. Fire Saf. J. 2015, 78, 24–30. [Google Scholar] [CrossRef]
- Vilar, E.; Rebelo, F.; Noriega, P.; Teles, J.; Mayhorn, C. Signage Versus Environmental Affordances: Is the Explicit Information Strong Enough to Guide Human Behavior During a Wayfinding Task? Hum. Factor. Ergon. Man. 2015, 25, 439–452. [Google Scholar] [CrossRef]
- Or, C.K.L.; Wang, H.H.L. Color—Concept Associations: A Cross-Occupational and -Cultural Study and Comparison. Color Res. Appl. 2014, 39, 630–635. [Google Scholar] [CrossRef]
- Troncoso, J. Response to Emergency Wayfinding Systems by People from Different Cultures; Lund University: Lund, Sweden, 2014. [Google Scholar]
- Lesch, M.F.; Rau, P.P.; Zhao, Z.; Liu, C. A cross-cultural comparison of perceived hazard in response to warning components and configurations: US vs. China. Appl. Ergon. 2009, 40, 953–961. [Google Scholar] [CrossRef] [PubMed]
- Zijlstra, E.; Hagedoorn, M.; Krijnen, W.P.; van der Schans, C.P.; Mobach, M.P. Route complexity and simulated physical ageing negatively influence wayfinding. Appl. Ergon. 2016, 56, 62–67. [Google Scholar] [CrossRef] [PubMed]
- Kwee-Meier, S.T.; Mertens, A.; Schlick, C.M. Age-related differences in decision-making for digital escape route signage under strenuous emergency conditions of tilted passenger ships. Appl. Ergon. 2017, 59, 264–273. [Google Scholar] [CrossRef] [PubMed]


| Standard Name | Standard No. | Notes |
|---|---|---|
| Fire Safety Signs-Part 1: Signs [38] | GB 13495.1-2015 | China National Standard |
| The Passenger Service Signs for Urban Rail Transit [39] | GB/T 18574-2008 | China National Standard |
| Safety Way Guidance Systems-Setting Principles and Requirements [40] | GB/T 23809-2009 | China National Standard |
| Safety Signs and Guideline for the Use [41] | GB 2894-2008 | China National Standard |
| Safety Colors [42] | GB 2893-2008 | China National Standard |
| Standard for Fire Safety and Emergency Symbols [43] | NFPA (National Fire Protection Association) 170-2018 | American National Standard |
| Name | Description | |
|---|---|---|
| Hardware | HTC Vive Pro Eye 2.0 (Hongda Communications Co. LTD, Shanghai, China) | The virtual reality Head-Mounted Display (HMD), containing two 3.5-inch 3K AMOLED displays, each with a resolution of 1440 × 1600, a maximum field of view Angle of 110°, and a screen refresh rate of 90 HZ |
| PPG (Photoplethysmography) sensor (Kingfar International Inc., Beijing, China), EDA sensor (Kingfar International Inc., Beijing, China) | The real-time physiological data acquisition device, recording participants’ HR and SC (Skin Conductance) data | |
| HTC trackpad (Hongda Communications Co. LTD, Shanghai, China) | Participants moving or making turns with it in the virtual subway fire escape | |
| Unity3D VR Plugin data synchronization interface adapter (Kingfar International Inc., Beijing, China) | Data in VR scene were transmitted and recorded synchronously by this device | |
| CPU (i5-8400), GPU (GTX 1060) | The computer operating environment in the virtual experiment | |
| Software | SketchUp (Version of 2018pro, Trimble, Sunnyvale, CA, USA) | The virtual reality scene model was created by it according to the real subway station of Zijing Mountain in Zhengzhou, China, with 1:1 scale |
| Photoshop CS6 (Adobe Systems Incorporated, San Jose, CA, USA) | Some images were designed by it as textures in Unity3D | |
| Unity3D (Version of 2019.2.11f1, Unity Technologies, San Francisco, CA, USA) | The created model was imported into it for the interactive setting of scene functions | |
| ErgoLAB V3.0 man-machine-environment synchronous cloud platform (Kingfar International Inc., Beijing, China) | This software was used for real-time physiological data acquisition and processing, including ErgoLAB wearable wireless physiological recording module (PPG, EDA) and virtual reality eye movement tracking module (Tobii VR) | |
| IBM SPSS Statistic 22 (IBM Corporation, Armonk, NY, USA) | This software was used for data analysis |
| Variable Name | Meaning | Unit |
|---|---|---|
| Total_escape_time | Total time that participants took to escape to the ground exits from the escape starting point in the −4F | s |
| Total_travel_distance | Total moving distance that participants travel to escape to the ground exits from the escape starting point in the −4F | m |
| AOI_Time_To_First_Fixation | Time to first fixation at the safety sign in AOI (Area of Interest) | s |
| AOI_First_Fixation_Duration | The fixation duration time of the first fixation point at the safety sign in AOI | s |
| AOI_Total_Fixation_Duration | Total fixation duration time for all the fixation points at the safety signs in AOI | s |
| AOI_Fixation_Count | Total fixation number (count) for all the fixation points at the safety signs in AOI | n (number) |
| Average_Pupil | The average pupil diameter of left and right eyes during the fixation at all the fixation points at the safety signs in AOI | mm |
| increase_rate | The growth rate of the variable during escape vs. baseline | dimensionless |
| Mean_SC | The mean of the Skin Conductance during escape or baseline | μs |
| Mean_HR | The mean of the Heart Rate during escape or baseline | bpm (beats per minute) |
| Color_of_safety_sign | Four different color combinations of safety signs: “Green and black”, “Red and white”, “Yellow and black”, and “Blue and white” | - |
| Color_of_Safety_Sign | Total_Escape_Time (Mean ± SD) | Total_Travel_Distance (Mean ± SD) |
|---|---|---|
| Green and black (n = 24) | 220.8875 ± 69.03976 | 267.3625 ± 61.37007 |
| Red and white (n = 24) | 251.9750 ± 85.60563 | 279.3542 ± 94.52431 |
| Yellow and black (n = 24) | 247.3250 ± 112.72859 | 300.4417 ± 127.57933 |
| Blue and white (n = 24) | 249.7583 ± 114.68886 | 305.9625 ± 130.72830 |
| Sig. | 0.66 | 0.567 |
| Color_of_safety_sign | AOI_Time_To_First_Fixation (Mean ± SD) | AOI_First_Fixation_Duration (Mean ± SD) | AOI_Total_Fixation_Duration (Mean ± SD) | AOI_Fixation_Count (Mean ± SD) | Average_Pupil (Mean ± SD) |
|---|---|---|---|---|---|
| Green and black (n = 24) | 46.7446 ± 64.12274 | 0.1917 ± 0.16433 | 1.1063 ± 1.25075 | 6.3333 ± 7.32279 | 4.3167 ± 2.12531 |
| Red and white (n = 24) | 41.2896 ± 68.69189 | 0.1908 ± 0.16686 | 1.5621 ± 1.53618 | 8.0833 ± 7.76232 | 4.8696 ± 1.63910 |
| Yellow and black (n = 24) | 44.6971 ± 61.58409 | 0.2246 ± 0.15959 | 2.4242 ± 3.69194 | 10.7917 ± 14.50031 | 5.5913 ± 1.37096 |
| Blue and white (n = 24) | 33.0075 ± 42.15658 | 0.2063 ± 0.14467 | 2.3504 ± 3.21087 | 11.1667 ± 13.51864 | 5.1004 ± 1.79847 |
| Sig. | 0.865 | 0.87 | 0.249 | 0.397 | 0.095 |
| Color_of_Safety_Sign | Mean_SC_Increase_Rate (Mean ± SD) | Mean_HR_Increase_Rate (Mean ± SD) |
|---|---|---|
| Green and black (n = 24) | 0.8496 ± 0.60927 | 0.1367 ± 0.13586 |
| Red and white (n = 24) | 0.5796 ± 0.88858 | 0.1167 ± 0.11461 |
| Yellow and black (n = 24) | 0.8813 ± 0.96647 | 0.0738 ± 0.11912 |
| Blue and white (n = 24) | 0.8133 ± 1.10886 | 0.0963 ± 0.17126 |
| Sig. | 0.654 | 0.428 |
© 2020 by the authors. Licensee MDPI, Basel, Switzerland. This article is an open access article distributed under the terms and conditions of the Creative Commons Attribution (CC BY) license (http://creativecommons.org/licenses/by/4.0/).
Share and Cite
Chen, N.; Zhao, M.; Gao, K.; Zhao, J. The Physiological Experimental Study on the Effect of Different Color of Safety Signs on a Virtual Subway Fire Escape—An Exploratory Case Study of Zijing Mountain Subway Station. Int. J. Environ. Res. Public Health 2020, 17, 5903. https://doi.org/10.3390/ijerph17165903
Chen N, Zhao M, Gao K, Zhao J. The Physiological Experimental Study on the Effect of Different Color of Safety Signs on a Virtual Subway Fire Escape—An Exploratory Case Study of Zijing Mountain Subway Station. International Journal of Environmental Research and Public Health. 2020; 17(16):5903. https://doi.org/10.3390/ijerph17165903
Chicago/Turabian StyleChen, Na, Ming Zhao, Kun Gao, and Jun Zhao. 2020. "The Physiological Experimental Study on the Effect of Different Color of Safety Signs on a Virtual Subway Fire Escape—An Exploratory Case Study of Zijing Mountain Subway Station" International Journal of Environmental Research and Public Health 17, no. 16: 5903. https://doi.org/10.3390/ijerph17165903