Article

An Epidemiological Study on the Prevalence of the Clinical Features of SARS-CoV-2 Infection in Romanian People

by
Constantin Ciucurel
and
Elena Ioana Iconaru
*
Department of Medical Assistance and Physical Therapy, University of Pitesti, 110040 Pitesti, Romania
*
Author to whom correspondence should be addressed.
Int. J. Environ. Res. Public Health 2020, 17(14), 5082; https://doi.org/10.3390/ijerph17145082
Submission received: 25 June 2020 / Revised: 10 July 2020 / Accepted: 12 July 2020 / Published: 14 July 2020

Abstract

:
The aim of this study was to investigate the prevalence of the clinical features of the SARS-CoV-2 infection in Romanian population through a novel online survey. The survey included categorical socio-demographic and health-related variables. A total of 1830 participants were selected for statistical data processing (a response rate of 90.9%). We determined reasonable reliability of the survey section for clinical features of SARS-CoV-2 infection (Cronbach’s Alpha 0.671). Two meaningful dimensions were identified through CATPCA (Categorical Principal Component Analysis) for the survey’s items. We separated two significant clusters of items, each measuring a distinct factor: the sociodemographic characteristics linked to social distancing and the relevant clinical features of SARS-CoV-2 infection. Next, a two-step cluster analysis helped to classify the sample group taking into consideration the similarity of subjects. The clustering revealed a three-cluster solution, with significant differences between clusters and allowed the cluster detection of a group of individuals, possibly more affected by the infection with the SARS-CoV-2 virus. Through binomial logistic regression analysis, we identified a statistically significant prediction model for the presumptive diagnostic of some relevant clinical features of SARS-CoV-2 infection. Our study validated a cost-effective model for rapid assessment of the health status of subjects, adapted to the context of SARS-CoV-2 pandemic.

1. Introduction

In the recent past large increases in COVID-19 cases and deaths continue to be reported worldwide, including the EU/EEA countries [1]. The WHO defined the pandemy of COVID-19 as a public health emergency, with serious worldwide consequences in the short, medium, and long term [2]. This pandemic already has a major impact on human communities, through the important effects on the health of individuals, through the overloading of health care services, but also through the complex effects induced by the measures of the social distancing of the population. In this context, researches focused on epidemiological issues are of real use, bringing new opportunities and perspectives for public health policies.
In Romania, the first confirmed SARS-CoV-2 virus infection was recorded on 26 February 2020, with 1–2 cases confirmed daily in the following days. From 10 March, the trend became ascending and the number of cases reached an average of 300 cases/day at the beginning of April [3]. At the time of conducting the research, the trend in Romania was towards an increase in the number of confirmed people through detection of viral RNA by PCR test. Compared to other EU countries, in Romania, the number of people infected with the virus is lower, maybe due to the low number of tests performed. Another factor to mention is the early adoption of social isolation measures by the population and the establishment of the state of emergency for one month by the authorities on 16 March 2020.
Initially, a large part of all confirmed cases was recorded as a result of close contact with infected persons arriving in Romania from abroad (about 300,000 people in 6 weeks from the beginning of the epidemic in Romania), or with their contacts. Subsequently, the share of community transmission increased in that period.
The complexity of the clinical manifestations of SARS-CoV-2 infection is the subject of numerous debates in the scientific world. In this sense, there are several standardization approaches. Mainly, the screening diagnosis is supported by the patient’s epidemiological history (travel/residence in affected areas and/or contact with symptomatic persons during the last 14 days) and by clinical symptomatology (acute fever during the last 72 h which cannot be attributed to another etiological diagnosis) [4]. Most recent research indicates that infection with the SARS-CoV-2 virus commonly shows symptoms such as fever, dry or productive cough, dyspnoea, sore throat, myalgia, and fatigue, general weakness, and pain in the context of viral pneumonia [1,5]. The symptoms described may vary depending on the age of the patients. For example, in adults occur, in order of frequency, fever, cough, chest tightness/pain, fatigue, and sore throat. In contrast, children are more often asymptomatic, with fever and cough being reported in relatively few cases [6].
On the other hand, other clinical elements have been proposed as useful for the diagnosis of the disease, such as digestive symptoms: diarrhoea, anorexia, and nausea [7]. In addition, some clinical manifestations, like anosmia and dysgeusia, although minor in appearance, are considered to have a pathognomonic character [8]. It should be noted that an important category of people infected with the SARS-CoV-2 virus is totally asymptomatic, but can transmit the disease, the percentage going up to 78%, according to some authors [9].
In Romania, the diagnosis of suspicion for SARS-CoV-2 infection is established in the following situations:
(1)
A patient with an acute respiratory infection, with sudden onset, having met at least one of three clinical criteria (cough, fever, shortness of breath/increased respiratory rate), without another aetiology that fully explains the clinical picture and with international travel history, within 14 days prior to symptom onset.
(2)
A patient with an acute respiratory infection, having been in close contact with a confirmed case of COVID-19 within 14 days prior to symptom onset.
(3)
A patient with pneumonia or severe acute respiratory infection (SARI), without another aetiology that fully explains the clinical picture.
Instead, a confirmed case is considered to be a person with laboratory confirmation of infection with SARS-CoV-2, regardless of clinical signs and symptoms [10]. Similarly, according to WHO guidelines, laboratory diagnosis of COVID-19 is based on a positive real-time reverse transcription polymerase chain reaction (rRT-PCR) test for the qualitative detection of nucleic acid from SARS-CoV-2 [11].
Regarding the strategy of testing people in Romania for infection with the SARS-CoV-2 virus, the recommendations of the European Centre for Disease Prevention and Control (ECDC) and World Health Organization (WHO) were applied [12]. Thus, in order, the tests are prioritized (only at the physician’s recommendation) for symptomatic persons with international travel history, symptomatic close contacts of confirmed cases, symptomatic medical-sanitary personnel, pneumonia or SARI cases with unspecified aetiology from all hospitals, institutionalized persons with symptoms, patients before the transplant procedure (asymptomatic) and hematopoietic stem cell donors before donation [13].
Worldwide, there have been numerous initiatives to provide support services for communities hard-pressed by the new clashes that have arisen during this difficult time. Therefore, reliable alternative technological solutions have been proposed to aid health professionals. They are mainly based on mobile internet technologies, such as mobile applications or personal-oriented digital platforms that can carry out population screening activities in a very short time. Essentially, these are self-administered questionnaires to interested persons, which allow identifying the symptomatology and the context of infectious risk [14]. These alternative or complementary methods to the classical laboratory test procedures become extremely useful when the testing capacity is exceeded by the very large number of new cases that have occurred, and/or when the logistical resources are limited. Furthermore, through the geographical tracking and mapping of infected people, it is possible to sustain the global fight against the COVID-19 outbreak [15].

2. Materials and Methods

2.1. Premises and Aim of the Study

In Romania, the frequency of performing the population testing for the SARS-CoV-2 virus is relatively low, but the epidemiological situation seems to be still under control. However, there are certain risks to the short-term evolution of the pandemic, taking into account, for example, the massive tendency of returning people from risk areas. When returning to Romania, these persons are required to quarantine, or isolate for 14 days, at home or in special spaces. That is why it seems plausible that there are a much larger number of infected people than the one found by direct testing. Thus, the purpose of the study was to conduct a cross-sectional, descriptive, epidemiological investigation by administering an online survey regarding the prevalence of the specific symptomatology of the SARS-CoV-2 virus infection among the Romanian population. The present research aimed to contribute to the development of useful information resources, necessary for the management of a new disease, which has many unknowns.

2.2. Participants

The study was designed on a sample of the Romanian population. Thus, a number of 2013 people were initially voluntarily recruited into research, by completing the online questionnaire. Of these, 1830 persons were validated for the statistical processing of the data. The criteria for inclusion in the study refer to the current domicile in Romania and completing the questionnaire in full. The study was approved by our institutional ethical committee (registration number 387/31.03.2020) and all participants provided online informed consent to participate in the research.

2.3. Data Acquisition

For online data collection, the software PsyToolkit (https://www.psytoolkit.org/) was used [16,17]. Thus, an online survey was developed, that includes two categories of items, with mandatory completion. The first category (10 items) consists of categorical socio-demographic variables of the participants: age, sex, domicile in a certain county in Romania, type of current residence, type of housing, social status, travel abroad in the last month, contact with a confirmed SARS-CoV-2 virus case, the current situation related to the social isolation imposed by law, the average number of contacts with people in the last two weeks. Of the 10 items, nine have closed-ended questions with a single answer and one item contains an open question (another situation in the context of social isolation imposed by law). The second category (22 items) includes variables that circumscribe the participants’ health, from the physical and psychological point of view, and the 13 most relevant clinical features of infection with the SARS-CoV-2 virus. Of the 22 items, 21 are closed-ended questions with a single answer, and one item has a closed-ended question with multiple choice answers (comorbidities). The survey contains one numerical variable (age) and nominal variables converted to numerical dummy values.
In the preamble of the questionnaire, the participants were informed about the storage and use of the data for research purposes, under conditions of confidentiality and anonymity, according to the laws in force. The questionnaire could be completed by each participant or for any other person in his family (child, older people, etc.). The estimated average time to complete the survey was 3–4 min. The questionnaire could be freely distributed through social networks to increase the size of the sample of participants and was accessed through a dedicated link between 2 April 2020, and 7 April 2020.

2.4. Outcomes and Statistical Analysis

The answers obtained were imported and statistically processed using IBM SPSS 20.0 software (IBM Corp., Armonk, NY, USA) in terms of descriptive statistics (mean, standard deviation, frequency distribution, multiple response analysis, Cronbach’s alpha test for the internal consistency of the instrument) and inferential statistics (categorical principal component analysis with optimal scaling, two-step cluster analysis, followed by one-way ANOVA and Pearson’s chi-square test, and binomial logistic regression).

3. Results

This section may be divided by subheadings. It should provide a concise and precise description of the experimental results, their interpretation as well as the experimental conclusions that can be drawn.

3.1. Respondents

From 2013 persons with current domicile in Romania, a number of 1830 participants were selected for statistical data processing (a response rate of 90.9%). Eligibility was based on completing the online questionnaire in full.

3.2. Sociodemographic Characteristics of Study Participants

The mean respondent age was 33.54 ± 13.14 years, the age range varied between 4 and 90 years old, with a sex ratio of 0.369 (494 men/1336 women) and most respondents were between 18 and 50 years (85.6%). In terms of territorial distribution (Table 1), most of the participants (62.5%) come from a single district (Arges), in the second place (8.3%) being those from the country’s capital (Bucharest), the rest being distributed relatively evenly across the country. This can be explained by the fact that initially the questionnaire was distributed on social networks, starting from the close acquaintances of the authors, followed by a branched distribution.
Other data with possible interest for the interpretation of social distancing refer to the fact that most respondents live in urban areas (71.2%), in individual housing (52.8%), are employed (56.4%), did not travel abroad in the last month (97%), did not have contact with a person infected with the SARS-CoV-2 virus (70.7%), are in self-insulation or confined at home (68.2%) and interacted in the last two weeks with an average of 1–5 people (68.1%).

3.3. Health Status Characteristics of Study Participants

Overall (Table 2), most participants were in good or very good health, based on self-assessment (75.5%), had not been tested for the SARS-CoV-2 virus (99.6%), had a mild or moderate level of physical activity in the last two weeks (66%), are non-smokers (72.1%), had no history of chronic illness (81.1%), have not had Influenza or acute respiratory infections in the last 6 months (75%) and have not been vaccinated for Influenza in the last 6 months (91.8%). Among the personal pathological antecedents, the most common are the cardiovascular ones (6.1%). Regarding the presence of symptoms associated with SARS-CoV-2 virus infection in the last 14 days, the following clinical elements were reported more frequently: headache (33.1%), nasal congestion/leakage of nasal secretions (20.8%), sore throat or dry throat sensation (19.4%) and muscle and/or joint pain (14.5%). The rest of the clinical features registered percentages between 0.8–8.8%. Also, most respondents stated that they have always or occasionally wore a face mask outside the home in the last 14 days (77.5%). Finally, from a psychological point of view, most participants had a mild or moderate level of anxiety about the pandemic with SARS-CoV-2 (71.6%).

3.4. Multiple Response Analysis

For the dichotomic items that represent the clinical features of SARS-CoV-2 infection, we applied a multiple response analysis to put into evidence people with multiple symptomatology (Table 3). It is observed that, in total, 1016 subjects (55.5%) reported at least one clinical element of those analyzed.

3.5. Reliability of the Survey Section for Clinical Features of SARS-CoV-2 Infection

To assess the internal consistency of the clinical features section of the survey (items h8–h20 from Table 2) we applied the Cronbach’s Alpha.
The removal of item h9 led to a slight improvement in Cronbach’s alpha. The reason we gave up this item is that it is redundant with the previous item h8, and 49.5% of respondents stated that they had not measured their body temperature in the last two weeks. In addition, in this way, all items considered for specific clinical features of infection with the SARS-CoV-2 virus (h8 and h10–h19) are of binary data type, with yes/no answers. Thus, the Cronbach’s Alpha, based on standardized items, was 0.671, which is considered to be reasonable for a substantial sample [18] and for measuring a single construct with heterogeneous items, when usually the reliability is underestimated [19]. In fact, from Table 4 negligible or low correlations can be observed between the analyzed clinical features. Of note, however, the highest correlations 0.357 between the items h14 and h15, respectively 0.327 between h11 and h17.

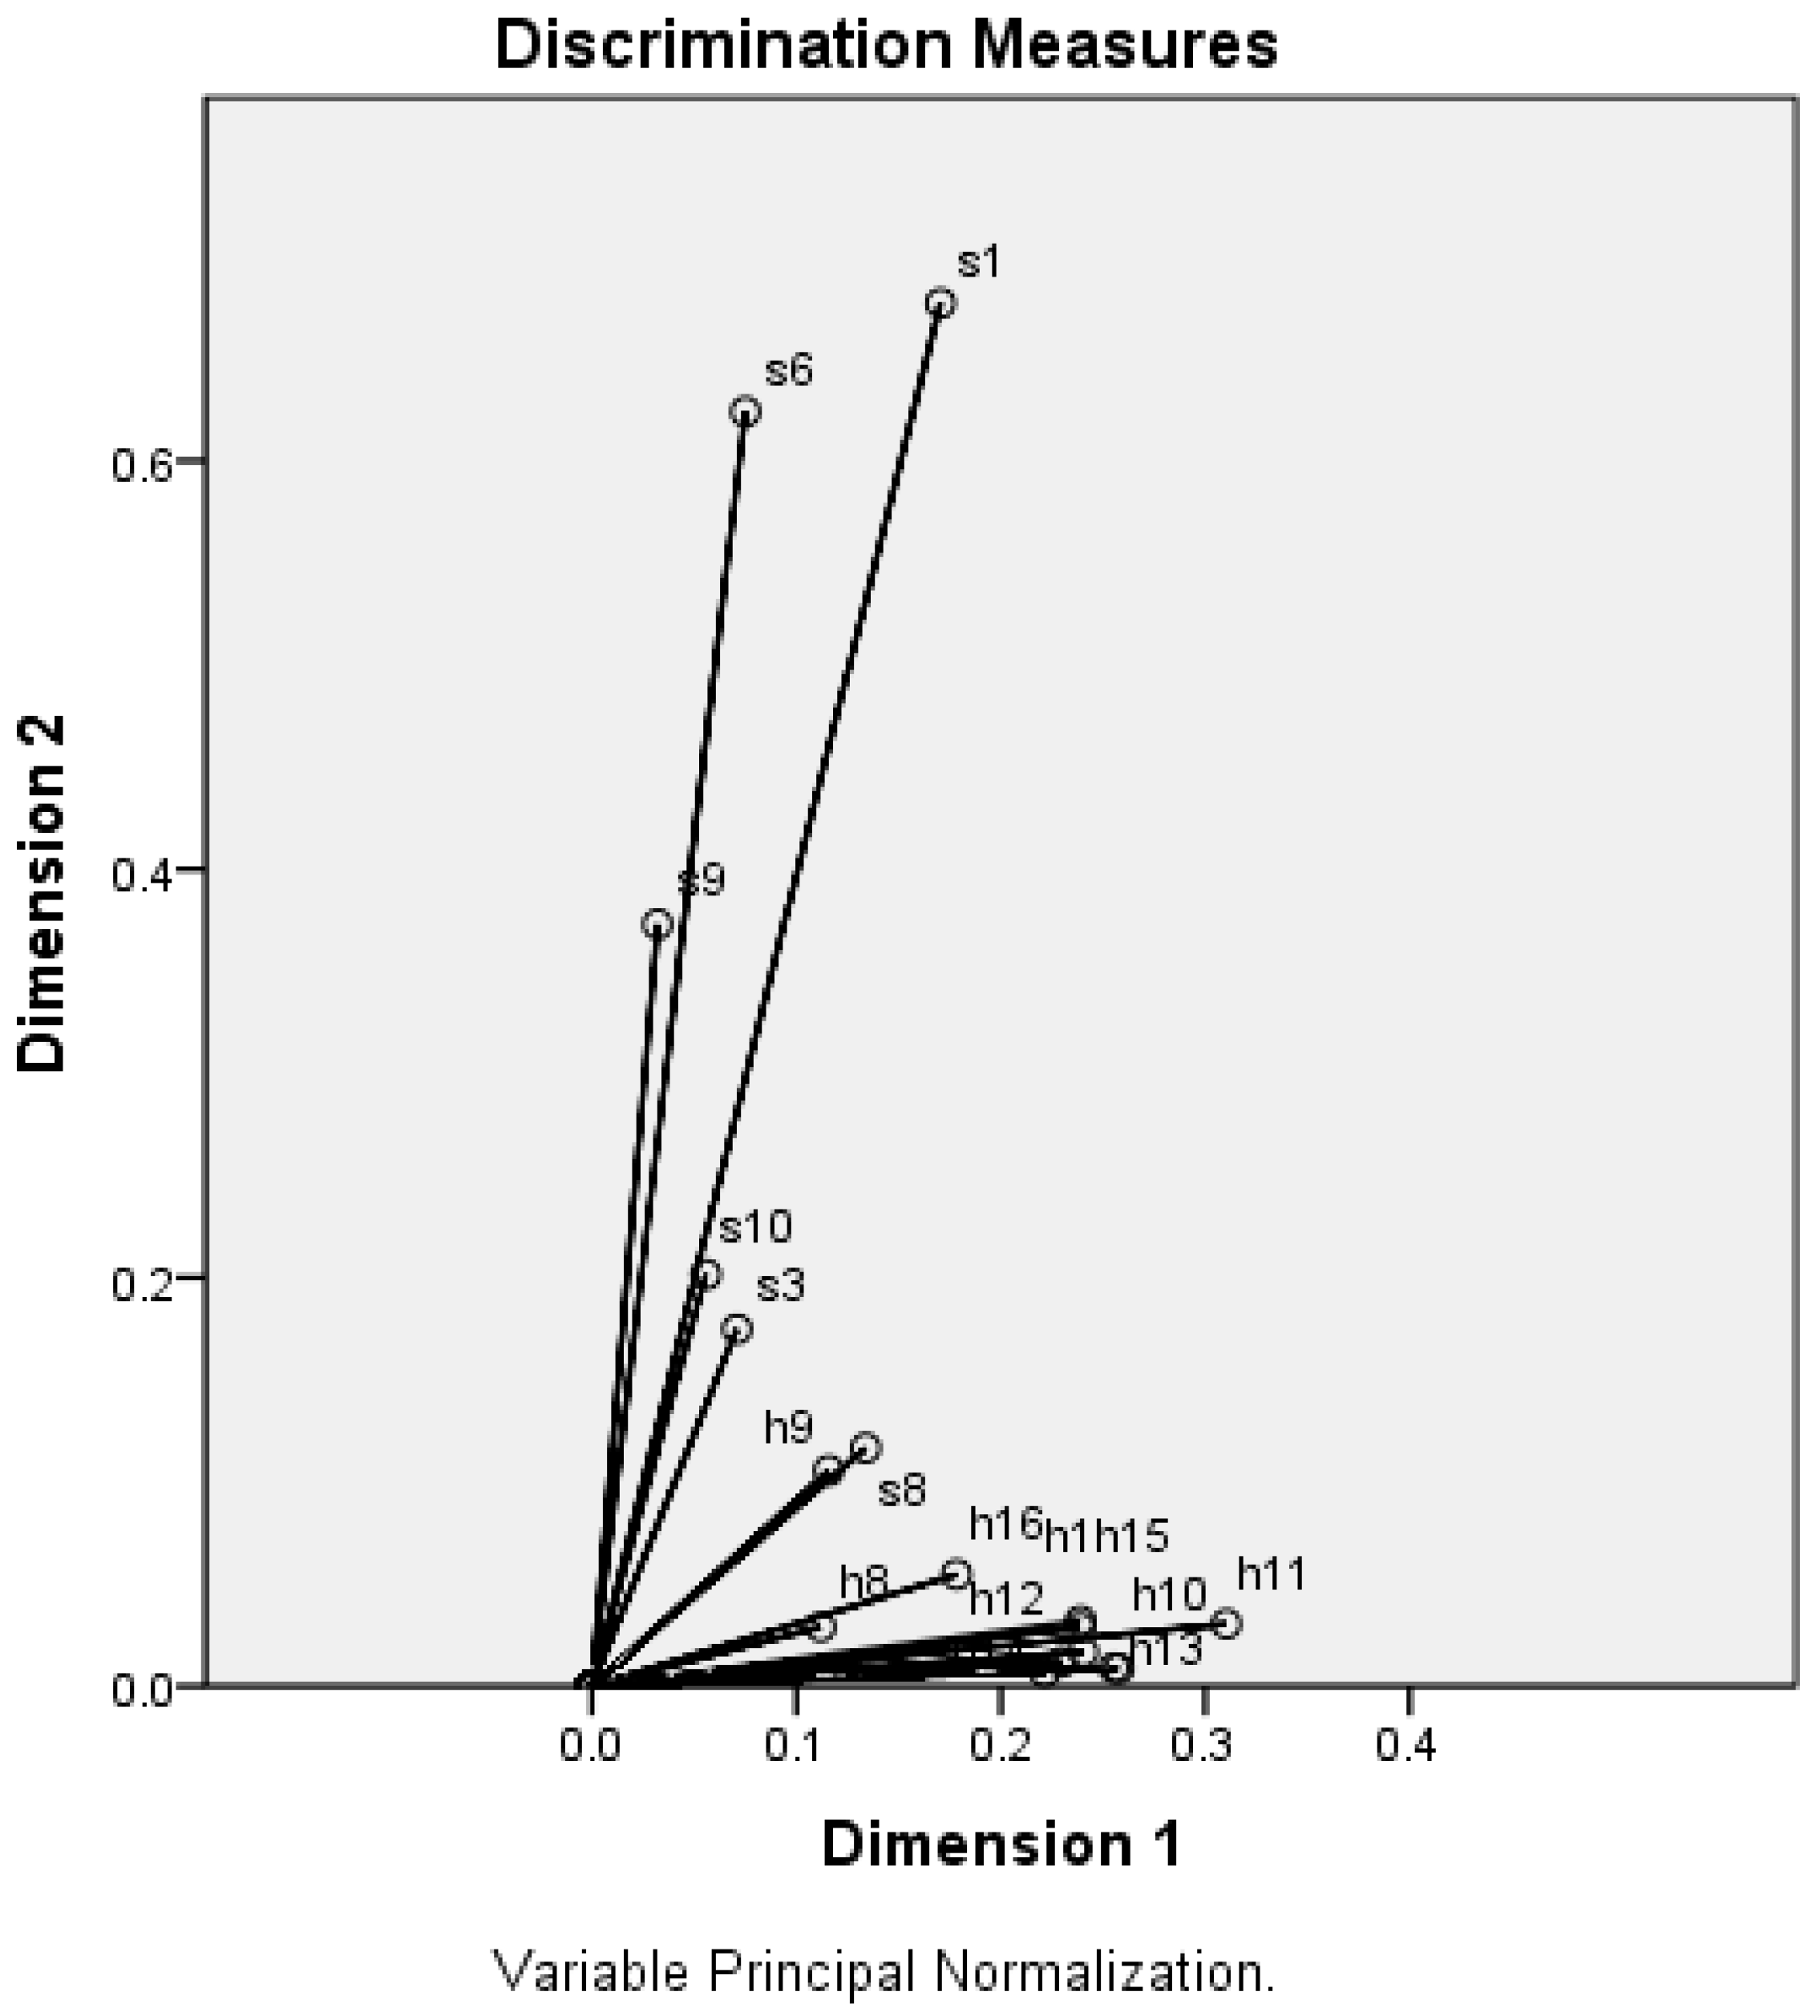
3.6. Categorical Principal Component Analysis (CATPCA) with Optimal Scaling

We applied this data reduction technique with different numbers of items from our survey to arrive at a meaningful solution for further cluster analysis. This nonlinear method allows reducing numerous observed variables to a number of uncorrelated principal components and the representation of variables as vectors in regard to these components [20].
Based on the “Eigenvalue greater than one” criterion [21], we found two dimensions (components) to be analyzed. Thus, the CATPCA method helped us to reduce the initial set of 32 variables into 17 variables, grouped on two clusters that belong to the socio-demographic profile, respectively to the health profile of the participants (Table 5 and Table 6). The two clusters were distributed into two dimensions by CATPCA, explaining together 31.98% of the total variance.
In Figure 1 we can observe two groups of correlated vectors pointing in the same direction, and the length of the vectors indicated the most dominant variables (s1, s6, s9, and respectively h11, h13, h10, h15, h17, h1, h12, h14). As a conclusion, CATPCA has categorized the balance of 17 variables into two different dimensions for the sociodemographic profile and the health status. Both dimensions are almost equally important because account for about as much variance (17.27% and 14.71%) and this reason must be interpreted together to describe different areas [22]. Also, all variables have a positive component loading in both dimensions, which means that there is a common factor that correlates positively with all of the variables for each dimension.

3.7. Two-Step Clustering Analysis

The two-step clustering analysis with the most dominant variables selected through CATPCA revealed a three-cluster solution (Table 7), with a “silhouette measure of cohesion and separation” of 0.25, indicating a fair cluster solution [23]. The variables in Table 6 are hierarchized from top to bottom, from most to less discriminative between clusters. Statistical differences between clusters were compared using Pearson’s Chi-square test for the categorical variables (s6, s9, h1, h10, h11, h12, h13, h14, h15, h17) and one-way ANOVA for the continuous variables (s1–age). For s1 item (age), the mean value is displayed, and for the categorical items, the percent (%) of records is displayed. All variables presented statistically significant differences in regard to the three clusters (p < 0.001).
The three relevant clusters obtained were the following:
(1)
Cluster 1 (n = 491): participants mostly pupils/students (81.5%), young (mean age 22.77 years), with excellent or very good health (83.3%), self-insulated or confined at home (85.7%), who present in a very small proportion the analysed clinical features (between 0–1.2%).
(2)
Cluster 2 (n = 619): participants mostly employed (58.2%), mostly young adults (mean age 33.38 years), in very good or good health (79.6%), self-insulated or confined at home (68.8%), who present in a higher proportion the analysed clinical features (1.4–57.4%).
(3)
Cluster 3 (n = 720): participants mostly employed (83.6%), mostly adults (mean age 41.01 years), with excellent or very good health (65.3), heterogeneous in terms of social isolation, who present in very small proportion the analysed clinical features (0–2.2%).

3.8. Binomial Logistic Regression Analysis

A binomial logistic regression (BLR) was repeatedly performed to ascertain the effects of sociodemographic and health characteristics on the likelihood that participants have the clinical features of SARS-CoV-2 infection. After checking the required assumptions, we run the BLR for each clinical feature item (variables with dichtotomous scale, h8, and h10–h20 items) as the dependent variable, and a model with 11 selected items as independent variables (based on the principle of avoiding multicollinearity): s1, s2, s4, s5, s7, h2, h4, h5, h6, h7, and h21. The logistic regression model was statistically significant (p < 0.001) for h10–h19 items (Table 8).
Table 8 shows the percentages of variance (Nagelkerke R2) that can be attributed to the investigated regression models and the Odds Ratios (OR) for each variable with statistically significant influence in the regression model. These results (Table 8) will be commented on in the Discussion section.

4. Discussion

The present study did not set as its objective the diagnosis of people infected with the SARS-CoV-2 virus, but only the identification of the presence of clinical features that are specific to this disease among the population. The subject is very topical in light of current discussions about the pandemic trend, the movement restrictions imposed at the community level, but also the limited possibilities of mass testing. The identification of risk groups is essential for the subsequent efficient application of the measures of diagnostic, isolation, quarantine, treatment, etc. of the selected cases.
First of all, from this study a series of descriptive informational elements can be detached, which can be analyzed and interpreted in the specific Romanian situational context (for example, the percentage of smokers, the level of Influenza vaccination of the population, the respondent’s level of physical activity, the psychological impact of the pandemic, etc.). It should be mentioned that at the time of completing the data gathering in Romania, 4417 cases of SARS-CoV-2 virus infection were confirmed, 196 deaths were caused by this disease, and about 45,000 diagnostic rRT-PCR tests were performed [24].
Within the two weeks considered, we identified single or associated clinical features that are part of the diagnostic criteria of SARS-CoV-2 virus infection, in a significant percentage of participants (55.5%). In other words, the percentage of detection of clinical elements among the studied sample varied between 33.1% for headache and 0.8% for loss of taste and/or odour. Not all individuals are carriers of the virus, the symptoms of this disease being diverse [25] and largely nonspecific, mainly associated with respiratory and few extrapulmonary signs [26]. On average, subjects who reported symptoms had 2.25 clinical features per individual. The highest correlation recorded (but of low intensity) was between chest pain or chest pressure sensation and dyspnoea (breathing difficulty), suffocation, and/or shortness of breath, respectively between increased fatigue and muscle and/or joint pain. Our results suggest the presence of possible acute respiratory infections among respondents, which may have various aetiologies. Given the present epidemiological situation, we cannot exclude, in a part of the study sample, the variant of infection with the SARS-CoV-2 virus, or the variant of infection or co-infection with other respiratory viruses. The underdiagnoses of SARS-CoV-2 virus infection in the context of respiratory viral coinfections [27], as well as the frequent spread in the population of asymptomatic, presymptomatic or paucisymptomatic forms of the disease, remains a matter of debate [9,28]. However, in the case of Romania, paradoxically, the number of people infected with the SARS-CoV-2 virus and the consecutive deaths were well below the European average at the beginning of the pandemic, a situation that can have multiple explanations. Nevertheless, it remains open the hypothesis according to which the disease may be far more frequent among people of Romania and its prevalence may be underestimated, similar to other countries [29].
The section of our survey for clinical features assessment of infection with SARS-CoV-2 had an acceptable internal consistency. Since we are talking about a condition with a high polymorphism, in which most individuals are asymptomatic or have mild forms [30], the instrument appears to be reliable for early digital health screening, and also easy to be implemented.
Following the application of CATPCA as data reduction technique for the entire survey, the outcomes of the categorized variables showed that we can use only 17 items to investigate the multifaceted profile of the sample group, related to the infection with SARS-CoV-2 virus. Practically, we succeeded to classify the variables into two meaningful dimensions and the total variance is explained for the principal components solution to a percentage of 31.98%. The CATPCA results mapped the nature of the interaction between the sociodemographic profile and the health status of the respondents and therefore we validated the proposed categorization attempt for classification procedure.
Next, we introduced the CATPCA results in a two-step cluster analysis and we reported a model with three meaningful classificatory clusters, statistically different in regard to the variables considered (p < 0.001). Differentiating the three clusters is important because it offers the possibility of separating a risk group for the disease. Thus, the subjects from the second cluster were the most clinically affected, with a heterogeneity of symptoms, but without presenting serious clinical forms of the disease. Identifying this cluster becomes useful because it includes people at higher risk of actually being infected with the SARS-CoV-2 virus. In contrast, the other two clusters (one for young people and one for adults) stand out through a better state of health and almost no clinical manifestations. The hierarchical distribution of clinical features on clusters according to their predictive value is also interesting, the order being h13, h17, h11, h12, h14, h15, h10, different from the one resulting from the CATPCA analysis, according to variance. From the same point of view, prominent hierarchical positions have the social status (s6) and age (s1 item), as determinants of the sociodemographic profile of the subjects.
Most of the symptoms described are superimposable with the major clinical manifestations in all coronavirus infections, including the one with SARS-CoV-2 virus (fever, chills, cough, shortness of breath, generalized myalgia, malaise, drowsy, diarrhoea, confusion, dyspnoea, and pneumonia [25]. Multiple studies report the prevalent clinical manifestations for SARS-CoV-2 infection like fever, cough, dyspnoea, with a fever frequency significantly higher in adults compared to children [6,26,31]. In our study, the second cluster presented the most important fields in estimating the model, based on the predictor importance, in order: the social status, sore throat or dry throat sensation, age, muscle and/or joint pain, and increased fatigue.
It should be mentioned the absence of fever in the last 14 days as an important emerging variable in CATPCA analysis, which is why it was not included in the two-step cluster analysis. This can be correlated with the fact that 49.5% of the subjects stated that they did not measure their temperature during the considered period. Moreover, it has been shown that the correct self-perception of fever is achieved in about 80% of cases if the body temperature is higher than 38 °C [32]. We can plausibly consider that the subfebrile states were not noticed by the respondents and/or the fever does not represent a significant feature for the mild forms of registered respiratory infections. In this regard we recall the results of recent research that estimate that a significant part of people tested positive for SARS-CoV-2 virus infection, with potential for disease transmission, are asymptomatic or have a mild illness, with low or absent fever [33]. Yet another study claims that among people confirmed positive for SARS-CoV-2 virus, fever was uncommon (0.7%), and most individuals (87.8%) were asymptomatic [34].
The results must be interpreted taking into account the testing strategy for SARS-CoV-2 virus in Romania, which implies a prioritization of the subjects according to the medical context, epidemiological investigations, and also the available resources. Even in the most developed countries, the rRT-PCR testing is applied in selected cases, due to the low availability of key supplies [35]. The situation in Romania is also comparable to that of many European countries, which have a similar testing strategy, based on WHO recommendations [36].
In the final stage of the research, a binomial logistic model was tested to establish the relationship between the likelihood that the clinical features of the infection with SARS-CoV-2 are related to the selected predictor variables. The results presented in Table 8 revealed that some predictors are significantly associated with most clinical features (items h10–h19). The most relevant associations according to the proposed regression model refer to predictor items h4, h5, h6, and h21 and s1. Thus, the odds of having some clinical features were greater for smokers, for people with chronic diseases, and people with Influenza or acute respiratory infections in the last 6 months. Also, the systematic face mask wearing outside the home represents a protection factor against the development of clinical features, and increasing age was associated with a higher likelihood of exhibiting some clinical features. However, the Nagelkerke R2 values were relatively small, even the logistic regression models were statistically significant. In other words, the contribution of the mentioned explanatory variables in the prediction of clinical features is statistically significant, but the interpretation must be made with caution because the effect size is small.
Other studies confirm smoking as a risk factor for infection with the SARS-CoV-2 virus, causing more severe forms of the disease [37,38]. In the same sense of interpretation, it has been shown that the infection with the SARS-CoV-2 virus is more frequent in patients with chronic medical conditions [31,39] and with a higher lethality [40]. Our results also indicated the additional risk of presenting clinical symptoms after an episode of Influenza or respiratory acute infection in the last 6 months. Interestingly, the chronic respiratory infections appear to be under-represented in the comorbidities reported for patients with COVID-19, possibly due to an altered immune response or therapies used in these cases [41]. Instead, our data suggest that the status of post-acute respiratory infection increases the risk for respiratory reinfection, possibly with the SARS-CoV-2 virus.
Another notable result of our study was the finding of the protective effect of constant wearing a protective mask when moving out of the home. Thus, this fact has been revealed in meta-analyses that have investigated the effectiveness of these physical methods, as simple and low-cost interventions, to reduce respiratory virus infections [42,43]. Finally, our results confirmed that the risk of presenting the investigated clinical symptoms increases proportionally with age, the young ages being generally spared, as other authors stated [6,44,45].
Overall, we proved the practical usefulness of a survey of self-reporting tracking of symptoms of the SARS-CoV-2 virus. At the moment there is a special interest in developing such web-designed applications and researchers are looking for some predictive models based on clinical symptoms of the disease, which can contribute to target screening strategies [46]. In conclusion, through the statistical approach, we managed to validate the key elements of a survey that can identify a risk group for presenting the specific clinical features of SARS-CoV-2 virus infection, during social distancing imposed by the pandemic situation. Further testing of people at risk for infection will allow the detection of real cases, which require a complex therapeutic approach. Nevertheless, the administration of the questionnaire also has educational and formative values as it helps respondents to acquire knowledge on the clinical manifestations of the SARS-CoV-2 infection. In this way, they can better understand the disease and the importance of self-management of healthy behaviors.

Limitations and Strengths of the Study

One limitation of the study derives from the heterogeneous distribution of the subjects’ age, sex, and territory of residence. This is explained by the fact that the survey was distributed on the web according to the model of social network circles, starting from the authors of the article. Also, it remains to be discussed, as in any study of this type, the honesty of the respondents in conditions of anonymity, as well as their subjectivism in selecting the appropriate answers. Another limitation of the study refers to the low proportion of older adults in the sample, this age group being the most affected by SARS-CoV-2 infection. Instead, the large number of respondents, the accessibility of the questions in terms of content, the very short time to complete the questionnaire, the rapid construction of the database, and the complex statistical analysis of the data proved to be strengths of the research.

5. Conclusions

The present study validated a cost-effective model for rapid assessment of the health status of the Romanian population in the form of an online survey, adapted to the existential circumstances of the SARS-CoV-2 virus pandemic. We determined a reasonable reliability of the survey section for clinical features of SARS-CoV-2 infection (Cronbach’s Alpha 0.671). The CATPCA analysis followed by a two-step cluster analysis revealed a three-cluster solution, with significant differences between clusters (p < 0.001), which allowed the cluster detection of a group of individuals, possibly more affected by the infection with the SARS-CoV-2 virus. Through binomial logistic regression analysis we identified a statistically significant prediction model for the presumptive diagnostic of some relevant clinical features of the infection with the SARS-CoV-2 virus.
Our survey could be easily applied on a large scale, at an institutional level to monitor in real time the health of people facing the consequences of the pandemic. Thus, the approach can support the efforts of making prompt decisions regarding the implementation of health programs, population diagnostic screening, isolation/quarantine of risk groups, and/or hospitalization of serious cases.

Author Contributions

Conceptualization, C.C. and E.I.I.; Methodology, C.C. and E.I.I.; Validation, C.C. and E.I.I.; Formal analysis, C.C. and E.I.I.; Investigation, C.C. and E.I.I.; Data curation, C.C. and E.I.I.; Writing—original draft preparation, C.C. and E.I.I.; Writing—review and editing, C.C. and E.I.I. All authors have read and agreed to the published version of the manuscript.

Funding

This research received no external funding.

Conflicts of Interest

The authors declare no conflict of interest.

References

  1. European Centre for Disease Prevention and Control (ECDP). Rapid risk Assessment: Coronavirus Disease 2019 (COVID-19) Pandemic: Increased Transmission in the EU/EEA and the UK—Eighth Update; EU Publications: Solna, Sweden, 2020; Available online: https://www.ecdc.europa.eu/en/publications-data/rapid-risk-assessment-coronavirus-disease-2019-covid-19-pandemic-eighth-update (accessed on 9 April 2020).
  2. Purcell, L.N.; Charles, A.G. Invited Commentary on “World Health Organization declares global emergency: A review of the 2019 novel Coronavirus (COVID-19)”: Emergency or new reality? Int. J. Surg. 2020, 76, 111. [Google Scholar] [CrossRef] [PubMed]
  3. National Institute of Public Health Romania (NIPHR). Rapid Analysis of Confirmed Cases with of Coronavirus Infection (COVID-19), Romania, 26 February–5 April 2020; NIPHR: Bucharest, Romania, 2020. Available online: https://www.cnscbt.ro/index.php/1643-analiza-cazuri-confirmate-pana-la-5-04-2020/file (accessed on 10 April 2020).
  4. Li, T. Diagnosis and clinical management of severe acute respiratory syndrome Coronavirus 2 (SARS-CoV-2) infection: An operational recommendation of Peking Union Medical College Hospital (V2.0). Emerg. Microbes Infect. 2020, 9, 582–585. [Google Scholar] [CrossRef] [PubMed] [Green Version]
  5. Verity, R.; Okell, L.C.; Dorigatti, I.; Winskill, P.; Whittaker, C.; Imai, N.; Cuomo-Dannenburg, G.; Thompson, H.; Walker, P.G.T.; Fu, H.; et al. Estimates of the severity of coronavirus disease 2019: A model-based analysis. Lancet Infect. Dis. 2020, 20, 669–677. [Google Scholar] [CrossRef]
  6. Su, L.; Ma, X.; Yu, H.; Zhang, Z.; Bian, P.; Han, Y.; Sun, J.; Liu, Y.; Yang, C.; Geng, J.; et al. The different clinical characteristics of corona virus disease cases between children and their families in China—the character of children with COVID-19. Emerg. Microbes Infect. 2020, 9, 707–713. [Google Scholar] [CrossRef] [PubMed] [Green Version]
  7. Lin, L.; Jiang, X.; Zhang, Z.; Huang, S.; Zhang, Z.; Fang, Z.; Gu, Z.; Gao, L.; Shi, H.; Mai, L.; et al. Gastrointestinal symptoms of 95 cases with SARS-CoV-2 infection. Gut 2020, 69, 997–1001. [Google Scholar] [CrossRef]
  8. Giacomelli, A.; Pezzati, L.; Conti, F.; Bernacchia, D.; Siano, M.; Oreni, L.; Rusconi, S.; Gervasoni, C.; Ridolfo, A.L.; Rizzardini, G.; et al. Self-reported olfactory and taste disorders in SARS-CoV-2 patients: A cross-sectional study. Clin. Infect. Dis. 2020, ciaa330. [Google Scholar] [CrossRef] [Green Version]
  9. Day, M. Covid-19: Four fifths of cases are asymptomatic, China figures indicate. BMJ 2020, 369, m1375. [Google Scholar] [CrossRef] [Green Version]
  10. National Institute of Public Health Romania (NIPHR). Document Prepared by National Center for Surveillance and Control of Communicable Diseases. Case Definitions for Acute Respiratory Syndrome with the New Coronavirus (COVID-19) Update 27.03.2020; NIPHR: Bucharest, Romania, 2020. Available online: http://www.cnscbt.ro/index.php/info-medical/1594-definitia-de-caz-covid-19-actualizare-27-03-2020/file (accessed on 10 April 2020).
  11. Kolifarhood, G.; Aghaali, M.; Mozafar Saadati, H.; Taherpour, N.; Rahimi, S.; Izadi, N. Epidemiological and Clinical Aspects of COVID-19: A Narrative Review. Arch. Acad. Emerg. Med. 2020, 8, e41. [Google Scholar]
  12. World Health Organization (WHO). Laboratory Testing Strategy Recommendations for COVID-19. Interim Guidance 22 March 2020; WHO: Geneva, Switzerland, 2020; Available online: https://www.cnscbt.ro/index.php/1590-who-covid-19-lab-testing-2020-1-eng/file (accessed on 10 April 2020).
  13. National Institute of Public Health Romania (NIPHR). Document Prepared by National Center for Surveillance and Control of Communicable Diseases. Test Algorithm for COVID-19, Hospitalization and Discharge, Update 10.04.2020; NIPHR: Bucharest, Romania, 2020. Available online: https://www.cnscbt.ro/index.php/info-medical/1649-algoritm-testare-internare-externare-10-04-2020/file (accessed on 12 April 2020).
  14. Pan, X.B. Application of personal-oriented digital technology in preventing transmission of COVID-19, China. Ir. J. Med. Sci. 2020, 1–2. [Google Scholar] [CrossRef] [Green Version]
  15. Kamel Boulos, M.N.; Geraghty, E.M. Geographical tracking and mapping of coronavirus disease COVID-19/severe acute respiratory syndrome coronavirus 2 (SARS-CoV-2) epidemic and associated events around the world: How 21st century GIS technologies are supporting the global fight against outbreaks and epidemics. Int. J. Health Geogr. 2020, 19, 8. [Google Scholar] [CrossRef] [Green Version]
  16. Stoet, G. PsyToolkit—A software package for programming psychological experiments using Linux. Behav. Res. Methods 2010, 42, 1096–1104. [Google Scholar] [CrossRef]
  17. Stoet, G. PsyToolkit: A novel web-based method for running online questionnaires and reaction-time experiments. Teach. Psychol. 2017, 44, 24–31. [Google Scholar] [CrossRef]
  18. Taber, S.K. The use of Cronbach’s alpha when developing and reporting research instruments in science education. Res. Sci. Educ. 2018, 48, 1273–1296. [Google Scholar] [CrossRef]
  19. Cronbach, L. Coefficient alpha and the internal structure of tests. Psychometrika 1951, 16, 297–334. [Google Scholar] [CrossRef] [Green Version]
  20. Linting, M.; Meulman, J.J.; Groenen, P.J.; van der Koojj, A.J. Nonlinear principal components analysis: Introduction and application. Psychol. Methods 2007, 12, 336–358. [Google Scholar] [CrossRef] [PubMed] [Green Version]
  21. Cattell, R.B. The scree test for the number of factors. Multivariate Behav. Res. 1966, 1, 245–276. [Google Scholar] [CrossRef] [PubMed]
  22. Zeijl, E. Young adolescent leisure. In A Cross-Cultural and Cross-Sectional Study of Dutch and German 10–15 Years-Olds; Opladen: Leske, Budrich, 2001; pp. 82–84. [Google Scholar]
  23. Van den Berge, M.J.C.; Free, R.H.; Arnold, R.; de Kleine, E.; Hofman, R.; van Dijk, J.M.C.; van Dijk, P. Cluster analysis to identify possible subgroups in tinnitus patients. Front. Neurol. 2017, 8, 115. [Google Scholar] [CrossRef] [Green Version]
  24. National Institute of Public Health Romania (NIPHR). Situation of Coronavirus Infections (COVID 19) 8.04.2020; NIPHR: Bucharest, Romania, 2020. Available online: https://www.cnscbt.ro/index.php/situatia-la-nivel-global-actualizata-zilnic/1641-situatie-infectii-coronavirus-covid-19-8-04-2020/file (accessed on 14 April 2020).
  25. Meo, S.A.; Alhowikan, A.M.; Al-Khlaiwi, T.; Meo, I.M.; Halepoto, D.M.; Iqbal, M.; Usmani, A.M.; Hajjar, W.; Ahmed, N. Novel coronavirus 2019-nCoV: Prevalence, biological and clinical characteristics comparison with SARS-CoV and MERS-CoV. Eur. Rev. Med. Pharmacol. Sci. 2020, 24, 2012–2019. [Google Scholar] [CrossRef]
  26. Lupia, T.; Scabini, S.; Mornese Pinna, S.; Di Perri, G.; De Rosa, F.G.; Corcione, S. 2019 novel coronavirus (2019-nCoV) outbreak: A new challenge. J. Glob. Antimicrob. Resist. 2020, 21, 22–27. [Google Scholar] [CrossRef]
  27. Wu, X.; Cai, Y.; Huang, X.; Yu, X.; Zhao, L.; Wang, F.; Li, Q.; Gu, S.; Xu, T.; Li, Y.; et al. Co-infection with SARS-CoV-2 and Influenza A Virus in Patient with Pneumonia, China. Emerg. Infect. Dis. 2020, 26, 1324–1326. [Google Scholar] [CrossRef]
  28. Mizumoto, K.; Kagaya, K.; Zarebski, A.; Chowell, G. Estimating the asymptomatic proportion of coronavirus disease 2019 (COVID-19) cases on board the Diamond Princess cruise ship, Yokohama, Japan, 2020. Euro. Surveill. 2020, 25, 2000180. [Google Scholar] [CrossRef] [PubMed] [Green Version]
  29. Bendavid, E.; Mulaney, B.; Sood, N.; Shah, S.; Ling, E.; Bromley-Dulfano, R.; Lai, C.; Weissberg, Z.; Saavedra-Walker, R.; Tedrow, J.; et al. COVID-19 Antibody Seroprevalence in Santa Clara County, California. medRxiv 2020. [Google Scholar] [CrossRef]
  30. Raoult, D.; Zumla, A.; Locatelli, F.; Ippolito, G.; Kroemer, G. Coronavirus infections: Epidemiological, clinical and immunological features and hypotheses. Cell Stress 2020, 4, 66–75. [Google Scholar] [CrossRef] [PubMed]
  31. Rodriguez-Morales, A.J.; Cardona-Ospina, J.A.; Gutiérrez-Ocampo, E.; Villamizar-Peña, R.; Holguin-Rivera, Y.; Escalera-Antezana, J.P.; Alvarado-Arnez, L.E.; Bonilla-Aldana, D.K.; Franco-Paredes, C.; Henao-Martinez, A.F.; et al. Clinical, laboratory and imaging features of COVID-19: A systematic review and meta-analysis. Travel Med. Infect. Dis. 2020, 34, 101623. [Google Scholar] [CrossRef]
  32. Al-Almaie, S.M. Ability of adult patients to predict absence or presence of fever in an emergency department triage clinic. J. Fam. Community Med. 1999, 6, 29–34. [Google Scholar]
  33. Santarpia, J.L.; Rivera, D.N.; Herrera, V.; Morwitzer, M.J.; Creager, H.; Santarpia, G.W.; Crown, K.K.; Brett-Major, D.; Schnaubelt, E.; Broadhurst, M.J.; et al. Transmission potential of SARS-CoV-2 in viral shedding observed at the University of Nebraska Medical Center. medRxiv 2020. [Google Scholar] [CrossRef] [Green Version]
  34. Baggett, T.P.; Keyes, H.; Sporn, N.; Gaeta, J.M. Prevalence of SARS-CoV-2 infection in residents of a large komeless shelter in Boston. JAMA 2020. [Epub ahead of print]. [Google Scholar] [CrossRef] [PubMed]
  35. Pouwels, K.B.; Roope, L.S.J.; Barnett, A.; Hunter, D.J.; Nolan, T.M.; Clarke, P.M. Group Testing for SARS-CoV-2: Forward to the Past? Pharmacoecon Open 2020, 4, 207–210. [Google Scholar] [CrossRef]
  36. Matheeussen, V.; Loens, K.; Lammens, C.; Vilken, T.; Koopmans, M.; Goossens, H.; Ieven, M. Preparedness of European diagnostic microbiology labs for detection of SARS-CoV-2, March 2020. J. Clin. Virol. 2020, 128, 104432. [Google Scholar] [CrossRef]
  37. Gasmi, A.; Noor, S.; Tippairote, T.; Dadar, M.; Menzel, A.; Bjørklund, G. Individual risk management strategy and potential therapeutic options for the COVID-19 pandemic. Clin. Immunol. 2020, 108409. [Google Scholar] [CrossRef]
  38. Vardavas, C.I.; Nikitara, K. COVID-19 and smoking: A systematic review of the evidence. Tob. Induc. Dis. 2020, 18, 20. [Google Scholar] [CrossRef]
  39. Chow, N.; Fleming-Dutra, K.; Gierke, R.; Hall, A.; Hughes, M.; Pilishvili, T.; Ritchey, M.; Roguski, K.; Skoff, T.; Ussery, E. Preliminary Estimates of the Prevalence of Selected Underlying Health Conditions Among Patients with Coronavirus Disease 2019—United States, February 12 March 28, 2020. Morb. Mortal Wkly Rep. (MMWR) 2020, 69, 382–386. [Google Scholar] [CrossRef]
  40. Deiana, G.; Azara, A.; Dettori, M.; Delogu, F.; Vargiu, G.; Gessa, I.; Stroscio, F.; Tidore, M.; Steri, G.; Castiglia, P. Deaths in SARS-Cov-2 Positive Patients in Italy: The Influence of Underlying Health Conditions on Lethality. Int. J. Environ. Res. Public Health 2020, 17, 4450. [Google Scholar] [CrossRef]
  41. Halpin, D.M.; Farber, R.; Sibila, O.; Badia, J.R.; Agusti, A. Do chronic respiratory diseases or their treatment affect the risk of SARS-CoV-2 infection? Lancet Respir. Med. 2020, 8, 436–438. [Google Scholar] [CrossRef]
  42. Jefferson, T.; Del Mar, C.; Dooley, L.; Ferroni, E.; Al-Ansary, L.A.; Bawazeer, G.A.; Rivetti, A. Physical interventions to interrupt or reduce the spread of respiratory viruses: Systematic review. BMJ 2009, 339, b3675. [Google Scholar] [CrossRef] [PubMed] [Green Version]
  43. Liang, M.; Gao, L.; Cheng, C.; Zhou, Q.; Uy, J.P.; Heiner, K.; Sun, C. Efficacy of face mask in preventing respiratory virus transmission: A systematic review and meta-analysis. medRxiv 2020. [Google Scholar] [CrossRef]
  44. Song, R.; Han, B.; Song, M.; Wang, L.; Conlon, C.P.; Dong, T.; Tian, D.; Zhang, W.; Chen, Z.; Zhang, F.; et al. Clinical and epidemiological features of COVID-19 family clusters in Beijing, China. J. Infect. 2020. [Google Scholar] [CrossRef] [PubMed]
  45. Cianetti, S.; Pagano, S.; Nardone, M.; Lombardo, G. Model for Taking Care of Patients with Early Childhood Caries during the SARS-Cov-2 Pandemic. Int. J. Environ. Res. Public Health 2020, 17, 3751. [Google Scholar] [CrossRef]
  46. Tostmann, A.; Bradley, J.; Bousema, T.; Yiek, W.K.; Holwerda, M.; Bleeker-Rovers, C.; ten Oever, J.; Meijer, C.; Rahamat-Langendoen, J.; Hopman, J.; et al. Strong associations and moderate predictive value of early symptoms for SARS-CoV-2 test positivity among healthcare workers, the Netherlands, March 2020. Eurosurveillance 2020, 25, 2000508. [Google Scholar] [CrossRef]
Figure 1. Categorical principal component analysis (CATPCA) biplot—component loadings of the most explanatory variables. Note: items—s1, s3, s6, s8, s9, s10, h1, h8, h9, h10, h11, h12, h13, h14, h15, h16, h17.
Ijerph 17 05082 g001
Table 1. Summary of the sociodemographic characteristics of study participants (N = 1830).
Item CodeVariableFrequency
(n)
Percent
(%)
s1Age
4–17 years492.7
18–50 years156785.6
51–64 years1809.8
65–90 years341.9
s2Sex
Male49427
Female133673
s3Domicile (42 districts)
District 3 (Arges)114462.5
District 42 (Bucharest)1528.3
Rest of districts53429.2
s4Type of current residence
Urban130371.2
Rural52728.8
s5Type of housing
Individual building96652.8
Collective building86447.2
s6Social status
Toddler/pre-schooler30.2
Pupil/Student58331.8
Employee103356.4
Freelancer955.2
Unemployed170.9
Retired543
Housewife/househusband452.5
s7Travel abroad in the last month
Yes553
No177597
s8Contact with a confirmed SARS-CoV-2 case
Yes60.3
No129470.7
I don’t know53029
s9Current situation related to the social distancing imposed by law
Quarantine693.8
Self-insulated83145.4
Hospitalized10.1
Confined at home41722.8
In the workplace25313.8
Another situation25914.1
s10Average number of contacts with people in the last two weeks
None1659
1–5 people124668.1
6–10 people19710.8
More than 10 people22212.
Table 2. Summary of the health status characteristics of study participants (N = 1830).
Item CodeVariableFrequency
(n)
Percent
(%)
h1Qualitative self-assessment of the health status
Excellent36319.8
Very good82144.9
Good56030.6
Satisfying754.1
Weak110.6
h2Testing for SARS-CoV-2 virus
Tested positive00
Tested negative80.4
Non-tested182299.6
h3Maximum level of physical activity achieved in the last two weeks
Very easy43823.9
Mild46225.3
Moderate74540.7
Vigorous1427.8
Very heavy221.2
Maximal211.1
h4Smoking
Yes51027.9
No132072.1
h5Pathological personal history 1—chronic cardiovascular diseases
Yes1126.1
No171893.9
Pathological personal history 2—chronic respiratory diseases
Yes563.1
No177496.9
Pathological personal history 3—chronic neurological diseases
Yes191
No181199
Pathological personal history 4—chronic renal diseases
Yes261.4
No180498.6
Pathological personal history 5—chronic rheumatic diseases
Yes874.8
No174395.2
Pathological personal history 6—diabetes mellitus
Yes221.2
No180898.8
Pathological personal history 7—oncological diseases
Yes120.7
No181899.3
Pathological personal history 8—others
Yes975.3
No173394.7
Pathological personal history 9—none
Without chronic diseases148481.1
With chronic diseases34618.9
h6Influenza or acute respiratory infections in the last 6 months
Yes45725
No137375
h7Influenza vaccination in the last 6 months
Yes1508.2
No168091.8
h8Clinical feature 1—fever in the last 14 days
Yes211.1
No180998.9
h9Clinical feature 2—maximum body temperature measured in the last 14 days
36.5 °C68437.4
37 °C18610.2
37.5 °C402.2
38 °C70.4
38.5 °C60.3
Non-measured90749.5
h10Clinical feature 3—chills and/or increased perspiration in the last 14 days
Yes613.3
No176996.7
h11Clinical feature 4—increased fatigue in the last 14 days
Yes1618,8
No166991.2
h12Clinical feature 5—episodes of persistent dry or productive cough in the last 14 days
Yes1548.4
No167691.6
h13Clinical feature 6—sore throat or dry throat sensation in the last 14 days
Yes35519.4
No147580.6
h14Clinical feature 7—chest pain or chest pressure sensation in the last 14 days
Yes995.4
No173194.6
h15Clinical feature 8—dyspnoea (breathing difficulty), suffocation and/or shortness of breath in the last 14 days
Yes824.5
No174895.5
h16Clinical feature 9—headache in the last 14 days
Yes60633.1
No122466.9
h17Clinical feature 10—muscle and/or joint pain in the last 14 days
Yes26514.5
No156585.5
h18Clinical feature 11—nasal congestion/leakage of nasal secretions in the last 14 days
Yes38120.8
No144979.2
h19Clinical feature 12—diarrhoea, nausea, loss of appetite and/or vomiting in the last 14 days
Yes935.1
No173794.9
h20Clinical feature 13—loss of taste and/or odour in the last 14 days
Yes140.8
No181699.2
h21Face mask wearing outside the home in the last 14 days
Always85246.6
Occasionally56630.9
Never41222.5
h22Anxiety level in the context of the pandemic with SARS-CoV-2
Not anxious35019.1
Mild anxious74740.8
Moderately anxious56330.8
Very anxious1337.3
Extremely anxious372
Table 3. Multiple response analysis, frequencies and percent of cases.
ResponsesPercent of Cases
nPercent
Items ah8210.9%2.1%
h10612.7%6.0%
h111617.0%15.8%
h121546.7%15.2%
h1335515.5%34.9%
h14994.3%9.7%
h15823.6%8.1%
h1660626.4%59.6%
h1726511.6%26.1%
h1838116.6%37.5%
h19934.1%9.2%
h20140.6%1.4%
Total2292100.0%225.6%
a Dichotomy group tabulated at value 1 (answer yes)
Table 4. Inter-item correlation matrix (clinical features of SARS-CoV-2 infection).
h8h10h11h12h13h14h15h16h17h18h19h20
h81.000
h100.2371.000
h110.0930.2651.000
h120.0780.1630.1911.000
h130.1030.1860.2180.2691.000
h140.0650.1440.1900.1540.1761.000
h150.1250.1220.2310.2480.1740.3571.000
h160.0770.1410.2120.1300.2540.1550.1171.000
h170.0720.1740.3270.1550.1950.1490.1290.2121.000
h180.0580.1220.1350.2520.2320.1090.0910.2230.1181.000
h190.0920.0960.1650.0730.1440.1540.1060.1540.1590.1511.000
h20−0.0090.0890.0830.1090.0840.0340.0420.0050.0710.1090.0651.000
Table 5. Model summary for CATPCA.
DimensionCronbach’s AlphaVariance Accounted For
Total (Eigenvalue)Inertia% of Variance
10.7012.9370.17317.277
20.6382.5010.14714.710
Total 5.4380.320
Mean0.672 a2.7190.16015.993
a Mean Cronbach’s Alpha is based on the mean eigenvalue.
Table 6. Discrimination measures for CATPCA.
DimensionMean
12
s10.1710.6770.424
s30.0710.1750.123
s60.0750.6240.350
s80.1340.1170.125
s90.0320.3730.203
s100.0560.2020.129
h10.2390.0290.134
h80.1120.0290.070
h90.1160.1060.111
h100.2550.0090.132
h110.3100.0300.170
h120.2300.0120.121
h130.2580.0090.133
h140.2210.0070.114
h150.2400.0170.128
h160.1780.0550.116
h170.2390.0320.135
Active Total2.9372.5012.719
% of Variance17.27714.71015.993
Table 7. Characteristics of the three clusters identified by two-step clustering with variable selection based on CATPCA.
Item CodeVariableCluster 1
n = 491
Cluster 2
n = 619
Cluster 3
n = 720
p Value
s6Social status (%) p < 0.001 a
Toddler/pre-schooler0.6%00
Pupil/Student81.5%29.6%0
Employee14.5%58.2%83.6%
Freelance06.1%7.9%
Unemployed0.6%0.8%1.2%
Retired02.1%5.7%
Housewife/househusband2.9%3.2%1.5%
h13Clinical feature 6—sore throat or dry throat sensation in the last 14 days (%) p < 0.001 a
Yes057.4%0
No100%42.6%100%
s1Age (mean ± SD, years)22.77 ± 6.4533.38 ± 12.8441.01 ± 11.59p < 0.001 b
h17Clinical feature 10—muscle and/or joint pain in the last 14 days (%) p < 0.001 a
Yes1.2%39.3%2.2%
No98.8%60.7%97.8%
h11Clinical feature 4—increased fatigue in the last 14 days (%) p < 0.001 a
Yes0.2%25.5%0.3%
No99.8%74.5%99.7%
h12Clinical feature 5—episodes of persistent dry or productive cough in the last 14 days (%) p < 0.001 a
Yes1%23.1%0.8%
No99%76.9%99.2%
s9Current situation related to the social distancing imposed by law p < 0.001 a
Quarantine7.7%4.2%0.7%
Self-insulated50.9%48%39.4%
Hospitalized0.2%00
Confined at home34.8%20.8%16.2%
In the workplace0.6%16.3%20.7%
Another situation5.7%10.7%22.9%
h14Clinical feature 7—chest pain or chest pressure sensation in the last 14 days (%) p < 0.001 a
Yes1.2%1.4%0.1%
No98.8%85.1%99.9%
h15Clinical feature 8—dyspnoea (breathing difficulty), suffocation and/or shortness of breath in the last 14 days (%) p < 0.001 a
Yes0.4%12.9%0
No99.6%87.1%100%
h1Qualitative self-assessment of the health status (%) p < 0.001 a
Excellent32%10.8%19.3%
Very good51.1%38.6%46%
Good16.5%41%31.2%
Satisfying0.2%8.4%3.1%
Weak0.2%1.1%0.4%
h10Clinical feature 3—chills and/or increased perspiration in the last 14 days (%) p < 0.001 a
Yes0%9.9%0
No100%90.1%100%
a Pearson’s Chi-square test. b One-way ANOVA.
Table 8. Outputs of binomial logistic regression analysis (N = 1830).
Independent VariableOmnibus Test of Model Coefficients Model SummaryRegression Coefficients and Significance Level
Chi-Squarep-ValueNagelkerke R SquarePredictorBOR = Exp(B)95% CI for ORp-Value
h1037.5750.0010.080h61.1883.2811.942–5.5420.001
h1152.0590.0010.062h40.5731.7741.254–2.5090.001
h5 *0.7242.0621.376–3.0910.001
h60.7912.2051.571–3.0950.001
h21 (1)−0.5490.5780.382–0.8730.009
h12118.5630.0010.143s5−0.4340.6480.428–0.9820.041
h40.6621.9381.348–2.7860.001
h5 *0.7062.0261.343–3.0580.001
h61.5544.7293.341–6.6930.001
h1343.3700.0010.037h60.7222.0591.602–2.6460.001
h1436.7850.0010.058h40.8422.3221.522–3.5430.001
h5 *0.6211.8601.126–3.0720.015
h60.5741.7761.156–2.7280.009
h21 (1)−0.6880.5020.298–0.8470.010
h1562.8280.0010.110h40.6901.9941.238–3.2120.005
h5 *1.3343.7962.271–6.3430.001
h60.9542.5961.640–4.1090.001
h21 (1)−0.9950.3700.205–0.6660.001
h21 (2)−0.7090.4920.282–0.8590.013
h1694.7660.0010.070s10.0271.0281.019–1.0370.001
s2−0.3840.6810.538–0.8620.001
h40.4041.4981.203–1.8660.001
h5 *0.2991.3481.021–1.7800.035
h60.4241.5281.218–1.9150.001
h1758.0300.0010.055h40.4291.5361.154–2.0430.003
h5 *0.7312.0781.499–2.8820.001
h60.6121.8441.392–2.4440.001
h1850.5970.0010.043s10.111.0111.001–1.0210.028
h40.2941.3421.045–1.7240.021
h60.6011.8241.423–2.3360.001
h21 (1)−0.4330.6490.484–0.8690.004
h21 (2)−0.3990.7120.544–0.9310.013
h1937.6460.0010.062s10.0401.0411.021–1.0620.001
s71.0202.7721.126–6.8230.027
h5 *0.7032.0201.193–3.4190.009
h60.7212.0571.325–3.1920.001
Note: * subitem h5 (Pathological personal history 9—none); OR—Odds Ratio; p—significance level; for all items, the last answer represents the reference category; (1): always wearing face mask; (2): occasionally wearing face mask

