1. Introduction
Adolescents initiate alcohol use in a stage when development has not yet finished. In Spain, 13.2% people aged 15–24 drank alcohol in public settings [
1]. Moreover, 58.5% of adolescents consumed alcohol in the last month, and almost a quarter (23.7% boys and 25.0% girls) engaged in acute alcohol intoxication in the last month [
2]. The European School Survey Project on Alcohol and Other Drugs [
3] indicates that the European average proportion of alcohol intoxication among 16 year-olds is 13%, while in Spain this average proportion reached 21%. This behavior places them at risk for negative consequences, especially during this developmental stage [
4,
5,
6].
Measurement of alcohol use often relies on self-reported measures (i.e. number of alcoholic drinks used, perception of drunkenness). However, self-reported measures can be inaccurate when they are collected in drinking environments, particularly among younger drinkers since situational factors can affect them [
7]. Further, the exposure to other people’s drinking may be shaping the perception of context-related drinking norms [
8,
9,
10,
11,
12]. Moreover, perception of drunkenness is also related to the intoxication level of other members in the group, mainly those in the same gender group [
13]. Studies that assess alcohol use with an objective measure have also found that drinkers in naturalistic settings inaccurately estimate their intoxication [
7,
14].
On the other hand, it seems that gender and age also have an influence in the accuracy of alcohol use estimation. In this sense, it has been found that females and participants under 21 years of age tend to underestimate their breath alcohol concentration (BrAC) [
15], although some authors consider that the influence of gender on BrAC estimation needs further research [
16].
The aim of this study is (a) to describe alcohol use and perception of drunkenness in open-air public settings, (b) to analyze the relationship between objective and subjective measures of alcohol use, and (c) to assess the influence of individual and contextual factors on alcohol use.
2. Materials and Methods
A total of 1475 participants (organized into 355 groups of friends) who were participating in botellon (gatherings of binge-drinkers in open-air) in public settings in the city of Palma (Balearic Islands, Spain) accepted to be anonymously interviewed (15.3% declined to participate). Convenience sampling was used to select participants. Interviewers collected information about the public settings where young people were going to meet and went there to interview them.
Participants had a median age of 21 years (interquartile range = 5) and 47.4% were women. The World Health Organization defines ‘Youth’ as the 15–24-year age group and ‘Adolescents’ as individuals in the 10-19-year age group. Following WHO classification, we found 27.8% adolescents in our sample. Moreover, 8.5% were under the minimum age limit for alcohol drinking in Spain which is 18 years.
Table 1 shows the proportion and number of males and females in each age group.
Upon recruitment, participants completed a survey, which included a brief interview about sociodemographic factors (gender, age), perception of drunkenness (Likert scale, 1 being totally sober and 10, totally drunk), number of alcoholic beverages drunk, and consumption of food in the previous 2 h. In order to have an objective measurement of alcohol concentration, we assessed breath alcohol concentration (BrAC) (mg/L) with a breathalyzer (Zaphir 3500BT, Consumer Design Products, Madrid, Spain). Regarding social factors, we calculated the proportion of peers in the natural group of friends who had BrAC = 0 and we created a dichotomous variable indicating whether all the members in the group of friends had a BrAC > 0 or some member had a BrAC = 0. Participants were also asked to answer the alcohol use disorders identification test (AUDIT) [
17]. Finally, we calculated the amount of time that had passed between first drink and the assessment of BrAC. Information was collected through the Limesurvey mobile app [
18].
Recruitment occurred on Thursday, Friday, and Saturday nights. All participants provided verbal informed consent. Ethical approval was granted by the ethics committee of University of Balearic Islands (approval number 75CER18). Between 11 p.m. and 3.30 a.m., teams of 2–5 researchers randomly selected the groups to be interviewed. Before assessing the BrAC, participants were asked to rinse their mouth with water to eliminate any residual alcohol traces. There were no financial incentives for participation.
Before approaching participants, researchers visually assessed their level of drunkenness based on three visual indicators of intoxication: how steady they were on their feet, whether they were swaying, and how loud they were talking [
19]. Special attention was given to ethical concerns on interviewing intoxicated individuals. Interviewers were instructed not to approach individuals who appeared to be extremely intoxicated or aggressive. Furthermore, members of the research team were trained to call the emergency services when a person showed signs of alcohol poisoning and to help them, especially underage participants, if they had drunk. Finally, participants who had a BrAC higher than the Spanish legal limit (0.25 mg/L) were told not to drive.
3. Results
3.1. Breath Alcohol Concentration and AUDIT Scores
Regarding alcohol use, it is worth noting that most of the sample (80.2%, n = 1183) had a BrAC score higher than 0 when they were interviewed. Sample demographics and BrAC scores of participants with BrAC higher than 0 are listed in
Table 2. Statistics show that the distribution of the variable does not fit the normal distribution. Participants had a BrAC median score of 0.23.
Comparison of people with BrAC = 0 and people with BrAC > 0 in terms of individual characteristics can be observed in
Table 3. It is remarkable that men and women were not equally represented in the two groups: we found more women with BrAC = 0 and more men with BrAC > 0. Moreover, participants with BrAC > 0 were older and most of them were employed. It is worth noting also that 24.5% of participants with BrAC > 0 were adolescents and 7% of participants with BrAC > 0 did not have the minimum age limit for alcohol drinking in Spain.
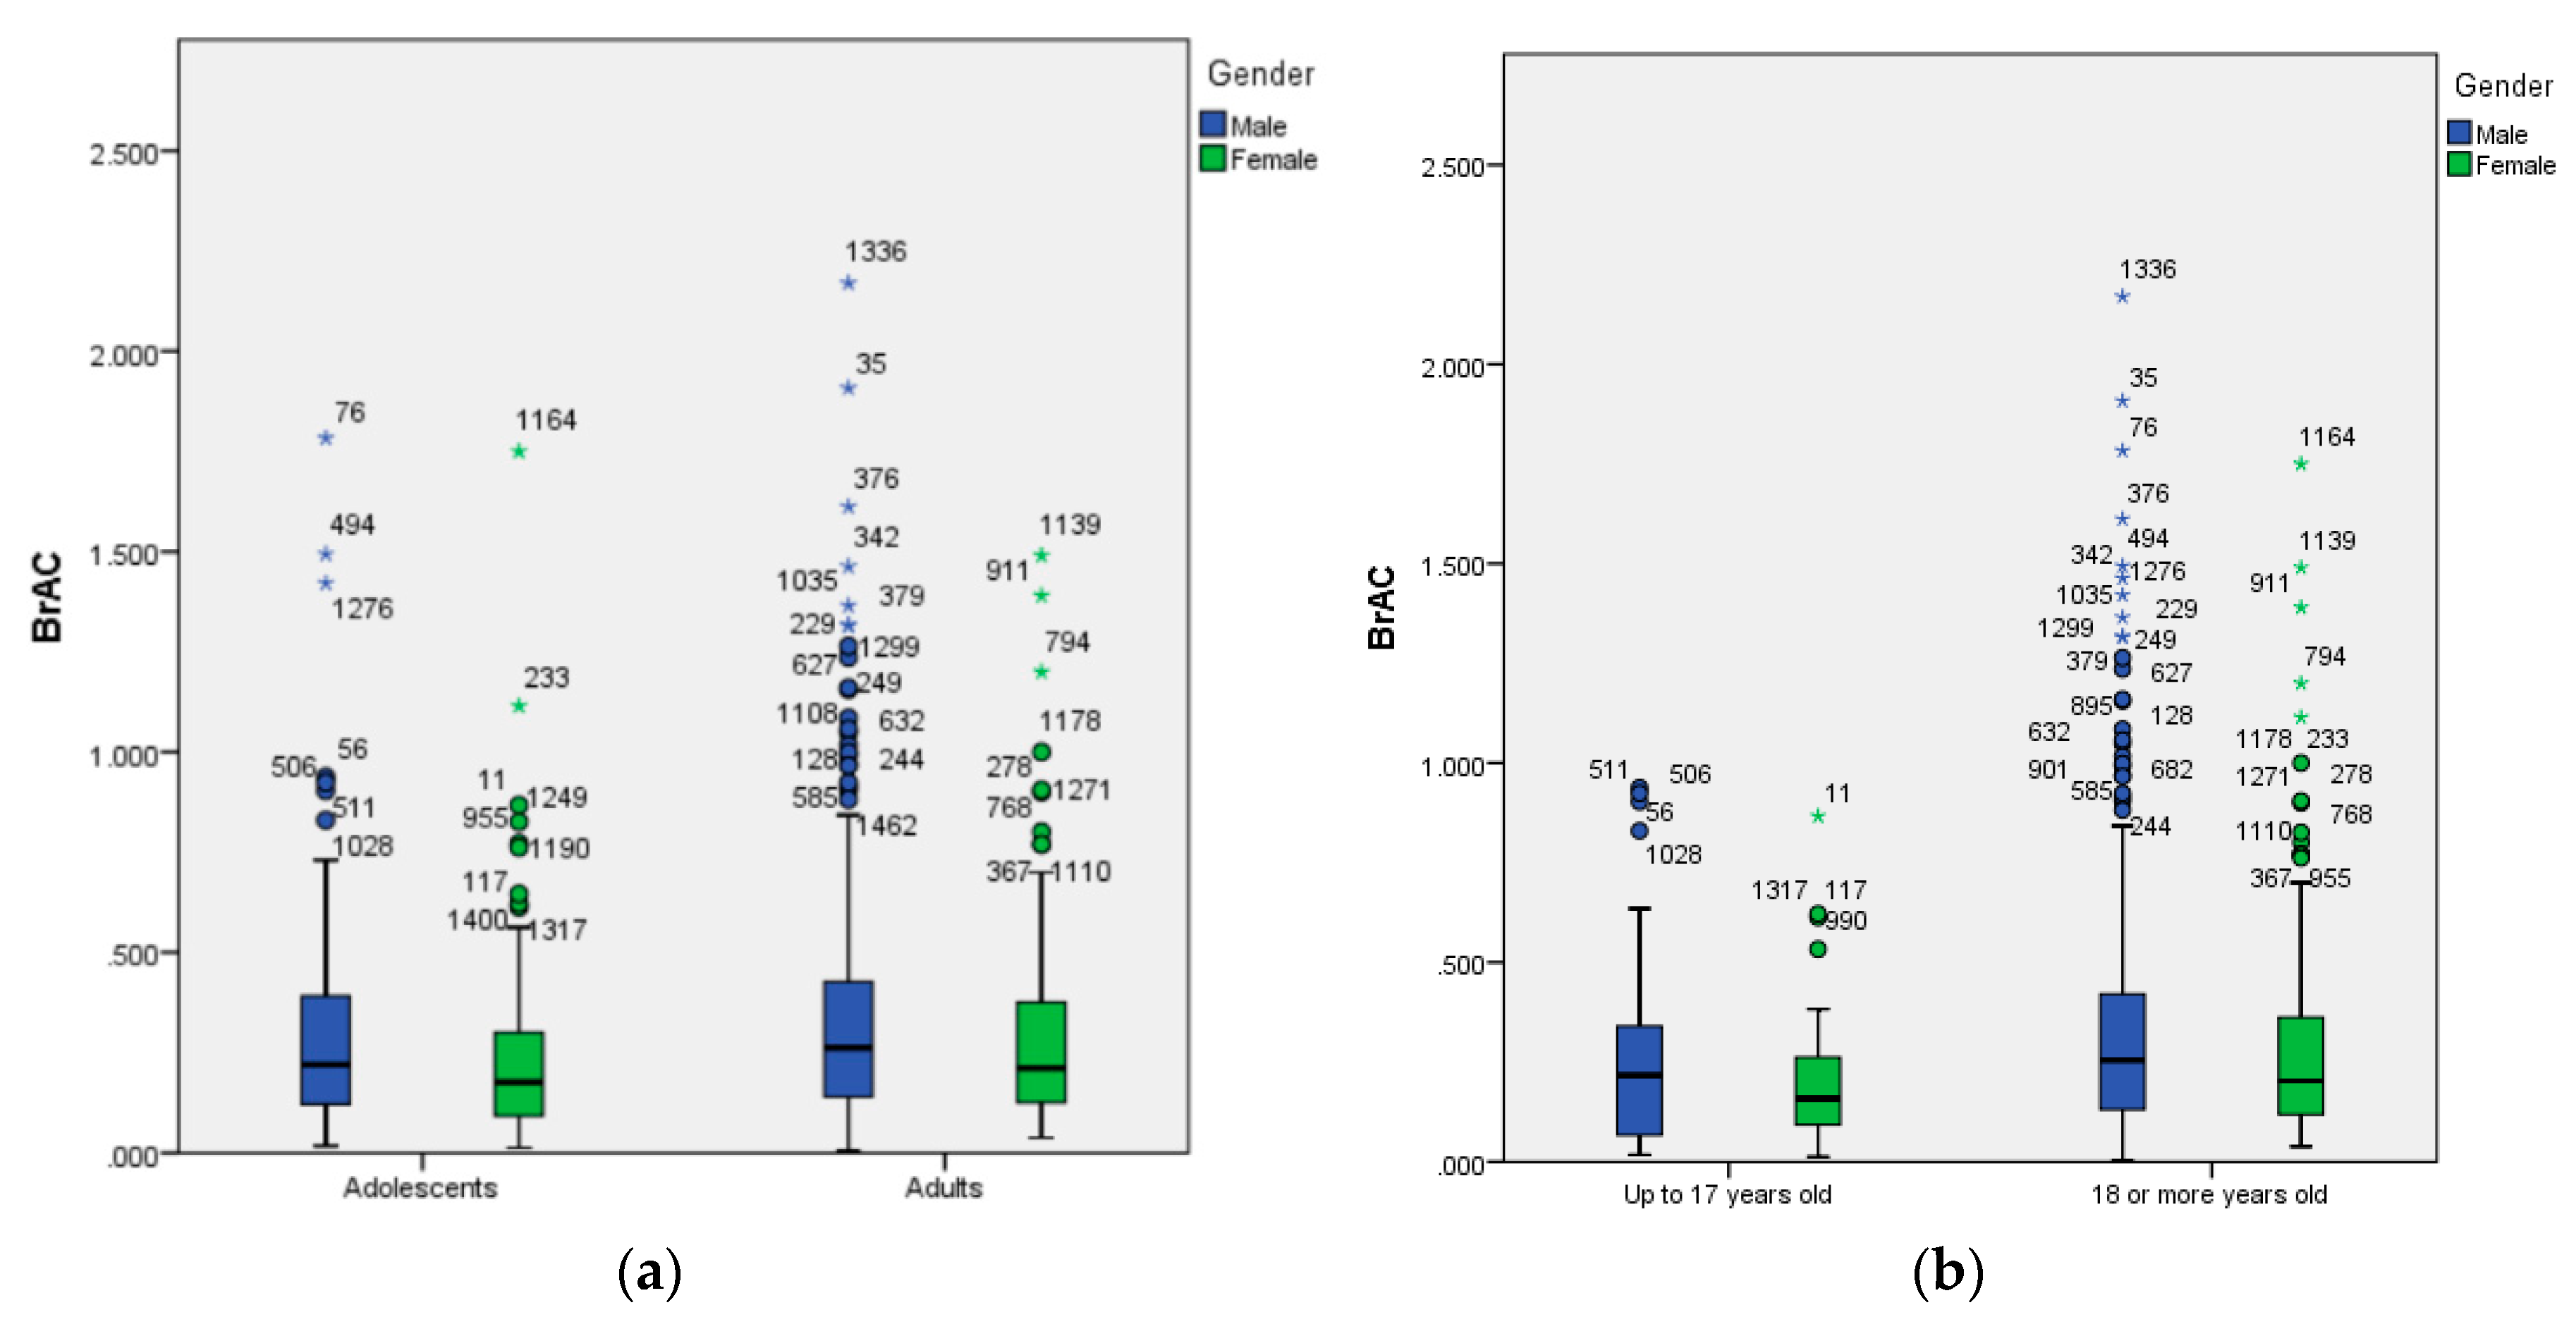
We found statistical differences by gender and age in BrAC: men had higher alcohol concentration scores (mg/L) than women, regardless of their age, and adolescents presented lower BrAC than people above 19 years old (see
Table 4). However, there was no statistically significant difference in the mean BrAC of participants under and above the minimum age limit for alcohol drinking in Spain.
Figure 1 shows the graphic representation through boxplot of BrAC scores by age and gender. Using robust statistics, we can also see that men showed higher BrAC scores than women, regardless of the age group. Moreover, there is a remarkably high proportion of outliers, especially in male adults.
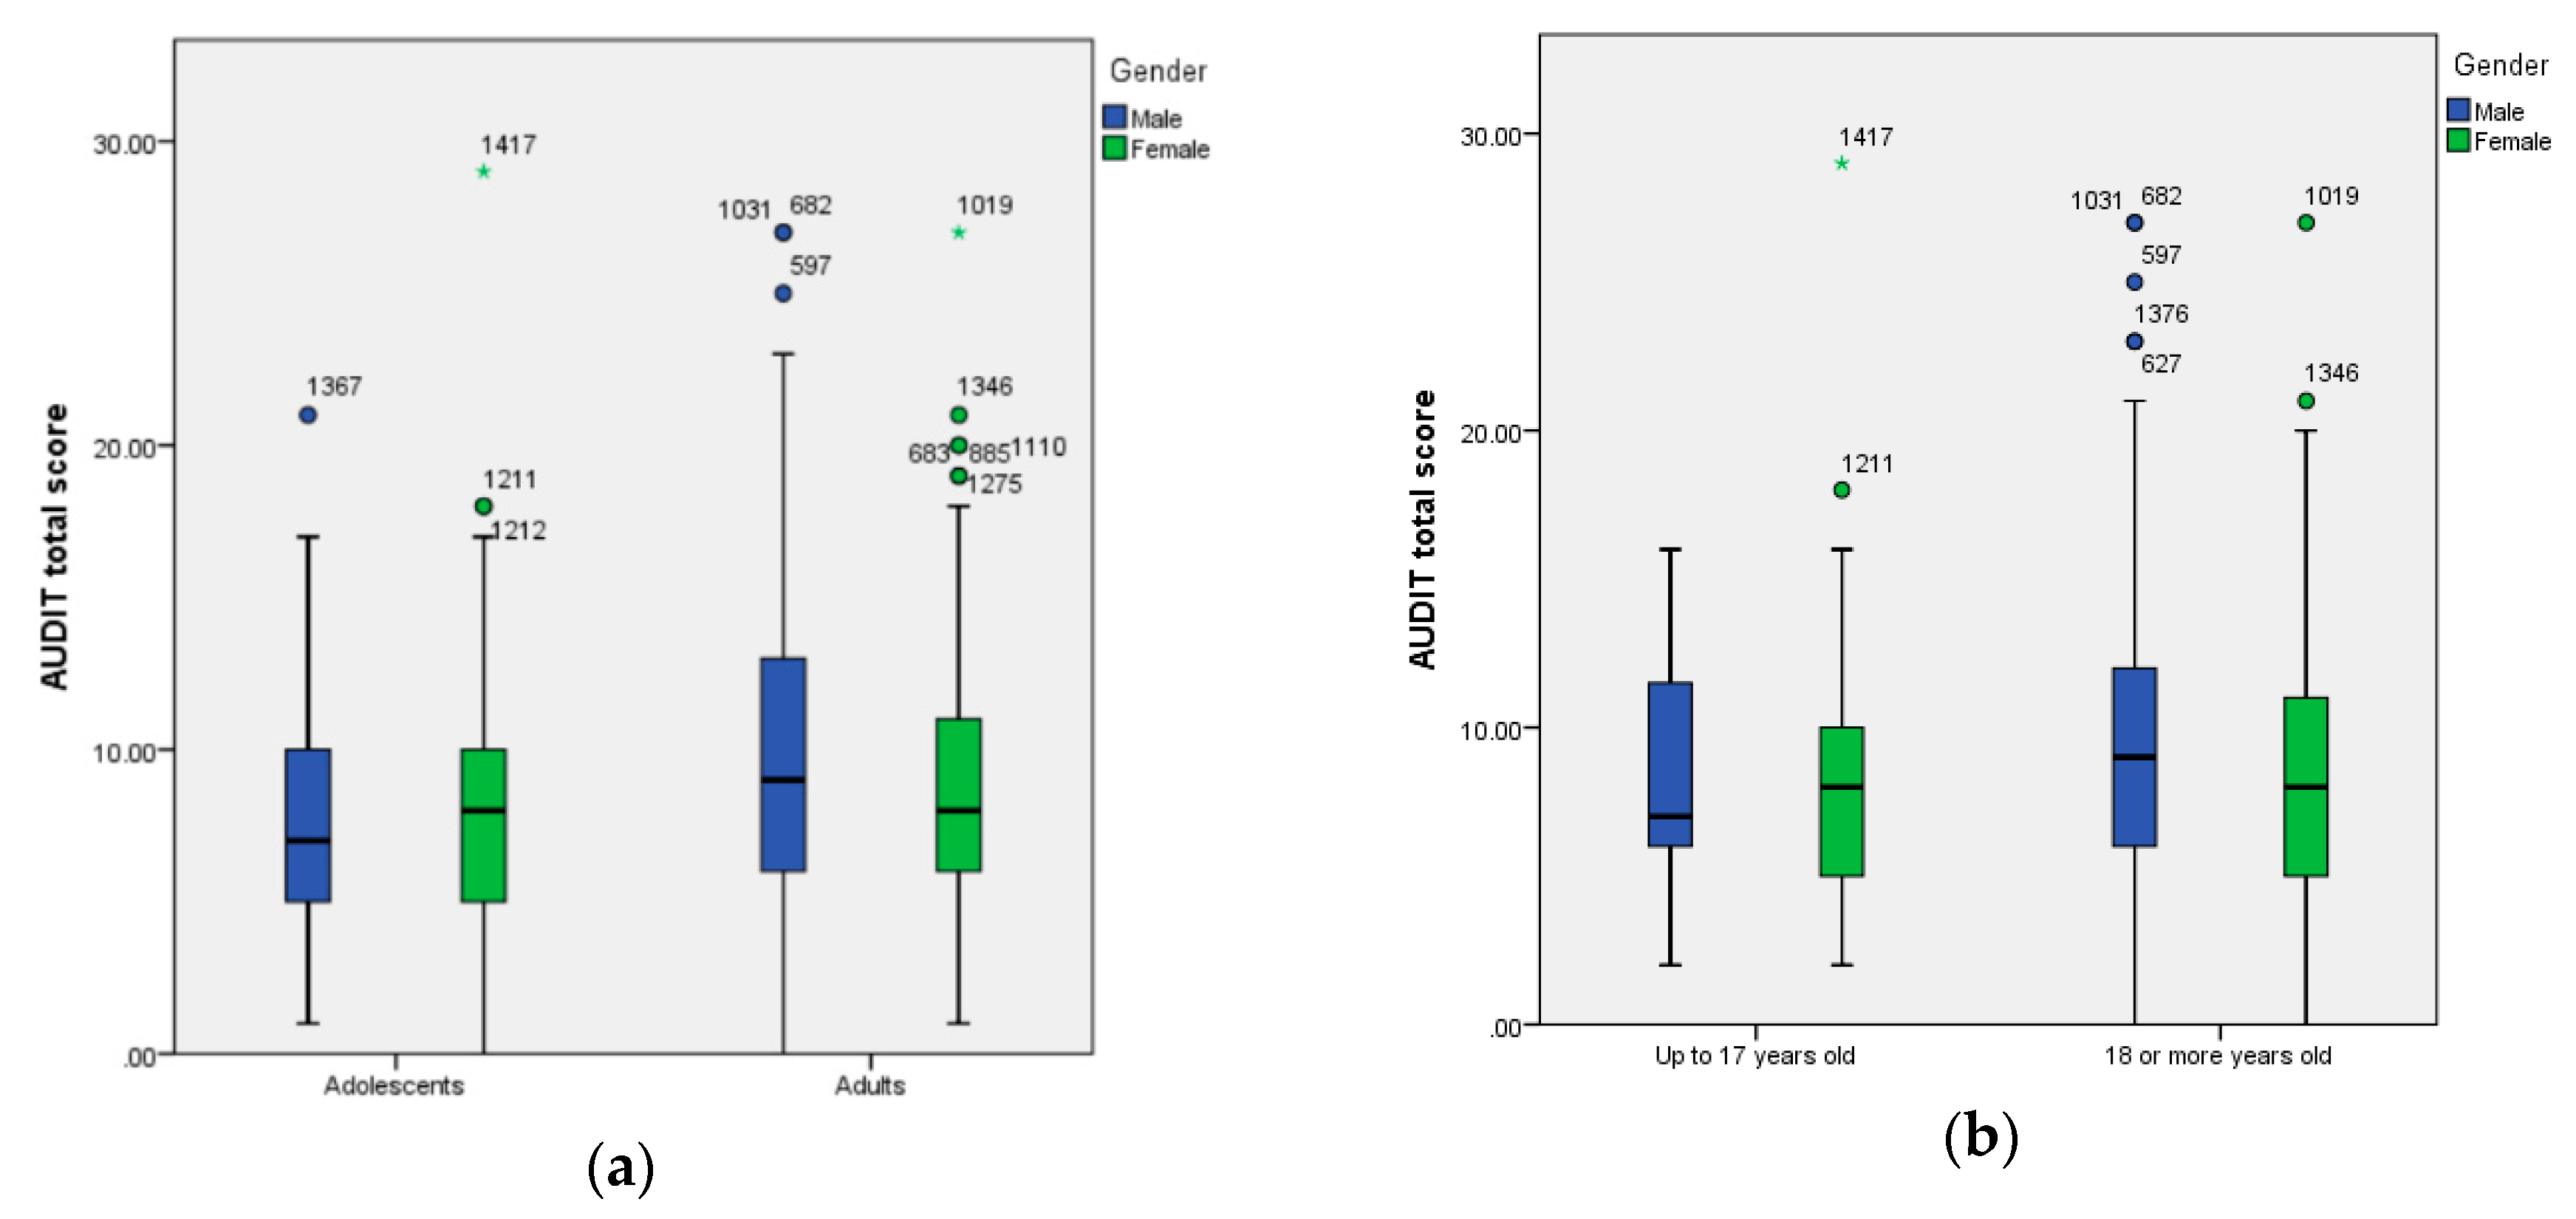
Regarding AUDIT scores, men also showed higher scores than women in the adults’ sample. However, we did not find statistical differences in AUDIT scores by gender among the adolescents’ group, which indicates that adolescent boys and girls showed the same scores in the screening of risky alcohol use. Finally, adults had higher scores than adolescents in the AUDIT score (see
Table 5), while this difference was not statistically significant if we compare AUDIT scores of participants under and above the age limit for alcohol drinking in Spain.
Figure 2 shows the graphic representation through boxplot of AUDIT scores by age and gender. Using robust statistics, we can also see a different pattern by age: while males show higher scores than females among the sample of adults, females present higher scores than males in the underage sample (b).
3.2. Relationship Between Objective and Self-Reported Measures
To analyze if there was a relationship between objective and self-reported measures of alcohol use, we ran correlations between these two factors for those participants with BrAC > 0 and we controlled by the amount of time they have spent in the public setting. Results showed that correlations were low but statistically significant (see
Table 6). Accordingly, coefficients of determination (R
2) are weak in all the subsamples.
3.3. Influence of Contextual Factors on Alcohol Use
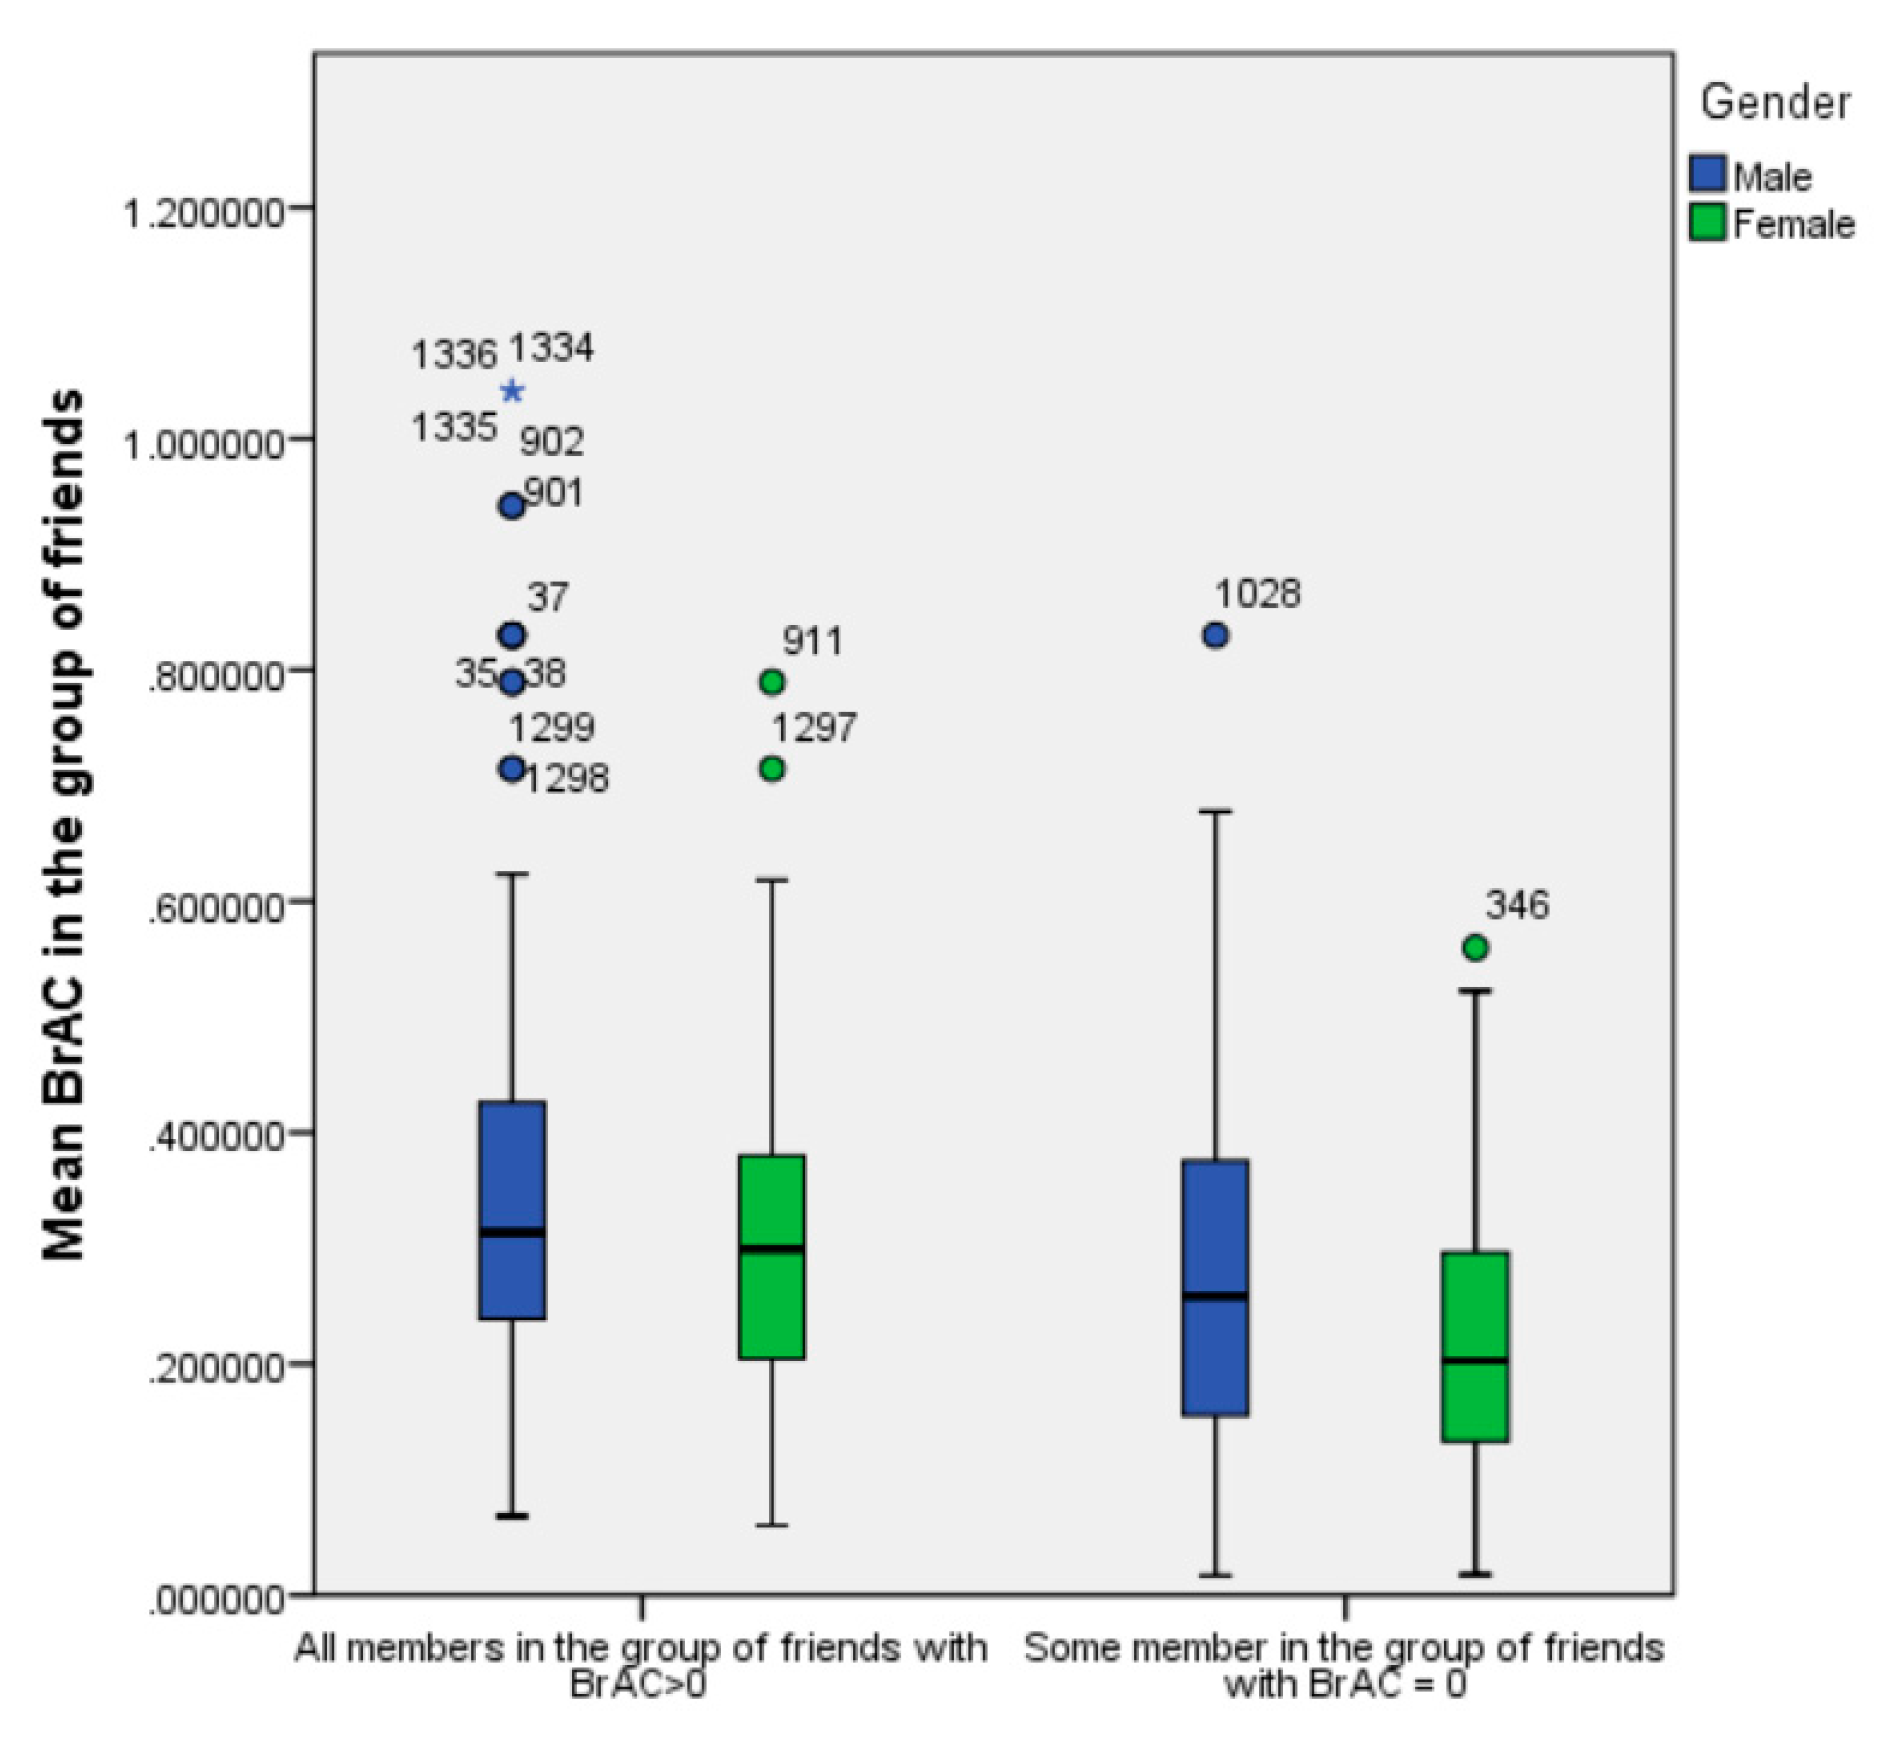
In order to assess the influence of contextual factors on alcohol use, we also collected objective and self-reported information on the group of friends. The comparison of BrAC means in groups formed by all members with a BrAC > 0 and groups with sober components indicated that BrAC scores decrease when some friends in the group are sober. Hypothesis testing showed that the mean difference remained statistically significant (see
Table 7). In order not to underestimate the average value of BrAC in the group of friends, we eliminated the values for sober people. So, average BrAC in the group represents the value of BrAC only for those who had BrAC > 0.
Figure 3 shows the boxplot graphic representation of the average BrAC scores in the group of friends by gender and participation or absence in the group of sober members. Using robust statistics, we can observe that, when all members in the group had BrAC > 0, the average of alcohol concentration in the group was higher than the average BrAC score for groups where member/some members was/were sober. The high proportion of outliers was remarkable, especially in men with all friends with BrAC > 0.
Finally, to assess the influence of individual and contextual factors on alcohol use, multiple linear regressions were calculated to predict BrAC. Factors assessed in this study include the proportion of sober people in the group, gender, age, AUDIT score, proportion of peers with a risk score in AUDIT, number of alcoholic drinks consumed and intake/ingestion of food in the previous two hours. We ran the models separately for adolescents and young adults, controlling by the amount of time they had spent in the public setting. Results show that among young adults, a significant regression equation was found (F (8, 604) = 29.649;
p < 0.001), with an adjusted R
2 of 0.272. Young adults’ predicted BrAC is shown in Equation (1), highlighting social (proportion of sober friends and proportion of peers with risk AUDIT) and individual (number of alcoholic drinks consumed) variables as relevant in the estimation of BrAC scores:
The model was also statistically significant for adolescents (F (8,54) = 3.278;
p = 0.004) with an adjusted R
2 of 0.227. Adolescents’ predicted BrAC is shown in Equation (2) and indicates that only the proportion of sober friends is a relevant variable to predict BrAC:
The model was also statistically significant for participants under the minimum legal age to drink in Spain (18 years of age) (F (8,220) = 6.549; p < 0.001) with an adjusted R2 of 0.163. However, only the intake/ingestion of food in the previous two hours was a statistically significant factor to predict BrAC in this subgroup.
4. Discussion
The aim of this study was to describe alcohol use and perception of drunkenness in public settings, to analyze the relationship between objective and subjective measures of alcohol use, and to assess the influence of social factors on alcohol use. We found that more than 80% of people participating in
botellon in open-air public settings at night were drinking alcohol, more than a quarter of them were adolescents and 7% of those who were drinking did not have the legal age to use alcohol in Spain. Males had higher alcohol concentration scores (mg/L) than females, and adults showed higher values than adolescents. Regarding AUDIT scores, we found that males had higher scores than women among adults, while underage girls showed higher scores than boys. In this sense, it is worth noting the high mean values for AUDIT scores found in participants, being all of them above traditional risk thresholds [
20] and the psychosocial and health consequences that this risk alcohol use may be linked with, especially in females.
Regarding the relationship between objective and subjective measures of alcohol use, it is noteworthy that they were low. Our results are in line with previous studies assessing alcohol use with an objective measure which have found that participants tend to underestimate their breath alcohol concentration [
15]. Some authors have shown that the perception of the effects of alcohol in terms of drunkenness seems to vary across countries [
21]. Future studies may assess if these results vary depending on local culture.
Finally, in line with other works [
11,
12,
13,
14,
22,
23,
24] our results highlight the relevance of social variables on alcohol use, although it seems that age plays an important role on this relationship. In this sense, having sober friends is associated with a reduced breath alcohol concentration, especially in adolescence. Moreover, in young adults, social (proportion of sober friends and proportion of peers with risk AUDIT) and individual (number of alcoholic drinks consumed) variables were statistically significant factors to predict BrAC. However, only the proportion of sober friends in the group was a statistically significant factor to predict BrAC in the subgroup of adolescents.
Future studies should analyze if people pre-drinking in open-air public settings have higher or lower consumption when moving to a venue later on. Some research has shown that, even if the reason posed for drinking in public settings is to save money when moving to a venue pre-drinkers tend to show higher consumption rates [
12]. Future research may also assess if some individual factors might influence others to drink in a social drinking context. In this sense, some research has found that members of a higher status engaged in the most alcohol consumption only in heavier drinking groups [
25].
Our study has some limitations. The list of items assessed in the survey was limited by the characteristics of the natural setting and, therefore, we have not assessed some factors that could potentially contribute to alcohol use, namely personality factors. Moreover, participants could have completed the assessment on more than one occasion, which limits the generalizability of the findings. Due to the cross-sectional perspective of this study, we cannot assess if peer influence or selection processes have formed the group of friends. However, reciprocal influences have been found in adolescence between drinking and frequently being chosen as a friend [
26]. Finally, factors that can influence alcohol absorption (i.e., the pattern of drinking throughout the night, tolerance) were not included in the questionnaire.
5. Conclusions
The current study advances knowledge of the relationship between subjective drunkenness and objective assessment of intoxication and the role of social factors on alcohol use in a natural setting, with a big sample of participants including adolescents. These results support the emphasis on peer influence and contextual factors in preventive programs.
Author Contributions
Conceptualization, E.G. and A.S.; Methodology, A.S. and E.G.; Software, R.J.; Formal analysis, E.G. and R.J.; Investigation, J.A.; Resources, M.D.; Data curation, R.J.; Writing—Original draft preparation, E.G.; Writing—Review and editing, E.G., R.J., M.D., and J.A.; Visualization, R.J. and E.G.; funDing acquisition, M.D. All authors have read and agreed to the published version of the manuscript.
Funding
This research was co-financed by 3rd Health Programme (Grant agreement 70966) and partially funded by Palma City Council.
Acknowledgments
We thank all the student research collaborators who participated in the data collection.
Conflicts of Interest
The authors declare no conflict of interest.
References
- Spanish Drug Monitoring Agency. Encuesta domiciliaria sobre Alcohol y otras Drogas en España (EDADES) [Household Survey on Alcohol and Drugs in Spain]. Available online: http://www.pnsd.mscbs.gob.es/profesionales/sistemasInformacion/sistemaInformacion/pdf/2017_Estadisticas_EDADES.pdf (accessed on 16 March 2020).
- Delegación del Gobierno para el Plan Nacional Sobre Drogas (DGPNSD). Encuesta Sobre el uso de Drogas en Enseñanzas Secundarias en España (ESTUDES) 2018–2019; Ministerio de Sanidad, Consumo y Bienestar Social: Madrid, Spain, 2019. Available online: http://www.pnsd.mscbs.gob.es/profesionales/sistemasInformacion/sistemaInformacion/pdf/ESTUDES_2018-19_Informe.pdf (accessed on 25 March 2020).
- European Monitoring Center for Drugs and Drug Addiction. The European School Survey Project on Alcohol and Other Drugs (ESPAD) Report 2015; Publications Office of the European Union: Luxemburg, 2016.
- Bellis, M.A.; Hughes, K.; Calafat, A.; Juan, M.; Ramón, A.; Rodríguez, J.A.; Phillips-Howard, P. Sexual uses of alcohol and drugs and the associated health risks: A cross-sectional study of young people in nine European cities. BMC Public Health 2008, 8. [Google Scholar] [CrossRef] [PubMed] [Green Version]
- Connor, J.; Cousins, K.; Samaranayaka, A.; Kypri, K. Situational and contextual factors that increase the risk of harm when students drink: Case-control and case-crossover investigation. Drug Alcohol. Rev. 2014, 33, 401–411. [Google Scholar] [CrossRef] [PubMed]
- Marshall, E.J. Adolescent Alcohol Use: Risk and Consequences. Alcohol. Alcohol. 2014, 49, 160–164. [Google Scholar] [CrossRef] [PubMed] [Green Version]
- Rossheim, M.E.; Barry, A.E.; Thombs, D.L.; Weiler, R.M.; Krall, J.R.; Stephenson, C.J.; Walters, S.T.; Reed, M.B.; Clapp, J.D.; Suzuki, S.; et al. Factors Associated with Self-Estimated Breath Alcohol Concentration Among Bar Patrons. Alcohol. Clin. Exp. Res. 2017. [Google Scholar] [CrossRef] [PubMed]
- Kuendig, H.; Kuntsche, E. Solitary Versus Social Drinking: An Experimental Study on Effects of Social Exposures on In Situ Alcohol Consumption. Alcohol. Clin. Exp. Res. 2011, 36, 732–738. [Google Scholar] [CrossRef] [PubMed]
- Litt, D.M.; Stock, M.L.; Gibbons, F.X. Adolescent alcohol use: Social comparison orientation moderates the impact of friend and sibling behaviour. Br. J. Health Psychol. 2015, 20, 514–533. [Google Scholar] [CrossRef] [PubMed] [Green Version]
- Robinson, E.; Jones, A.; Christiansen, P.; Field, M. Perceived Peer Drinking Norms and Responsible Drinking in UK University Settings. Subst. Use Misuse 2014, 49, 1376–1384. [Google Scholar] [CrossRef] [PubMed]
- Van Damme, J.; Hublet, A.; De Clerq, B.; McAlaney, J.; Van Hal, G.; Rosiers, J.; Maes, L.; Clays, E. Context matters: Student-perceived binge drinking norms at faculty-level relate to binge drinking behaviour in higher education. Addict. Behav. 2016, 59, 89–94. [Google Scholar] [CrossRef] [PubMed] [Green Version]
- Wells, S.; Dumas, T.; Bernards, S.; Kuntsche, E.; Labhart, F.; Graham, K. Predrinking, Alcohol Use, and Breath Alcohol Concentration: A Study of Young Adult Bargoers. Psychol. Addict. Behav. 2015, 29, 683–689. [Google Scholar] [CrossRef] [PubMed] [Green Version]
- Moore, S.C.; Wood, A.M.; Moore, L.; Shepherd, J.; Murphy, S.; Brown, G.D. A rank based social norms model of how people judge their levels of drunkenness whilst intoxicated. BMC Public Health 2016, 16, 798. [Google Scholar] [CrossRef] [PubMed] [Green Version]
- Cameron, M.P.; Roskruge, M.J.; Droste, N.; Miller, P.G. Judgement of Breath Alcohol Concentration Levels Among Pedestrians in the Night-Time Economy-A Street-Intercept Field Study. Alcohol. Alcohol. 2018, 53, 245–250. [Google Scholar] [CrossRef] [PubMed] [Green Version]
- Martin, R.J.; Chaney, B.H.; Creemens-Mathews, J.; Vail-Smith, K. Perceptions of Breath Alcohol Concentration (BrAC) Levels among a Sample of Bar Patrons With BrAC Values of 0.08% or Higher. Psychol. Addict. Behav. 2016, 30, 680–685. [Google Scholar] [CrossRef] [PubMed]
- Aston, E.R.; Liguori, A. Self-estimation of blood alcohol concentration: A review. Addict. Behav. 2013, 38, 1944–1951. [Google Scholar] [CrossRef] [PubMed] [Green Version]
- Babor, T.F.; Higgins-Biddle, J.C.; Saunders, J.B.; Monteiro, M.G. Cuestionario de Identificación de los Transtornos Debidos al Consumo de Alcohol; OMS: Geneva, Switzerland, 2008. [Google Scholar]
- Limesurvey Project Team. Carsten Schmitz. LimeSurvey: An Open Source Survey Tool; LimeSurvey GmbH: Hamburg, Germany, 2012; Available online: http://www.limesurvey.org (accessed on 23 March 2020).
- Hughes, K.; Anderson, Z.; Bellis, M.A.; Morleo, M.; Jarman, I.; Lisboa, P. Blood Alcohol Levels and Drunkenness Amongst People Visiting Nightlife in the North West; Centre for Public Health Research Directorate: Liverpool John Moores University: Liverpool, UK, 2009. [Google Scholar]
- Foxcroft, D.R.; Smith, L.; Thomas, H.; Howcut, S. Accuracy of Alcohol Use Disorders Identification Test for detecting problem drinking in 18–35 year-olds in England: Method comparison study. Alcohol. Alcohol. 2015, 50, 244–250. [Google Scholar] [CrossRef] [PubMed] [Green Version]
- Müller, S.; Piontek, D.; Pabst, A.; Kraus, L. The Relationship between Alcohol Consumption and Perceived Drunkenness: A Multilevel Cross-National Comparison in Samples of Adolescents. Alcohol. Alcohol. 2011, 46, 399–406. [Google Scholar] [CrossRef] [PubMed]
- Cullum, J.; O’Grady, M.; Armeli, S.; Tennen, H. The Role of Context-Specific Norms and Group Size in Alcohol Consumption and Compliance Drinking During Natural Drinking Events. Basic Appl. Soc. Psychol. 2012, 34, 304–312. [Google Scholar] [CrossRef] [PubMed] [Green Version]
- Festinger, L. A Theory of Social Comparison Processes. Hum. Relat. 1954, 7, 117–140. [Google Scholar] [CrossRef]
- Song, E.Y.; Smiler, A.P.; Wagoner, K.G.; Wolfson, M. Everyone says it’s ok: Adolescents’ perceptions of peer, parent, and community alcohol norms, alcohol consumption, and alcohol-related consequences. Subst. Use Misuse 2012, 47, 86–98. [Google Scholar] [CrossRef] [PubMed]
- Dumas, T.M.; Wells, S.; Flynn, A.; Lange, J.E.; Graham, K. The Influence of Status on Group Drinking by Young Adults: A Survey of Natural Drinking Groups on Their Way to and From Bars. Alcohol. Clin. Exp. Res. 2013, 38, 1100–1107. [Google Scholar] [CrossRef] [PubMed]
- Osgood, D.W.; Ragan, D.T.; Wallace, L.; Gest, S.D.; Feinberg, M.E.; Moody, J. Peers and the Emergence of Alcohol Use: Influence and Selection Processes in Adolescent Friendship Networks. J. Res. Adolesc. 2013, 23, 500–512. [Google Scholar] [CrossRef] [PubMed] [Green Version]
© 2020 by the authors. Licensee MDPI, Basel, Switzerland. This article is an open access article distributed under the terms and conditions of the Creative Commons Attribution (CC BY) license (http://creativecommons.org/licenses/by/4.0/).


