Partition Coefficients and Diffusion Lengths of 222Rn in Some Polymers at Different Temperatures


Abstract
:1. Introduction
2. Materials and Methods
2.1. Transport of RNGs in Polymers
- The atoms of the RNG are caught in the polymer matrix at the border ambient media/polymer and, in any moment, the ratio of the RNG concentrations at the surface of the polymer and, in the ambient media, is given by the partition coefficient . It must be noted that the partition coefficient of some polymers could be greater than one (For example, for 222Rn at the border Makrofol N/air at room temperature, which makes it very appropriate for a radon sampler). One possible explanation of this phenomenon could be the presence of free-volume traps in the polymer matrix (see [28] and the references there). In the free-volume trap models, it is considered that there are small voids in the polymer matrix with sizes close to the dimensions of the RNG atoms. The RNG atoms are trapped in these voids, and the concentration of the RNG in the polymer appears to be higher than in the ambient media;
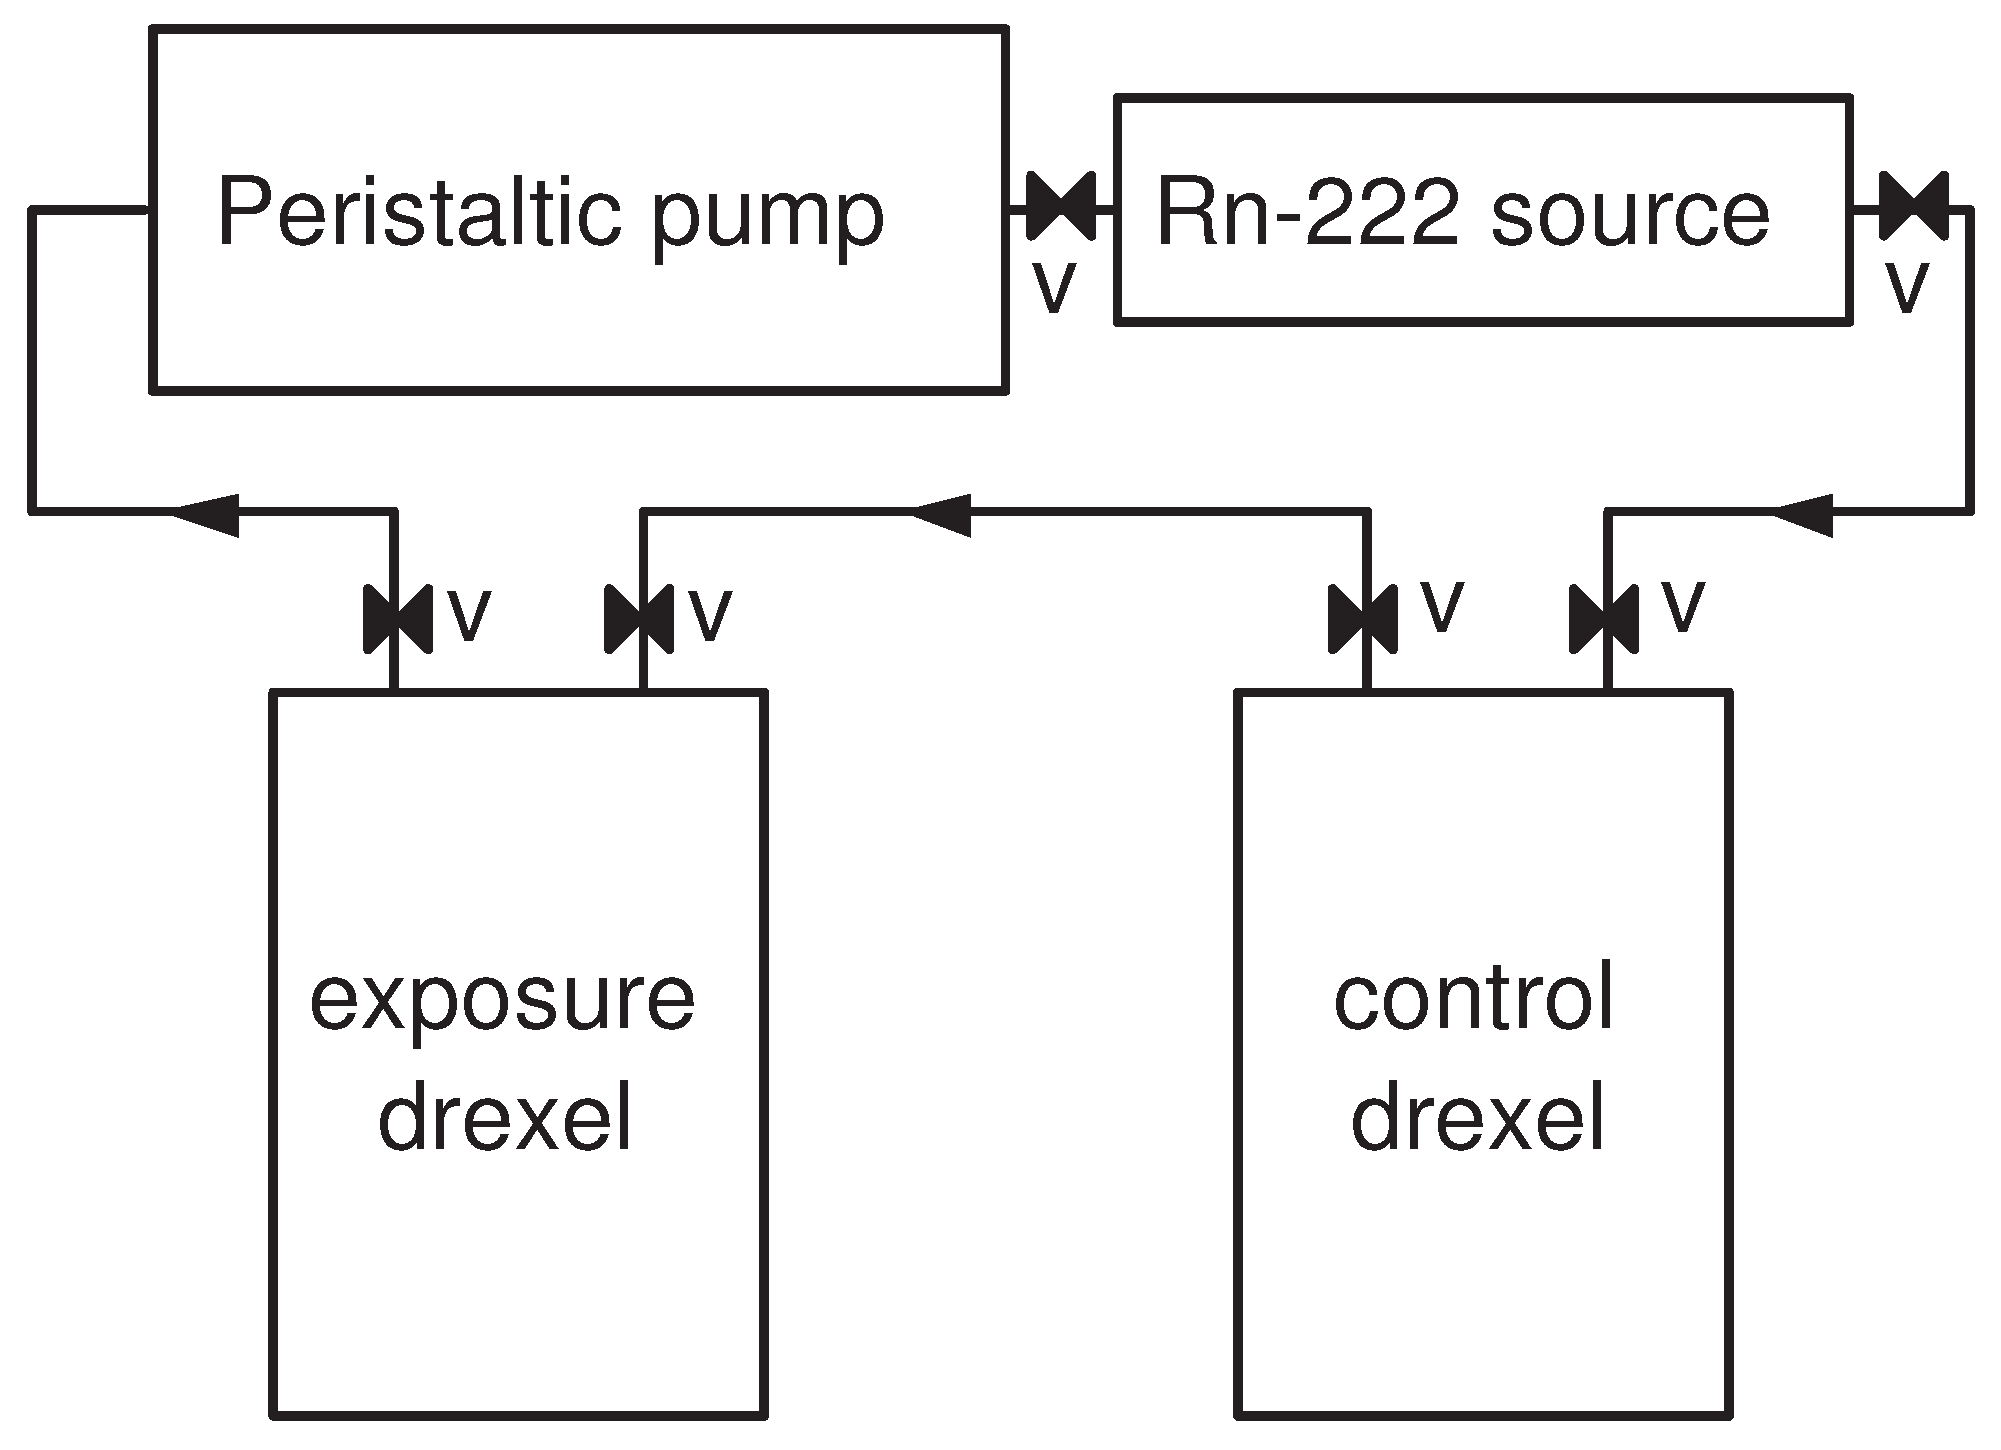
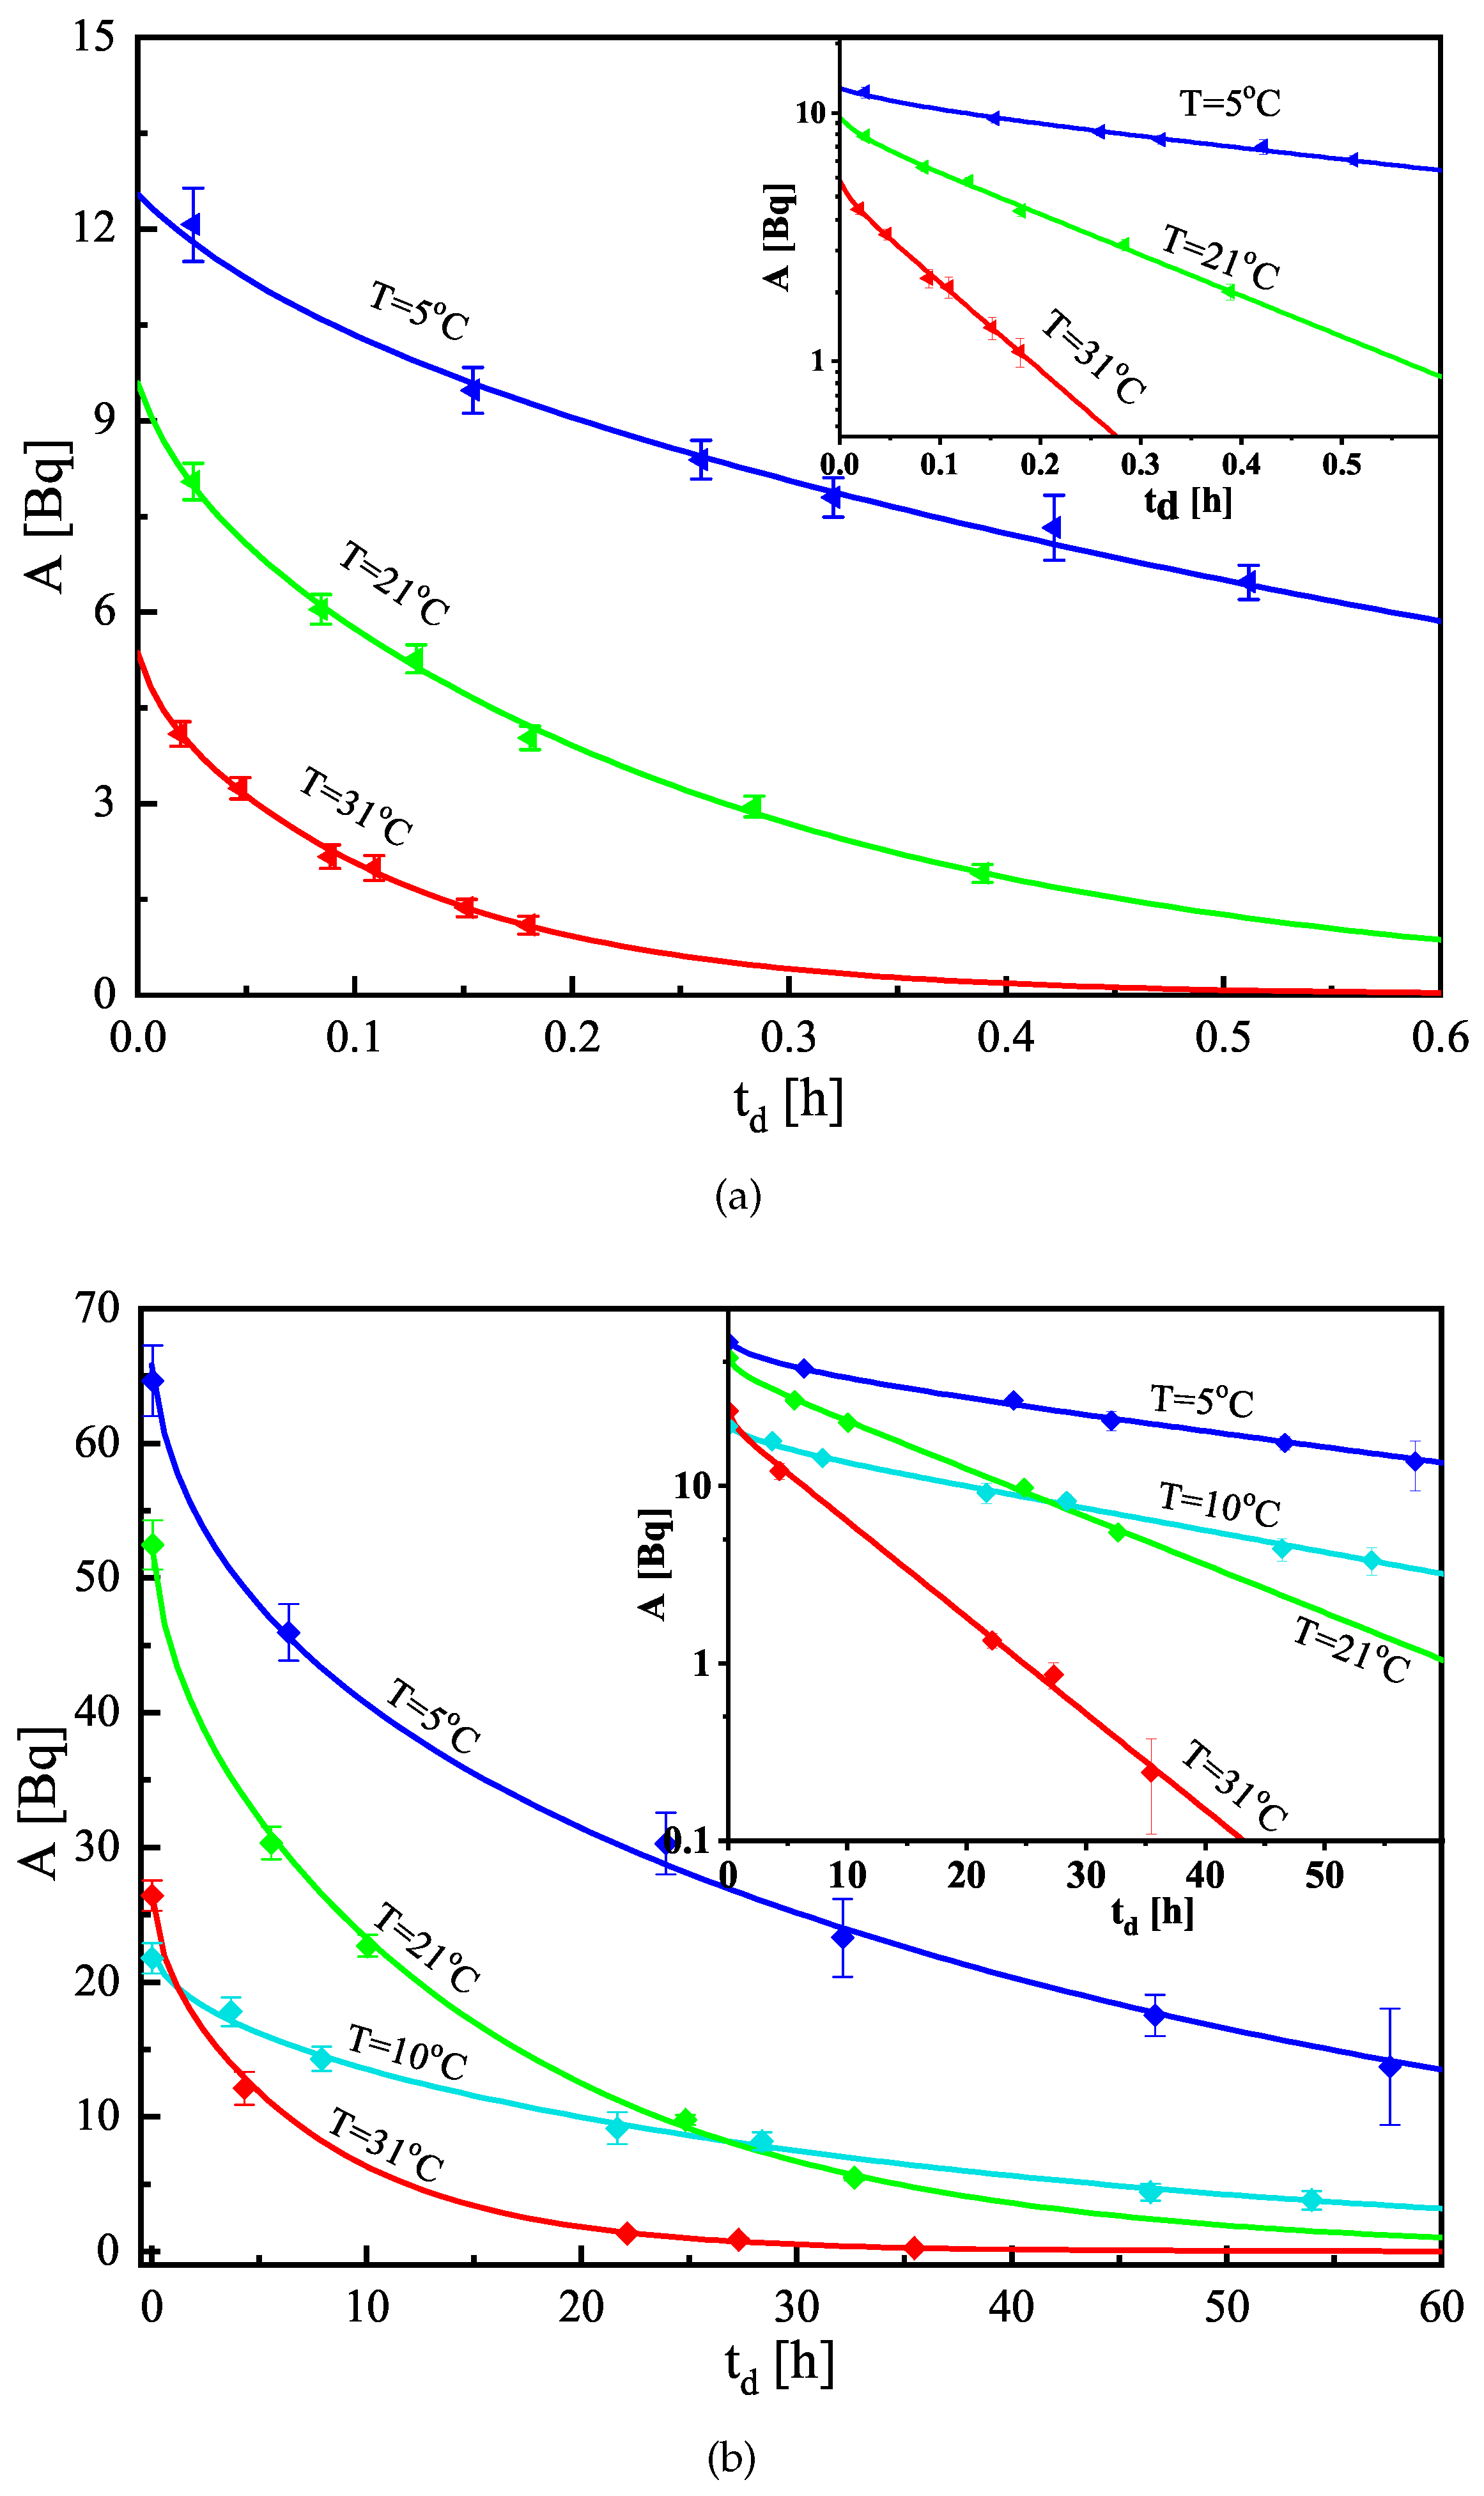
- Once the RNG atoms are caught in the polymer matrix, their transport in the polymer is described by the diffusion equation (Fick’s second law) with an additional term that accounts for the radioactive decay:where [m−3] is the RNG concentration in the polymer sample as a function of the space [m] and time t [s] coordinates (Hereafter, the units of the quantities according to the Intentional System of Units (SI) are given in square brackets “[ ]”, when the quantity is introduced for the first time in the text), D [m2/s] is the diffusion coefficient of the atoms of the noble gas in the polymer, and [s−1] is the decay constant of the RNG. In [29], Equation (1) is solved for some given shapes of the polymer samples, immersed in RNG-containing media. Once the polymer sample is exposed, it absorbs the RNG, and the dynamics of the absorption depends on the exposure conditions, polymer geometry, and on the parameters K [dimensionless] and D. In the present work, plate-shaped specimens are considered exposed to radon in air for time [s] and left to desorb in infinite radon-free media for time [s]. In the considered exposure, radon is promptly introduced in the exposure volume and then the activity concentration of radon decreases exponentially (due to radioactive decay) with the decay constant of radon. For plate-shape specimens (specimens for which one of the dimensions is orders of magnitude smaller than the others), the process is considered one-dimensional, and the solution for the RNG activity [Bq] absorbed in the specimen is [29]:withwhere L [m] and V [m3] are the thickness and the volume of the specimen, [Bq/m3] is the initial activity concentration of the RNG in the media, and [m] is the diffusion length of the RNG in the polymer. In this model, the only two parameters are the partition coefficient K and the diffusion length . The latter is by definition related to the diffusion coefficient D: . Thus, if the two parameters K and (or D) are known, the transport of the RNG in/through a polymer membrane could be quantitatively described. It must be noted that Equation (2) is derived for the more general case of transient radon distribution in the sample and is valid for arbitrary sorption and desorption times. The only restrictions to Equation (2) are the plate shape of the specimens and the exponentially decreasing ambient activity concentration (In [29], Equation (1) is also solved for constant ambient activity concentration and for cylindrical specimens).
2.2. Method for Estimation of K and
2.3. Measurement of the Absorbed Activity
- These approaches allow precise timing—when the foil is closed in the vial, the activity is “trapped” in the vial, thus it could be attributed to the exact moment of desorption within 1–2 s.
- There is a small (for the Cherenkov) or even no (for the LS) activity leakage from the vials (see further in Section 3.1). Thus, if the samples have to be measured later or for a longer time, the activity will be sufficient for a longer time and precise long measurements can be performed.
- As the activity is “trapped” in the vial, there is no need for temperature control during the measurement. In the case of gamma-spectrometry and external gross counting, the samples have to be kept at the studied temperature; otherwise, the desorption will be compromised. This is inconvenient or even unachievable in the case of a temperature that differs with more than 5–10 °C from the normal room temperature.
3. Experiments
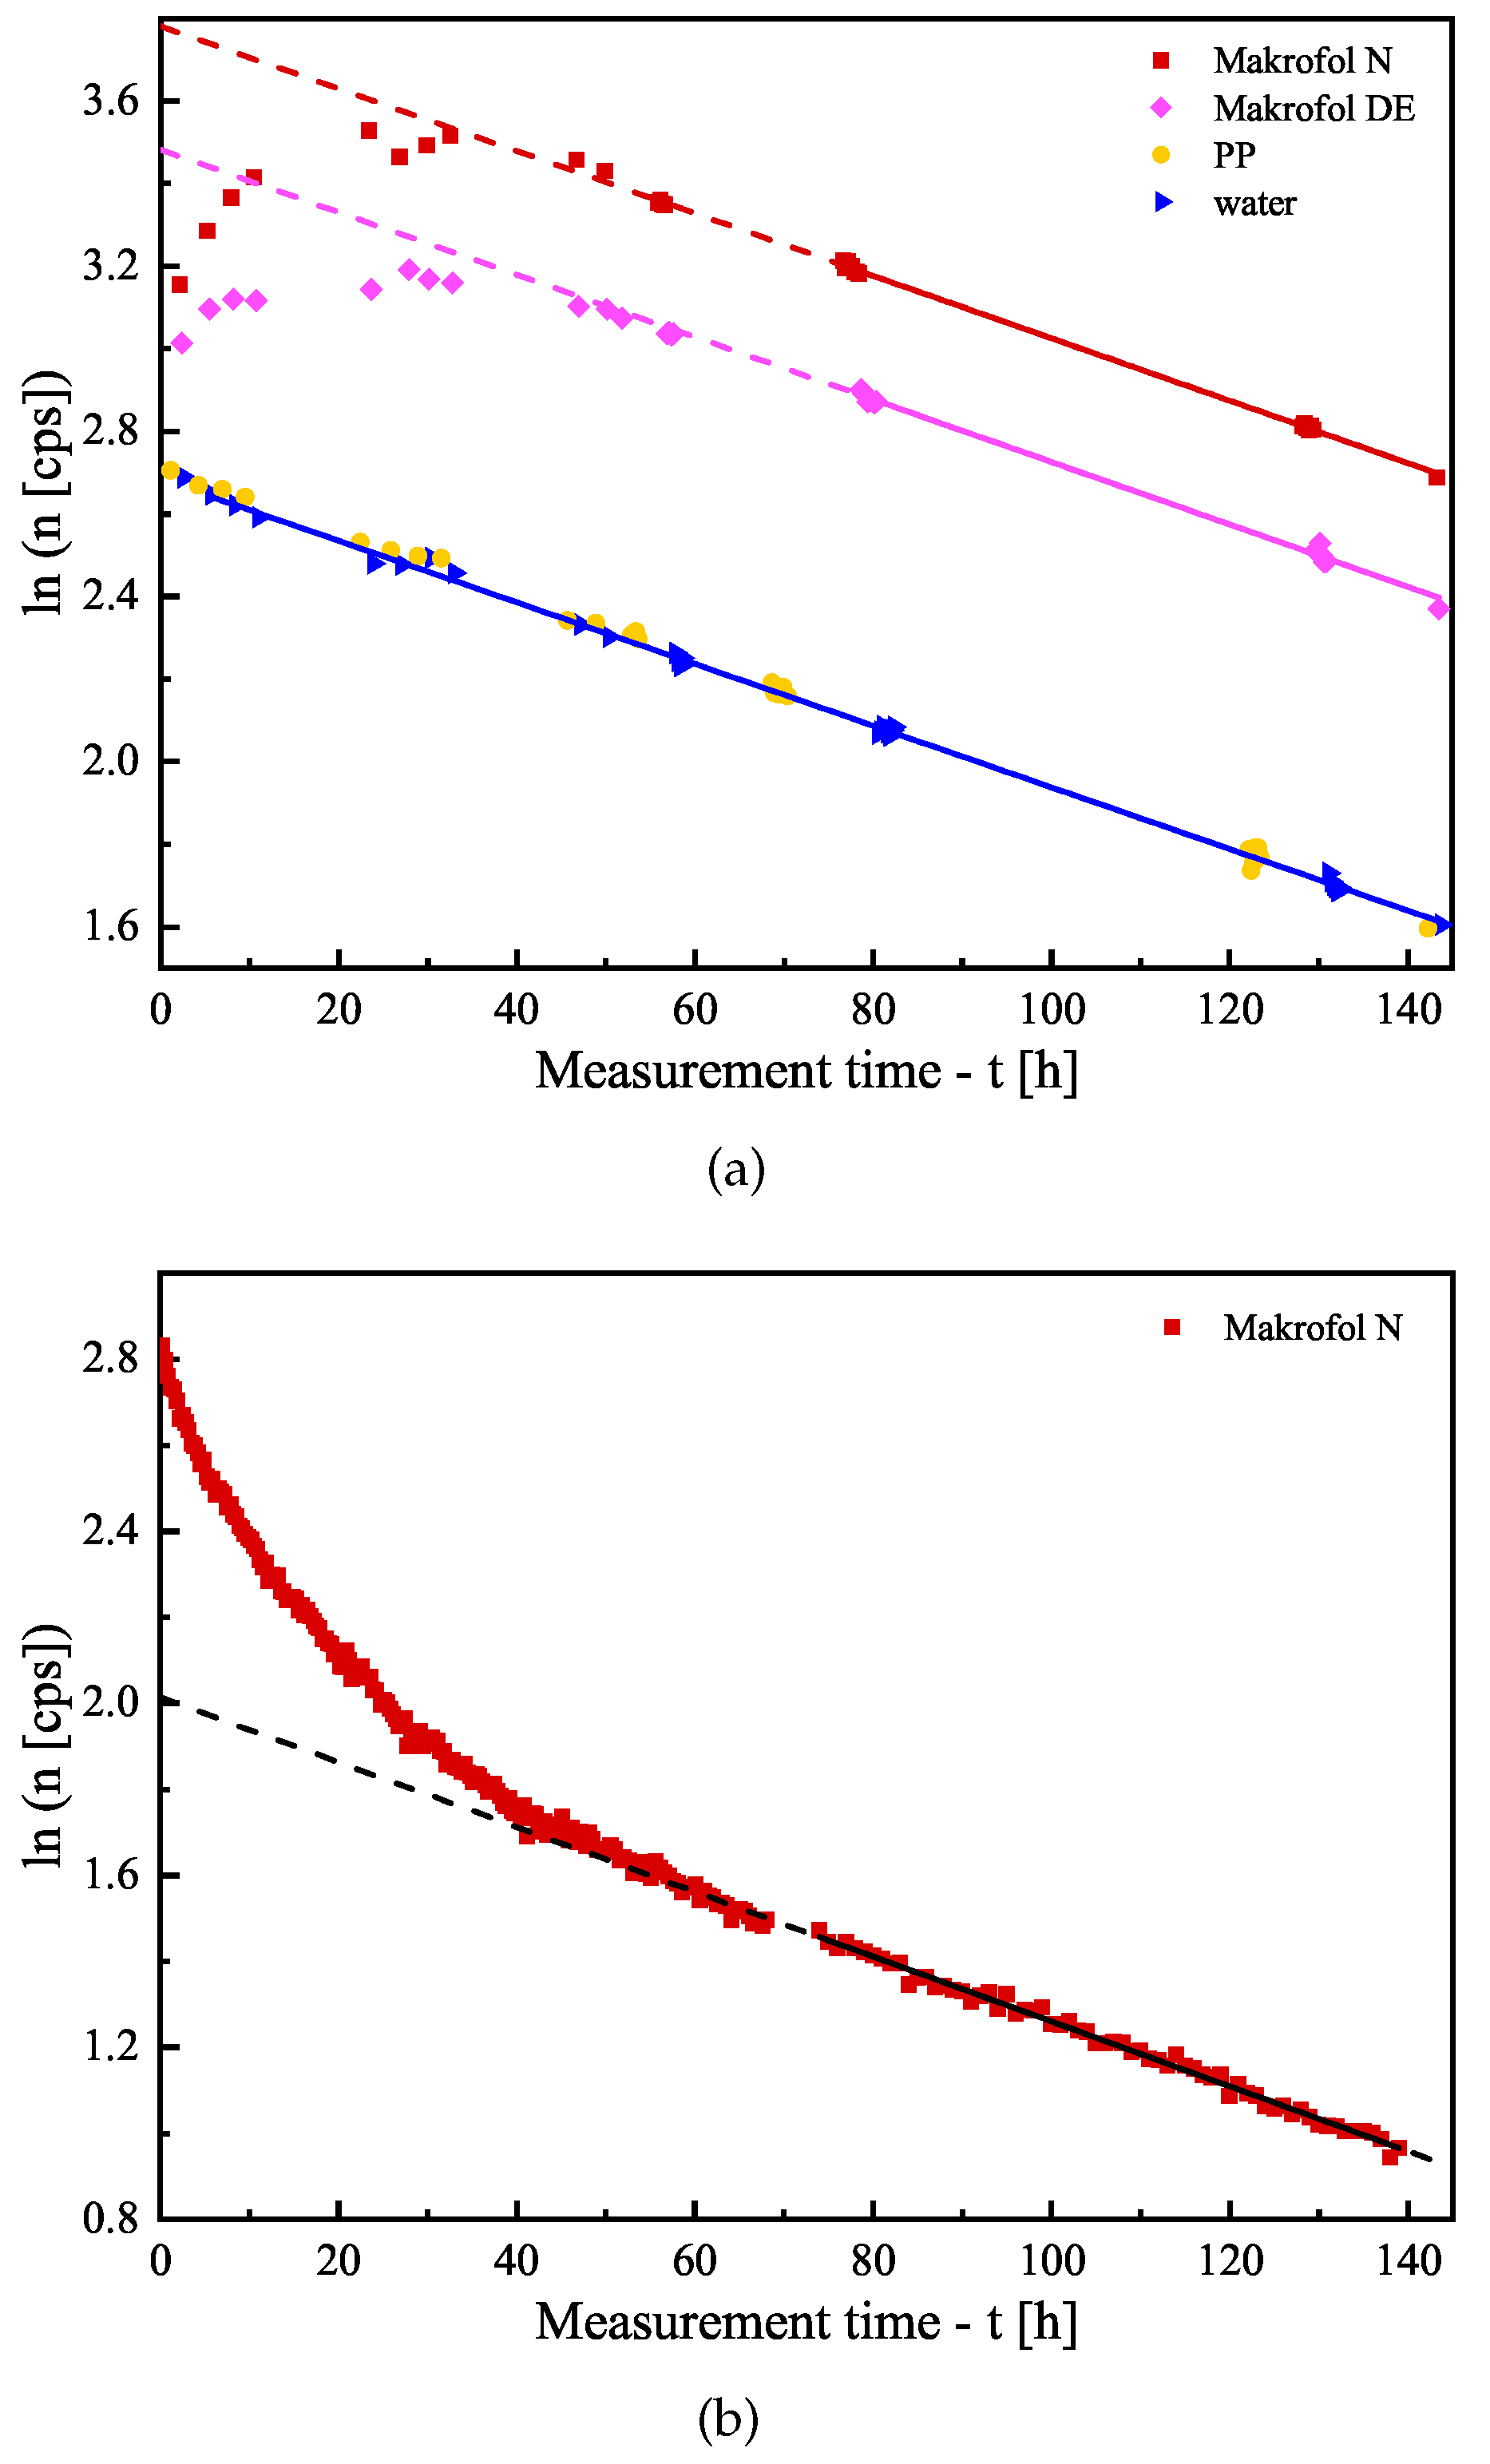
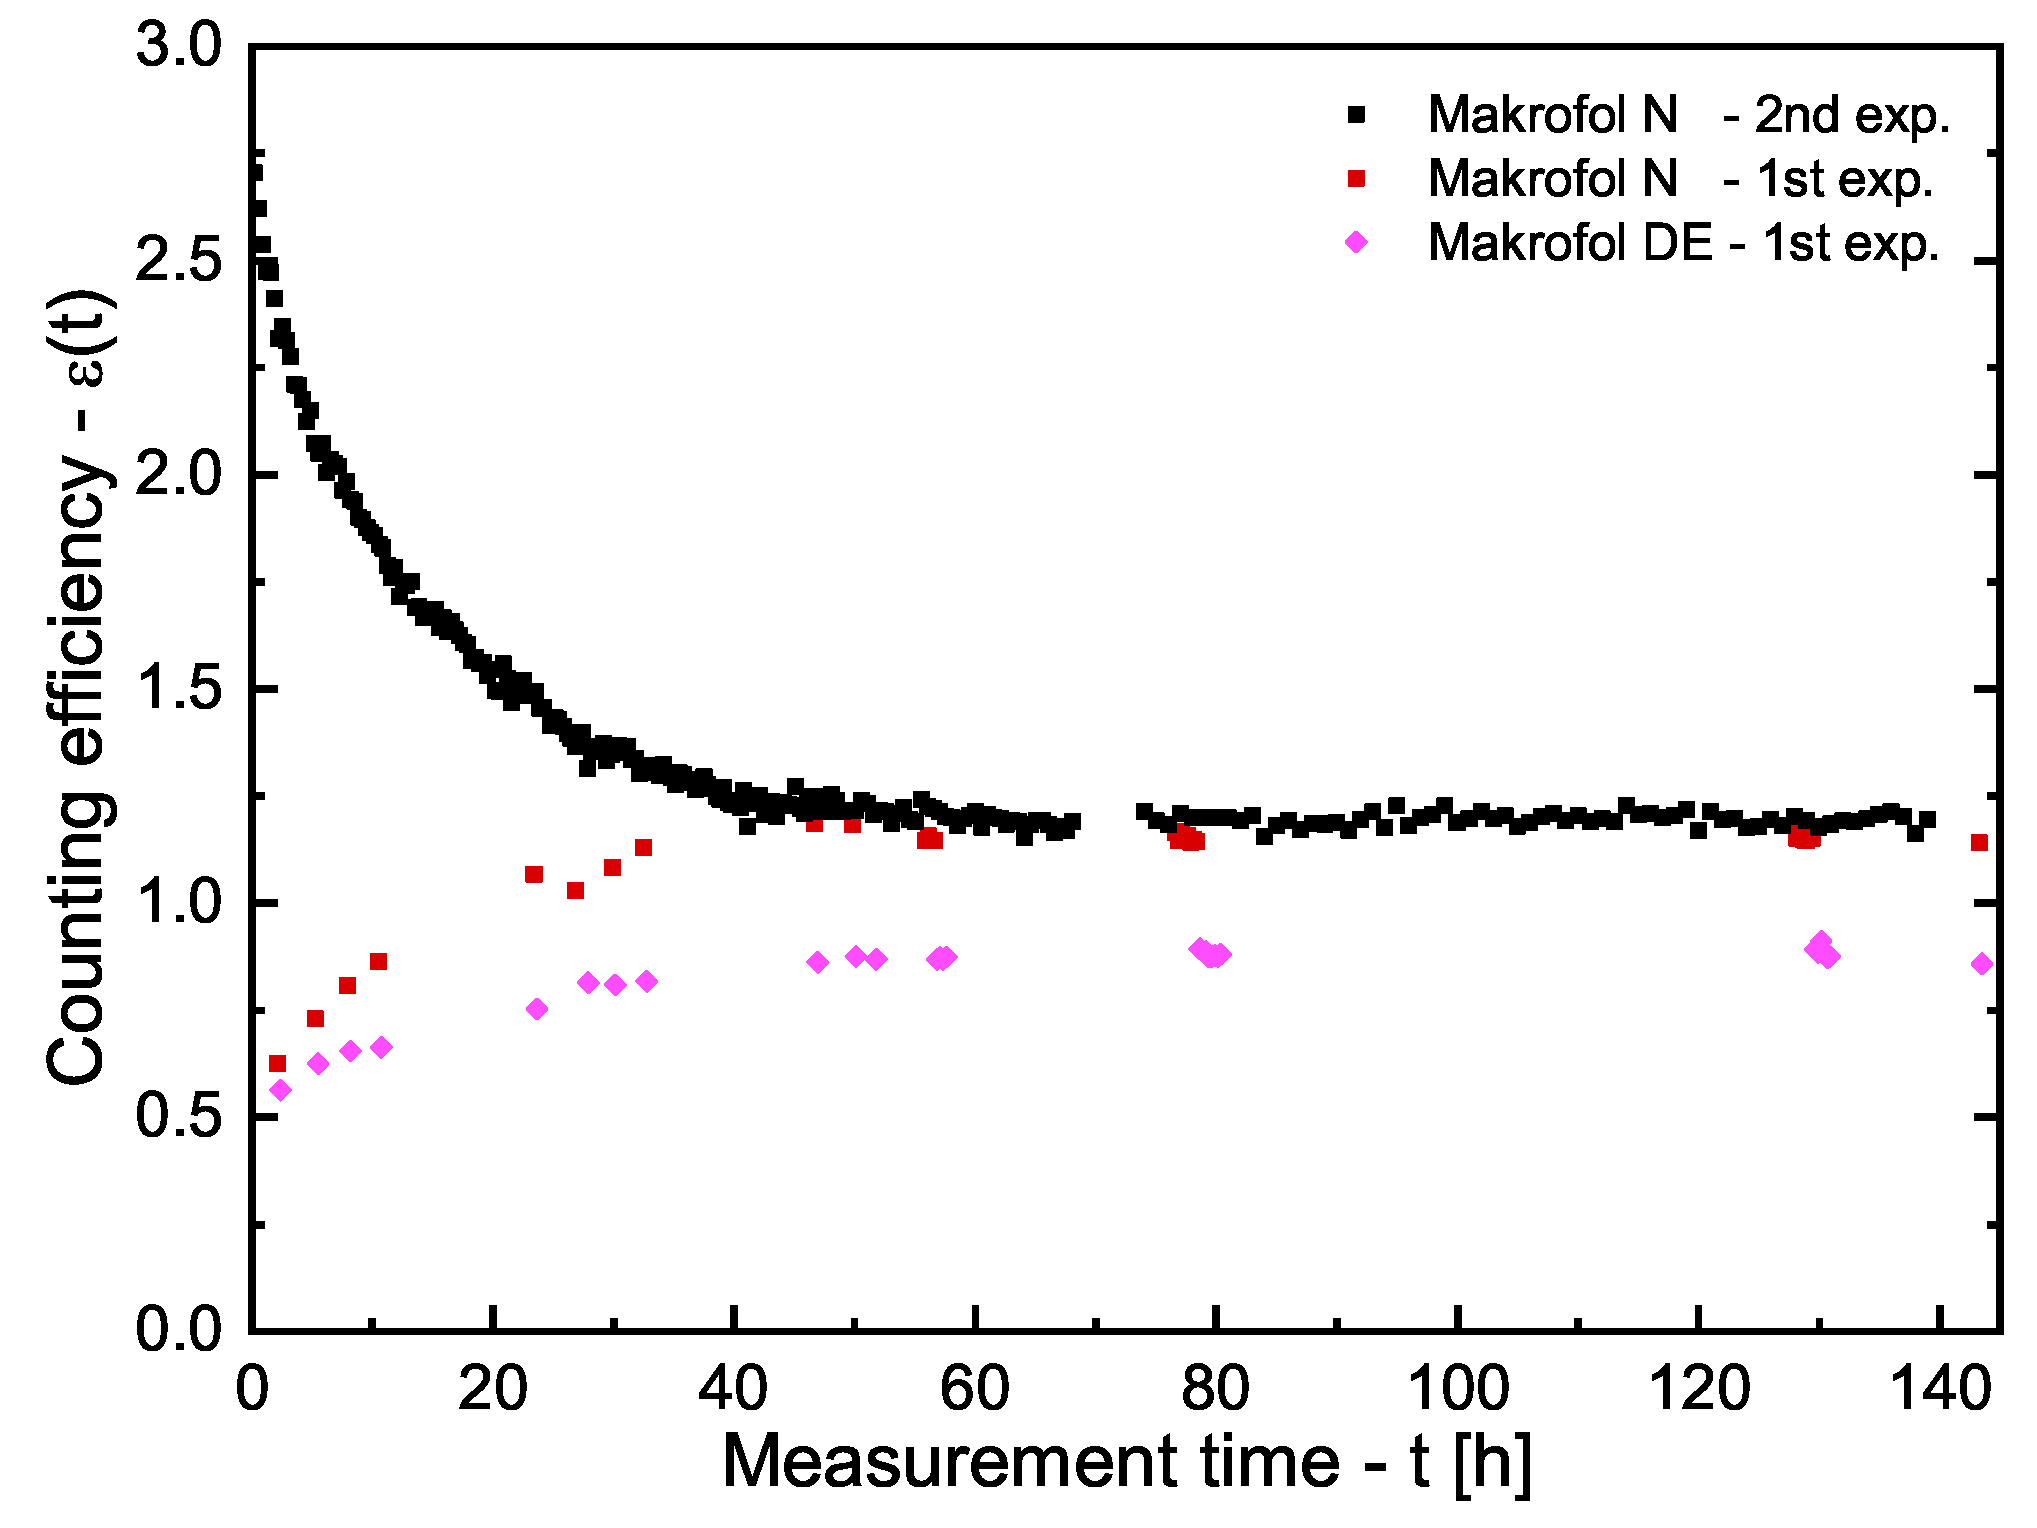
3.1. Estimation of the Counting Efficiencies
3.2. Estimation of K and
4. Results
- The uncertainties of the individual points of the desorption follow-up. We aim to achieve relative uncertainty of the net counting rate comparable to or better than that of the counting efficiency (see Table 1), i.e., a few percent;
- The change (decrease) of the absorbed activity due to the desorption. The model curve (see Equation (4)) is a sum of several exponents in which the quantities K and are parameters. In order to achieve a better estimate of the parameters, it is important to observe greater differences in the activity in the sample, i.e., to follow the desorption for a longer time. However, this leads to a decrease in the counting rate and an increase in its statistical uncertainty.
5. Conclusions
Author Contributions
Funding
Acknowledgments
Conflicts of Interest
Abbreviations
| LDPE | Low-Density Polyethylene |
| LDPE-A | Low-Density Polyethylene with Anti-slip coating |
| HDPE | High-Density Polyethylene |
| PE | Polyethylene |
| PP | Polypropylene |
| LS | Liquid Scintillation |
| HPGe | High-Purity Germanium |
| TDCR | Triple to Double Coincidence Ratio |
| RNG | Radioactive Noble Gas |
| SLP | Short-Lived Progeny |
| CD | Compact Disc |
| SI | International System of Units (from French: Système International (d’unités)); |
| “radon” | short for the 222Rn isotope |
| “thoron” | short for the 220Rn isotope |
References
- World Health Organization (WHO). WHO Handbook on Indoor Radon—A Public Health Perspective. Available online: https://www.who.int/ionizing_radiation/env/9789241547673/en/ (accessed on 13 November 2019).
- Tokonami, S.; Yang, M.; Sanada, T. Contribution from thoron on the response of passive radon detectors. Health Phys. 2001, 80, 612–615. [Google Scholar] [CrossRef]
- Chen, J.; Moir, D. A study on the thoron sensitivity of radon detectors available to Canadians. J. Radiol. Prot. 2012, 32, 419–425. [Google Scholar] [CrossRef] [PubMed]
- Meisenberg, O.; Mishra, R.; Joshi, M.; Gierl, S.; Rout, R.; Guo, L.; Agarwal, T.; Kanse, S.; Irlinger, J.; Sapra, B.K.; et al. Radon and thoron inhalation doses in dwellings with earthen architecture: Comparison of measurement methods. Sci. Total. Environ. 2017, 579, 1855–1862. [Google Scholar] [CrossRef] [PubMed]
- Csige, I.; Csegzi, S. The Radamon radon detector and an example of application. Radiat. Meas. 2001, 34, 437–440. [Google Scholar] [CrossRef]
- Nikolaev, V.; Ilić, R. Etched track radiometers in radon measurements: A review. Radiat. Meas. 1999, 30, 1–13. [Google Scholar] [CrossRef]
- Dwivedi, K.; Mishra, R.; Tripathy, S.; Kulshreshtha, A.; Sinha, D.; Srivastava, A.; Deka, P.; Bhattacharjee, B.; Ramachandran, T.; Nambi, K. Simultaneous determination of radon, thoron and their progeny in dwellings. Radiat. Meas. 2001, 33, 7–11. [Google Scholar] [CrossRef]
- Nikezic, D.; Stevanovic, N. Behavior of 220Rn progeny in diffusion chamber. Nucl. Instruments Methods Phys. Res. Sect. A Accel. Spectrometers, Detect. Assoc. Equip. 2007, 570, 182–186. [Google Scholar] [CrossRef]
- Michielsen, N.; Bondiguel, S. The influence of thoron on instruments measuring radon activity concentration. Radiat. Prot. Dosim. 2015, 167, 289–292. [Google Scholar] [CrossRef]
- Leung, S.; Nikezic, D.; Leung, J.; Yu, K. A study of the polyethylene membrane used in diffusion chambers for radon gas concentration measurements. Nucl. Instruments Methods Phys. Res. Sect. B Beam Interact. Mater. Atoms 2007, 263, 311–316. [Google Scholar] [CrossRef]
- Bochicchio, F.; Ampollini, M.; Tommasino, L.; Sorimachi, A.; Tokonami, S. Sensitivity to thoron of an SSNTD-based passive radon measuring device: Experimental evaluation and implications for radon concentration measurements and risk assessment. Radiat. Meas. 2009, 44, 1024–1027. [Google Scholar] [CrossRef]
- Jiránek, M.; Kotrbatá, M. Radon diffusion coefficients in 360 waterproof materials of different chemical composition. Radiat. Prot. Dosim. 2011, 145, 178–183. [Google Scholar] [CrossRef] [PubMed]
- Rovenská, K.; Jiránek, M. 1st international comparison measurement on assessing the diffusion coefficient of radon. Radiat. Prot. Dosim. 2011, 145, 127–132. [Google Scholar] [CrossRef] [PubMed]
- Rovenská, K.; Jiránek, M. Radon diffusion coefficient measurement in waterproofings—A review of methods and an analysis of differences in results. Appl. Radiat. Isot. 2012, 70, 802–807. [Google Scholar] [CrossRef] [PubMed]
- Rau, W. Measurement of radon diffusion in polyethylene based on alpha detection. Nucl. Instruments Methods Phys. Res. Sect. A Accel. Spectrometers, Detect. Assoc. Equip. 2012, 664, 65–70. [Google Scholar] [CrossRef]
- Laot, C.M.; Marand, E.; Schmittmann, B.; Zia, R.K.P. Effects of Cooling Rate and Physical Aging on the Gas Transport Properties in Polycarbonate. Macromolecules 2003, 36, 8673–8684. [Google Scholar] [CrossRef]
- Möre, H.; Hubbard, L. 222Rn Absorption in Plastic Holders for Alpha Track Detectors: A Source of Error. Radiat. Prot. Dosim. 1997, 74, 85–91. [Google Scholar] [CrossRef]
- Pressyanov, D.; Mitev, K.; Stefanov, V. Measurement of 85Kr and 133Xe in air by absorption in Makrofol. Nucl. Instruments Methods Phys. Res. Sect. A Accel. Spectrometers, Detect. Assoc. Equip. 2004, 527, 657–659. [Google Scholar] [CrossRef]
- Pressyanov, D.; Mitev, K.; Dimitrova, I.; Georgiev, S. Retrospective radon measurements: Techniques and perspectives. In Handbook on Radon: Properties, Measurements and Health Effects; Li, Z., Feng, C., Eds.; Nova Science Publishers Inc.: New York, NY, USA, 2012; pp. 101–130. [Google Scholar]
- Dimitrova, I.; Mitev, K.; Pressyanov, D.; Georgiev, S.; Boshkova, T. Measurement of 222Rn and 226Ra in water by absorption of radon in polycarbonates and etching alpha-tracks. Radiat. Meas. 2011, 46, 119–126. [Google Scholar] [CrossRef]
- Tommasino, L.; Tommasino, M.; Viola, P. Radon-film-badges by solid radiators to complement track detector-based radon monitors. Radiat. Meas. 2009, 44, 719–723. [Google Scholar] [CrossRef]
- Mitev, K. Measurement of 222Rn by absorption in plastic scintillators and alpha/beta pulse shape discrimination. Appl. Radiat. Isot. 2016, 110, 236–243. [Google Scholar] [CrossRef]
- Mitev, K.; Cassette, P.; Georgiev, S.; Dimitrova, I.; Sabot, B.; Boshkova, T.; Tartès, I.; Pressyanov, D. Determination of 222Rn absorption properties of polycarbonate foils by liquid scintillation counting. Application to 222Rn measurements. Appl. Radiat. Isot. 2016, 109, 270–275. [Google Scholar] [CrossRef] [PubMed]
- Mitev, K.; Dutsov, C.; Georgiev, S.; Tsankov, L.; Boshkova, T. Study of 222Rn Absorption and Detection Properties of EJ-212 and BC-400 Plastic Scintillators. IEEE Trans. Nucl. Sci. 2017, 64, 1592–1598. [Google Scholar] [CrossRef]
- Pelay, E.; Tarancón, A.; Mitev, K.; Dutsov, C.; Georgiev, S.; Tsankov, L.; García, J.F. Synthesis and characterisation of scintillating microspheres made of polystyrene/polycarbonate for 222Rn measurements. J. Radioanal. Nucl. Chem. 2017, 314, 637–649. [Google Scholar] [CrossRef]
- Pressyanov, D. Modeling a 222Rn measurement technique based on absorption in polycarbonates and track-etched counting. Health Phys. 2009, 97, 604–612. [Google Scholar] [CrossRef] [PubMed]
- Dimitrova, I.; Georgiev, S.; Mitev, K.; Pressyanov, D. Influence of the water temperature on measurements of Rn-222 in water by liquid scintillation counting of polycarbonates. In Proceedings of the 2012 IEEE Nuclear Science Symposium and Medical Imaging Conference Record (NSS/MIC), Anaheim, CA, USA, 29 October–3 November 2012; pp. 1941–1944. [Google Scholar] [CrossRef]
- Mitev, K.; Cassette, P.; Tartès, I.; Georgiev, S.; Dimitrova, I.; Pressyanov, D. Diffusion lengths and partition coefficients of 131mXe and 85Kr in Makrofol N and Makrofol DE polycarbonates. Appl. Radiat. Isot. 2018, 134, 269–274. [Google Scholar] [CrossRef] [PubMed]
- Pressyanov, D.; Mitev, K.; Georgiev, S.; Dimitrova, I. Sorption and desorption of radioactive noble gases in polycarbonates. Nucl. Instruments Methods Phys. Res. Sect. A Accel. Spectrometers, Detect. Assoc. Equip. 2009, 598, 620–627. [Google Scholar] [CrossRef]
- Pressyanov, D.; Georgiev, S.; Dimitrova, I.; Mitev, K.; Boshkova, T. Determination of the diffusion coefficient and solubility of radon in plastics. Radiat. Prot. Dosim. 2011, 145, 123–126. [Google Scholar] [CrossRef] [PubMed]
- Cassette, P.; Sahagia, M.; Grigorescu, L.; Lépy, M.; Picolo, J. Standardization of 222Rn by LSC and comparison with α- and γ-spectrometry. Appl. Radiat. Isot. 2006, 64, 1465–1470. [Google Scholar] [CrossRef] [PubMed]
- Mitev, K. On the possibility to detect some radioactive noble gases by Cherenkov counting of polycarbonates. In Proceedings of the 2013 IEEE Nuclear Science Symposium and Medical Imaging Conference (2013 NSS/MIC), Seoul, Korea, 27 October–2 November 2013. [Google Scholar] [CrossRef]
- Joint Committee for Guides in Metrology (JCGM). JCGM 100:2008: Evaluation of Measurement Data—Guide to the Expression of Uncertainty in Measurement. Available online: https://www.bipm.org/en/publications/guides/gum.html (accessed on 13 November 2019).
- Mitev, K.; Cassette, P.; Jordanov, V.; Liu, H.R.; Dutsov, C. Design and performance of a miniature TDCR counting system. J. Radioanal. Nucl. Chem. 2017, 314, 583–589. [Google Scholar] [CrossRef]
- Laboratoire National Henri Becquerel (LNHB). LNHB Recommended Data. Available online: http://www.nucleide.org/DDEP_WG/DDEPdata.htm (accessed on 13 November 2019).
- Nakamura, H.; Shirakawa, Y.; Kitamura, H.; Sato, N.; Takahashi, S. Undoped Polycarbonate for Detection of Environmental Radiation. Jpn. J. Health Phys. 2014, 49, 98–101. [Google Scholar] [CrossRef]
- Pressyanov, D.; Mitev, K.; Georgiev, S.; Dimitrova, I.; Kolev, J. Laboratory facility to create reference radon + thoron atmosphere under dynamic exposure conditions. J. Environ. Radioact. 2017, 166, 181–187. [Google Scholar] [CrossRef] [PubMed]
- Press, W.; Teukolsky, S.; Vetterling, W.; Flannery, B. Numerical Recipes—The Art of Scientific Computing; Cambridge University Press: New York, NY, USA, 2007. [Google Scholar]


| No | Sample | Counting Efficiency |
|---|---|---|
| 1 | PP in water | 0.380(12) |
| 2 | LDPE in water | 0.371(12) |
| 3 | LDPE-A in water | 0.400(14) |
| 4 | HDPE in water | 0.407(13) |
| 5 | Makrofol N in water | 1.168(36) |
| 6 | Makrofol DE in water | 0.883(29) |
| 7 | distilled water | 0.376(12) |
| 8 | Makrofol N in LSC | 4.946(29) |
| [MBq/m3] | [h] | T [∘C] | L [µm] | |||||
|---|---|---|---|---|---|---|---|---|
| PP | LDPE | LDPE-A | HDPE | Makrofol N | Makrofol DE | |||
| 52.4(36) | 46.23 | 21(1) | 31.4(11) | 74.0(28) | 97.0(37) | 123.8(18) | 42.1(11) | 50.6(12) |
| 49.5 (31) | 52.03 | 5(1) | 31.1(10) | 74.1(24) | 92.0(24) | 123.8(30) | 41.9(11) | 50.0(10) |
| 31.4 (20) | 48.17 | 31(1) | 29.7(11) | 76.7(39) | 89.6(11) | 120.3(12) | 42.0(11) | 50.2(11) |
| 1.442(75) | 69.43 | 10(1) | N/A | N/A | N/A | N/A | 41.6(11) | 50.7(11) |
| PP | LDPE | LDPE-A | HDPE | Makrofol N | Makrofol DE | CD/Makrofol a | |
|---|---|---|---|---|---|---|---|
| T [°C] | Partition Coefficient K | ||||||
| 5 | 6.13(55) | 4.18(39) | 4.05(42) | 3.63(33) | 211(16) | 77.5(67) | 21.5(43) |
| 10 | – | – | – | – | 183(12) | 72.8(58) | 24.3(36) |
| 21 | 3.69(38) | 3.66(38) | 3.13(41) | 2.51(22) | 103.3(79) | 34.6(30) | 26.2(19) |
| 31 | 3.25(43) | 3.70(43) | 2.96(30) | 2.44(21) | 70.2(51) | 27.8(24) | 22.9(10) |
| 20 | 2.17(14) b 2.40(22) b | 2.21(13) b | 112(12) c | 27.6(16) b | |||
| T [°C] | Diffusion Length [µm] | ||||||
| 5 | 67.6(51) | 605(30) | 646(36) | 460(19) | 18.0(10) | 20.8(10) | 42.2(16) |
| 10 | – | – | – | – | 23.9(10) | 26.8(10) | 42.8(11) |
| 21 | 198(10) | 1210(64) | 1204(85) | 880(22) | 36.2(10) | 43.3(13) | 53.8(5) |
| 31 | 300(15) | 1880(140) | 1722(54) | 1252(23) | 52.1(15) | 62.9(16) | 75.5(8) |
| 20 | 1463(33) b 1437(94) b | 721(9) b | 38.9(13) c | 50.8(10) b | |||
| T [°C] | Diffusion Coefficient D [10−14 m2/s] | ||||||
| 5 | 0.96(14) | 76.9(77) | 87.4(97) | 44.3(37) | 0.0677(79) | 0.0911(84) | |
| 10 | – | – | – | – | 0.120(10) | 0.151(11) | |
| 21 | 8.20(85) | 307(33) | 304(43) | 162(8) | 0.275(15) | 0.394(25) | |
| 31 | 18.9(19) | 739(111) | 623(39) | 329(12) | 0.570(32) | 0.831(43) | |
| T [°C] | Permeability P [10−13 m2/s] | ||||||
| 5 | 0.59(10) | 32.1(44) | 35.4(54) | 16.1(20) | 1.43(20) | 0.706(89) | |
| 10 | – | – | – | – | 2.20(24) | 1.10(12) | |
| 21 | 3.03(44) | 113(17) | 95.1(18) | 40.7(41) | 2.84(27) | 1.36(15) | |
| 31 | 6.1(10) | 273(52) | 184(22) | 80.4(75) | 4.00(37) | 2.31(23) | |
- PP – Polypropylene, LDPE – Low-Density Polyethylene, LDPE-A – Low-Density Polyethylene with Anti-slip coating, HDPE – High-Density Polyethylene.
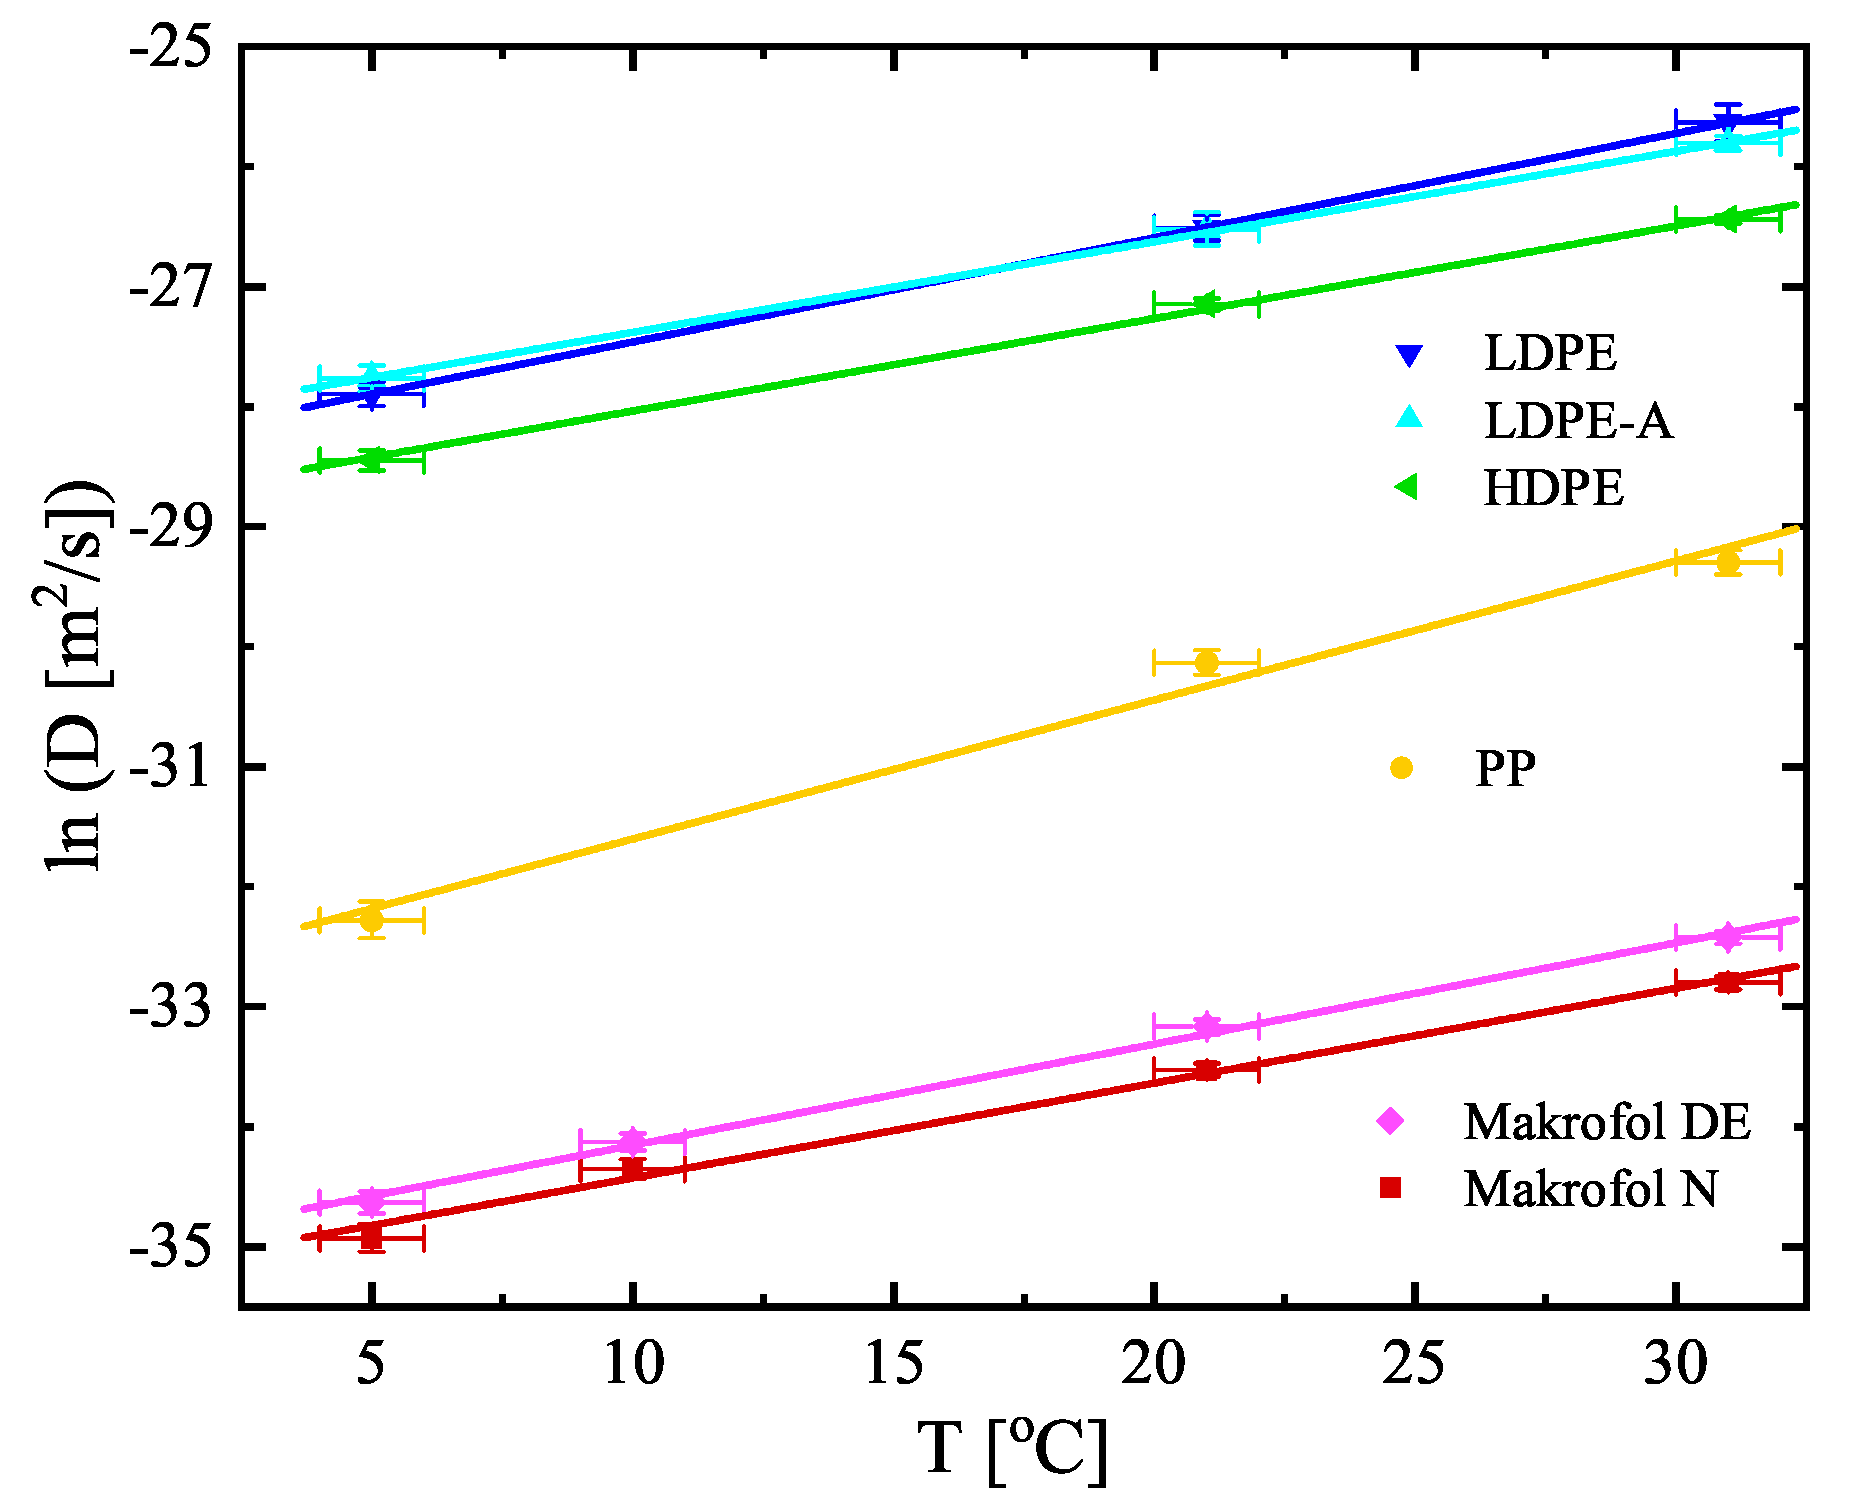
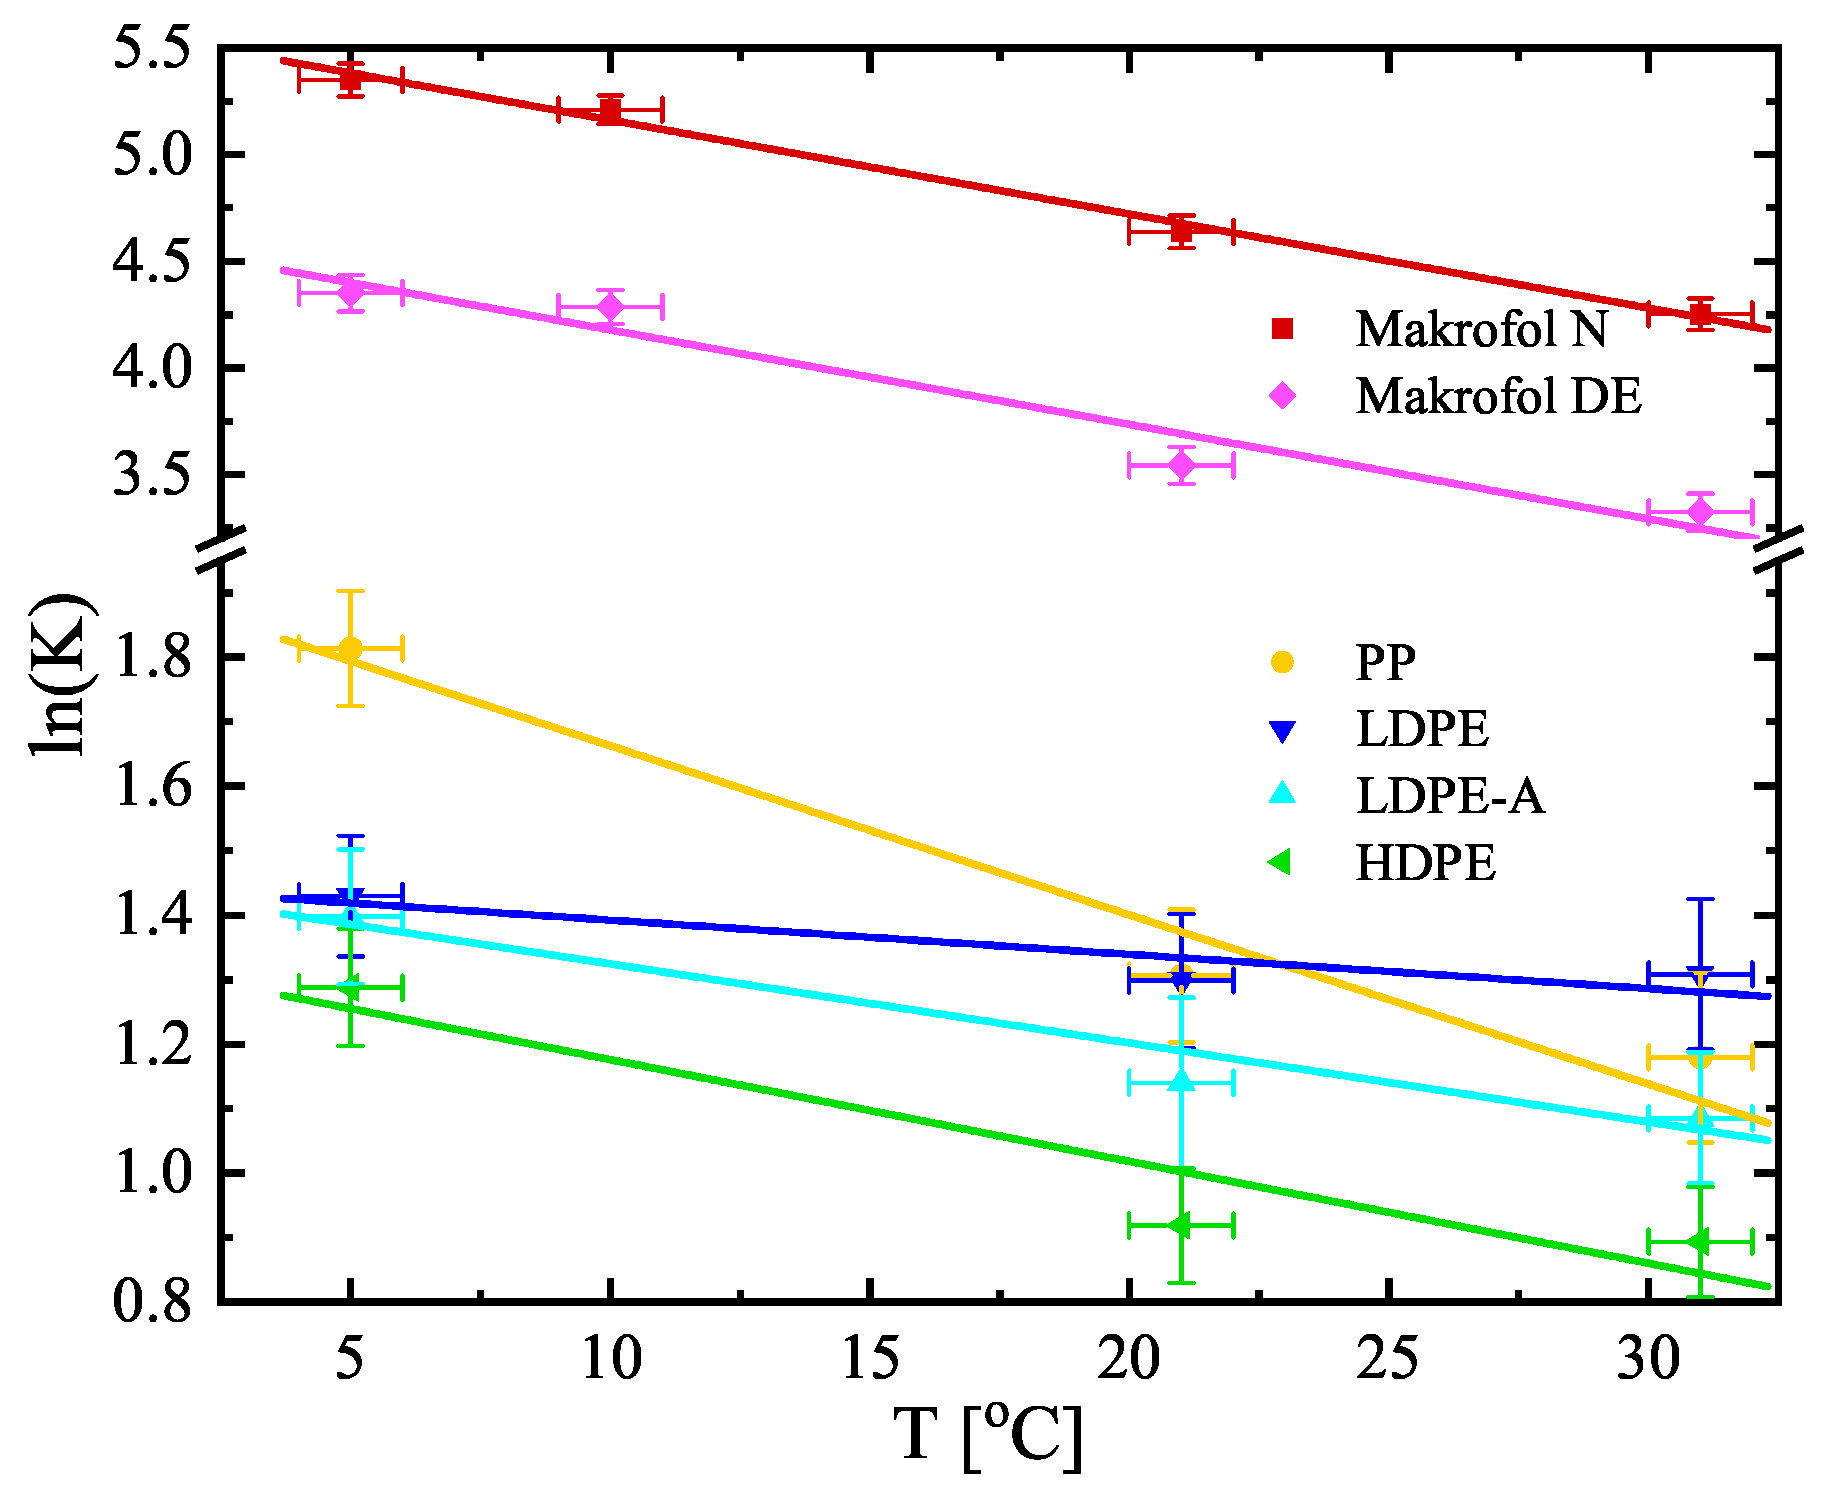
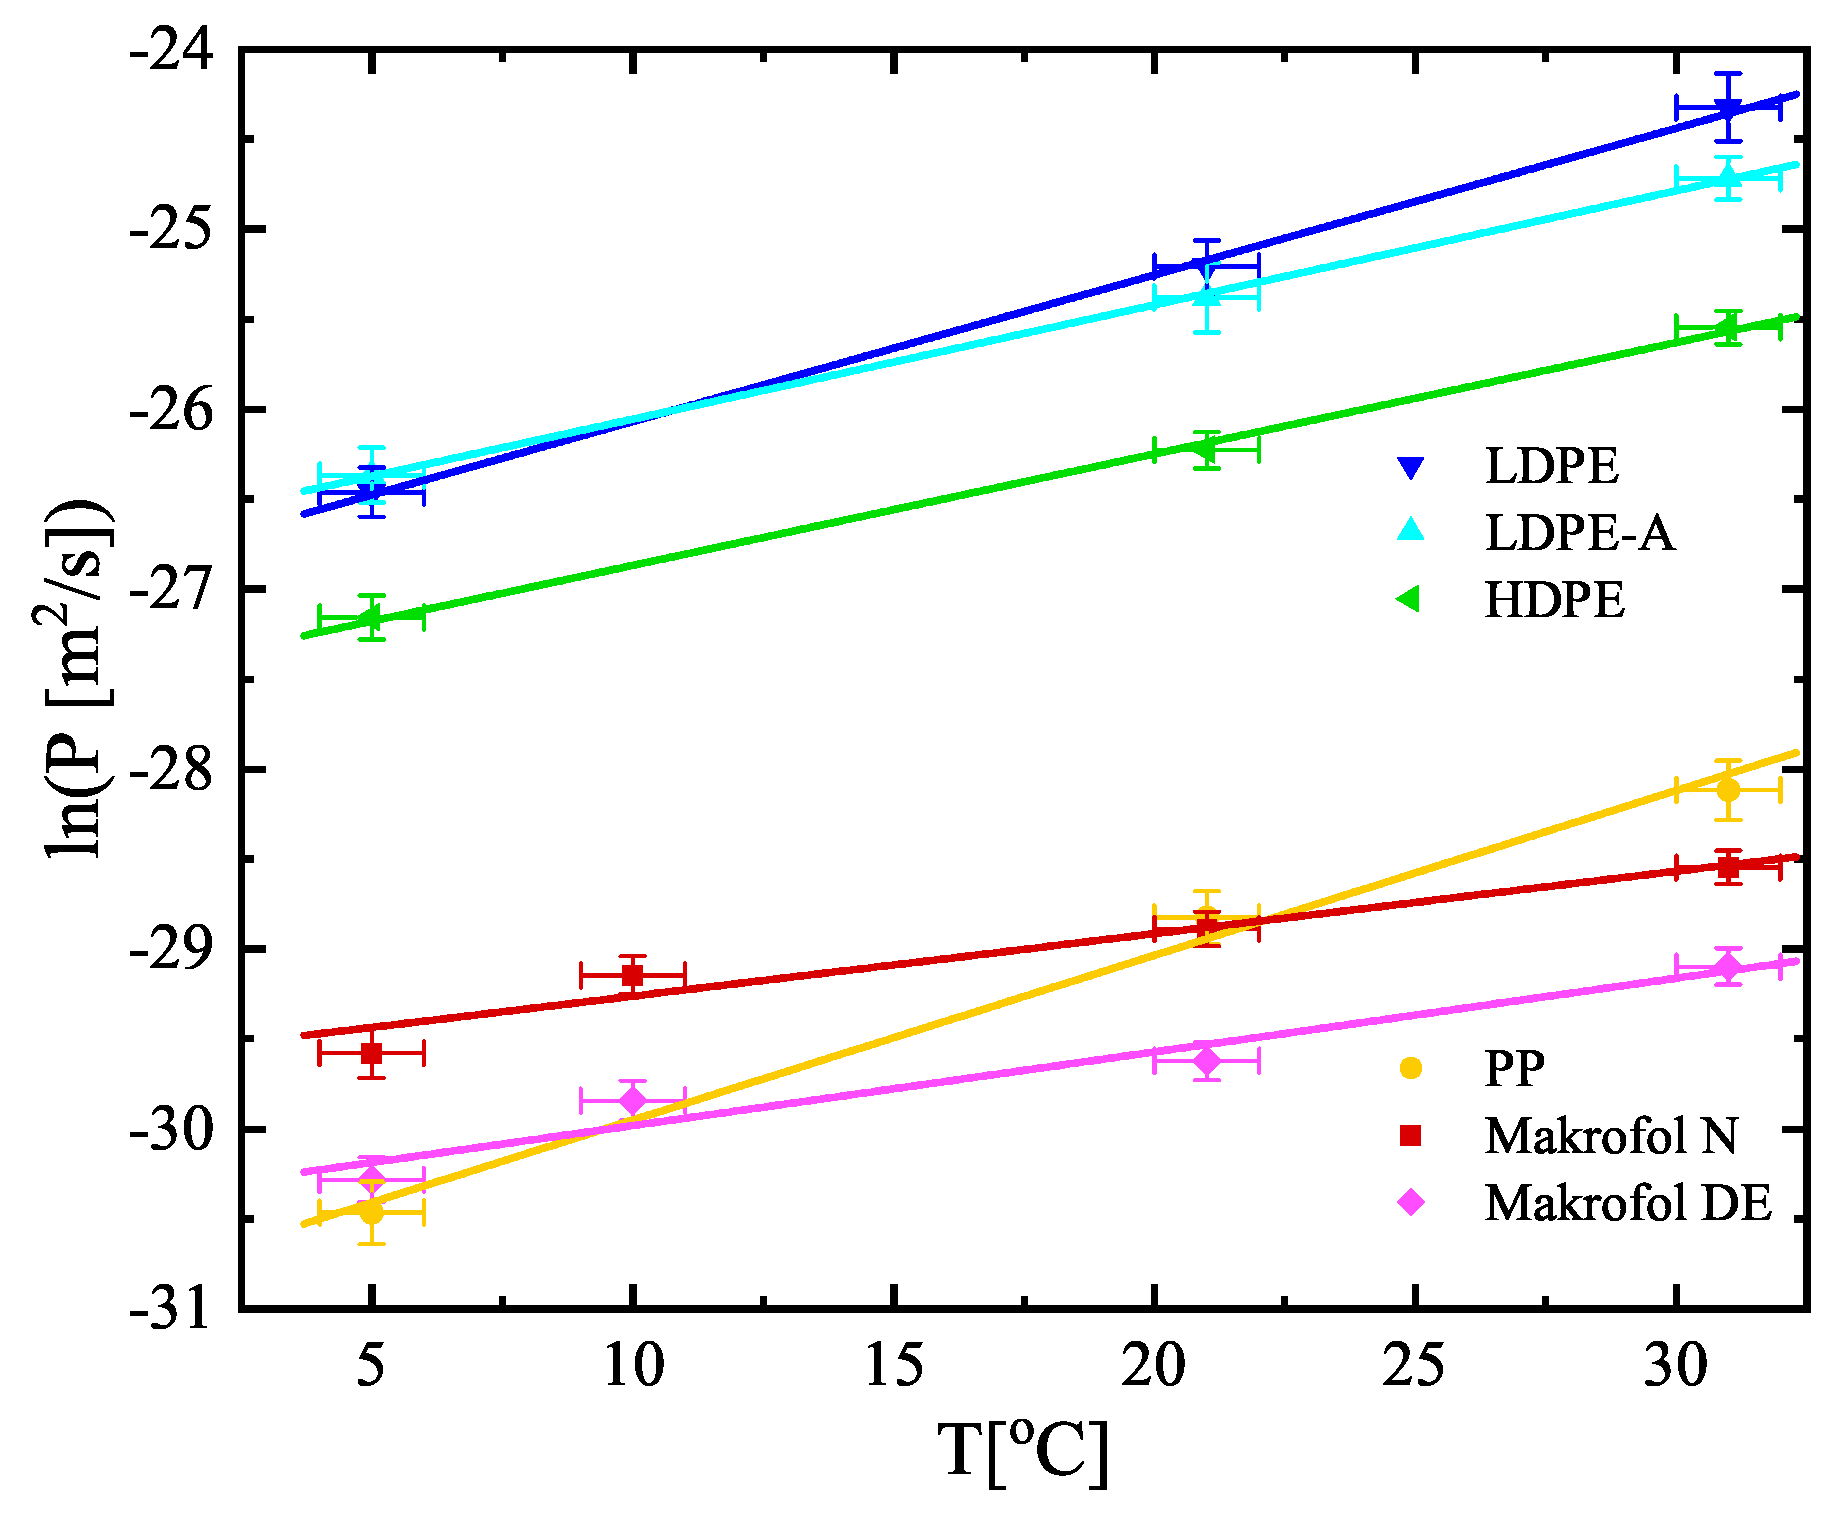
Figure 5 | Figure 6 | Figure 7 | ||||
|---|---|---|---|---|---|---|
| Polymer | ||||||
| PP | −32.76(35) | 0.1159(51) | 1.93(11) | −0.0262(59) | −30.87(23) | 0.092(10) |
| LDPE | −28.33(16) | 0.0869(80) | 1.45(11) | −0.0053(56) | −26.88(19) | 0.0815(96) |
| LDPE−A | −28.13(16) | 0.0755(64) | 1.45(12) | −0.0123(56) | −26.69(19) | 0.0635(82) |
| HDPE | −28.81(13) | 0.0771(55) | 1.33(12) | −0.0158(56) | −27.49(16) | 0.0619(68) |
| Makrofol N | −35.22(12) | 0.0791(57) | 5.603(82) | −0.0441(43) | −29.61(13) | 0.0347(59) |
| Makrofol DE | −35.00(11) | 0.0844(54) | 4.62(14) | −0.0443(73) | −30.39(14) | 0.0410(69) |
© 2019 by the authors. Licensee MDPI, Basel, Switzerland. This article is an open access article distributed under the terms and conditions of the Creative Commons Attribution (CC BY) license (http://creativecommons.org/licenses/by/4.0/).
Share and Cite
Georgiev, S.; Mitev, K.; Dutsov, C.; Boshkova, T.; Dimitrova, I. Partition Coefficients and Diffusion Lengths of 222Rn in Some Polymers at Different Temperatures. Int. J. Environ. Res. Public Health 2019, 16, 4523. https://doi.org/10.3390/ijerph16224523
Georgiev S, Mitev K, Dutsov C, Boshkova T, Dimitrova I. Partition Coefficients and Diffusion Lengths of 222Rn in Some Polymers at Different Temperatures. International Journal of Environmental Research and Public Health. 2019; 16(22):4523. https://doi.org/10.3390/ijerph16224523
Chicago/Turabian StyleGeorgiev, Strahil, Krasimir Mitev, Chavdar Dutsov, Tatiana Boshkova, and Ivelina Dimitrova. 2019. "Partition Coefficients and Diffusion Lengths of 222Rn in Some Polymers at Different Temperatures" International Journal of Environmental Research and Public Health 16, no. 22: 4523. https://doi.org/10.3390/ijerph16224523