Regional Assessment of Groundwater Recharge in the Lower Mekong Basin


1
International Water Management Institute, Southeast Asia Regional Office, PO BOX 4199, Vientiane, Laos
2
College of Science and Engineering, Flinders University, GPO Box 2100, Adelaide, SA 5001, Australia
3
School of Civil and Environmental Engineering, Faculty of Engineering and Information Technology, University of Technology Sydney, PO Box 123, Broadway, NSW 2007, Australia
*
Author to whom correspondence should be addressed.
Hydrology 2017, 4(4), 60; https://doi.org/10.3390/hydrology4040060
Submission received: 30 October 2017
/
Revised: 8 December 2017
/
Accepted: 8 December 2017
/
Published: 11 December 2017
Abstract
:Groundwater recharge remains almost totally unknown across the Mekong River Basin, hindering the evaluation of groundwater potential for irrigation. A regional regression model was developed to map groundwater recharge across the Lower Mekong Basin where agricultural water demand is increasing, especially during the dry season. The model was calibrated with baseflow computed with the local-minimum flow separation method applied to streamflow recorded in 65 unregulated sub-catchments since 1951. Our results, in agreement with previous local studies, indicate that spatial variations in groundwater recharge are predominantly controlled by the climate (rainfall and evapotranspiration) while aquifer characteristics seem to play a secondary role at this regional scale. While this analysis suggests large scope for expanding agricultural groundwater use, the map derived from this study provides a simple way to assess the limits of groundwater-fed irrigation development. Further data measurements to capture local variations in hydrogeology will be required to refine the evaluation of recharge rates to support practical implementations.
1. Introduction
Groundwater is a primary resource for agricultural, domestic and industrial uses globally [1]. However, it remains largely underutilized in the Mekong Basin [2] and particularly in parts of Laos and Cambodia where the primary source for irrigation is surface water [3,4]. Groundwater resources are better protected from pollution than surface water, and allow for more reliable abstraction over time due to smoother inter-annual and inter-seasonal variations than the surface water strongly influenced by the monsoonal climate [5]. However, over abstraction of groundwater resources can lead to rapid depletion of aquifers, with deleterious effects on ecosystems and human communities [6]. Total utilizable groundwater volume in an aquifer is controlled largely by the seasonal variations in groundwater recharge, the drainage from and into rivers, and pumping. A sustainable level of resource utilization implies that outflow (drainage to the rivers and pumping) does not exceed inflow (recharge) over a multi-year period [7]. One of the first steps required to assess the sustainability of an aquifer for potential water uses involves the assessment of the groundwater recharge rate. At broad scale, groundwater recharge occurs either in diffuse form (from rainfall infiltration via the unsaturated soil zone), or more locally via water seepage through riverbeds and other water bodies such as lakes and reservoirs. Very few studies have attempted to quantify groundwater recharge in the Mekong Basin [3,8,9,10].
Several methods can be used to quantify groundwater recharge using different types of data (geological, hydrological and geochemical indicators) [11] and models [12]. For broad-scale assessments, river flow records are convenient because they integrate information over areas as large as the catchments of the gauged rivers, and they are a good alternative to other approaches whose data requirement is not compatible with the overall data scarcity characterizing the Mekong Basin. Flow separation methods are applied in catchments where baseflow is assumed to be equivalent to groundwater recharge over multi-year periods. This assumption, based on water budget, is valid only if there is no major pumping and reservoir (e.g., wetlands, lakes, hydropower dams) in the catchment, likely to enhance or reduce baseflow naturally originating from groundwater return flow. Flow separation methods are particularly appropriate for application in the Mekong Basin due to its humid climate and tropical hydrology [13]. Humid regions are usually characterized by shallow water tables replenished at the end of the wet season mainly through diffuse recharge from rainwater infiltration, while focused recharge from water bodies plays a minor role in the overall groundwater balance [11]. For catchments greater than 200 km2 in humid tropical settings, groundwater usually discharges to rivers all year round, resulting in gaining streams, compatible with groundwater recharge estimation by stream hydrograph separation [11,14]. However, baseflow separation methods inevitably involve subjective choices on the mathematical algorithms that cannot fully capture the nonlinearity of processes controlling surface-groundwater exchanges: riverbank storage, spatial variability in evaporation, recharge and storage capacity of the aquifer [15]. Consequently, values of baseflow estimated with different algorithms can vary by a factor of two [5]. There is no consensus on which geomorphic and land-cover characteristics are most closely linked to subsurface storage and baseflow [16]. Factors that promote infiltration and recharge to subsurface storages will increase baseflow, while factors associated with higher evapotranspiration will reduce baseflow.
The objective of this study is to map diffuse groundwater recharge rates across the Lower Mekong Basin (LMB). The climatic, hydrological, and geomorphological characteristics of the LMB are described in Section 2. As detailed in Section 3, the methodological approach involves three steps: (i) quality-control and selection of suitable flow records available from 72 gauging stations along the main tributaries of the Mekong River; (ii) application of a mathematical digital filter to separate baseflow from total flow in the selected catchments where baseflow is equivalent to groundwater recharge over a multi-year period; and (iii) interpolation of groundwater recharge rates in un-gauged areas of the Lower Mekong River Basin, using multiple regression analyses of catchment geomorphologic and climatic characteristics. The results of this analysis are presented in Section 4 and discussed in Section 5.
2. Study Site
The Mekong is one of the world’s most important trans-boundary rivers in terms of total length (4800 km), catchment area (about 795,000 km2) and mean annual discharge (475 km3) [13]. Originating from the Tibetan Plateau in China, this river crosses Myanmar, Laos, Thailand, Cambodia and finally Vietnam where it flows into the South China Sea. The LMB includes the portion of the basin located downstream of China. It accounts for 79% of the total Mekong basin area and 84% of the flow volume [13].
2.1. Climate and Hydrology
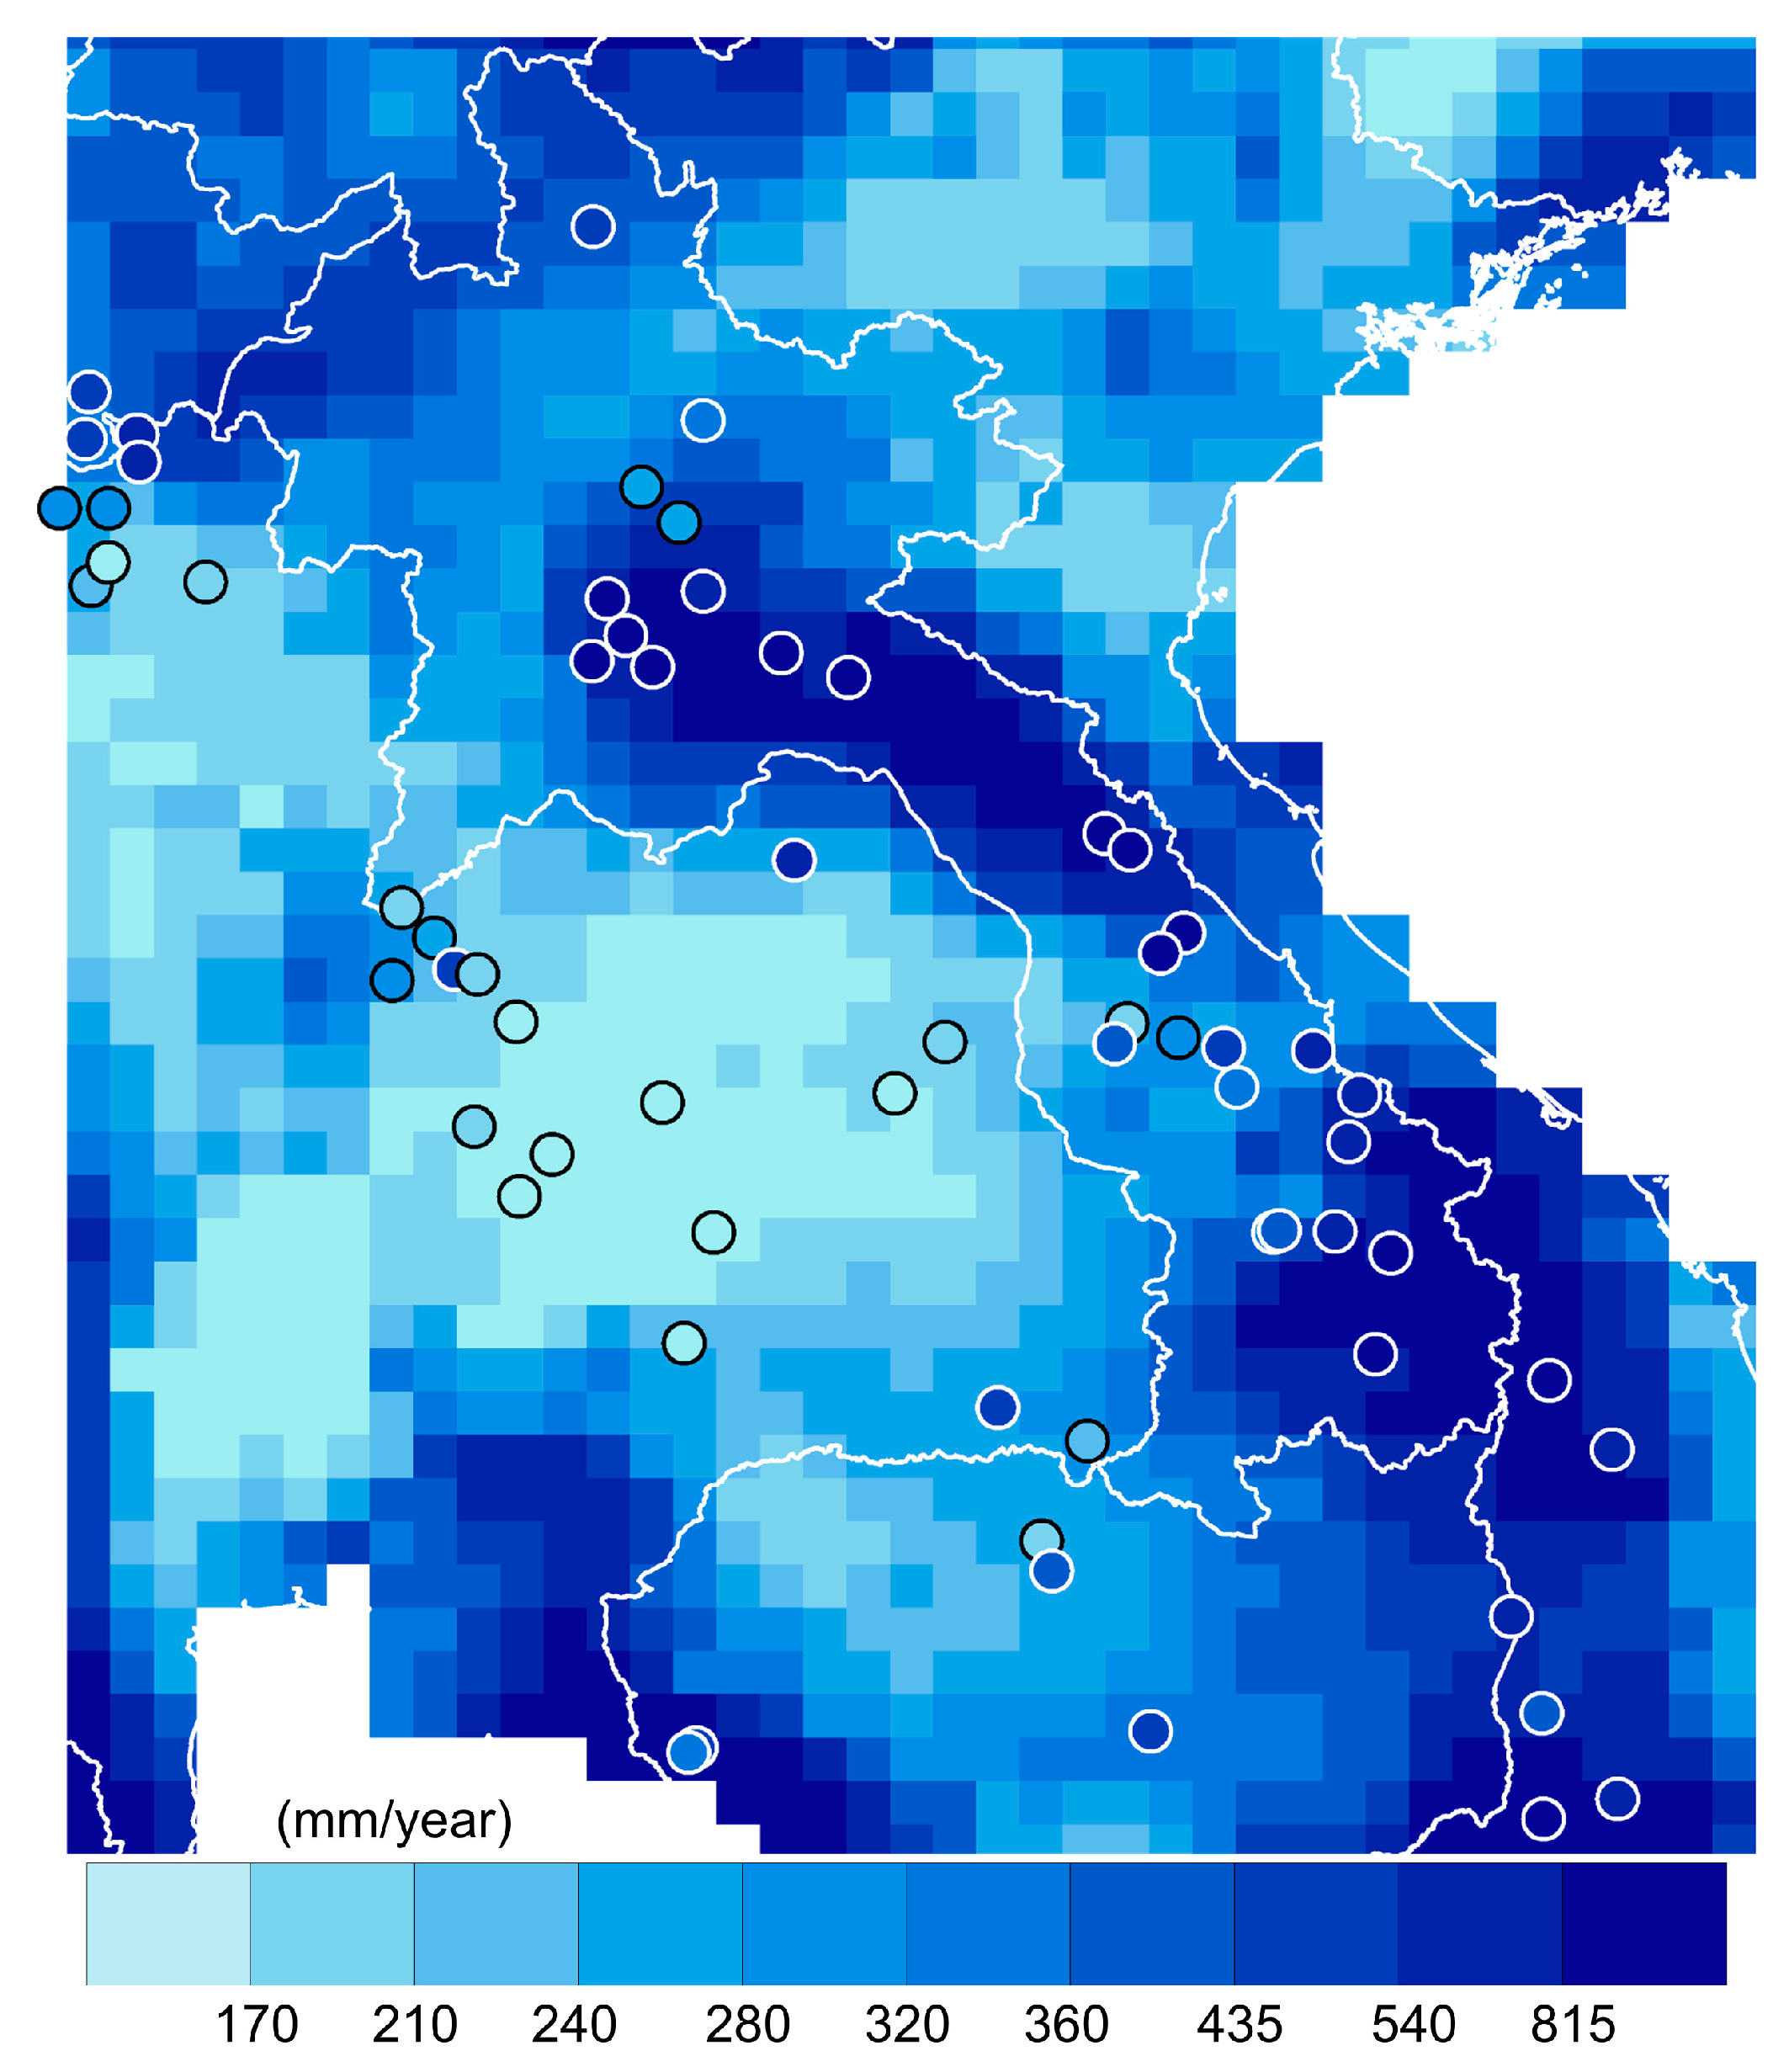
Mean annual rainfall in the LMB ranges from less than 1000 mm on the Khorat Plateau in Thailand to more than 2500 mm on the highlands of Laos. Mean potential evapotranspiration is maximal in Southern Cambodia where it exceeds 1400 mm/year and the lowest over the mountain ranges of Laos where it falls below 1050 mm/year [17]. Rainfall patterns are seasonal with about 80% of annual totals occurring during the wet season between May and October. The Mekong River discharges 75% of its annual flow between July and October which corresponds to the rainiest period of the year, caused by the tropical monsoonal climate [13].
2.2. Topography
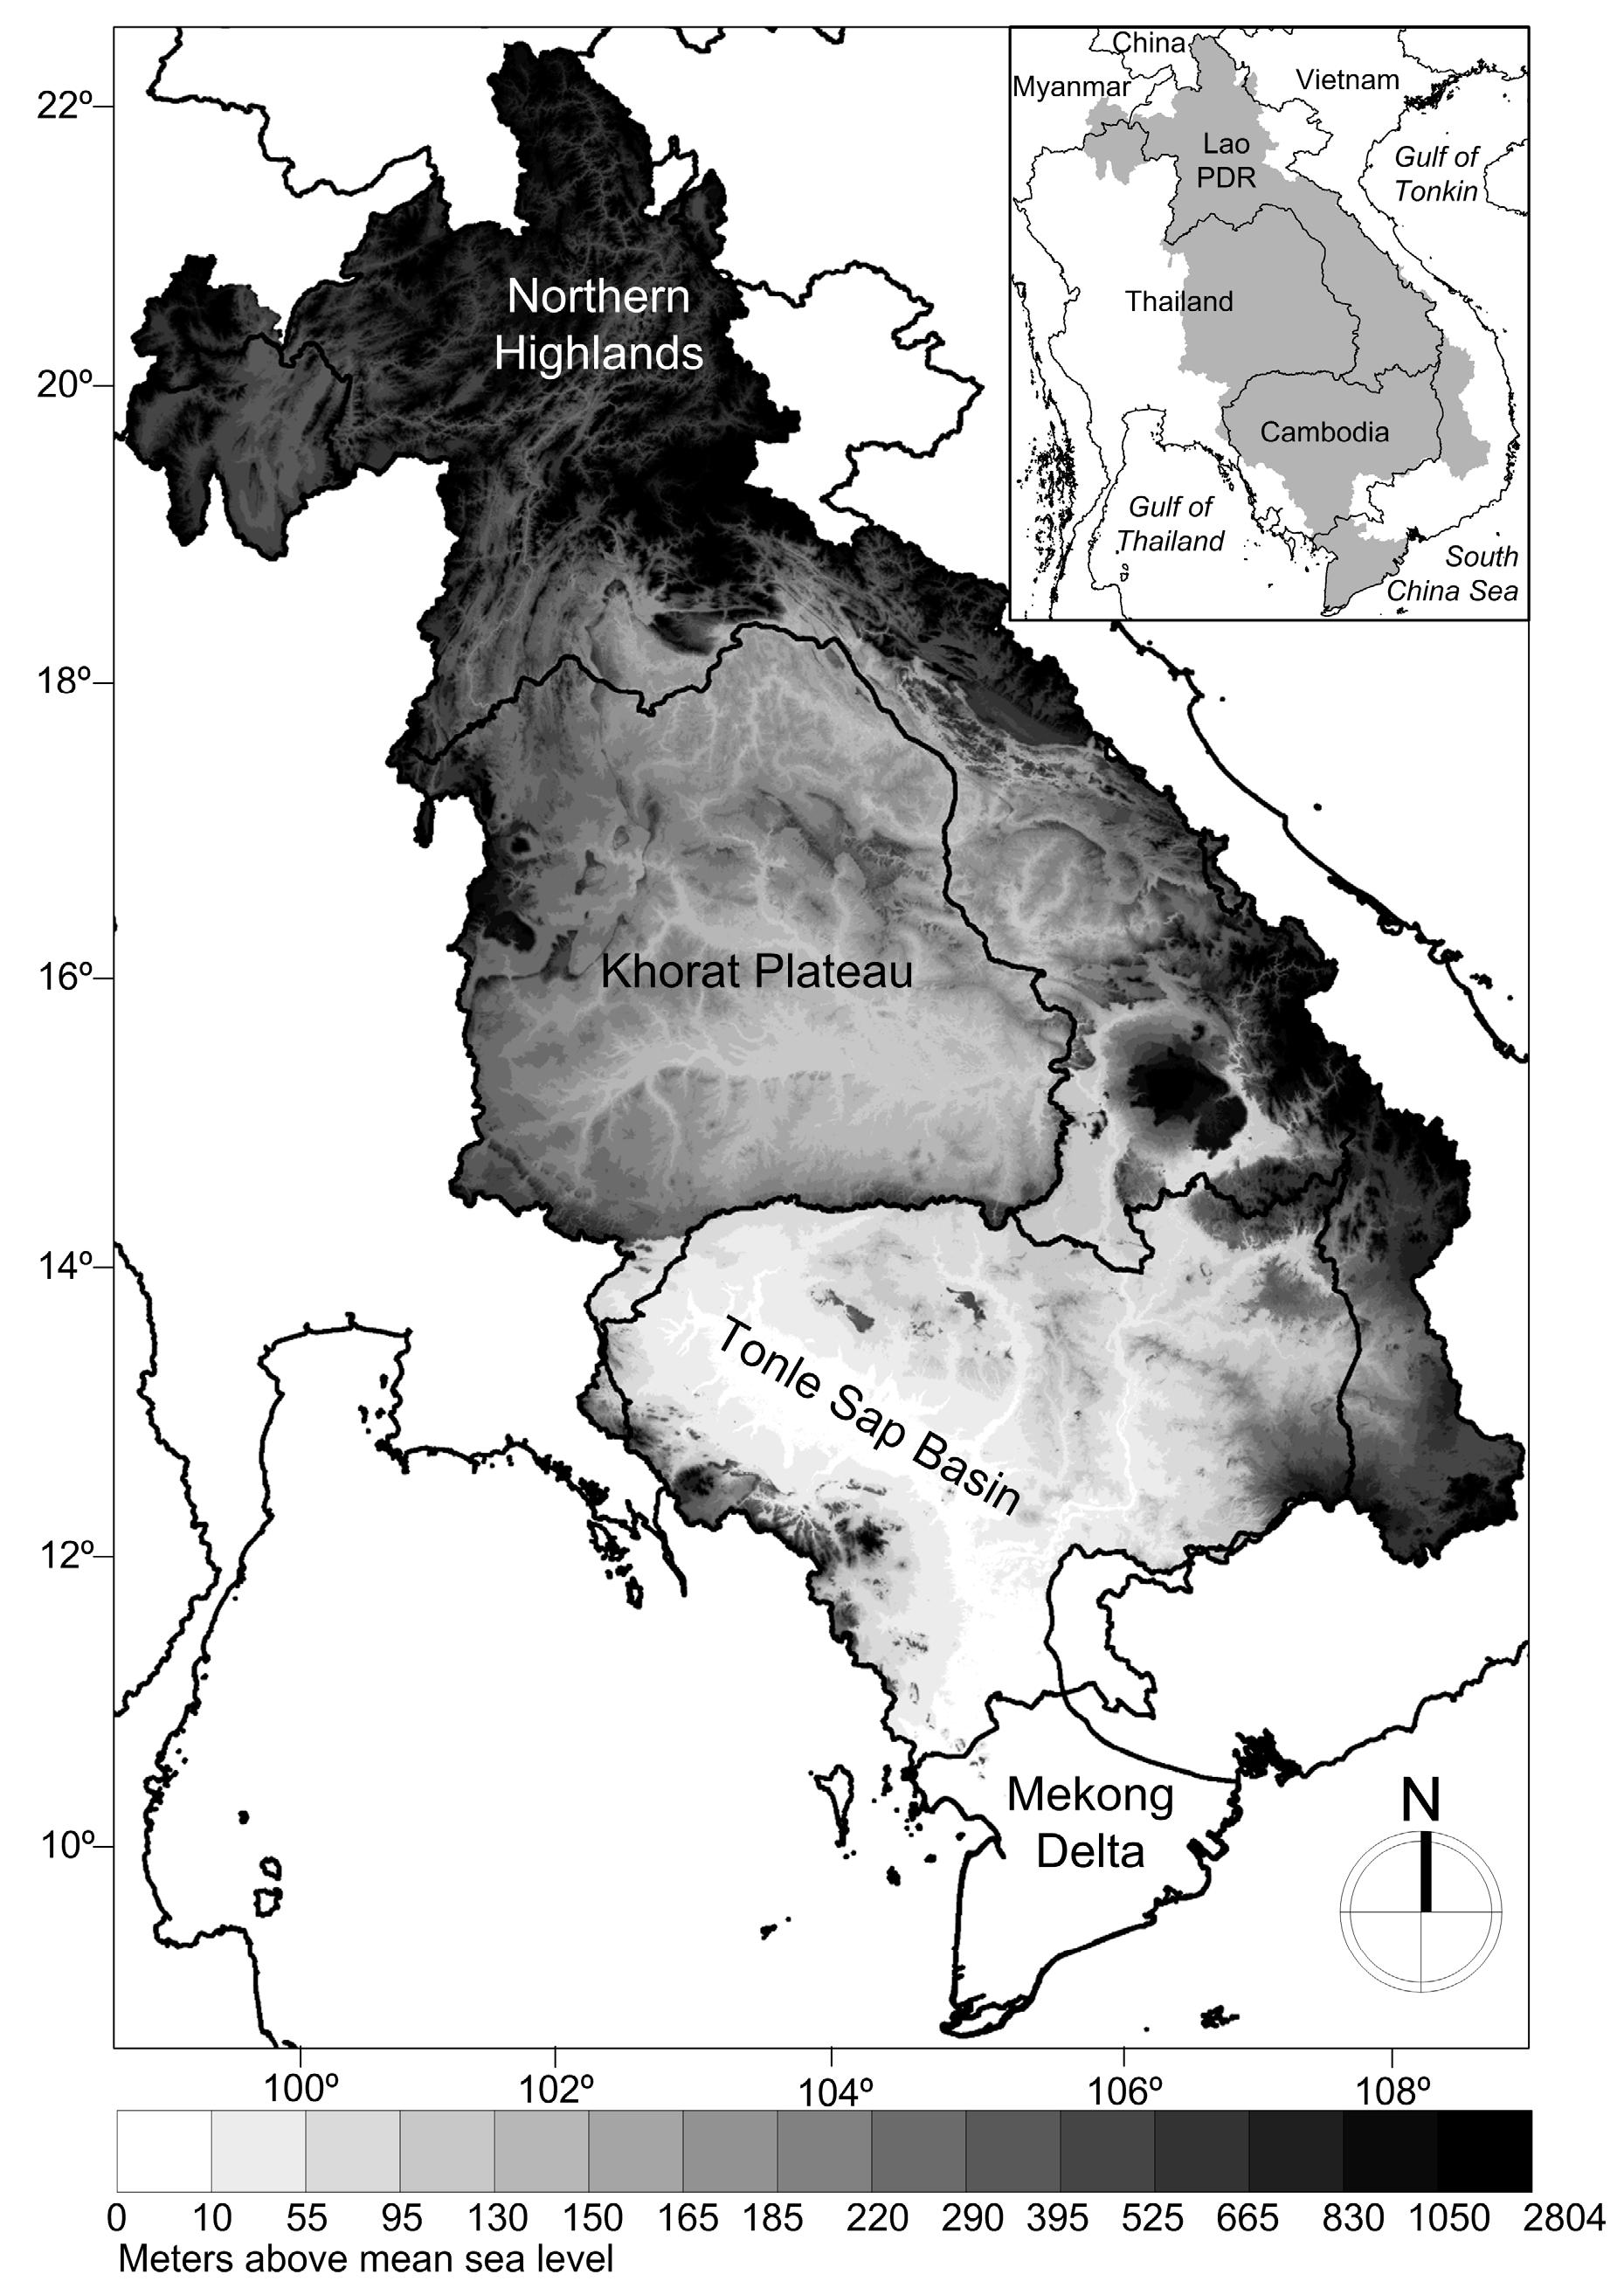
Four major topographic regions are distinguishable in the LMB: the Northern Highlands, the Khorat Plateau, the Tonle Sap Basin and the Mekong Delta (Figure 1). The Northern Highlands with elevations more than 600 m above the mean sea level, cover Northern Thailand, Laos and the northern section of the Annamite Range in Vietnam. They are characterized by a dense forest coverage. The Mekong mainstream and its tributaries flow through steep, rock-cut valleys. The Khorat Plateau extends over Northeast Thailand and includes much of the lowland areas of Laos. It is a sandstone plateau undulating between 100 and 500 m above the mean sea level, characterized by erratic rainfall and poor coarse-textured sandy and unevenly distributed soils, often saline. The drainage network in this relatively flat landscape is mostly dendritic. Further downstream, the Tonle Sap Basin covering most of Cambodia and Southern Laos is made of hills surrounding an alluvial plain including the large freshwater lake Tonle Sap, which reverses its flow direction into the Mekong during the wet season. Elevation is usually lower than 100 m above the mean sea level. The Mekong Delta begins near Phnom Penh in Cambodia where the river becomes a delta less than 10 m above the mean sea level, expanding across Southern Vietnam and covering 62,520 km2 of mangrove, swamps, sand dunes, spits, tidal flats, and irrigated rice paddy fields.
2.3. Hydrogeology
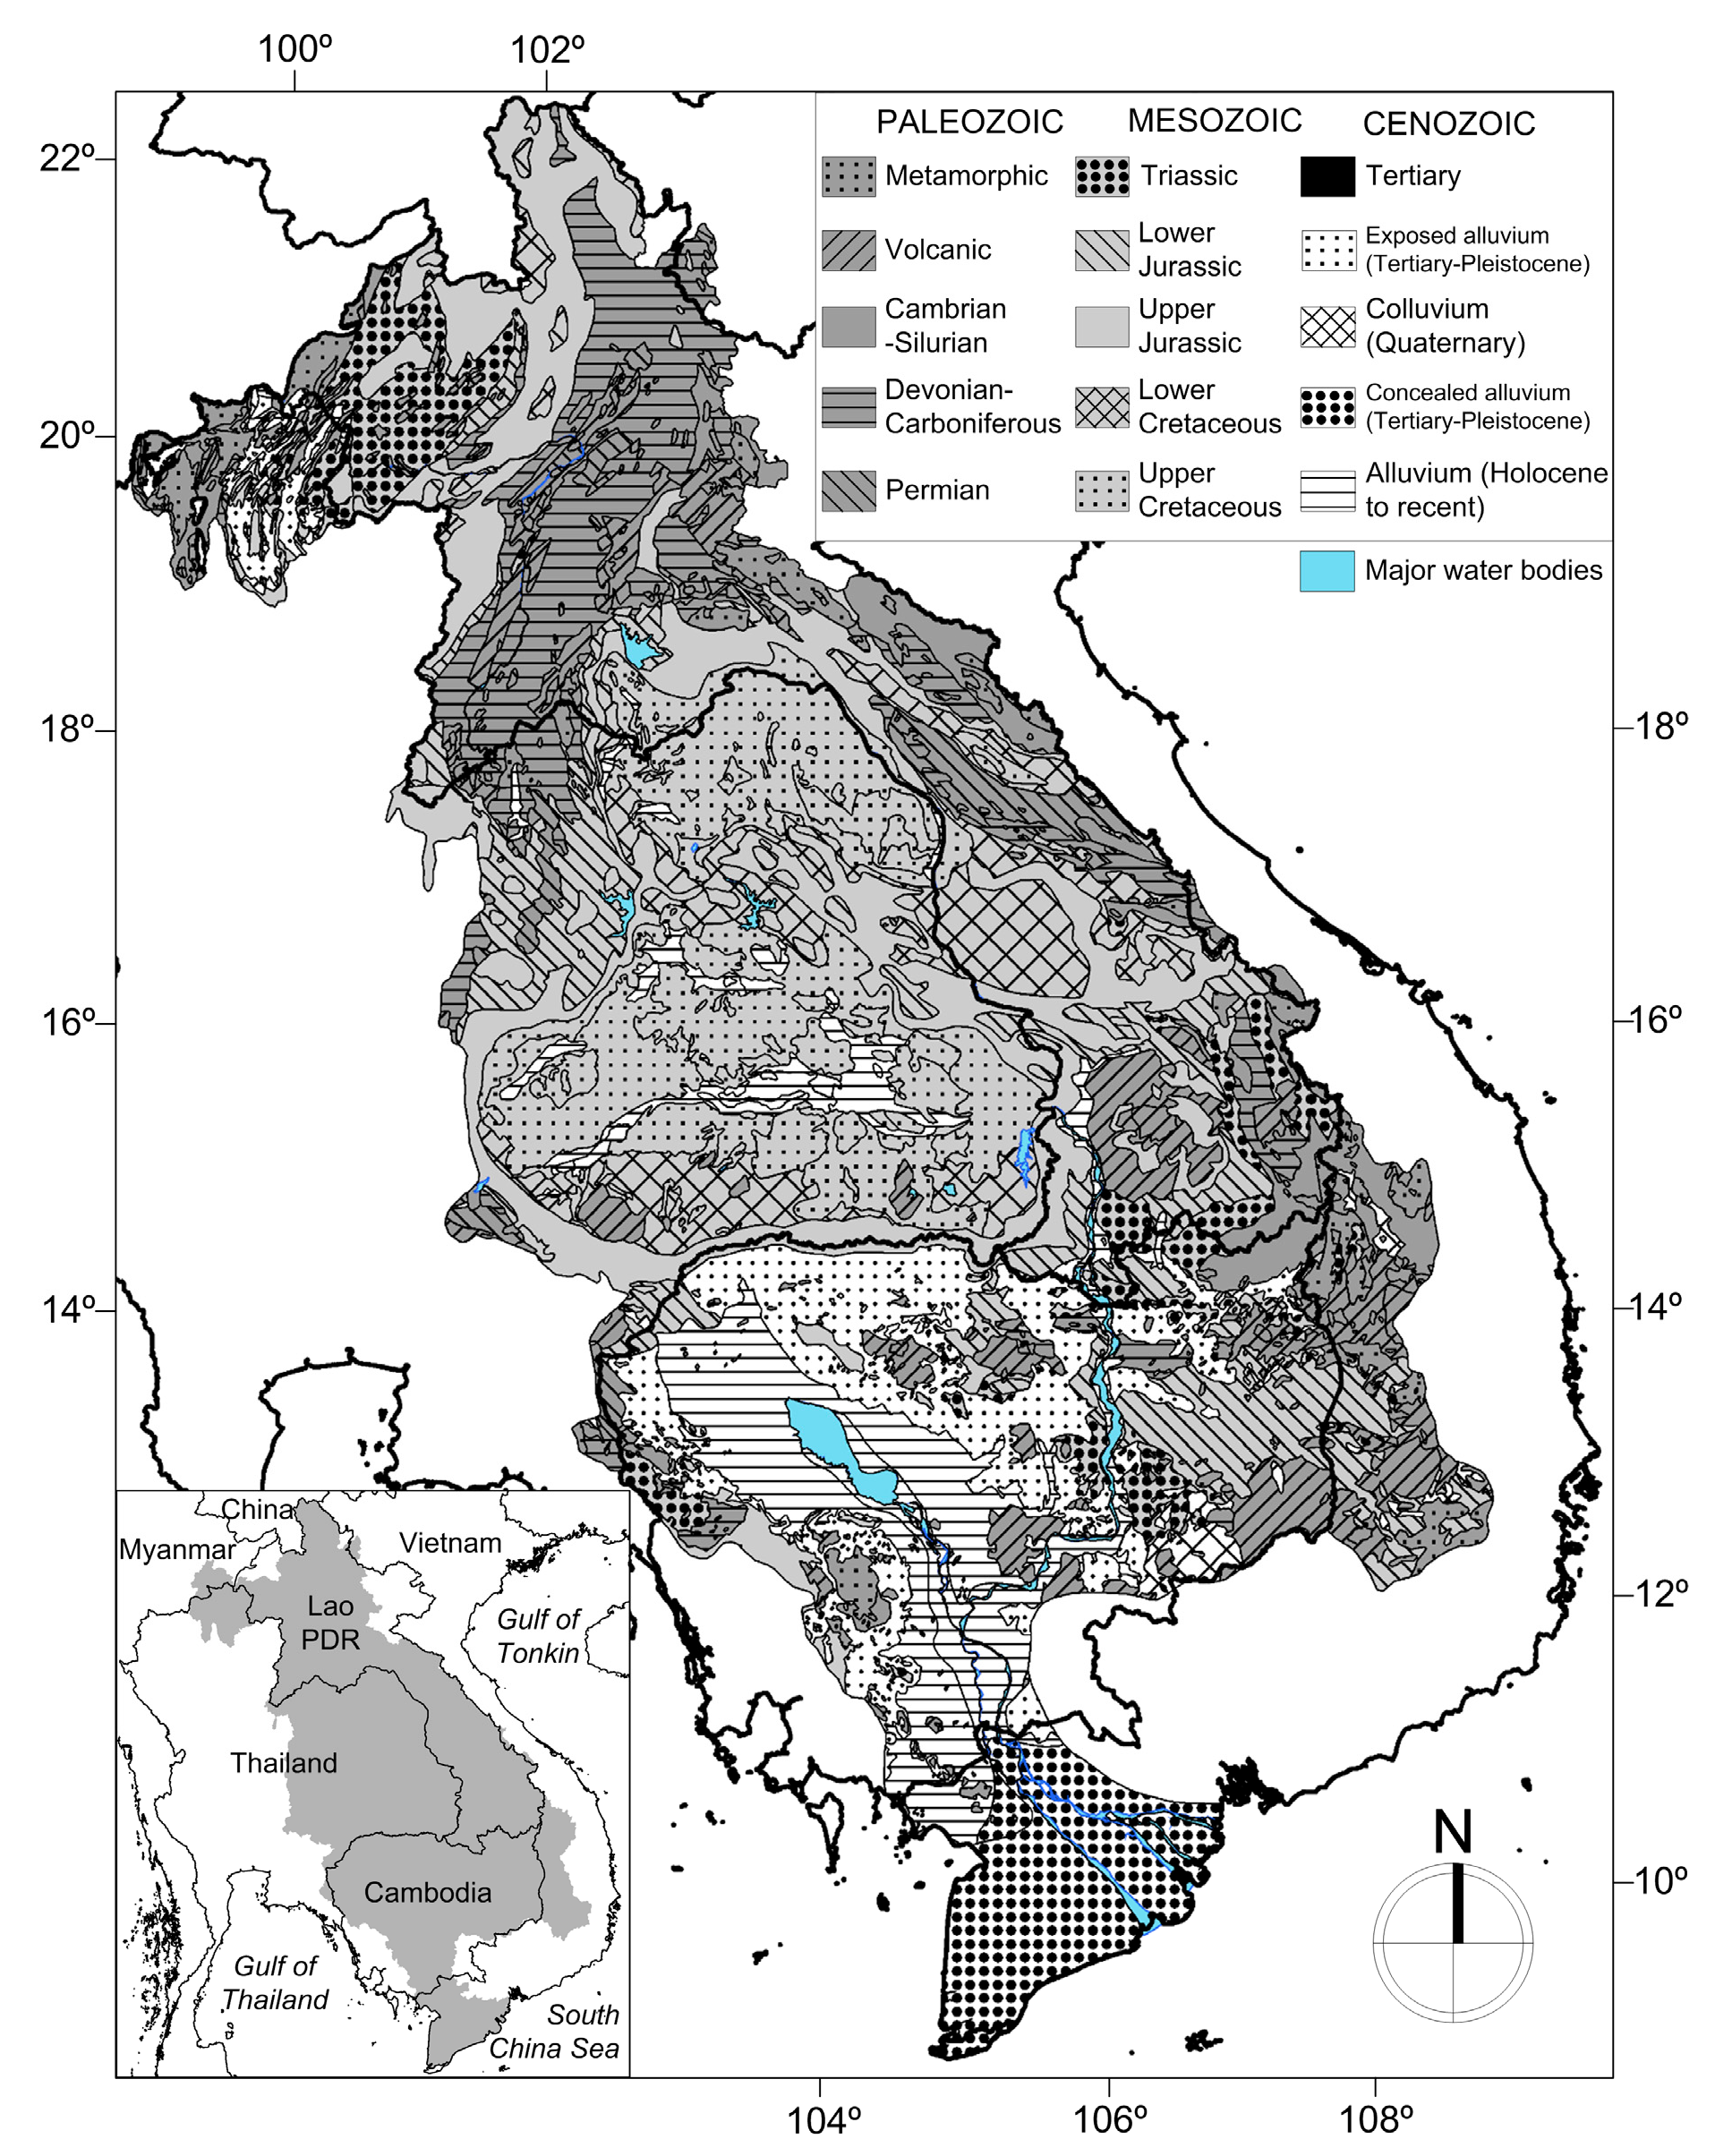
Four main hydrogeological units can be delineated in the LMB (Figure 2) [3,18,19]. (1) Along the eastern and southeastern border of the LMB, volcanic and granitic rocks with water-bearing features (joints, faults, and weathering zones) are overlapped by cemented early Paleozoic metasedimentary rocks with reduced porosity and permeability. However, the basalt flows of Southern Lao PDR, the Central Highlands of Vietnam, and Southeastern Cambodia have greater permeability; (2) In the Northern LMB, the porous and permeable late Paleozoic sedimentary rocks, dissected into relatively small blocks by subsequent orogeny, and topped by Mesozoic deposits, supports local groundwater flow systems locally discharging into tributaries of the Mekong River. In some locations, the Permian-aged karstic limestone are considered to be more productive aquifers; (3) In the lowlands, and particularly in Northeast Thailand, deep confined and shallow unconfined aquifers from the Mesozoic are comprised of sandstones. Outcrops of early Paleozoic rock bounded by Upper Jurassic sandstones have lower water yields; (4) In the Mekong delta, Cenozoic alluvial and deltaic sediments of up to 800 m thick form both unconfined and confined aquifers. The alluvial deposit in the upstream narrower valley rarely exceeds 100 m in thickness. Recharge in Pleistocene through Miocene deposits occurs in terraces along the margins of the Holocene alluvial plain. These terraces are generally coarser-textured and more productive aquifers than fine-textured Holocene surficial sediments including large amount of clay. While these observations provide an overall view of the hydrogeology across the LMB, the level of understanding remains largely qualitative. The transmissivities and water storage capacities of aquifers in the LMB have yet to be measured in a systematic way [3]. Only localized pumping tests allowed estimating aquifer hydraulic properties over a few areas [20,21].
3. Materials and Methods
After identifying suitable gauged catchments and computing daily baseflow, multiple regression analyses were applied to various climatic and geomorphologic characteristics computed for each catchment of the study sample. These variables were then used to predict baseflow values (i.e., groundwater recharge rates) in un-gauged areas of the LMB.
3.1. Catchment Selection and Baseflow Computation
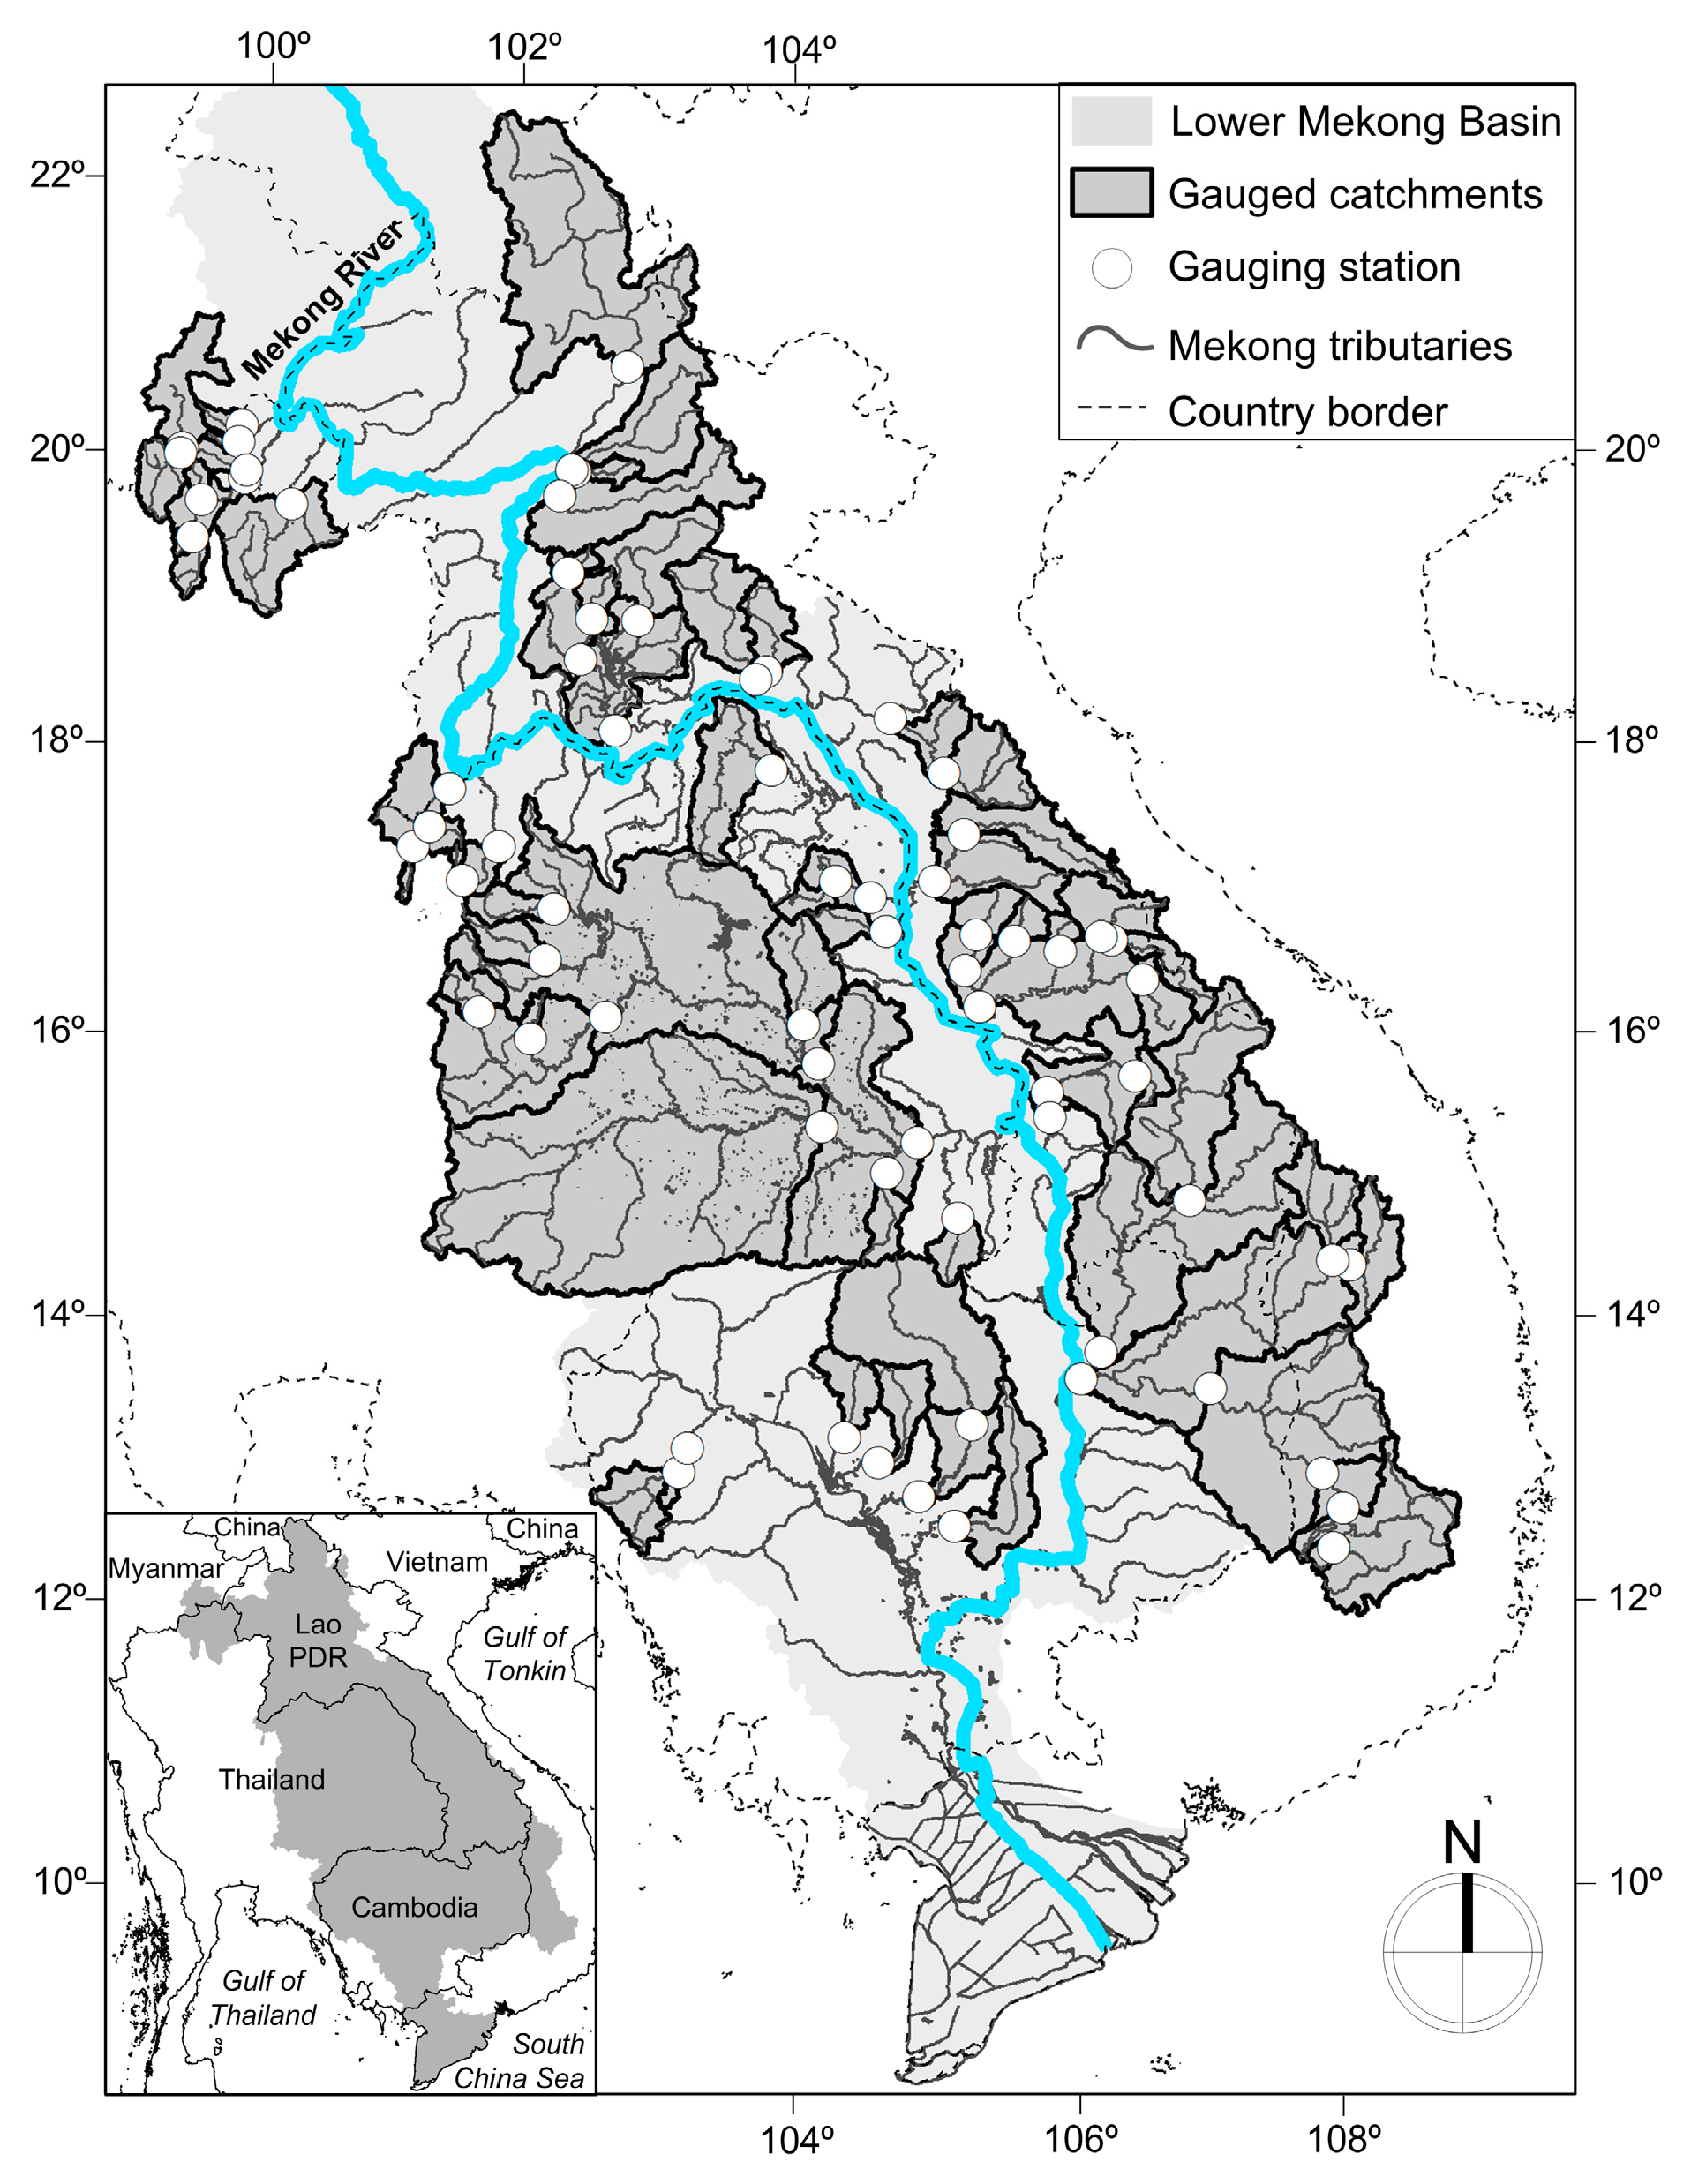
Daily streamflow records acquired from the Mekong River Commission were collected from 72 gauged sub-catchments of the LMB, corresponding to 1st to 5th order tributaries of the Mekong River. Visual inspection and comparison of streamflow hydrographs allowed selecting 65 gauging stations located along 50 rivers (Figure 3), on the basis that they provide records which were not subject to dam regulation, gaps, and questionable values [22]. The location and year of commission of hydropower dams were inspected for that purpose [23,24]. Depending on the catchments, the selected records include between 1 and 41 years of daily flow values with a median length of 17 years, circumscribed between January 1951 and December 2007.
Daily baseflow at each of the 65 gauging stations was calculated using the local minimum, a filtering separation method available in the BFI+ 3.0 software package [25,26]. This method has already been applied locally in the Mekong Basin to assess groundwater recharge over the basaltic plateau of Dak Lak province in Vietnam [27]. This method is suitable for processing long records of discharge data at many locations because it requires only a single parameter (N) derived from the catchment area, to be determined, and can be easily translated in computer code for fast processing. Baseflow is calculated by connecting the local minimums of total daily streamflow selected in a sliding time interval moved along the flow time series by 1-day increments. The duration of this time interval is calculated as follows. The theoretical average number N of days between a flood peak and the time when surface runoff ceases, is first computed with Equation N = A0.2 where A is the catchment area in square miles [28]. The time interval includes (2N*−1)/2 days where 2N* is the odd integer between 3 and 11 nearest to 2N. In each of the 65 catchments, specific annual baseflow (mm/year) was computed for each hydrological year (1st April–31st March) available in the records and the median annual value QB estim was selected as the independent variable to perform the multiple linear regression analysis (cf. Section 3.2).
Although in some situations, the local minimum method can overestimate baseflow [29], it mostly tends to provide a lower bound of digital filtering evaluations in general [30], thus providing conservative estimations of recharge. This is convenient for two reasons: (i) given the wide range of baseflow estimations provided by different flow separation algorithms, it is informative to know that our results will be a lower bound; and (ii) risks of overestimating the available water resources with the resultant water stresses are reduced.
3.2. Prediction of Baseflow Across the Lower Mekong Basin
To map groundwater recharge across the LMB, multiple regressions are used to identify multi-variate statistical relationships between measured baseflows and their catchments characteristics. These relationships are then used to predict baseflow in any un-gauged sub-catchment of the LMB, based on its characteristics. Candidate catchment characteristics for inclusion in the regression equation (presented in Section 3.3) are selected based on data availability across the whole LMB, and according to their potential influence on groundwater recharge. Instead of using linear regressions, power-law equations (Equation (1)), frequently used in environmental predictive statistics because of their greater performance compared to linear relationships [31], are used to compute QB predict that predicts QB estim from m catchment characteristics Xi. Their logarithmic transformation produces a linear model (Equation (2)) whose m + 1 coefficients βi can be determined with multiple linear regressions.
β0 is the intercept term of the model. ν and ε are the log-normally and normally distributed errors of the models, respectively. Normality in ε distribution is usually easier to obtain than in not log-transformed linear model, hence the advantage of power-law equations. The logarithm function being defined for strictly positive values only, adding one to catchment characteristics Xi including zero values allows a correct mapping between the value of ln(Xi+1) and Xi [32]. The selection of the catchment characteristics Xi that best predict QB estim, and the calculation of their respective coefficients βi are performed by weighted least squares regressions applied to the 65 values of QB estim j calculated in the 65 catchments (j = 1, …, 65), and their respective catchment characteristics Xij.
Unlike ordinary least square regressions treating all observations QB estim j equally, weighted least square regression enables the varying number kj of hydrological years used to calculate each value of QB estim j to be accounted [33]. Values of QB estim j derived from a greater number of hydrological years are more precise (have lower variance) and thus should have a greater weight in the regression. However, this reliability decreases as the variance of QB estim j increases. To account for these two counteracting factors, weights (wj) were calculated as follows:
where Stdev(QB estim j) is the standard deviation of QB estim j.
The explanatory variables Xi (i.e., catchment characteristics) that best predict baseflow were identified among a set of 15 candidate variables (described in Section 3.3 and listed in Table 1) using the two selection algorithms “best subsets regression” and “step-wise regression” available in MiniTab 16. This selection was intended to maximize the prediction R-squared (R2pred) calculated by leave-one-out cross-validations. Unlike the classical R-squared the maximization of which can lead to model over-fitting and loss of robustness, R2pred reflects the ability of the model to predict observations which were not used in the model calibration. Maximizing R2pred generally leads to greater parsimony in the number of explanatory variables. An explanatory variable was considered to be statistically significantly different from zero if its p-value, derived from the Student’s t-test, was lower than 0.05. The required homoscedasticity (homogeneity of variance) of the model residuals ε was verified by visual inspection of the residual plots. Possible multi-collinearity among the explanatory variables was controlled with the variance inflation factor (VIF). The influence statistic Cooks D was used to identify and remove outlier catchments exhibiting high influence on the estimation of the model coefficients [34].
The predictive power of the regression model was assessed by three criteria: the Nash–Sutcliffe efficiency coefficients (NSEC), the adjusted R-squared (R2adj), and R2pred. While R2pred assesses how well Equation (2) predicts responses to new observations, R2adj allows comparing the performance of linear regressions including different numbers of explanatory variables. While the value of the classical R2 systematically increases when a new explanatory variable is added in Equation (2), R2adj will increase only if the new term improves the performance of the linear regression more than what would be expected by chance alone [35]. While R2adj and R2pred estimate the strength of the linear association between the estimations and predictions, NSEC measures the goodness of fit of linear and non-linear models (including power law models, i.e., Equation (1)), thus allowing performance comparison with any hydrological model. NSEC is computed as follows:
where QB estim j is the median value of specific annual baseflow computed in catchment j with the local minimum method and QB pred j is the corresponding value predicted with the power-law model (i.e., Equation (1)) in the same catchment. is the spatial mean of the estimated baseflow QB estim j across all catchments.
3.3. Catchment Characteristics
Statistics for each catchment characteristic are listed in Table 1.
3.3.1. Climate
Catchment areal rainfall was computed using “Aphrodite”, a 0.25° × 0.25° grid of daily rainfall covering monsoonal Asia over the period 1951–2007 [36]. Aphrodite is one of the most reliable precipitation datasets to model discharge in the large river basins in Asia [37]. Several rainfall variables were tested for correlation with QB estim: annual and monthly rainfall, rainfall cumulated over the n-day (n = 5, 10, and 15) rainiest periods of the hydrological year. Annual median rainfall, exhibiting the greatest correlation coefficient with QB estim, was included as the only candidate rainfall variable in the regressions (Table 1). Median annual values of catchment areal temperature and standard evapotranspiration (ET0) were computed using 0.5° × 0.5° gridded monthly values from the Climate Research Unit [38]. ET0 was calculated with the FAO grass reference evapotranspiration Equation applied to climate variables from the same data source covering the period 1901–2009 [39]. These three climate median values and QB estim j were derived from the same kj hydrological years in each selected gauged catchment. In addition to ET0, median annual values of actual catchment areal evapotranspiration were computed using the land surface evapotranspiration product MODIS 16 available at daily time step with 1 km2 resolution for the period 2000–2012 [40].
3.3.2. Geomorphology and Geographic Coordinates
Five geomorphological characteristics, likely to control hydrology, were derived from HydroSHEDS, a quality-controlled 90-m digital elevation model [41]. These catchment characteristics, including drainage area, drainage density, mean elevation, mean slope and perimeter, were computed with ArcMap 10.0. The drainage density is the cumulative length of the stream network within the catchment, normalized by its drainage area. The stream network is made of outlet points draining an area greater than 40 km2. This threshold value was selected to best capture the variability of drainage densities among the studied catchments. The geographic coordinates of the catchment centroid (latitude and longitude) were selected as two additional candidate explanatory variables to capture any longitudinal and latitudinal gradients in incomputable environmental variables possibly influencing groundwater recharge across the LMB (e.g., aquifer properties).
3.3.3. Soil
The top-soil texture and soil depth, two soil characteristics likely to control hydrological processes and groundwater recharge were quantified using a four-level scale suggested by the Mekong River Commission (Table 2) [42]. Mean values of each soil characteristic in each catchment were obtained by weighting each scale level by the respective area covered in the catchment.
3.3.4. Land Cover
Two land covers, likely to exert contrasted influences on hydrological processes across the LMB [43] and at the studied catchment scales [44], were selected as candidate explanatory variables: forest and rain-fed lowland rice paddy fields. Forest cover was produced by merging four forest types available as separate land-cover classes in the published map of the Mekong River Commission [42]: “coniferous forest”, “deciduous forest”, “evergreen forest” and “forest plantation”. The land cover “rain-fed lowland rice paddy field” was directly available as an individual class in the map. While forest is usually characterized by high infiltration and evapotranspiration rates, rain-fed lowland rice paddy fields limit deep percolation due to an impermeable soil layer at the basement of the rice root zone [43]. These two variables correspond to the percentage area of each land cover in each catchment.
Variables related to the hydrogeology (e.g., transmissivity, storage capacity of aquifers) could not be included in the list of candidate explanatory variables because of the absence of broad scale quantitative data in the LMB. This limitation is discussed in Section 5.
4. Results
4.1. Baseflow Estimations
The median value of specific annual baseflow computed in each catchment with the local minimum method (QB estim) varies between 53 mm/year (catchment of the Nam Mun River at Rasi Salai station, Thailand) and about 1000 mm/year (catchment of the Nam Sane River at Muong Borikhan station, Laos) with a median value of 439 mm/year. Circles depicted in Figure 4 show the spatial distribution of these estimated recharge rates. Strikingly, extreme values are grouped regionally. Greatest values are observed in Central Laos, ranging from 625 to 1000 mm/year, and Southern Laos, ranging from 600 to 1000 mm/year. Lowest values, between 83 and 190 mm/year, are grouped in Northeast Thailand.
4.2. Multiple Regressions Analysis
4.2.1. Prediction of Groundwater Recharge
The influence statistic Cooks D allowed identifying three outlier catchments in the original dataset: Nam Loei River at Ban Wang Sai station, Thailand; Stung Sangker River at Treng Station, Cambodia, and Krong Kno River at Duc Xuyen Station, Vietnam. Their removal from the regression analyses allowed increasing R2pred percentage value by 27 points. A combination of four explanatory variables selected among the 15 variables listed in Table 1 is sufficient to predict QB estim with the following performances: R2pred = 66.36%, R2adj = 70.30%, and NSEC = 63.70% (Equation (5)).
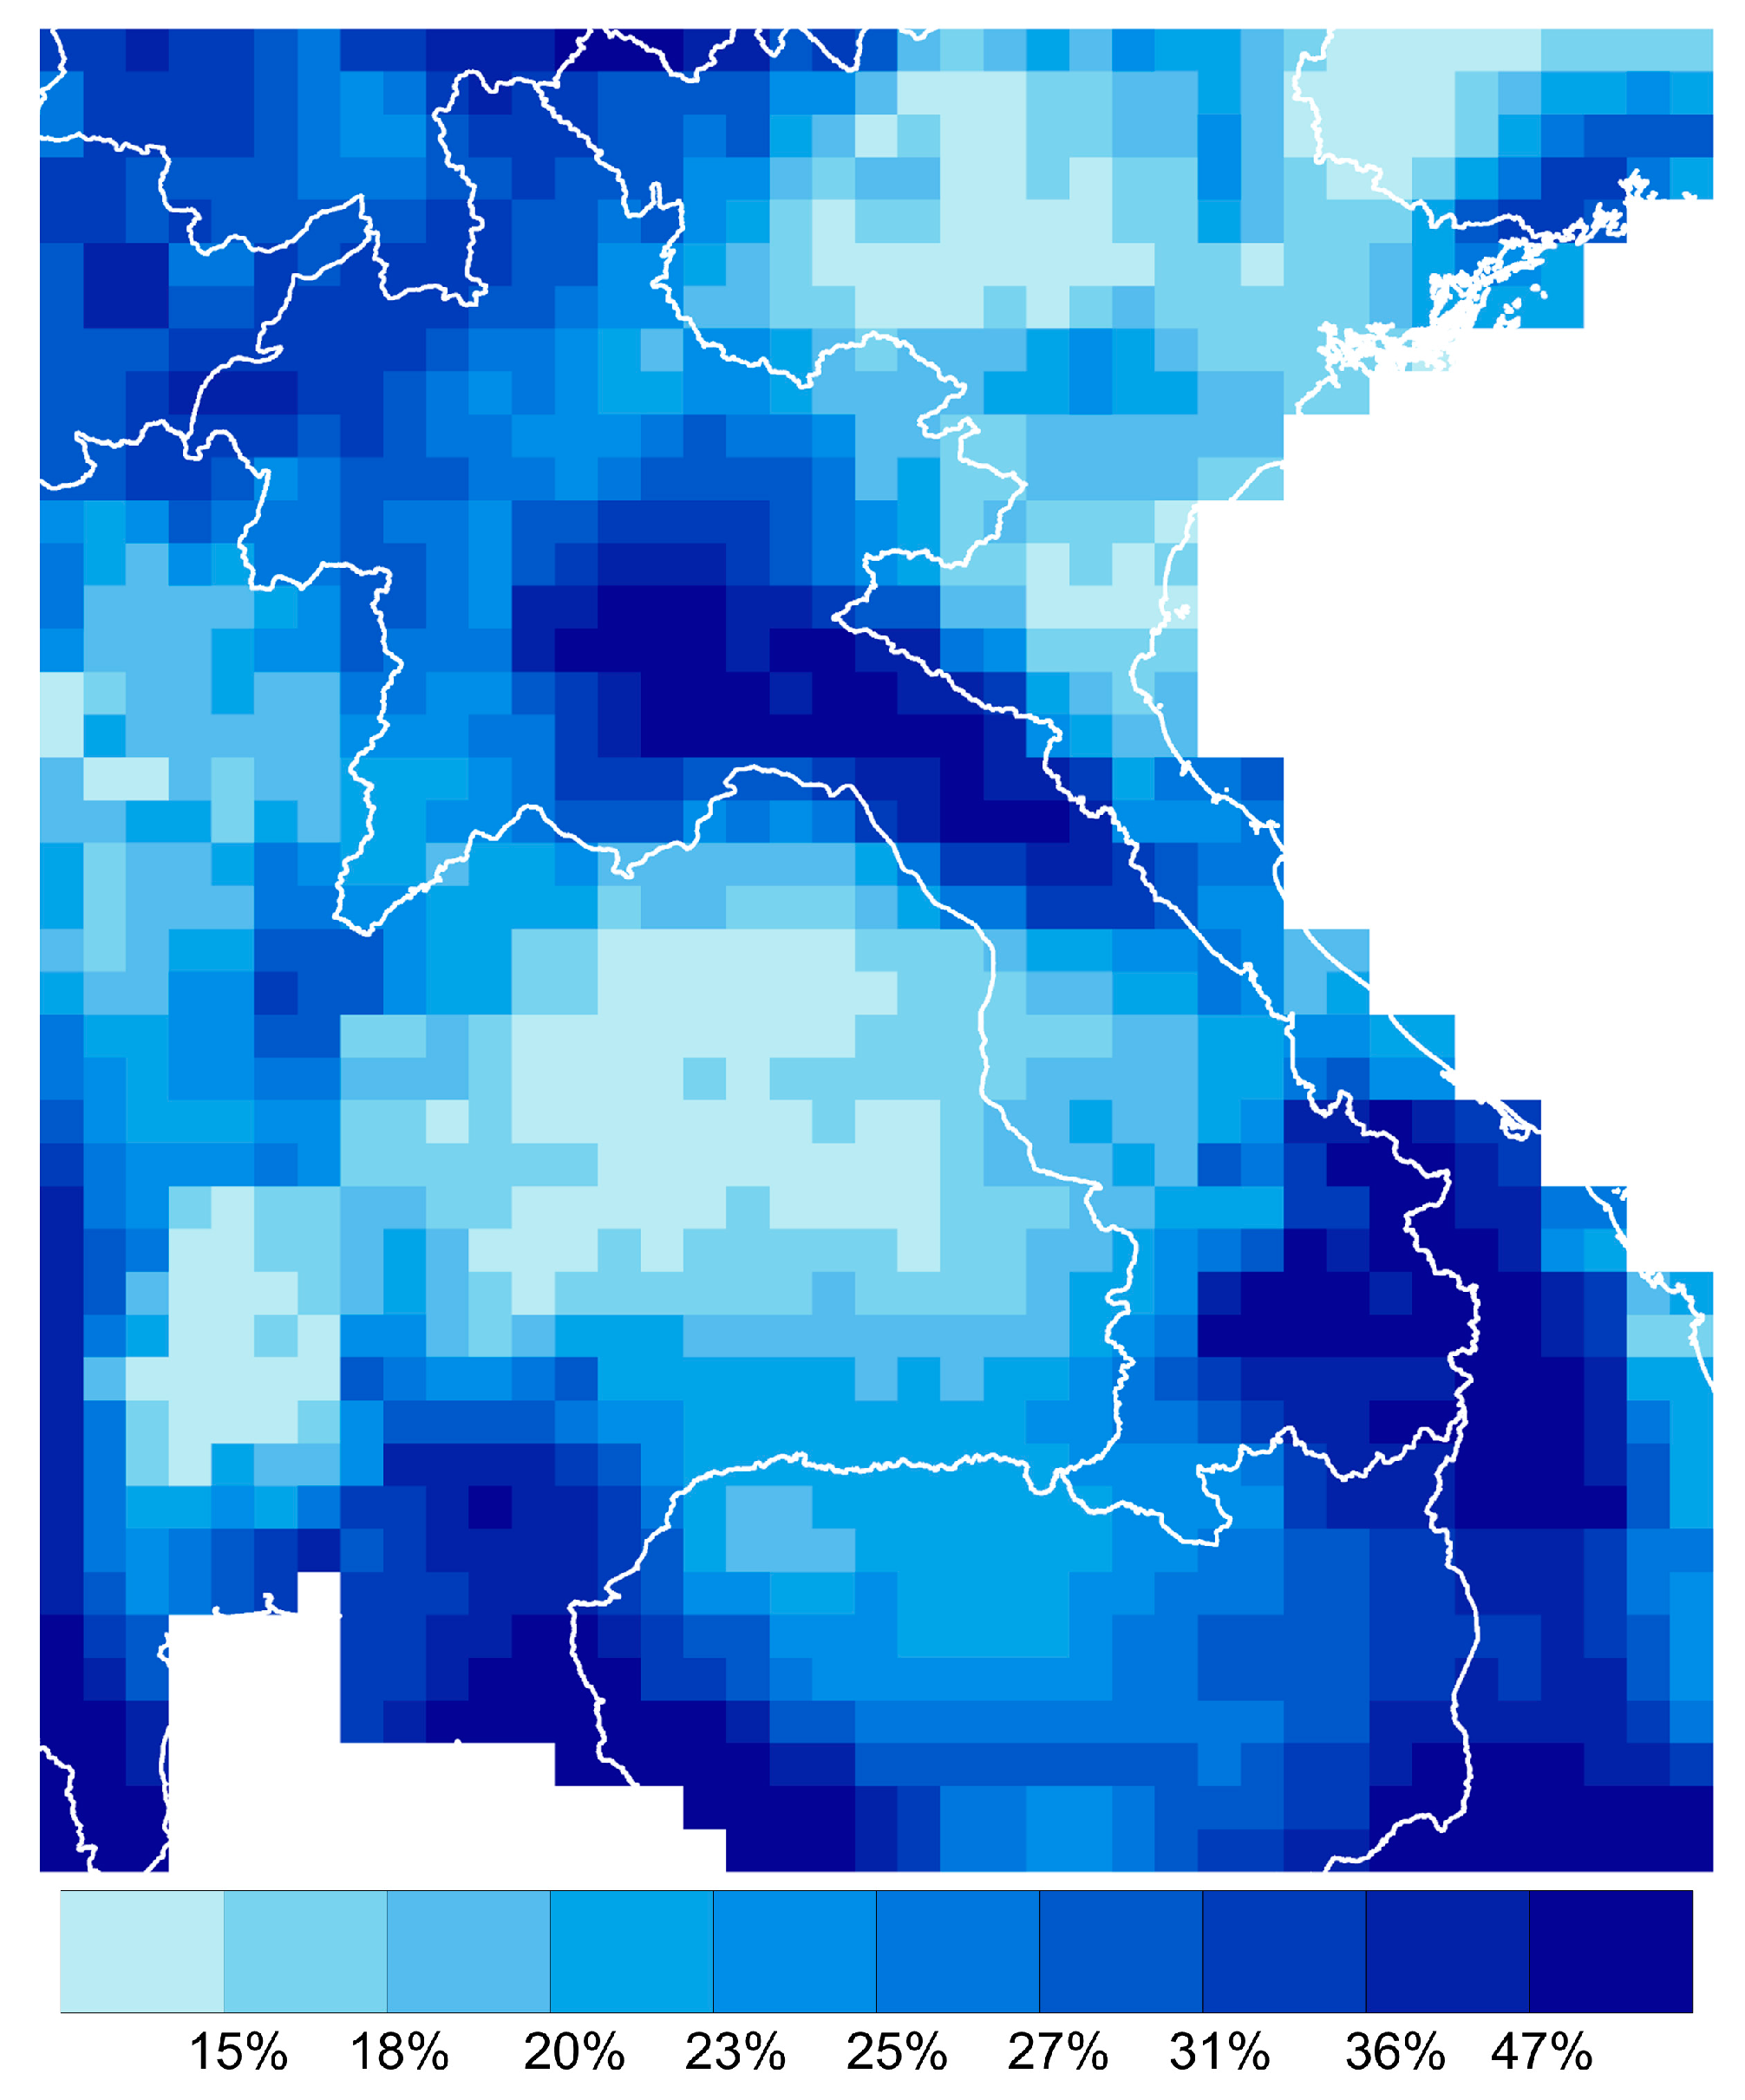
where QB pred is the independent variable predicting QB estim. The dependent variables Rain (medium annual rainfall), ET0, Lat (latitude) and Long (longitude) are listed in Equation (5) according to their decreasing explanatory power (T-ratios = 7.51; −4.35; −2.96, and −2.48, respectively). The coefficient of Rain is much greater than unity, indicating that an increase of x% in annual rainfall would induce an >x% increase in baseflow (i.e., groundwater recharge). Consistently, the coefficient of ET0 is negative, reflecting the moderating effect of evapotranspiration on groundwater recharge. Unlike ET0, actual land surface evapotranspiration had no explanatory power. Lat and Long are negatively correlated to baseflow. The exclusion of actual ET and inclusion of Lat and Long in Equation (5) are discussed in Section 5. Predicted values of groundwater recharge QB pred derived from Equation (5) are represented with colored grid cells in Figure 4. To prepare this map at 0.25° × 0.25° spatial resolution, each value of ET0 available at 0.5° × 0.5° spatial resolution was first replicated in the four corresponding 0.25° × 0.25° grid cells. Figure 5 displays regional variations in Rain and ET0. Visual comparison with Figure 4 confirms that Rain is the main driver of QB pred, with maximum and minimum QB pred values observed in the rainiest and driest locations, respectively. Anti-correlation between QB pred and ET0 is less obvious, though highly significant (F test p-value = 0.00), as confirmed by the correlation coefficients RLn computed on the logarithms of the variables: RLn (QB pred, Rain) = 79.13%; RLn (QB pred, ET0) = −32.10%. Figure 6 maps spatial variations in the ratio between QB pred and Rain. These variations follow the regional variations of Rain Figure 5a, RLn (Rain, QB pred/Rain) = 52.06%, because the coefficient of the dependent variable Rain in Equation (5) is greater than unity, reflecting the non-linear relationship between rainfall depth and groundwater recharge, and highlighting the dominant role of annual rainfall in the control of groundwater recharge rates. This ratio varies between less than 15% in Northeast Thailand, up to more than 50% in Central and Southern Laos.
Groundwater recharge rates are often limited by soil properties. In addition, land cover and land use influence groundwater recharge by controlling actual evapotranspiration rates and altering soil properties, which in turn influence infiltration rates. However, no variables related to land cover and soil are included in Equation (5) because their explanatory power is lower than that of Rain, ET0, Lat and Long.
4.2.2. Model Performance
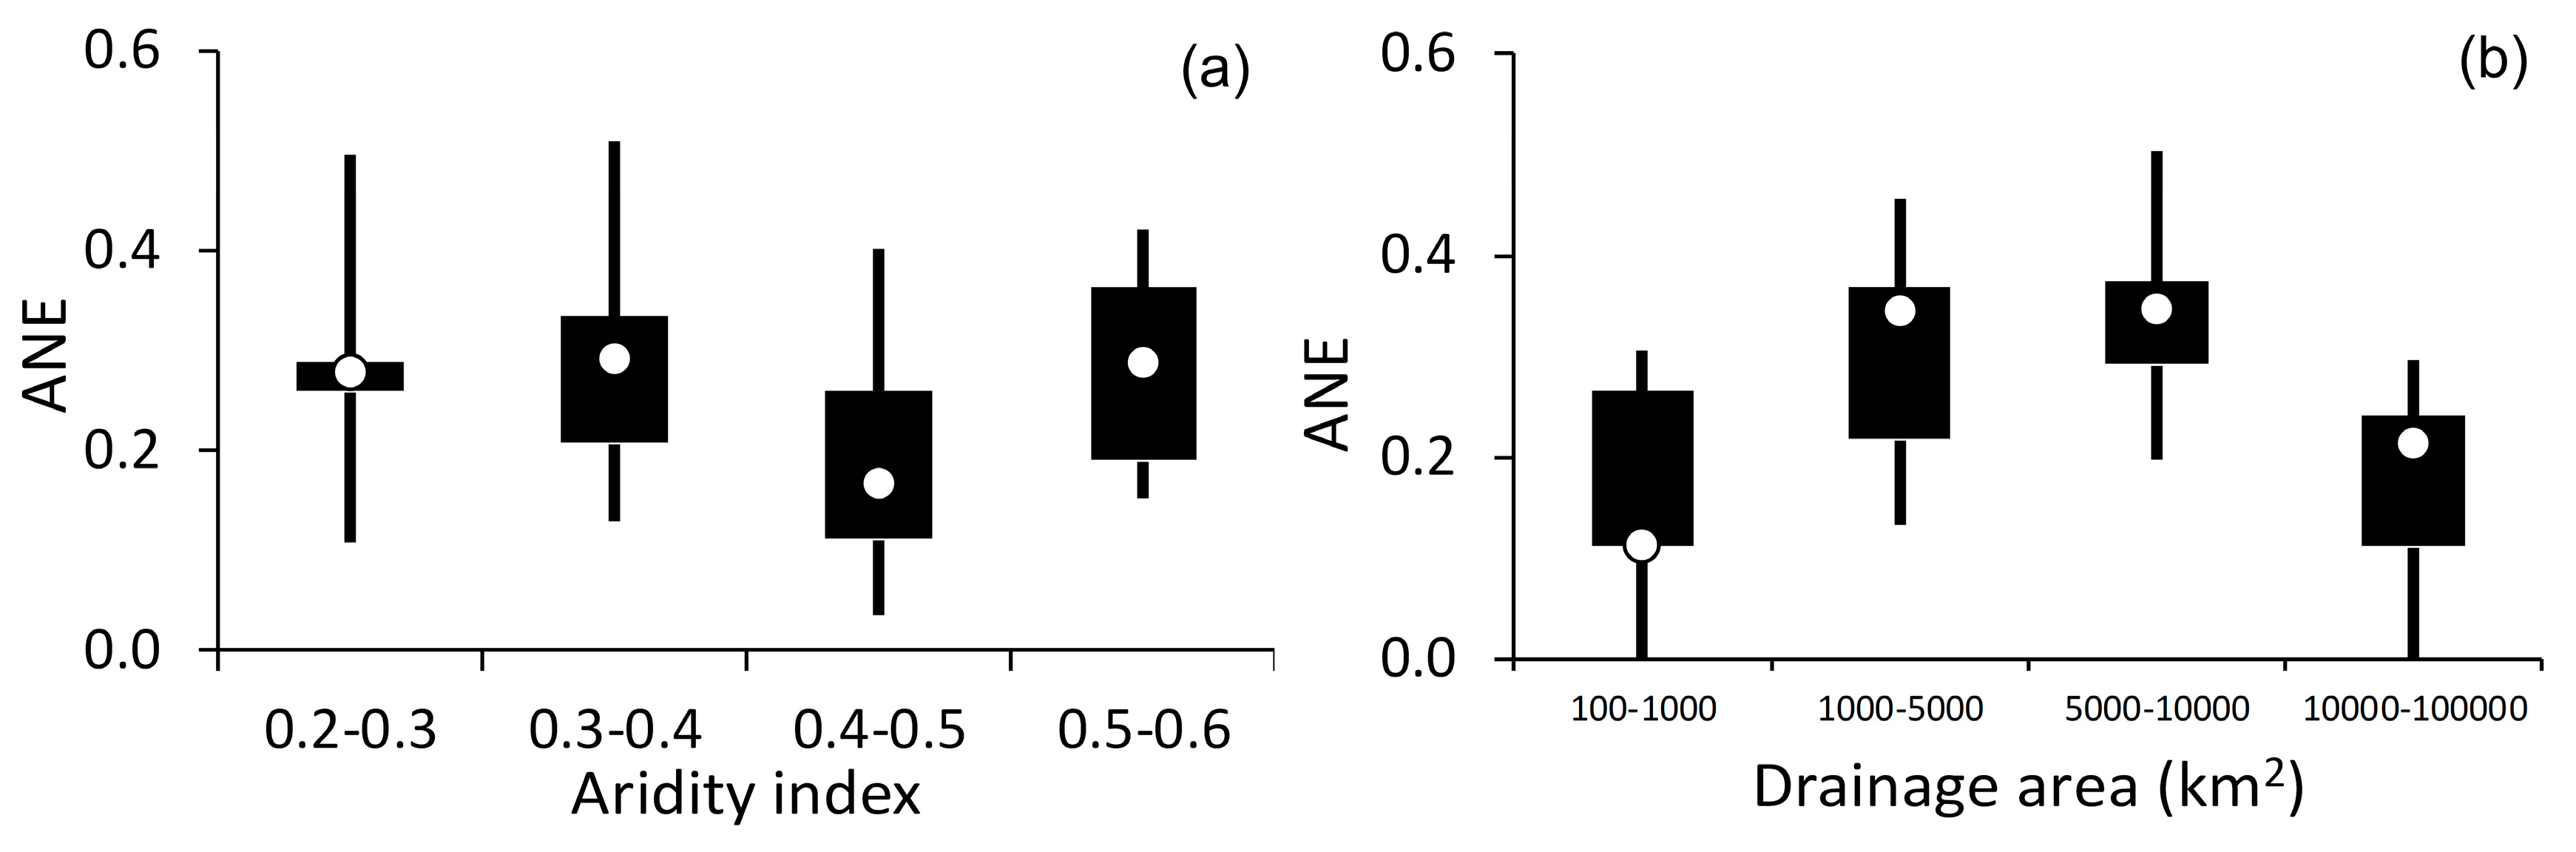
QB pred values depicted by square grid cells in Figure 4 consistently exhibit local maximums and minimums in areas where QB estim show similar extremes (e.g., Central and Southern Laos, and Northeast Thailand, respectively). Figure 7 compares QB estim and QB pred to assess the performance of the power-law model. The scatter plots align well along the first bisector with more than half of the catchments having an absolute normalized error (ANE = |QB estim−QB pred|/QB estim) lower than 30%. These errors result from the assumptions of the local minimum and multiple linear regression methods, and from possible inaccuracies in the original flow values. Even though cross-validation has been performed, extrapolation to un-gauged catchments still adds non-measurable uncertainty. Figure 8 illustrates how ANE varies according to the aridity index (i.e., ET0/Rain) and the drainage area of the studied catchments. ANE ranges from 0.26 to 0.64 across the studied catchments, with a median of 0.45, typical of humid tropical areas where regression models predicting flow are known to perform best [45]. Although flow prediction is usually hampered by greater hydrological variability and higher presence of ephemeral rivers in drier areas, the power-law model predicting baseflow is not influenced by the aridity index in the LMB (Figure 8a). In contrast, ANE varies according to the drainage area of the catchments and exhibits a maximum in medium-size catchments (5000–10,000 km2) (Figure 8b).
While ANE allows the predictive performance of the models to be assessed for individual catchments and to determine how it relates to the catchments characteristics, the three criteria (R2pred = 66.36%; R2adj = 70.30%; NSEC = 63.70%) assess how well the power-law model described in Equation (5) performs, allowing comparisons with regional regression models developed in other parts of the world. Our NSEC value, equivalent to the classical R2 reported in [45], falls within the range of values typically observed for regression models predicting low flows in other humid regions of the world [45]. Finally, it should be noted that we re-applied the regression analysis using the original values of the variables (not log-transformed) and verified that the power-law structure outperformed the linear one, likely because of the typical non-linear relationship between rainfall and flow.
5. Discussion
5.1. Factors Determining Groundwater Recharge
Like many other studies under temperate or tropical climates [46,47,48], our results indicate that spatial variations in baseflow, used as a proxy of groundwater recharge, are predominantly controlled by rainfall and ET0. While ET0 is the second most powerful predictive variable of Equation (5), actual land surface evapotranspiration had no predictive power. Likely explanations include: (i) the mismatch between periods used to compute QB estim and actual evapotranspiration derived from MODIS 16, and available since 2000 only, considering that recent land-cover changes have occurred across the region; (ii) the incomplete validation of MODIS 16 product for tropical Southeast Asia [49]. Latitude and longitude are the third and fourth most powerful predictive variables of Table 1. They most likely act as surrogates for environmental processes controlling baseflow, exhibiting latitudinal and longitudinal gradients, and not listed in Table 1 since independency between the explanatory variables is a prerequisite for inclusion in the regression equation. Regional characteristics of the aquifers (Figure 2) exhibit such gradients: the southwest part of the LMB corresponds to sedimentary sandy deposits of the Khorat Plateau in Northeast Thailand and the alluvial plain of the Mekong River in Cambodia and Southern Vietnam. These sedimentary deposits are usually characterized by greater permeability than the more compact metamorphic rocks prevalent along the Annamite Range from the North to the Southeast of the LMB [3,18,19]. Although this contrast is reversed in a few and confined locations (e.g., the basalt flows in Southern Laos with greater permeability; the early Paleozoic rocks in Northeast Thailand with reduced permeability), these local contrasts have likely minor influence on groundwater recharge at the scale of the studied catchments. Based on these observations, and accounting for the limited quantitative hydrogeological data explained in Section 2, we hypothesize that Lat and Long in Equation (5) are surrogate variables for the permeability and transmissivity of the aquifers that likely increase from North to South and from East to West across the LMB, in accordance with the signs of the coefficients of Lat and Long in Equation (5). It should be noted that a power-law Equation with only Rain and ET0 as explanatory variables yields an R2pred value of 63.69%, about 3 points lower than the R2pred value of Equation (5). This comparison indicates that: (i) climate explains more than half of QB estim variability across the LMB; and (ii) assuming that Lat and Long are surrogates for aquifer properties, the regional geology explains at least 3% of QB pred variability.
The non-inclusion of land-cover and soil characteristics in Equation (5) is due to their explanatory power, lower than that of the four selected variables Rain, ET0, Long and Lat. The lower hydrological influence associated with land covers is consistent with the usually moderate hydrological effect of land-cover changes in catchments with mixed land covers and an area greater than 1000 km2. Over such large areas, the combinations of various land covers, with counteracting changes, generally render their individual hydrological effects difficult to detect [44]. The exclusion of soil characteristics from Equation (5) may be related to the poor accuracy of the soil maps used in this assessment, and/or to the surrogating effect of the latitude and longitude.
5.2. Comparison with Previous Studies
The range of recharge rates that we estimated and predicted in the LMB (Figure 4) is similar to that provided in the global assessment calculated by the WaterGAP Global Hydrology Model WGHM [5], and varying between 100 and 1000 mm/year across mainland Southeast Asia. Our estimations of recharge rates can also be compared with more localized studies [8,9,10,50,51,52,53,54]. Baseline recharge rates estimated with the HELP3 hydrologic model and projected under the ECHAM GCM A2 and B2 scenarios were used to predict groundwater recharge rates in the Huai Khamrian catchment in Northeast Thailand, yielding values of 253, 351, and 329 mm/year, respectively [8]. While these estimations exceed our conservative estimates of less than 170 mm/year in Northeast Thailand (Figure 4), they confirm that recharge rates in this region are positively correlated to rainfall, in agreement with Equation (5). The ratios (recharge/rainfall) obtained with the HELP3 model in the Huai Khamrian catchment (around 16%) are well aligned with our estimations mapped in Figure 6, suggesting that rainfall values used by [8] are greater than those in Aphrodite product, used in Equation (5). In Northern Thailand, groundwater recharge rates corresponding to different land uses were modeled in a 6500 km2 catchment with the WetSpass model [50]. Resulting annual recharge rates averaged 360 mm/year, mostly influenced by rainfall and evapotranspiration. In Southeast Vietnam, measurements from 10 monitored wells were used to infer groundwater recharge using finite difference methods [10]. Estimated recharge rates varied between 307 and 325 mm/year, slightly below our estimations in this part of Vietnam (500 mm/year). Similar consistency was observed in Northern Vietnam where our estimates (315 mm/year) were moderately exceeded by a mean rate of 477 mm/year derived from the rainfall infiltration breakthrough model calibrated with measurements of rainfall and groundwater levels [9]. In the Day river sub-basin of the Red River in Northern Vietnam, Van der Wolf [51] calibrated the SWAT model using hydro-meteorological observations and detailed maps of land uses, topography and soils. The SCS curve number method was used to model surface runoff and to infer infiltration rates. The resulting recharge rates averaged 248 mm/year, ranging between 37 and 601 mm/year, in agreement with our results (213–318 mm/year) for this area. Broader-scale groundwater recharge assessments was performed over 15,000 km2 in central Cambodia [52], yielding 448 mm/year from the SCS runoff curve method, aligned with QB estim (464 mm/year) and slightly greater than QB pred (278–357 mm/year) in this area. In Northwest Cambodia, groundwater recharge rates were estimated over 3375 km2 of sandstones from Upper Triassic to Lower Cretaceous, using the water-table fluctuation method and the stable isotopes analysis from 12 piezometers [53]. Recharge rates of 10 to 70 mm/year, lower than our estimations in this area (200 mm/year), were explained by clayey soils overlying sandstone, whose presence can highly vary at the scale of few tens of meters. Similar low estimates (20 mm/year) were derived from the groundwater flow model MODFLOW in Southeast Cambodia, much lower than our estimations in this location (230 mm/year), and attributed to the presence of a surficial clay aquitard [54].
5.3. Limitations of the Study
The comparison of our results with previous studies undertaken in the LMB (Section 5.2) has highlighted an overall general agreement: absolute relative differences between these previous local assessments and our recharge rates in these locations are yielding an average of 32% excluding the two case studies in North and Southeast Cambodia where this percentage exceeds 100 [53,54]. These higher discrepancies likely result from two main factors: (i) the presence of local clay deposits in the surveyed sites; (ii) the sparse network of river gauging stations in Cambodia not monitoring these specific sites, thus not allowing our model to capture this sub-regional recharge constraint. Nonetheless, the differences pointed out in this comparison could also originate from inaccuracies in the reported studies that cannot be readily addressed.
Two counteracting processes can influence the relationship between the ANE values of the predicted recharge rates and catchment size (Figure 8b). ANE of low flow models is usually lower in larger catchments due to greater space-time aggregation of runoff processes [38]. However, in larger catchments, specific baseflow (mm/year) tends to increase because of increased seepage [55]. Other scaling issues include groundwater lateral fluxes at the margin of the studied catchments, which cannot be accounted in a vertical analysis. These trends possibly explain the nonlinear relationship between ANE and the catchment drainage areas (Figure 8b).
Although the underlying physical processes associated to the geographic coordinates could not be ascertained, their inclusions as explanatory variables significantly improves the predictive power of Equation (5) and the accuracy of the groundwater recharge map in Figure 4. This map gives a reasonably reliable picture of the regional variations in groundwater recharge and their main controlling factors, namely annual rainfall and standard evapotranspiration.
5.4. Groundwater Potential for Irrigation
The recharge rates mapped in Figure 4 can help assess potential groundwater resources available for irrigation and other purposes. Groundwater is a largely untapped resource for agricultural development in the LMB and particularly in Laos where groundwater irrigation in 2010 represented just 0.1% of the total irrigated area in the country [2]. However, in areas remote from reliable surface water supplies, farmers are increasingly resorting to this resource to irrigate high-value crops [4,56]. Although there is considerable scope for extending groundwater-fed irrigations schemes, setting an upper limit can help preserve groundwater resources and maintain their eco-systemic functionalities. Indeed, over-abstraction depletes water tables leading to endogenic contamination (e.g., salinization on the Khorat Plateau) and groundwater shortages. Due to the continuum between surface and groundwater resources, particular attention must be paid to abnormally low baseflow threatening downstream ecosystems and other downstream water uses, influenced by aquifer levels in upstream areas. While even moderate groundwater extraction will systematically impact water table levels, it is useful to assess a tolerance threshold under which the socio-economic benefits derived from groundwater use outweigh the costs.
We assessed a first-order approximation of an upper limit of irrigable area using a simple groundwater balance [57] applied to two regions of the LMB exhibiting high potential for irrigation development: the Vientiane Plain in Laos and Northeast Thailand. These two regions present similarly flat topography, limited surface water supply during the dry season, and good road connections to local markets. Median groundwater recharge rates yield 150 mm/year in Northeast Thailand and 350 mm/year in the Vientiane Plain (Figure 4). Referring to the typical crops grown in the region (e.g., rice, sugar cane, vegetables), a conservative (i.e., higher estimate) crop water demand for one cycle in the dry season would amounts about 1000 mm/year according to FAO [58]. Assuming that half of the annual ground recharge rate should be reserved to service other needs (environment, domestic consumptions, industries, livestock), the percentage of irrigable area I% can be estimated as follows: I% = 0.5 × QB/1000 [57]. In Northeast Thailand, I% = 7.5%. This percentage area is equivalent to the fraction of agricultural land actually irrigated with surface water in this region [59], suggesting that irrigation could potentially be doubled by improving groundwater access. However, any change in the local groundwater balance can have detrimental effects locally (e.g., increased groundwater salinity), and downstream (e.g., altered water uses and ecosystems). In the Vientiane Plain, I% = 17.5% while the current percentage area of irrigated land in the Vientiane Prefecture, which largely covers the southern boundary of the Vientiane Plain, is around 10% (unpublished sources from Department of Irrigation, Ministry of Agriculture and Forestry, Laos). This figure, although conservative, demonstrates the considerable groundwater potential for developing irrigation, albeit with numerous technical and non-technical issues which severely constrain development [60].
6. Conclusions
Based on estimations of baseflow derived from the local-minimum filtering method, a regional regression model was developed to map the spatial distribution of groundwater recharge rates in the LMB. Results indicate that spatial variations in groundwater recharge are predominantly controlled by the climate (rainfall and evapotranspiration) at the scale of the LMB. While this study confirms that large areas exist for agricultural groundwater development, the proposed map provides a simple way to assess the likely limit of sustainable groundwater-fed irrigation, useful for broad-scale water resources planning.
Compared to regional regression models developed in other parts of the world, the power-law model that we developed to predict groundwater recharge rates performs reasonably well. Recharge estimates compare favorably with estimates from the few other local studies that used different recharge assessment approaches, though with greater inaccuracies in some instances, due to local-scale heterogeneities in soils and geology. While extensive field measurements of biophysical variables across the LMB will help to improve the performance and physical basis of the power-law model presented in this paper, further local-scale analyses are required for more detailed assessments and policy development.
Acknowledgments
This work was supported by the Australian Centre for International Agricultural Research (ACIAR) under the project LWR/2010/81: Enhancing the resilience and productivity of rain-fed dominated systems in Lao PDR through sustainable groundwater use. This project also contributed to the CGIAR Research Program on Water, Land and Ecosystems (WLE). The authors thank the Mekong River Commission for the provision of flow data, the land-cover map and the soil data, the project members of APHRODITE’s Water Resources for the provision of the rainfall database, and USGS HydroSHEDS for the provision of the digital elevation model.
Author Contributions
G.L. designed the problem, performed the multiple regression analysis and wrote the paper. S.D. and S.V. computed base flows. P.P. provided input to assess groundwater potential for irrigation. All authors reviewed the manuscript.
Conflicts of Interest
The authors declare no conflict of interest. The founding sponsors had no role in the design of the study; in the collection, analyses, or interpretation of data; in the writing of the manuscript, and in the decision to publish the results.
References
- Gleeson, T.; Wada, Y.; Bierkens, M.F.P.; van Beek, L.P.H. Water balance of global aquifers revealed by groundwater footprint. Nature 2012, 488, 197–200. [Google Scholar] [CrossRef] [PubMed]
- Siebert, S.; Burke, J.; Faures, J.M.; Frenken, K.; Hoogeveen, J.; Döll, P.; Portmann, F.T. Groundwater use for irrigation—A global inventory. Hydrol. Earth Syst. Sci. 2010, 14, 1863–1880. [Google Scholar] [CrossRef] [Green Version]
- Landon, M. Preliminary Compilation and Review of Current Information on Groundwater Monitoring and Resources in the Lower Mekong River Basin; U.S. Geological Survey Report to the Mekong River Commission: Vientiane, Laos, 2001.
- Vote, C.; Newby, J.; Phouyyavong, K.; Inthavong, T.; Eberbach, P. Trends and perceptions of rural household groundwater use and the implications for smallholder agriculture in rain-fed Southern Laos. Int. J. Water Resour Dev. 2015, 31, 558–574. [Google Scholar] [CrossRef]
- Döll, P.; Fiedler, K. Global-scale modelling of groundwater recharge. Hydrol. Earth Syst. Sci. 2008, 12, 863–885. [Google Scholar] [CrossRef]
- Gleeson, T.; Alley, W.M.; Allen, D.M.; Sophocleous, M.A.; Zhou, Y.X.; Taniguchi, M.; VanderSteen, J. Towards sustainable groundwater use: Setting long-term goals, backcasting, and managing adaptively. Groundwater 2012, 50, 19–26. [Google Scholar] [CrossRef] [PubMed]
- Wada, Y.; van Beek, L.P.H.; van Kempen, C.M.; Reckman, J.W.T.M.; Vasak, S.; Bierkens, M.F.P. Global depletion of groundwater resources. Geophys. Res. Lett. 2010, 37, L20402. [Google Scholar] [CrossRef]
- Saraphirom, P.; Wirojanagud, W.; Srisuk, K. Impact of climate change on waterlogging and salinity distributions in Huai Khamrian subwatershed, NE Thailand. Environ. Earth Sci. 2013, 70, 887–900. [Google Scholar] [CrossRef]
- Rõi, N.D. Estimation of groundwater recharge of the Holocene aquifer from rainfall by RIB method for Hưng Yên Province. VNU J. Sci. Earth Environ. Sci. 2014, 30, 49–63. [Google Scholar]
- Vinh, C.T.; Khuyen, N.M.; Hieu, N.H.; Long, D.V.; Bach, N.T.; Van, T.T.T. Assessment of Groundwater Recharge from Rainfall in the Plain of Cai Phan Rang, Vietnam. J. Environ. Sci. Eng. 2014, 3, 141–149. [Google Scholar]
- Scanlon, B.R.; Healy, R.W.; Cook, P.G. Choosing appropriate techniques for quantifying groundwater recharge. Hydrogeol. J. 2002, 10, 18–39. [Google Scholar] [CrossRef]
- Von Freyberg, J.; Moeck, C.; Schirmer, M. Estimation of groundwater recharge and drought severity with varying model complexity. J. Hydrol. 2015, 527, 844–857. [Google Scholar] [CrossRef]
- Mekong River Commission (MRC). Overview of the Hydrology of the Mekong River Basin; Mekong River Commission (MRC): Vientiane, Laos, 2005. [Google Scholar]
- Halford, K.J.; Mayer, G.C. Problems associated with estimating ground water discharge and recharge from stream discharge records. Groundwater 2000, 38, 331–342. [Google Scholar] [CrossRef]
- Nathan, R.J.; McMahon, T.A. Evaluation of automated techniques for base flow and recession analyses. Water Resour. Res. 1990, 26, 1465–1473. [Google Scholar] [CrossRef]
- Price, K. Effects of watershed topography, soils, land use, and climate on baseflow hydrology in humid regions: A review. Prog. Phys. Geol. 2011, 35, 465–492. [Google Scholar] [CrossRef]
- Mekong River Commission (MRC). State of the Basin Report; Mekong River Commission (MRC): Vientiane, Laos, 2010. [Google Scholar]
- Johnson, J.H. Preliminary Appraisal of the Hydrogeology of the Lower Mekong Basin; Interim Mekong Committee: Vientiane, Laos, 1986; p. 147. [Google Scholar]
- Charuratna, A.; Phu, T.H. Hydrogeological Map of Lower Mekong Basin. 1:1,000,000; Mekong Secretariat, Interim Committee for Coordination of Investigations of the lower Mekong Basin: Bangkok, Thailand, 1992. [Google Scholar]
- Japan International Cooperation Agency (JICA). Basic Design Study Report on the Project for Groundwater Development in the Vientiane Province in Lao PDR; Japan International Cooperation Agency (JICA): Tokyo, Japan, 1993; p. 199.
- Perttu, N.; Wattanasen, K.; Phommasone, K.; Elming, S.A. Characterization of aquifers in the Vientiane Basin, Laos, using magnetic resonance sounding and vertical electrical sounding. J. Appl. Geophys. 2011, 73, 207–220. [Google Scholar] [CrossRef]
- Lacombe, G.; McCartney, M. Evaluating the Flow Regulating Effects of Ecosystems in the Mekong and Volta River Basins; IWMI Research Report 166; International Water Management Institute: Colombo, Sri Lanka, 2016; p. 40. [Google Scholar]
- Yermoli, C. Draft User Manual. Hydropower Project Database; Basin Development Plan Phase 2; Mekong River Commission: Vientiane, Laos, 2008; p. 27. [Google Scholar]
- WLE. Dams in the Mekong River Basin: Commissioned, under Construction and Planned Dams in April 2016; CGIAR Research Program on Water, Land and Ecosystems-Greater Mekong (WLE): Vientiane, Laos, 2016. [Google Scholar]
- Pettyjohn, W.A.; Henning, R. Preliminary Estimate of Groundwater Recharge Rates, Related Streamflow and Water Quality in Ohio; Completion Report Number 552; University Water Resources Center: Columbus, OH, USA, 1979. [Google Scholar]
- HydroOffice. BFI+ 3.0. User’s Manual by Milos Gregor; HydroOffice: Bratislava, Slovakia, 2010. [Google Scholar]
- Milnes, E.; Negro, F.; Perrochet, P. Vietnam to Produce More Coffee with Less Water—Towards a Reduction of the Blue Water Footprint in Coffee Production. Hydrogeological Study of the Basaltic Plateau in Dak Lak Province, Vietnam; Université de Neuchâtel: Neuchâtel, Switzerland, 2015. [Google Scholar]
- Linsley, R.K.; Kohler, M.A.; Paulhus, J.L.H. Hydrology for Engineers, 2nd ed.; McGraw-Hill Book Company: New York, NY, USA, 1975. [Google Scholar]
- Eckhardt, K. A comparison of baseflow indices, which were calculated with seven different baseflow separation methods. J. Hydrol. 2008, 352, 168–173. [Google Scholar] [CrossRef]
- Risser, D.W.; Gburek, W.J.; Folmar, G.J. Comparison of Methods for Estimating Ground-Water Recharge and Base Flow at a Small Watershed Underlain by Fractured Bedrock in the Eastern United States; US Geological Survey Scientific Investigations Report 2005–5038; U.S. Geological Survey: Reston, VA, USA, 2005.
- Vogel, R.M.; Wilson, I.; Daly, C. Regional regression models of annual streamflow for the United States. J. Irrig. Drain. Eng. 1999, 125, 148–157. [Google Scholar] [CrossRef]
- Homa, E.S.; Brown, C.; McGarigal, K.; Compton, B.W.; Jackson, S.D. Estimating hydrologic alteration from basin characteristics in Massachusetts. J. Hydrol. 2013, 503, 196–208. [Google Scholar] [CrossRef]
- Tasker, G.D. Hydrologic regression with weighted least squares. Water Resour. Res. 1980, 16, 1107–1113. [Google Scholar] [CrossRef]
- Cook, R.D.; Weisberg, S. Residuals and Influence in Regression; Chapman and Hall: New York, NY, USA, 1982. [Google Scholar]
- Helsel, D.R.; Hirsch, R.M. Statistical Methods in Water Resources; US Geological Survey: Reston, VA, USA, 2002.
- Yatagai, A.; Kamiguchi, K.; Arakawa, O.; Hamada, A.; Yasutomi, N.; Kitoh, A. APHRODITE: Constructing a long-term daily gridded precipitation dataset for Asia based on a dense network of rain gauges. Bull. Am. Meteorol. Soc. 2012, 93, 1401–1415. [Google Scholar] [CrossRef]
- Lauri, H.; Räsänen, T.A.; Kummu, M. Using reanalysis and remotely sensed temperature and precipitation data for hydrological modeling in monsoon climate: Mekong river case study. J. Hydrometeorol. 2014, 15, 1532–1545. [Google Scholar] [CrossRef]
- Harris, I.; Jones, P.D.; Osborn, T.J.; Lister, D.H. Updated high-resolution grids of monthly climatic observations—The CRUTS3.10 Dataset. Int. J. Climatol. 2014, 34, 623–642. [Google Scholar] [CrossRef] [Green Version]
- Ekström, M.; Jones, P.D.; Fowler, H.J.; Lenderink, G.; Buishand, T.A.; Conway, D. Regional climate model data used within the SWURVE project 1: Projected changes in seasonal patterns and estimation of PET. Hydrol. Earth Syst. Sci. 2007, 11, 1069–1083. [Google Scholar] [CrossRef]
- Mu, Q.; Zhao, M.; Running, S.W. Improvements to a MODIS global terrestrial evapotranspiration algorithm. Remote Sens. Environ. 2011, 115, 1781–1800. [Google Scholar] [CrossRef]
- Lehner, B.; Verdin, K.; Jarvis, A. HydroSHEDS Technical Documentation; World Wildlife Fund US: Washington, DC, USA, 2006. [Google Scholar]
- MRC. Planning Atlas of the Lower Mekong River Basin. Basin Development Plan Programme; Mekong River Commission (MRC): Phnom-Penh, Cambodia, 2011. [Google Scholar]
- Lacombe, G.; Douangsavanh, S.; Vogel, R.M.; McCartney, M.; Chemin, Y.; Rebelo, L.M.; Sotoukee, T. Multivariate power-law models for streamflow prediction in the Mekong Basin. J. Hydrol. Reg. Stud. 2014, 2, 35–48. [Google Scholar] [CrossRef]
- Bruijnzeel, L.A. Hydrological functions of tropical forests: Not seeing the soil for the trees? Agric. Ecosyst. Environ. 2004, 104, 185–228. [Google Scholar]
- Salinas, J.L.; Laaha, G.; Rogger, M.; Parajka, J.; Viglione, A.; Sivapalan, M.; Blöschl, G. Comparative assessment of predictions in ungauged basins—Part 2. Flood and low flow studies. Hydrol. Earth Syst. Sci. 2013, 17, 2637–2652. [Google Scholar] [CrossRef]
- Nolan, B.T.; Healy, R.W.; Taber, P.E.; Perkins, K.; Hitt, K.J.; Wolock, D.M. Factors influencing ground-water recharge in the eastern United States. J. Hydrol. 2007, 332, 187–205. [Google Scholar] [CrossRef]
- Kim, J.H.; Jackson, R.B. A global analysis of groundwater recharge for vegetation, climate, and soils. Vadose Zone J. 2012, 11. [Google Scholar] [CrossRef]
- Zomlot, Z.; Verbeiren, B.; Huysmans, M.; Batelaan, O. Spatial distribution of groundwater recharge and base flow: Assessment of controlling factors. J. Hydrol. Reg. Stud. 2015, 4, 349–368. [Google Scholar] [CrossRef]
- Kim, H.W.; Hwang, K.; Mu, Q.; Lee, S.O.; Choi, M. Validation of MODIS 16 Global Terrestrial Evapotranspiration Products in Various Climates and Land Cover Types in Asia. KSCE J. Civ. Eng. 2012, 16, 229–238. [Google Scholar] [CrossRef]
- Kornkul, J.; Chotpantarat, S. Distributed Groundwater Recharge Estimation in Phrae Province Using WetSpass. In Proceedings of the Second Environment Asia International Conference on “Human Vulnerability and Global Environmental Change”, Chonburi, Thailand, 15–17 May 2013; pp. 553–565. [Google Scholar]
- Van der Wolf, M. Effects of Land Use Change on Groundwater Recharge. A case Study in the Day River Basin, Vietnam. Master’s Thesis, Utrecht University, Utrecht, The Netherlands, 2015. [Google Scholar]
- JICA. The Study on Groundwater Development in Central Cambodia; Interim Report of the Japan International Cooperation Agency (JICA); Kokusai Kogyo Co. Ltd.: Tokyo, Japan, 2001. [Google Scholar]
- Vouillamoz, J.M.; Valois, R.; Lun, S.; Caron, D.; Arnout, L. Can groundwater secure drinking-water supply and supplementary irrigation in new settlements of North-West Cambodia? Hydrogeol. J. 2016, 24, 195–209. [Google Scholar] [CrossRef]
- Erban, L.E.; Gorelick, S.M. Closing the irrigation deficit in Cambodia: Implications for transboundary impacts on groundwater and Mekong River flow. J. Hydrol. 2016, 535, 85–92. [Google Scholar] [CrossRef]
- Pilgrim, D.H.; Cordery, I.; Baron, B.C. Effects of catchment size on runoff relationships. J. Hydrol. 1982, 58, 205–221. [Google Scholar] [CrossRef]
- Suhardiman, D.; Giordano, M.; Leebouapao, L.; Keovilignavong, O. Farmers’ strategies as building block for rethinking sustainable intensification. Agric. Hum. Values 2016, 33, 563–574. [Google Scholar] [CrossRef]
- Pavelic, P.; Smakhtin, V.; Favreau, G.; Villholth, K. Water-balance approach for assessing potential for smallholder groundwater irrigation in Sub-Saharan Africa. Water SA 2012, 38, 399–406. [Google Scholar] [CrossRef]
- Brouwer, C.; Heibloem, M. Irrigation Water Needs Irrigation Water Management Training Manual 3; Food and Agriculture Organization (FAO): Rome, Italy, 1986. [Google Scholar]
- Agricultural Statistics of Thailand 2011. Office of Agricultural Economics (OAE). Available online: http://www.oae.go.th (accessed on 9 July 2016).
- Pavelic, P.; Xayviliya, O.; Ongkeo, O. Pathways for effective groundwater governance in the least developed country context of the Lao PDR. Water Int. 2014, 39, 469–485. [Google Scholar] [CrossRef]
Figure 1.
Topography of the Lower Mekong Basin. Elevations are derived from HydroSHEDS.

Figure 2.
Geology of the Lower Mekong Basin, adapted from [19].
Figure 2.
Geology of the Lower Mekong Basin, adapted from [19].

Figure 3.
Gauged sub-catchments of the Lower Mekong Basin.

Figure 4.
Median annual groundwater recharge in the Lower Mekong Basin. Circles are located in the centroid of the gauged catchments and their corresponding values are estimated with the local minimum method (QB estim). Un-gauged values in square grid cells are predicted by multiple log-linear regressions (QB pred). The graduated color-scale indicates the values for both QB estim and QB pred.

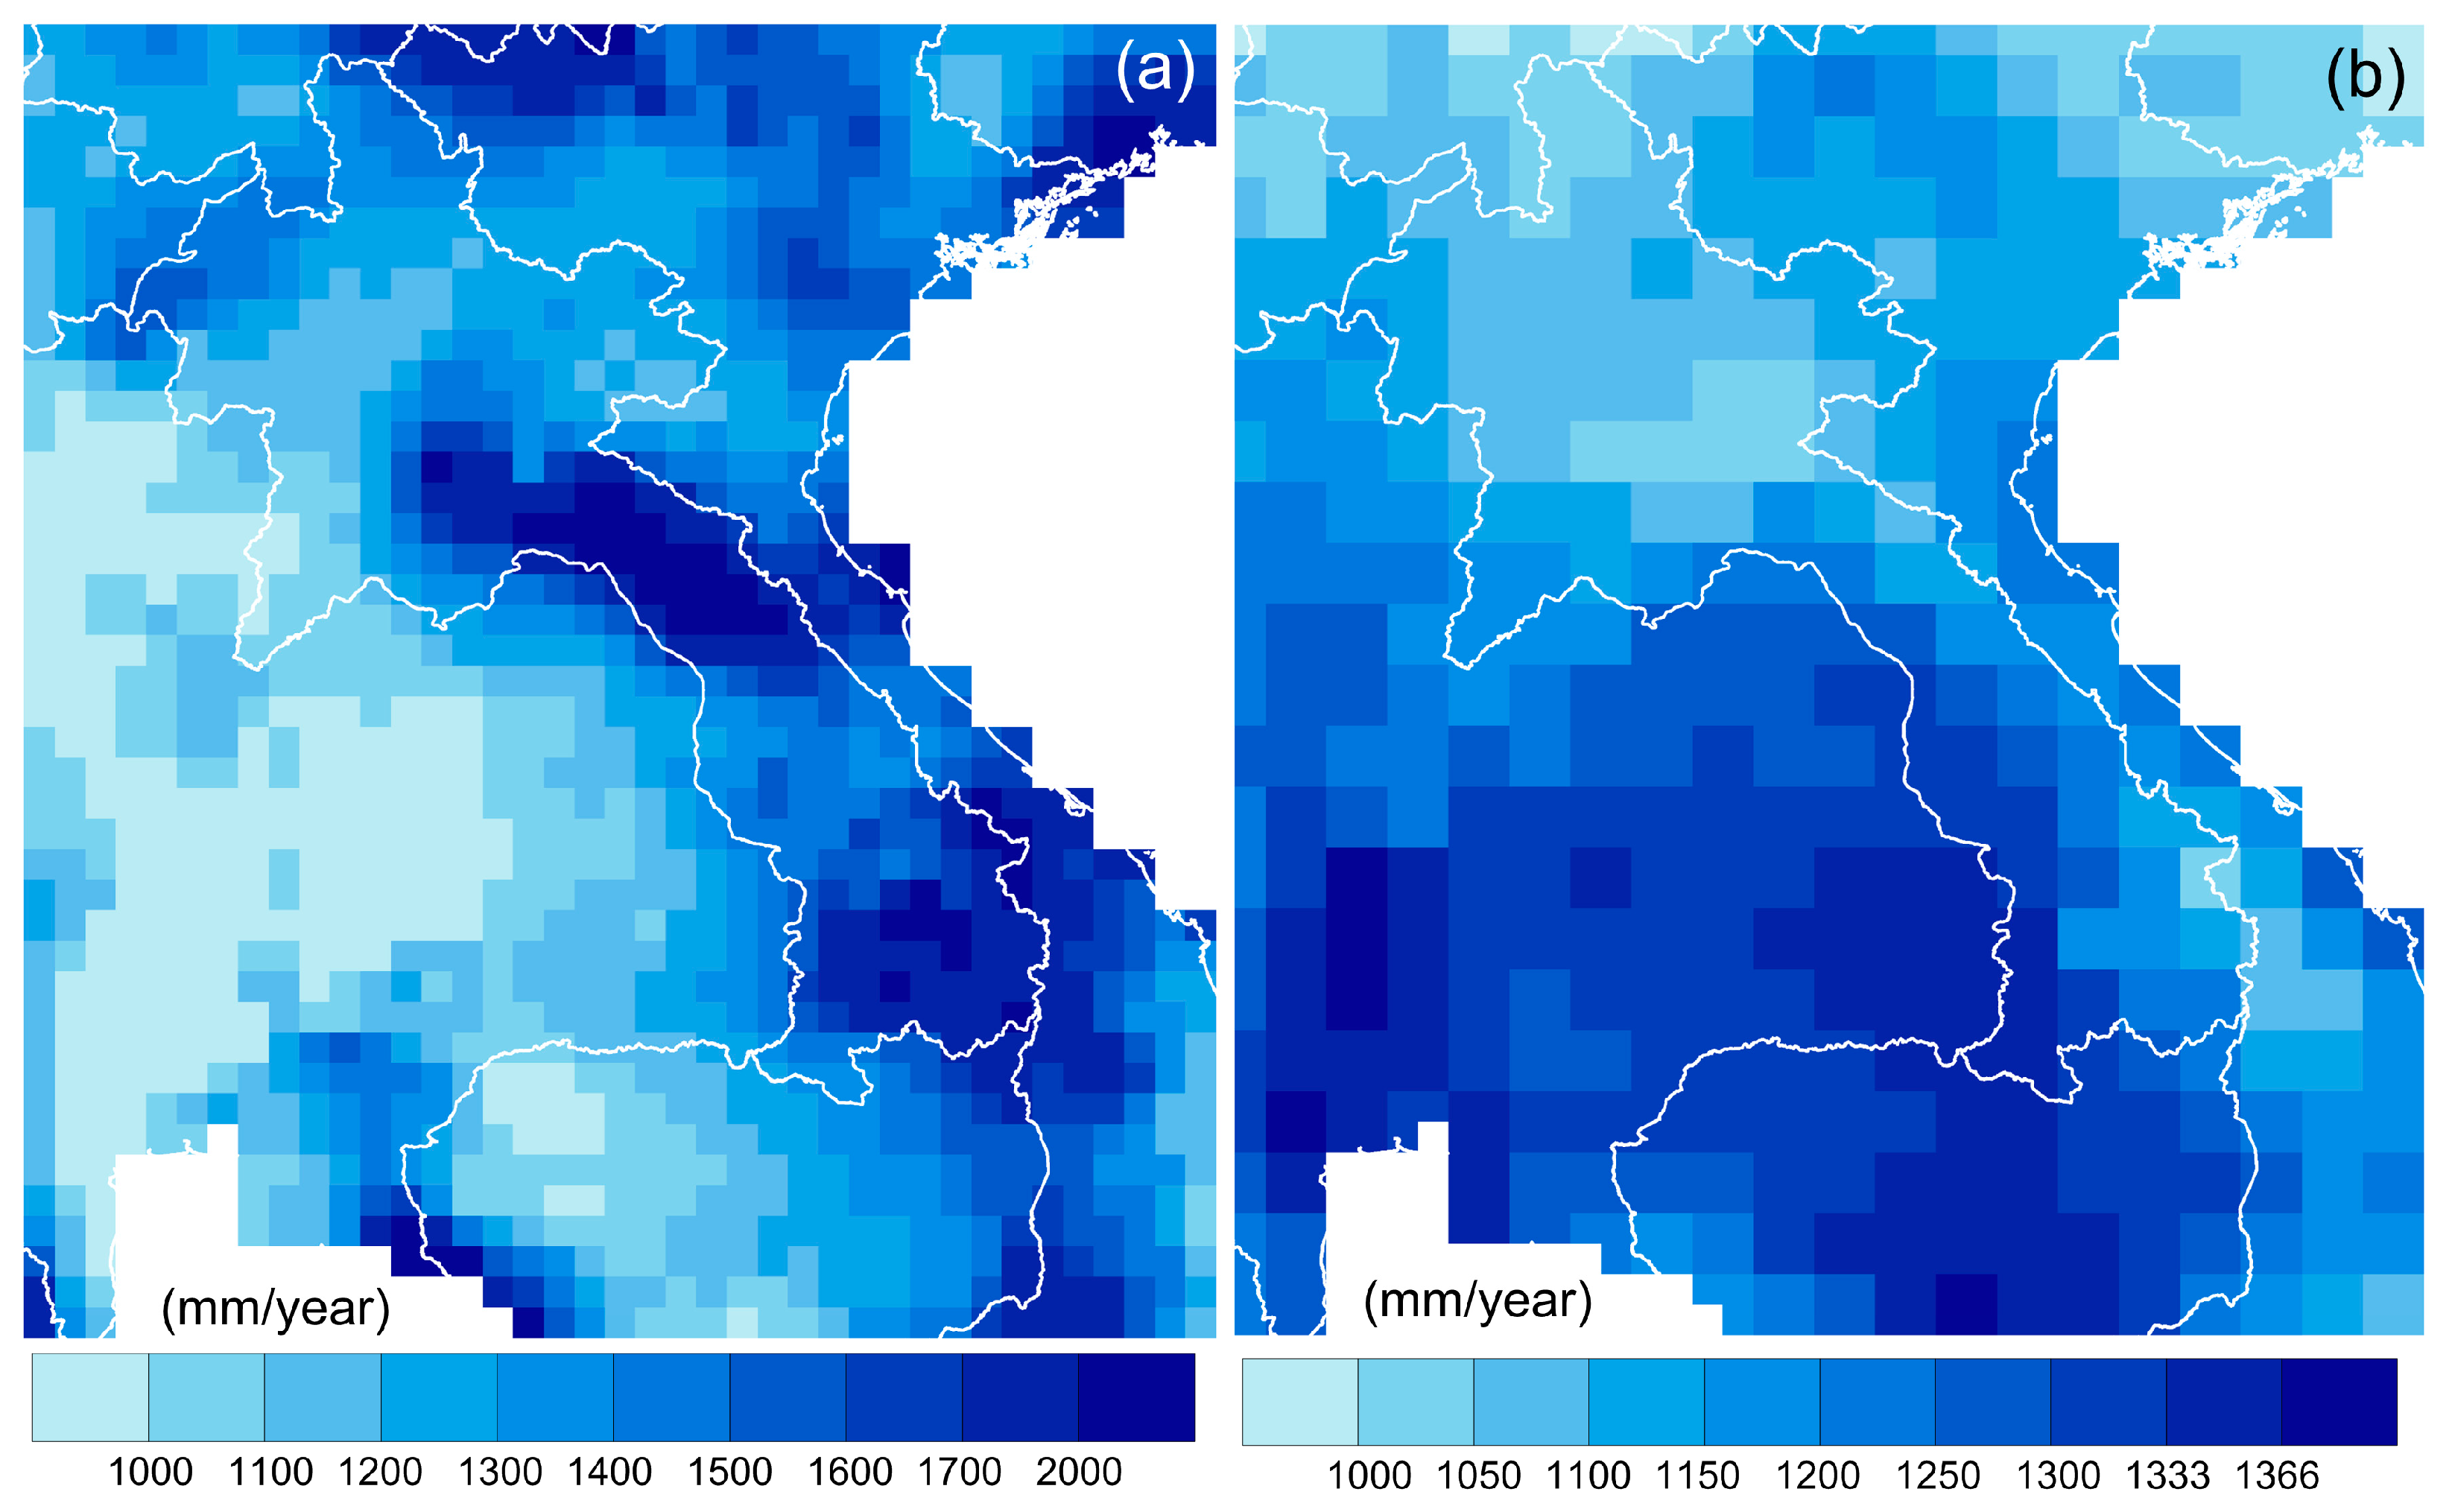
Figure 5.
Spatial variability of mean climate variables across the Lower Mekong Basin. (a) Median annual rainfall derived from Aphrodite [36]. (b) Standard evapotranspiration derived from CRU [38].

Figure 6.
Ratio between estimated median annual recharge (QB estim) and median annual rainfall (Rain) in the Lower Mekong Basin.
Figure 6.
Ratio between estimated median annual recharge (QB estim) and median annual rainfall (Rain) in the Lower Mekong Basin.

Figure 7.
Comparison of observed (QB estim j) and predicted (QB pred j) specific median annual baseflow in each gauged catchment j.
Figure 7.
Comparison of observed (QB estim j) and predicted (QB pred j) specific median annual baseflow in each gauged catchment j.

Figure 8.
Absolute normalized error (ANE) of predicting median baseflow as a function of aridity index (a) and drainage area (b). Boxes: 40–60% quantiles; whiskers: 20–80% quantiles; white circles: medians.
Figure 8.
Absolute normalized error (ANE) of predicting median baseflow as a function of aridity index (a) and drainage area (b). Boxes: 40–60% quantiles; whiskers: 20–80% quantiles; white circles: medians.


Table 1.
Candidate explanatory variables considered in the multiple regression analyses: Variation ranges across the 65 catchments.
Table 1.
Candidate explanatory variables considered in the multiple regression analyses: Variation ranges across the 65 catchments.
| Variables | Unit | Minimum | Median | Maximum |
|---|---|---|---|---|
| Climate | ||||
| Median annual rainfall | mm/year | 880 | 1416 | 2093 |
| Median annual temperature | °C | 21.0 | 24.2 | 27.4 |
| Median annual standard evapotranspiration | mm/year | 1017 | 1168 | 1338 |
| Median annual actual evapotranspiration | mm/year | 818 | 1280 | 1374 |
| Geomorphology | ||||
| Drainage area | km2 | 207 | 3278 | 106,748 |
| Drainage density | km−1 | 0.09 | 0.13 | 0.17 |
| Mean elevation | m | 84 | 562 | 1168 |
| Mean slope | % | 2 | 15 | 32 |
| Perimeter | km | 76 | 401 | 2090 |
| Geographic coordinates of catchment centroid | ||||
| Latitude | decimal degree | 12.33 | 16.70 | 20.70 |
| Longitude | 99.35 | 104.03 | 108.00 | |
| Soil | ||||
| Top-soil texture | 4-unit * scale | 0 | 2.08 | 2.91 |
| Depth | 0 | 3.07 | 4.00 | |
| Land cover | ||||
| Forest | % area | 3 | 75 | 98 |
| Rain-fed lowland paddy | 0 | 4 | 77 | |
* See Table 2 for the description of the 4-unit scale.
Table 2.
The 4-unit scale of the two soil characteristics.
| Soil Depth | Top Soil Texture | 4-Unit Scale |
|---|---|---|
| <30 cm | Coarse | 1 |
| 30–50 cm | Medium | 2 |
| 30–50 cm with gravel | Fine | 3 |
| >50 cm | Peat | 4 |
© 2017 by the authors. Licensee MDPI, Basel, Switzerland. This article is an open access article distributed under the terms and conditions of the Creative Commons Attribution (CC BY) license (http://creativecommons.org/licenses/by/4.0/).
Share and Cite
MDPI and ACS Style
Lacombe, G.; Douangsavanh, S.; Vongphachanh, S.; Pavelic, P. Regional Assessment of Groundwater Recharge in the Lower Mekong Basin. Hydrology 2017, 4, 60. https://doi.org/10.3390/hydrology4040060
AMA Style
Lacombe G, Douangsavanh S, Vongphachanh S, Pavelic P. Regional Assessment of Groundwater Recharge in the Lower Mekong Basin. Hydrology. 2017; 4(4):60. https://doi.org/10.3390/hydrology4040060
Chicago/Turabian StyleLacombe, Guillaume, Somphasith Douangsavanh, Sinxay Vongphachanh, and Paul Pavelic. 2017. "Regional Assessment of Groundwater Recharge in the Lower Mekong Basin" Hydrology 4, no. 4: 60. https://doi.org/10.3390/hydrology4040060
Note that from the first issue of 2016, this journal uses article numbers instead of page numbers. See further details here.