Article

The Effect of Harvest Date on Temporal Cannabinoid and Biomass Production in the Floral Hemp (Cannabis sativa L.) Cultivars BaOx and Cherry Wine

1
Department of Crop and Soil Sciences, North Carolina State University, Raleigh, NC 27695, USA
2
Department of Civil and Environmental Engineering, Utah State University, Logan, UT 84322, USA
3
Plants for Human Health Institute, North Carolina State University, Kannapolis, NC 28081, USA
4
Department of Plant and Microbial Biology, North Carolina State University, Raleigh, NC 27695, USA
*
Author to whom correspondence should be addressed.
Horticulturae 2022, 8(10), 959; https://doi.org/10.3390/horticulturae8100959
Submission received: 21 August 2022 / Revised: 13 October 2022 / Accepted: 14 October 2022 / Published: 17 October 2022
(This article belongs to the Section Medicinals, Herbs, and Specialty Crops)

Abstract

:
The objectives of this study were to model the temporal accumulation of cannabidiol (CBD) and tetrahydrocannabinol (THC) in field-grown floral hemp in North Carolina and establish harvest timing recommendations to minimize non-compliant crop production. Field trials were conducted in 2020 and 2021 with BaOx and Cherry Wine cultivars. Harvest events started two weeks after floral initiation and occurred every two weeks for 12 weeks. Per-plant threshed biomass accumulation exhibited a linear plateau trend. The best fit model for temporal accumulation of THC was a beta growth curve. As harvest date was delayed, total THC concentrations increased until concentrations reached their maximum, then decreased as plants approached senescence. Logistic regression was the best fit model for temporal accumulation of CBD. CBD concentrations increased with later harvest dates. Unlike THC concentrations, there was no decline in total CBD concentrations. To minimize risk, growers should test their crop as early as possible within the USDA’s 30-day compliance window. We observed ‘BaOx’ and ‘Cherry Wine’ exceeding the compliance threshold 50 and 41 days after flower initiation, respectively.

1. Introduction

The cultivation of Cannabis sativa L. for non-psychoactive cannabinoids has increased in recent years due to changes in legislation. With the passing of The American Agricultural Improvement Act of 2018 (2018 Farm Bill), Cannabis sativa L. plants containing less than 0.3% total tetrahydrocannabinol (THC) was classified as hemp and is federally legal to cultivate. Total THC is calculated as Δ9-THC + 0.877 × tetrahydrocannabinolic acid (THCA) and is reported on a dry weight basis. Of the approximately 125 documented cannabinoids [1], industry focus has been on cannabidiol (CBD).
Cannabis is primarily a dioecious plant. When grown for cannabinoid extraction only female plants are cultivated due to the high concentration of glandular trichomes found on the female flowers. These glandular trichomes are the site of cannabinoid biosynthesis and storage [2]. Cannabidiolic acid (CBDA), THCA, and cannabichromeneic acid (CBCA) are the three most abundant cannabinoids found in Cannabis. These acidic cannabinoids are synthesized from cannabigerolic acid (CBGA) by their respective enzymes CBDA, THCA, and CBCA synthase [3]. Acidic cannabinoids may be decarboxylated in the presence of heat or light to their respective neutral counterpart’s CBD, Δ9-THC, and cannabichromene (CBC) [3,4,5].
Cannabis can be classified into three major chemical types (chemotypes) based on cannabinoid content. Inheritance of chemotype can be modeled as a monogenic trait at one locus (the b locus) with two codominant alleles (BT & BD). Chemotype I plants produce mainly THC and are classified as marijuana; these plants are homozygous with the BT alleles. Chemotype II plants produce roughly equal amounts of THC and CBD and are heterozygous with BT/BD alleles. Chemotype III plants are typically classified as hemp and produce mostly CBD with very low amounts of THC; individuals of this chemotype are homozygous with BD alleles [6].
High CBD:THC ratios are indicative of chemotype III Cannabis. Stack et al. [7] conducted a study characterizing high cannabinoid hemp by screening 30 cultivars, the majority being chemotype III Cannabis. Out of the purely chemotype III cultivars tested, CBD:THC ratios ranged from 22.09:1 to 27.45:1 [7]. Chemotype III cultivars produce a small amount of THC which could potentially be problematic for growers since the legal THC-compliant threshold is extremely low at 0.3% total THC on a dry weight basis. Zirpel et al. [8] demonstrated that CBDA synthase (CBDAS) and THCA synthase (THCAS) are indiscriminate and produce multiple cannabinoids as a side product during the synthesis of their target product. Specifically, they demonstrated that CBDAS produces CBDA and THCA molecules at a ratio of approximately 26:1. This enzymatic promiscuity poses a significant challenge to floral hemp producers seeking to maximize profits via high CBD production while still maintaining a compliant crop (<0.3% total THC).
There have been relatively few replicated studies exploring temporal cannabinoid accumulation for high CBD yielding chemotype III cultivars. In general, the concentration of CBD and THC increase within the floral material after reproductive growth initiates; however, temporal accumulation trends may differ by cultivar [7,9,10,11]. At the onset of the legal hemp production, lacking any evidence based recommendations, farmers looked to the marijuana industry for harvest timing recommendations. Marijuana growers historically base harvest timing on trichome coloration [12]. As the plant matures, trichrome coloration transitions from clear to opaque and then amber in color with harvest occurring between the opaque and amber color transition. However, this method is highly subjective and would often result in a non-compliant crop; during the North Carolina Hemp Pilot Program, approximately 10% of all tested fields were non-compliant due to farmers utilizing this harvest timing method (Paul Adams, NCDA, personal communication).
The market value of floral hemp is determined on a percent CBD by weight basis. Farmers in this region harvest and dry entire plants, separate the leaf and floral material from the stem and sell the resultant material for CBD extraction. For growers to maximize profit and reduce risk it is crucial to have a harvest date that maximizes CBD concentration while ensuring the crop remains compliant. There is a current knowledge gap for growers regarding ideal harvest timing for floral hemp cultivated for CBD. The objectives of this study were to (1) model the temporal accumulation of CBD and THC in field-grown floral hemp in North Carolina and (2) establish harvest timing recommendations to minimize non-compliant crop production. We hypothesize that total THC concentration will exceed the compliance threshold before total CBD is maximized and that the crop will need to be harvested prematurely.

2. Materials and Methods

2.1. Experimental Design

Field trials were conducted during the 2020 and 2021 growing seasons at the Cunningham Research Station in Kinston, NC (CRS; 35.2973, −77.5739) on a Norfolk loamy sand (fine-loam, kaolinitic, thermic Type Kandiudults), and at the North Carolina Department of Agriculture & Consumer Services (NCDA&CS) Piedmont Research Station (PRS; 35.6967, −80.6227) in Salisbury, NC on a Clay Loam (Fine, kaolinitic, thermic Type Rhodic Kanhapludults).
Asexually propagated clones of the CBD hemp cultivars BaOx and Cherry Wine (Ryes Greenhouses; Broadway, NC) were used in both locations and growing seasons. Field trials were arranged in a split-plot randomized complete block design with cultivar as the main-plot and harvest date the sub-plot. Each location contained four blocks. Transplanting occurred on 1 and 2 June of each year in Salisbury and Kinston, respectively. Clones were transplanted into raised beds covered in white 1.25 mm polyethylene plastic mulch with tape (Netafim Streamline 10 mil with 30.48 cm emitter spacing 0.908 LPH) laid under the plastic. Each plot contained 20 plants with a 1.5 m in-row and between-row spacing.

2.2. Field Management

Herbicide was applied to the bare ground between rows seven days before transplanting. Herbicide applications utilized Paraquat (1.55 kg ai ha−1, Gramoxone SL 3.0; Syngenta Basel, Switzerland), Napropamide (1.68 kg ai ha−1, Devrinol 2 XT; United Phosphorus, Inc., King of Prussia, PA, USA), and Pendimethalin (0.53 kg ai/ha−1, Prowl H2O; BASF Ludwigshafen, Germany).
Season total fertilizer application was 134.5 kg N ha−1, 67 kg P ha−1, 134.5 kg K ha−1 and 1.12 kg B ha−1. Half of the nitrogen, phosphorus and all the potassium was applied and incorporated as a pre-planting application. Calcium nitrate (Yaraliva Calcinit 15.5-0-0; Yara International, Oslo, Norway) and boron (Borate 21% B; Borates Plus Inc., Apopka, FL, USA) was injected biweekly through fertigation to meet the remaining nitrogen, phosphorous and boron requirements.

2.3. Data Collection

Harvesting and data collection began when plants transitioned from vegetative to reproductive growth. We determined flower initiation when at least 50% of the plants showed visible pistillate inflorescence at the apical meristem as well as the lateral shoots. Three plants were randomly harvested within a plot starting 2 weeks after floral initiation and every two weeks after until 12 weeks after floral initiation (n = 6 harvest times). Plants were cut at the base of the stalk approximately 5 cm from the soil line. Plants were then transported to a tobacco barn where they were dried under forced air at temperatures less than 48.8 °C for five days. Once dry, the floral and leaf material was stripped from the stalk by hand and the stalk was discarded. The weight of the floral and leaf material was recorded and a representative sample was submitted for cannabinoid analysis. Approximately 50 g of the threshed material was submitted for cannabinoid analysis. A total of 48 samples per cultivar × harvest date (3 plant subsamples × 4 replicates × 2 locations × 2 years) were used to quantify cannabinoid content. Samples were analyzed for total CBD (CBD + 0.877 × CBDA) and total THC at the North Carolina State University Environmental and Agricultural Testing Services (EATS) Laboratory by using UHPLC/MS/MS analysis. The protocol for the analysis went as follows: 0.1 g of dried ground plant material was added to a 15 mL centrifuge tube with 5 mL of extraction solution consisting of 80% HPLC grade methanol and 20% HPLC grade water and was agitated for approximately 30 s with a vortex mixer. Then, 1 mL of sample extract was filtered through 0.2 μM syringe filter and loaded into an auto sampler vial. Two auto sampler vials were then prepared for the extract of each hemp sample, one at a dilution factor of 1:5 (df5) and the other at a dilution factor of 1:100 (df100). For the df5, 200 μL of sample extract and 800 μL of sample dilutant solution was added. For the df100, 10 μL of sample extract and 990 μL of sample dilutant solution was added. Sample dilutant solution consisted of 29% HPLC water with LC/MS grade formic acid, and 71% HPLC grade acetonitrile. Before the instrument analysis, a new calibration curve was made. Calibration curves were made using commercially available calibration standards containing 100 μg ml−1 of CBD, CBDA, CBN, CBG, THC, & THCA in methanol. After the calibration curve was made a quality control check sample was completed to verify recoveries were 100% ± 15% for each cannabinoid using commercial standards. Samples were analyzed in batches of 15 samples at their respective dilution factors, the column was washed, and a quality control verification was completed between each batch of samples. Analysis was finished with a liquid chromatography equipped with photodiode array detector.

2.4. Statistical Analysis

Data were plotted and inspected for outliers and treatment response trends. The nlme and nlraa packages in R ver. 4.1.2 [13] were utilized for all analyses [14,15]. In all instances, cultivar and days after flower initiation (DAFI) were treated as fixed effects, whereas environment (unique year × location combination), block nested in environment, and block × cultivar nested in the environment were treated as random effects.
Biomass, total THC, and total CBD results showed strong nonlinear trends. Biomass data showed an asymptotic/plateau trend whereas total THC and CBD showed a distinct sigmoid trend. In all cases, multiple models were fit to these data and resultant corrected Akaike Information Critera (AICc) and Bayesian Information Criteria (BIC) compared to select the best fitting model. Residual diagnostic plots were investigated, and heteroscedasticity was observed for the biomass data. The power variance structure (“varPower”) ameliorated this heterogeneity and resulted in a better fit model (lower AICc and BIC compared to original model).
A linear mixed model was employed to investigate the total THC and total CBD relationship between cultivars. A similar approach was taken to compare total potential THC (total THC + CBN) and total CBD. The inclusion of CBN when calculating total potential THC provides a more appropriate estimation of total enzymatic production of THC via CBDA synthase since CBN is the degradative product resulting from THC oxidation over time [7]. Heteroskedasticity was observed in the residual diagnostic plots for both analyses and ameliorated by employing an exponential variance function structure (“varExp”).

3. Results and Discussion

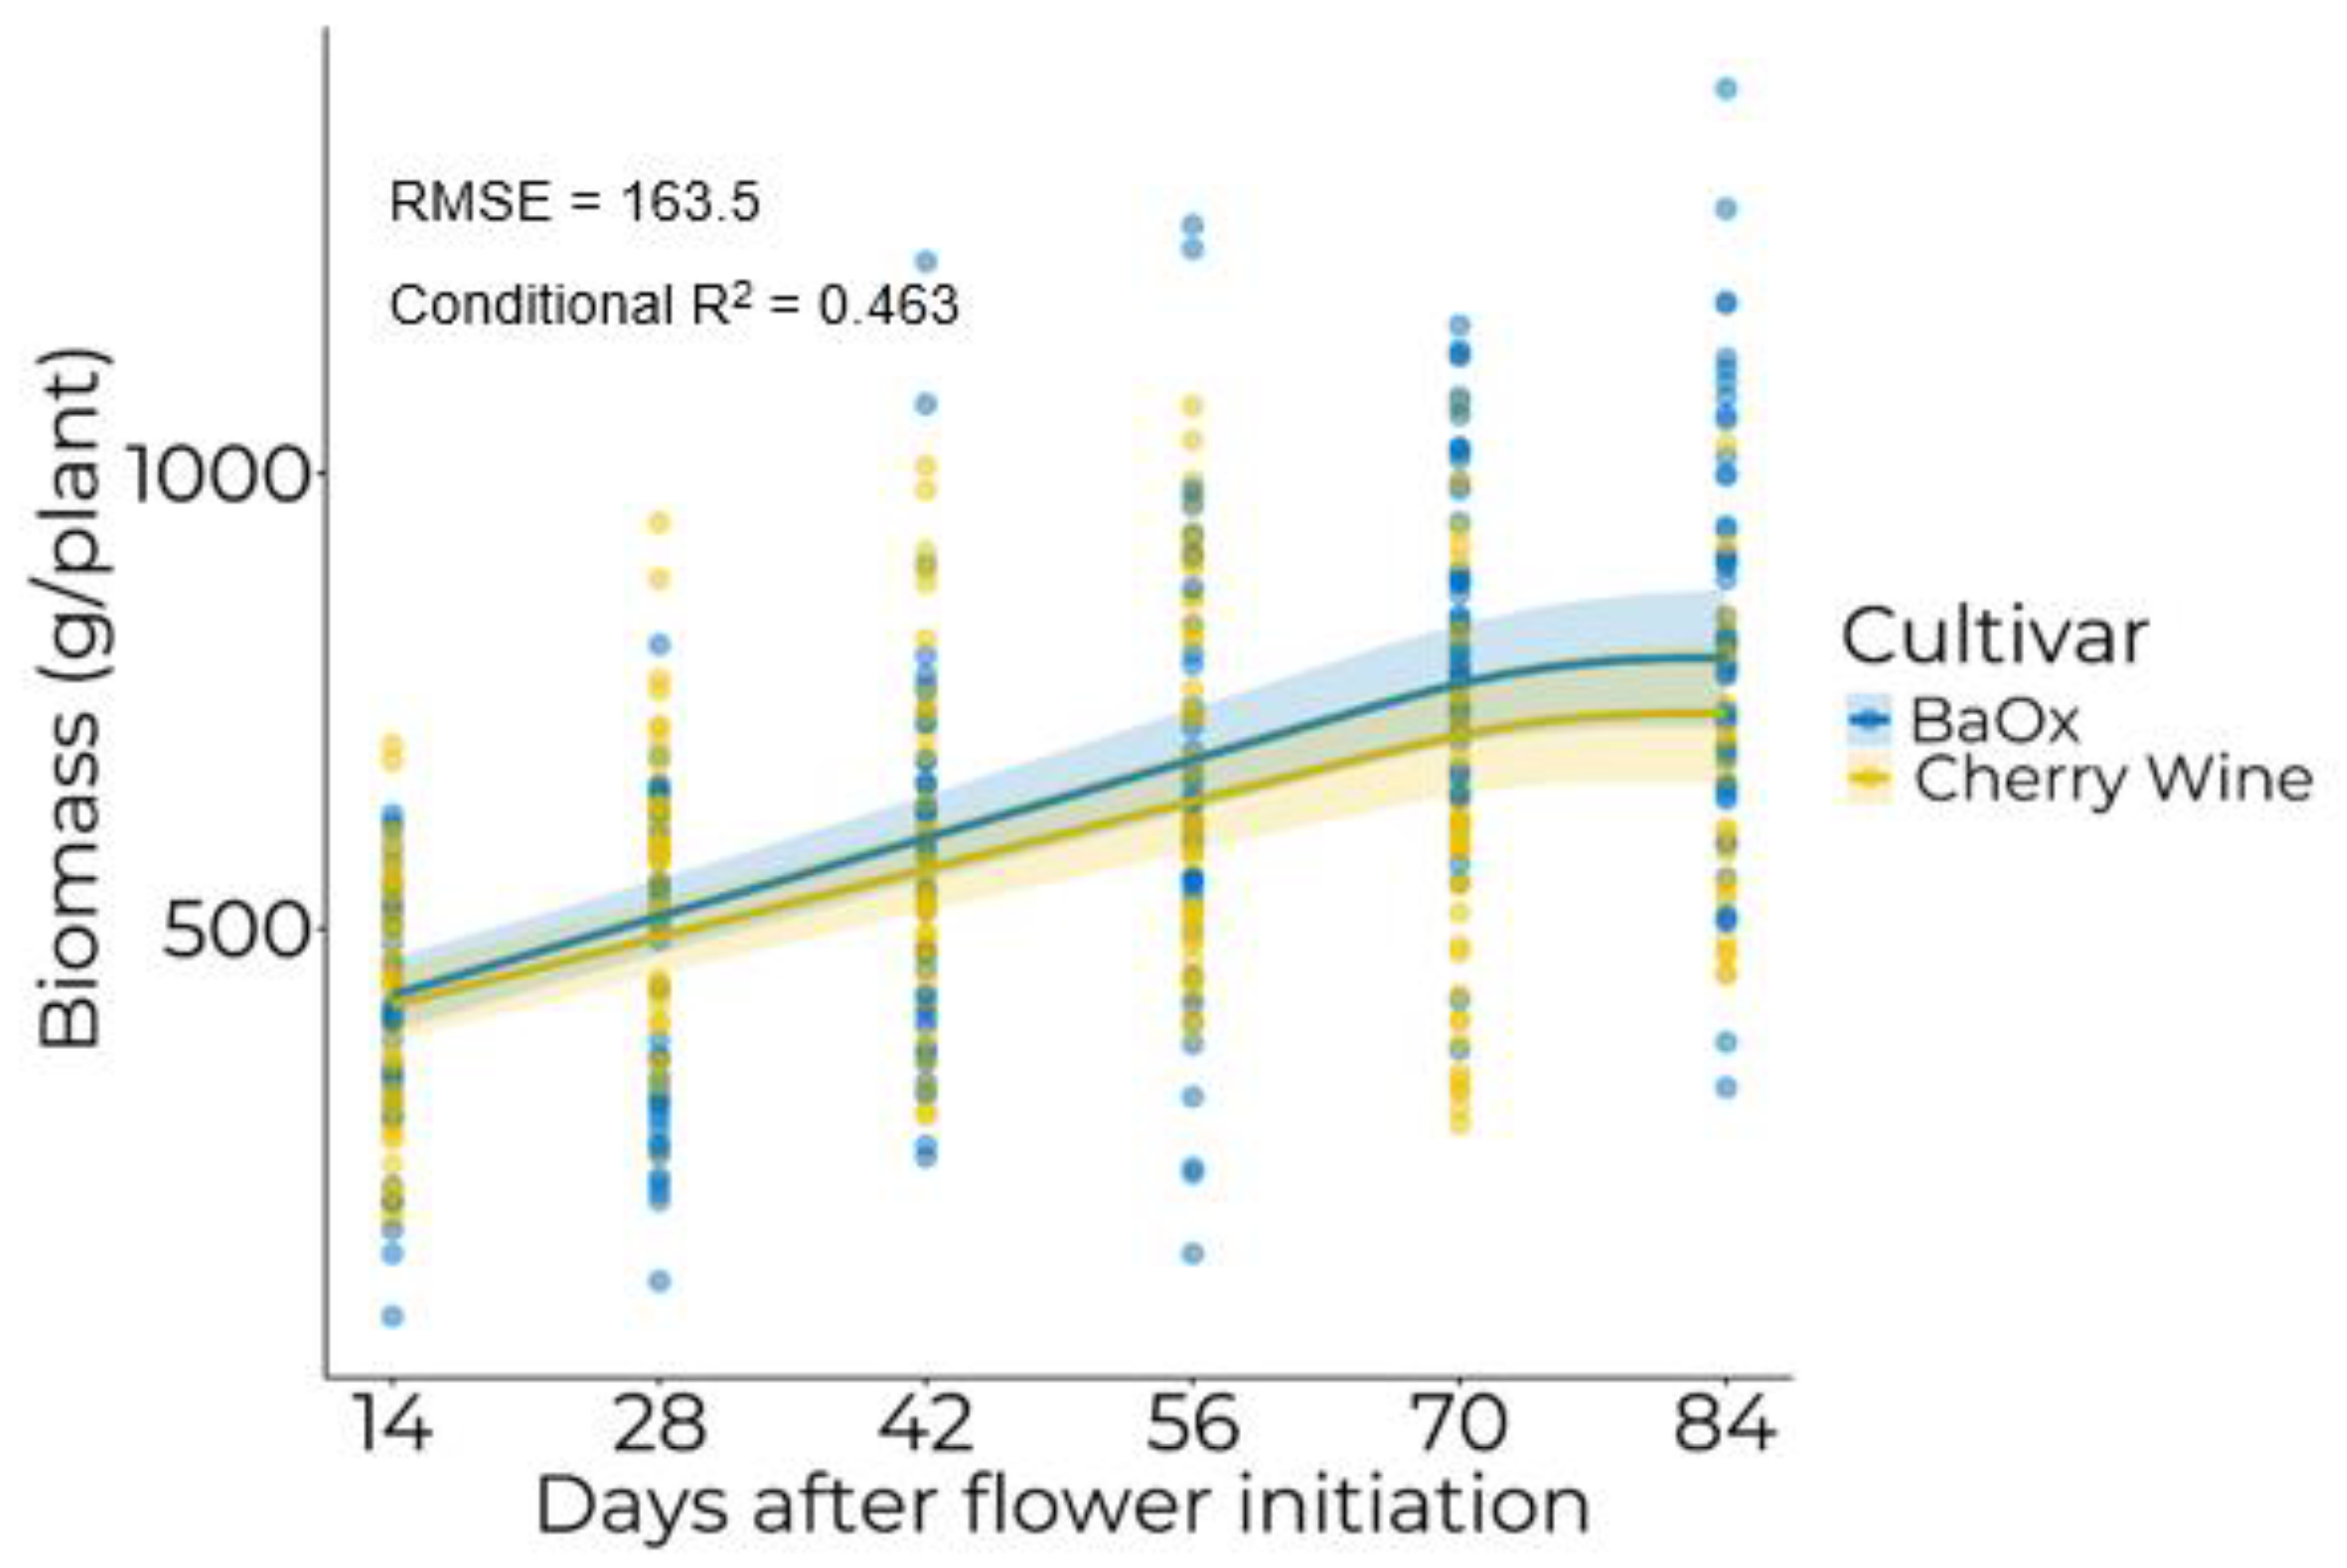
3.1. Biomass Accumulation

Logistic, linear-plateau, quadratic-plateau, and asymptotic functions were fit to the data and compared using their individual corrected Akaike Information Criteria (AICc) and Bayesian Information Criteria (BIC). The linear-plateau model had the lowest AICc and BIC (Table 1) and was selected as the best fit model for threshed biomass accumulation on a per-plant basis.
The linear-plateau model is expressed as
Y = A + Bx if x < XS;
Ym if x ≥ XS
where Y represents biomass, A is the intercept, B is the slope, XS is the threshold level of x (DAFI) where the model plateaus (Ym).
The effect of cultivar was not significant for the parameters estimates of A and XS, however, it was significant for the estimate of B (Table 2, Figure 1).
The estimate of parameter B or slope of the regression for the cultivar BaOx was 7.4 g day−1 and 4.1 g day−1 for Cherry Wine. The effect of cultivar was not significant on the parameter XS and both reached maximum biomass at approximately 74 DAFI (Figure 1).
There is a scarcity of information in the literature regarding post-anthesis temporal accumulation of biomass for floral hemp. Massuela et al. [11] conducted a study in a controlled environment with chemotype III plants and found a significant effect of harvest time on inflorescence production. The general trend was an increase in inflorescences yield from 5 weeks post-anthesis when harvest events started, to 11-week post-anthesis when the final harvest concluded. Interestingly, Massuela et al. [11] did not observe a yield plateau in this study; however, the cultural practices applied in this study most likely influenced yield outcomes. Plants in their study received a truncated growing period; vegetative growth lasted for 28 days, which resulted in relatively small plants. Additionally, 95% of natural light was blocked with a shade cloth and only artificial light was used to induce flowering throughout the experiment. These cultural practices most likely limited yield potential and temporal biomass accumulation for the plants used in this study.

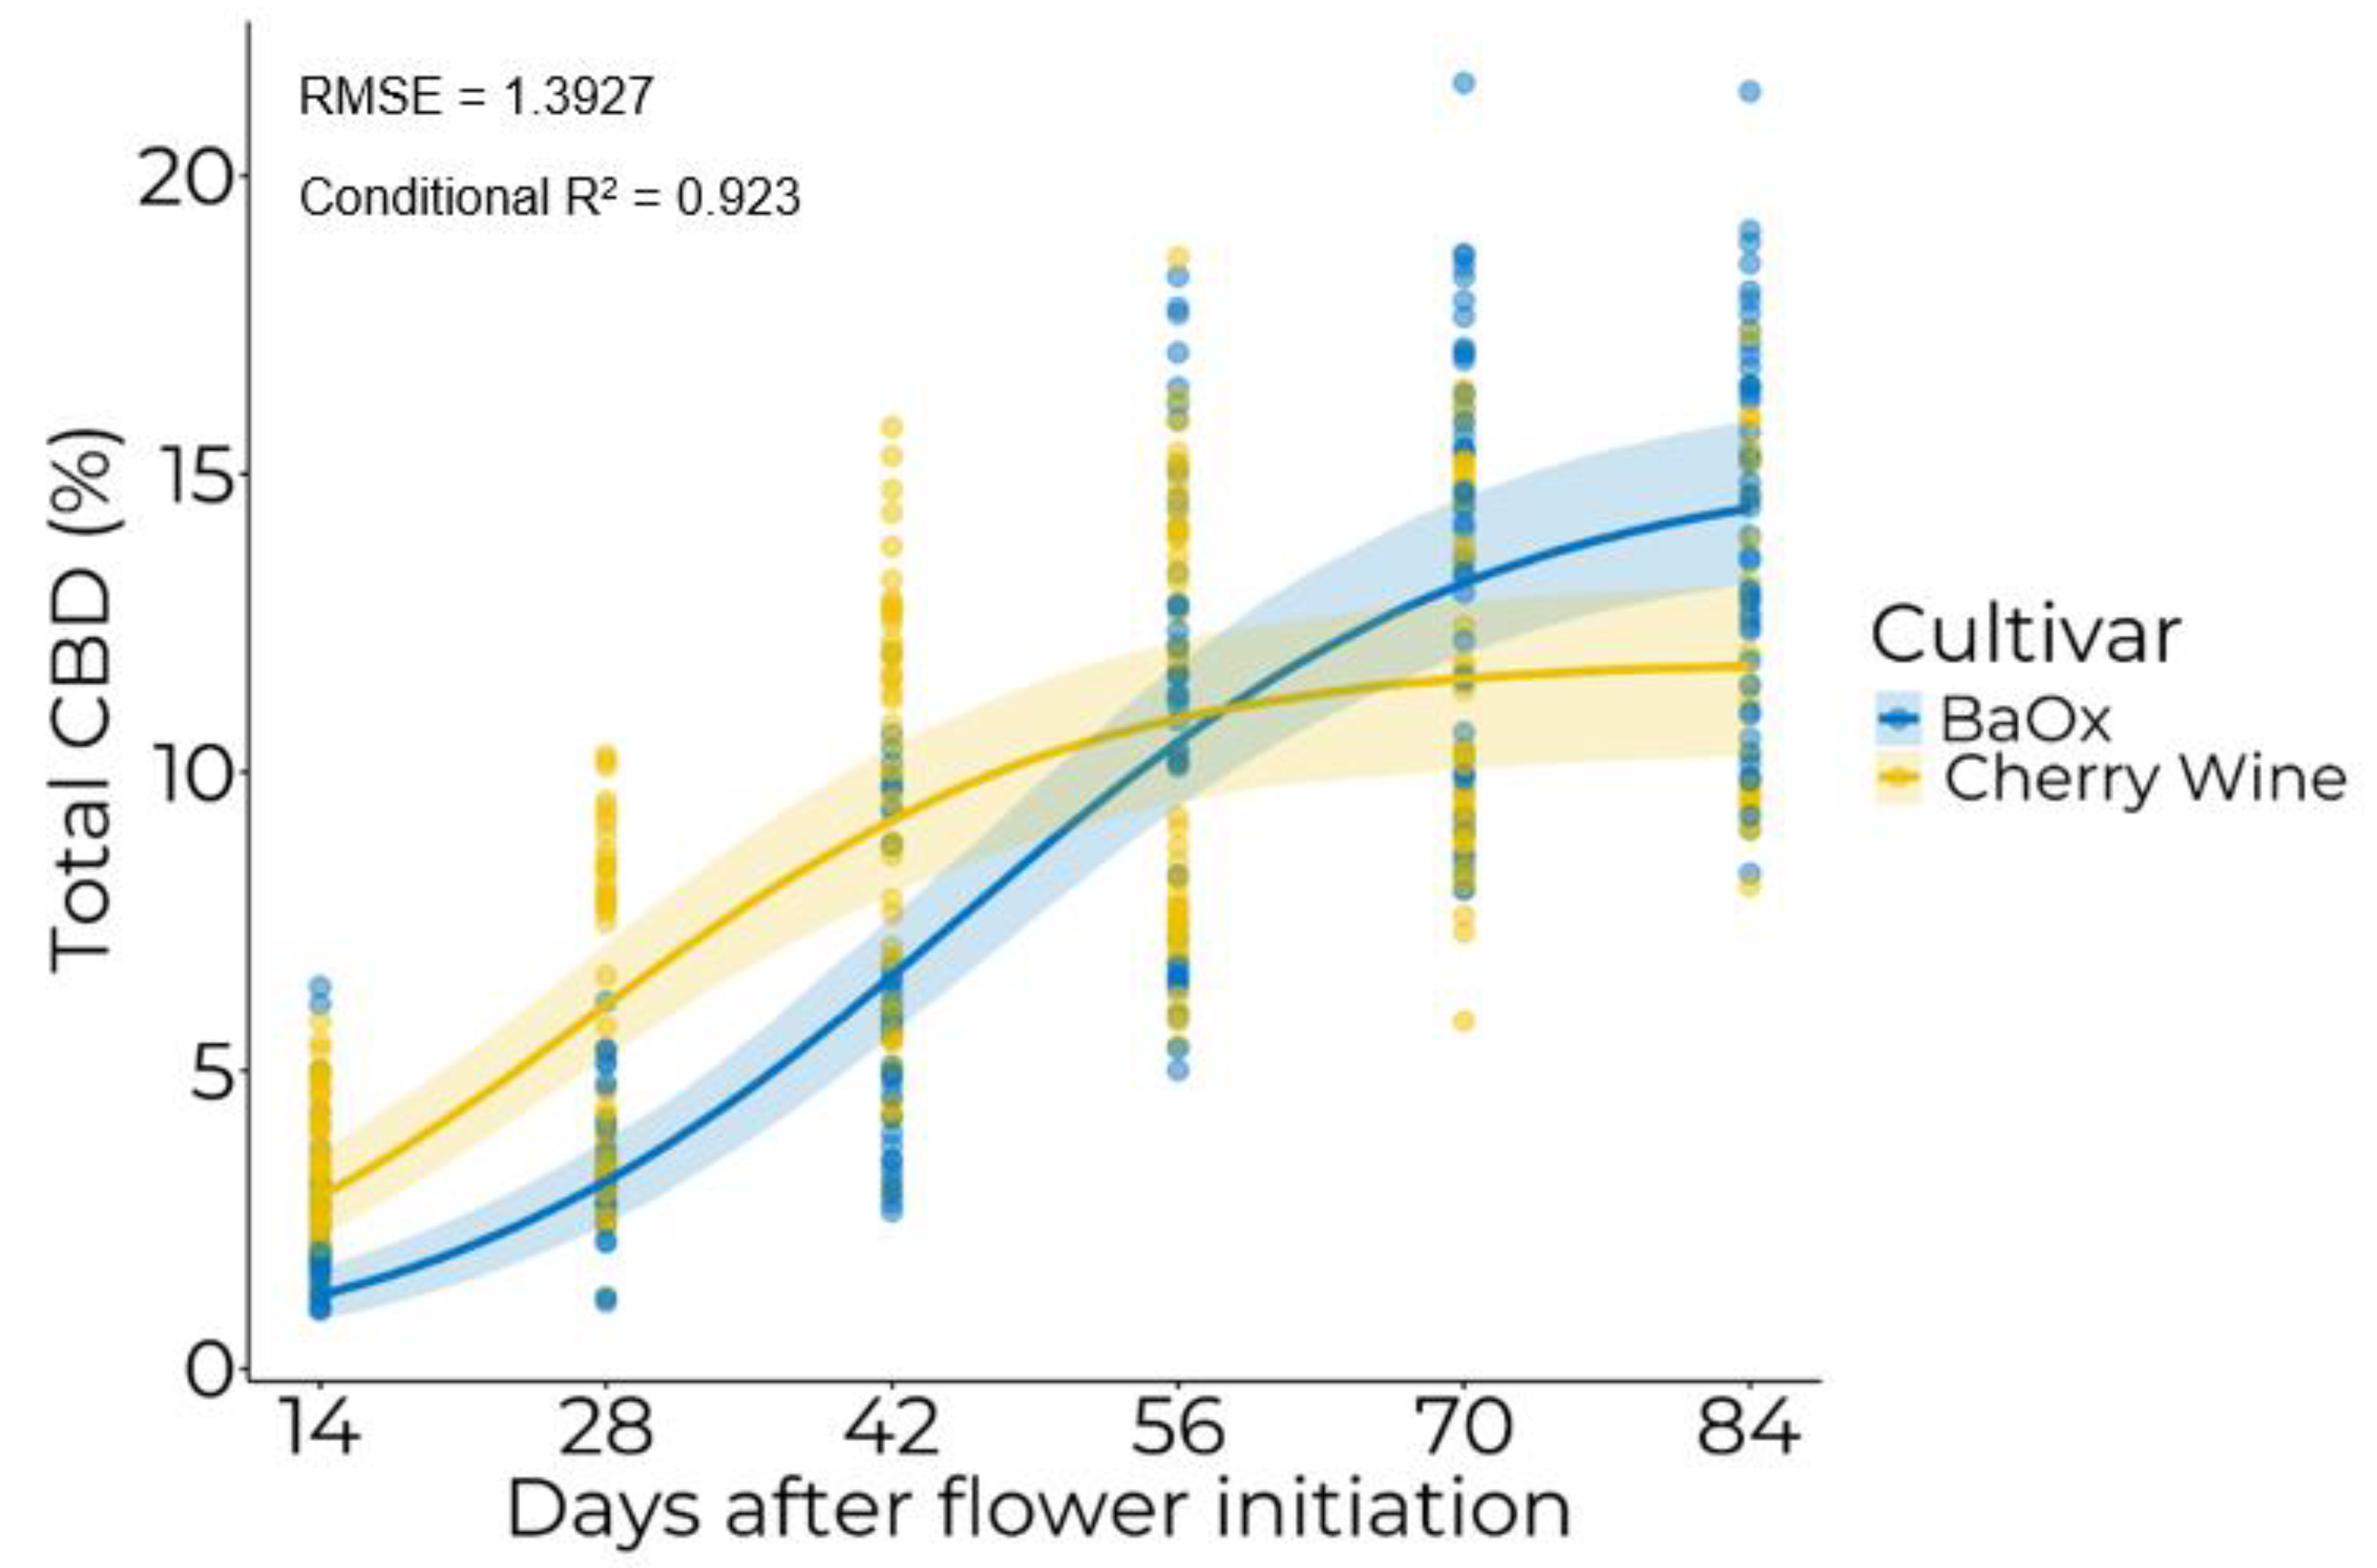
3.2. Temporal Accumulation of Cannabinoids

Multiple sigmoid functions were fit to the temporal cannabinoid data and were compared using their respective corrected Akaike Information Criteria (AICc) and Bayesian Information Criteria (BIC; Table 3).
The best fit model for total THC was a beta growth function which is expressed as:
Y = W.max ( 1 + Te x Te Tm ) ( x Te ) Te Te Tm
where W.max is the maximum observed THC concentration, Te is the time point at which W.max occurs, Tm is the time point where the maximum total THC accumulation rate is obtained, and x is DAFI.
The effect of cultivar was significant on the parameters W.max, Te, and Tm (Table 4).
Maximum total THC (W.max) was highest in ‘BaOx’ (0.454%) compared to ‘Cherry Wine’ (0.367%; Table 4, Figure 2).
The time required to reach W.max (Te) for ‘Cherry Wine’ and ‘BaOx’ was 63.2 and 75.2 DAFI, respectively. A comparable trend was observed for the effect of cultivar on the estimate of the parameter Tm or the time at which the maximum THC accumulation rate is reached: ‘Cherry Wine’ reached its maximum accumulation rate (16.5 DAFI) before ‘BaOx’ (44.7 DAFI). Additionally, ‘Cherry Wine’ reached the USDA THC compliance threshold at an earlier date at approximately 41 DAFI whereas ‘BaOx’ reached this threshold at 50 DAFI (Figure 2).
We observed a decline in total THC concentration with later harvest dates (Figure 2). THC is susceptible to non-enzymatic oxidation by oxygen, heat, and light exposure. The products of the oxidative degradation of THCA and Δ9-THC are cannabinol (CBN) and, to a lesser extent, the isomer ∆8-THC [4,5,16]. The decline in THC concentration associated with later harvest times is likely the result of the oxidization of THC.
Post-anthesis temporal total CBD accumulation trends are comparable to total THC: a strong sigmoid relationship between DAFI and total CBD was observed (Figure 3). Unlike total THC, we did not observe a decrease in total CBD concentration at the end of the trial. The best fit model for describing the relationship between DAFI and total CBD concentration was a logistic regression (Table 3), which is expressed as:
Y   = W.max ( 1 + e ( scale ( x xmid ) )
where Y is total CBD concentration, W.max is the maximum CBD concentration obtained, scale is the maximum CBD accumulation rate, xmid the time point at the maximum accumulation rate, and x is DAFI.
The effect of cultivar was not significant on the parameters W.max or scale (Table 5), which averaged 13.54% and 12.4% DAFI-1 across cultivars, respectively. However, the effect of cultivar was significant for the estimate of xmid; ‘BaOx’ reached the maximum CBD accumulation rate at 45.5 DAFI compared to 26.9 DAFI in ‘Cherry Wine’ (Table 5).
We observed a CBD concentration plateau for the cultivar ‘Cherry Wine’; however, we did not observe a plateau for ‘BaOx’ within the timeline of this study (Figure 3).
Total CBD accumulation trends during reproductive growth were cultivar dependent (Figure 3, Table 5). Neither of the trends presented a post plateau decline in total CBD concentration as observed in total THC (Figure 2). Temporal accumulation of total CBD and total THC for day-length sensitive chemotype III cultivars has been sparsely documented. Stack et al. [7], Aizpurua-Olaizola et al. [9], and Yang et al. [17] reported temporal accumulation of THC that generally fits a beta growth curve model. Specifically, these authors showed a strong sigmoid accumulation pattern in total THC followed by a decline towards the end of their studies. Additionally, temporal accumulation of THC for day length sensitive chemotype I cultivars exhibit a similar growth curve [10]. However, there is considerable variation in trends for the temporal accumulation of total CBD for day length sensitive chemotype III cultivars in the literature. Yang et al. [17], who conducted trials in Florida, observed a decrease in total CBD concentrations after concentrations plateaued. Aizpurua-Olaizole et al. [9] did not observe a post-plateau decline in total CBD concentrations, but rather a continued increase in concentrations until plants were harvested. Stack et al. [7] tested 30 hemp cultivars and observed three separate trends in total CBD accumulation where concentrations either plateaued, continued to increase until harvest, or decreased after plateauing. Our results, in combination with prior published work, indicate that total CBD accumulation rates differ by genotype. Yang et al. (2020) reported a post plateau decline in CBD concentrations for the cultivar ‘Cherry Wine’ starting at approximately 6 weeks post-anthesis. In our study, we did not observe the same trend. Instead, we observed CBD concentrations leveling off after they had reached a plateau. Studies have shown that cannabinoid concentrations are primarily controlled by genotype [18] and are generally not influenced by environmental stress [19]. The variation likely found among studies for the cultivar Cherry Wine may have been due to inconsistent genetics. Unfortunately, many ‘Cherry Wine’ floral hemp cultivars sold, and not all of them come from the same stock. This complicates research and, more importantly, can have negative implications for farmers expecting one cultivar that is not true to type.
In our study, the absence of post plateau decline in total CBD may be related to the stability of the compound. While there is a lack of literature regarding the stability of CBD within the plant, several studies have investigated the stability of cannabis oil and cannabinoids outside the plant. Yangsud et al. [20] isolated and purified Δ9-THC, CBD, and CBN from seized drug type Cannabis sativa L. and investigated each compound’s stability against multiple degradation modes. When compared with THC, CBD is slightly more stable against oxidation and thermal degradation. However, when exposed to acid and alkaline degradation, CBD was considerably less stable than THC. Additionally, CBD was slightly less stable than THC when exposed to photo-degradation. Trofin et al. [21] observed the decay of CBD and Δ9-THC in seized cannabis oil over four years in darkness at 4 °C and exposed to laboratory light at 22 °C. Over the four years, the decay of THC amounted to an 83.75% loss at 4 °C in darkness and 89.58% loss at 22 °C with light exposure. The decay of CBD amounted to a 40.81% loss at 4 °C in darkness, and 44.85% loss at 22 °C with light exposure. The results from both studies indicate that CBD is less susceptible than THC to degradation under normal field conditions. This reduced affinity for degradation may explain why we did not observe a post plateau decline in total CBD concentration as the plants began to senesce.

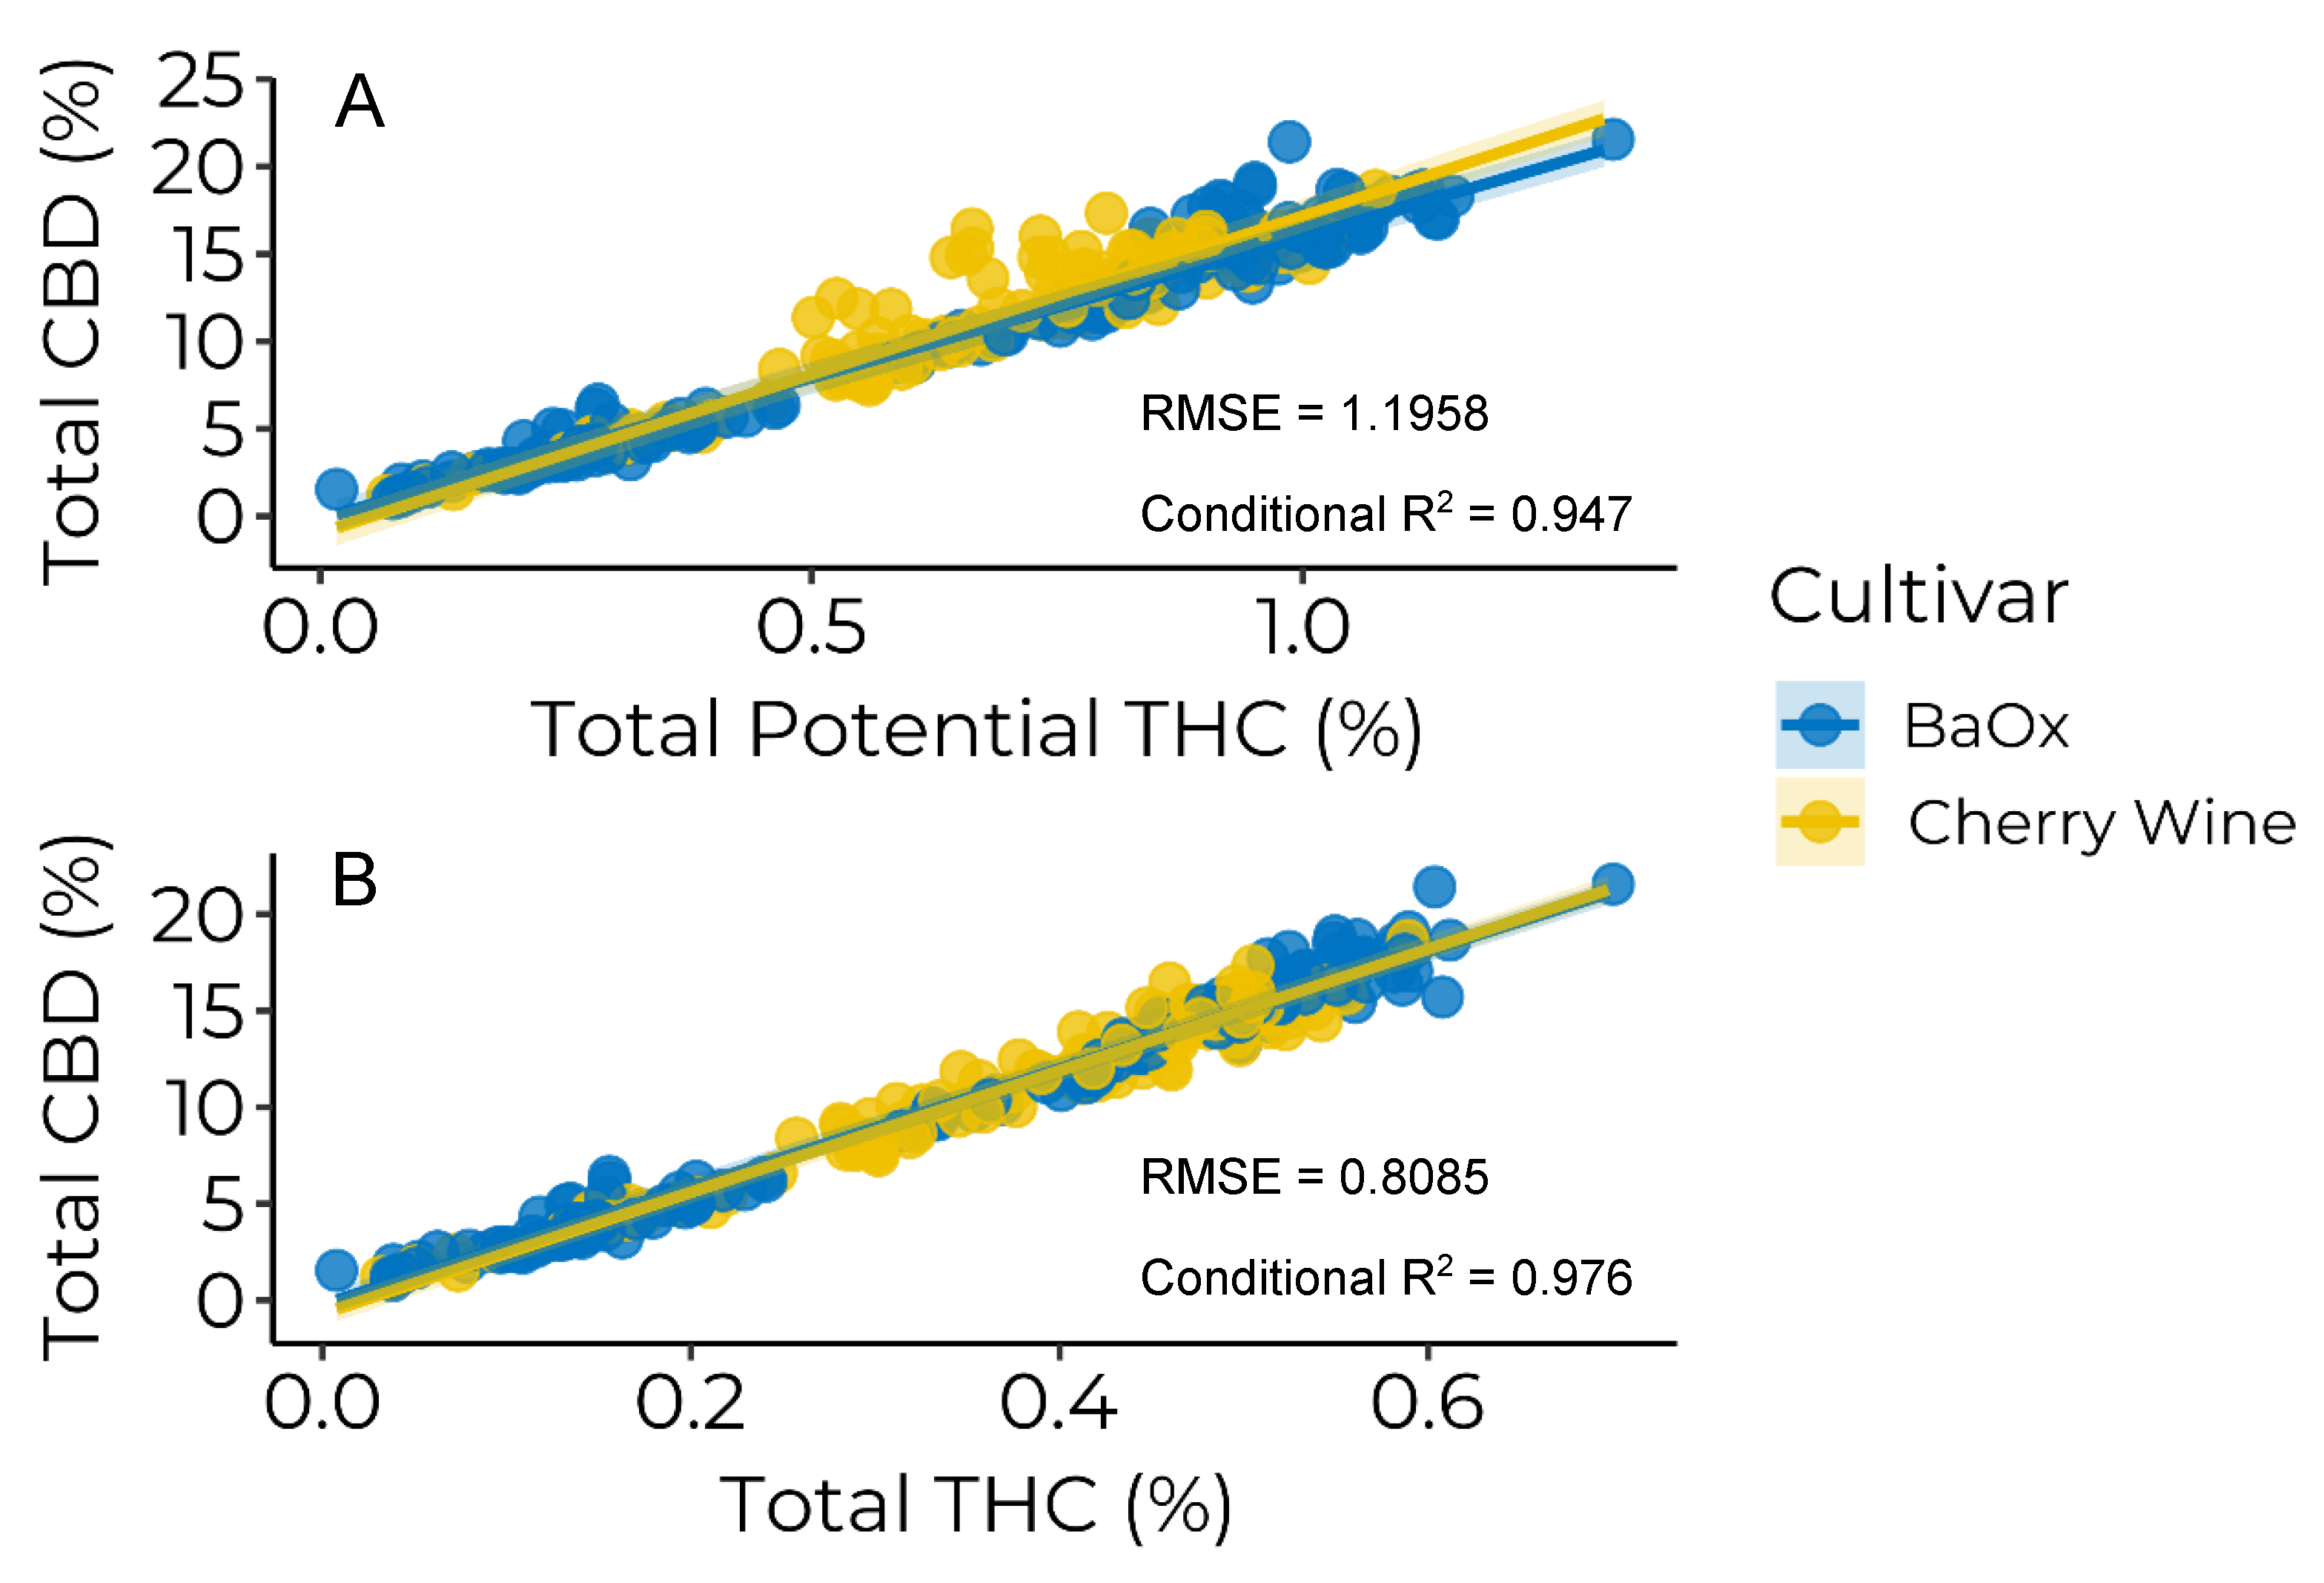
3.3. Cannabinoid Ratios

As discussed, Δ9-THC and THCA can be converted to CBN and Δ8-THC by non-enzymatic oxidative degradation. Therefore, we determined the CBD:THC ratio by two different methods. First, by including total potential THC (Δ9-THC + 0.877 × THCA + CBN; THCP) and second, by only including total THC (Δ9-THC + 0.877 × THCA). No Δ8-THC was found in any of the samples, thus not included when calculating total potential THC. Mixed multiple linear regression was used to model the relationships between cultivar, total CBD, total THC, and total potential THC. The linear regression describing the CBD:THCP relationship indicated a significant interaction between THCP and cultivar (Table 6; Figure 4A).
This interaction indicates that the relationship between THCP and CBD is cultivar dependent. The regression slope indicates a CBD:THCP ratio of 16.2:1 for ‘BaOx’ and 18.2:1 for ‘Cherry Wine’ (Table 6).
There was no significant interaction between total THC and cultivar on CBD for the linear regression explaining the CBD:total THC relationship (Table 6). However, both main effects of total THC and cultivar significantly affected total CBD. Both cultivars had a shared slope of 31.0 (Table 6, Figure 4B). The mutual slopes for both cultivars indicate that ‘BaOx’ and ‘Cherry Wine’ share a CBD:total THC ratio of 31:1. The two cultivars had slightly different y-intercepts: ‘BaOx’ had a y-intercept of −0.253% while ‘Cherry Wine’ had a y-intercept of −0.728% (Table 6). The slightly higher y-intercept observed with ‘BaOx’ may indicate that the cultivar is predisposed to produce more CBD.
Zirpel et al. [8] demonstrated that CBDAS produces CBCA and THCA as side products during the synthesis of CBD, each of these side products are produced at about 5% of the CBDA amount. The high CBD producing cultivars used in this study are often referred to as chemotype III cultivars. In chemotype III plants, THCA is produced predominantly as a side product through the action of CBDAS [22]. Therefore, the CBD:THC ratio can be interpreted as a metric depicting the efficiency of the CBDAS enzyme for the given chemotype III cultivar. Depending on the harvest date and cultivar, excluding CBN from the THC fraction of the CBD:THC ratio could result in an exaggerated ratio. Without including CBN, our CBD:THC ratio was 31:1 which is significantly higher than the average ratio reported in Zirpel et al. [8]. This inflated ratio is likely the result of harvest events occurring after THC concentrations plateaued and began to decline (Figure 2). After including CBN our CBD:THCP ratio was closer to 20:1 with ratios at 16.2:1, and 18.2:1 for ‘BaOx’ and ‘Cherry Wine’, respectively. Excluding CBN form the THC fraction of the CBD:THC ratio resulted in an inflated ratio which masked the interaction between the main effects found in the regression associated with the CBD:THCP (Table 6). An accurate CBD:THC ratio is an essential tool for hemp breeders and growers as it indicates the efficiency of CBDAS.
Originally, the American Agricultural Improvement Act of 2018 outlined the regulatory framework where growers had a 15-day window between compliance testing and time of harvest. Recently, the USDA published a final rule which became effective on 22 March 2021. This final rule provides revised regulations for the domestic production of hemp. As part of this final rule the window between compliance testing and harvest was extended from 15 to 30 days. To minimize risk, growers should have their crop tested as early as possible within this 30-day window. We observed ‘BaOx’ and ‘Cherry Wine’ exceeding the compliance threshold at 50 and 41 DAFI, respectively (Figure 2). Therefore, to have a crop test below the compliance threshold and remain compliant at the time of harvest, farmers growing ‘BaOx’ and ‘Cherry Wine’ should have samples collected no later than 20 DAFI.

4. Conclusions

The study aimed to model the temporal accumulation of CBD and THC in floral hemp to establish harvest timing recommendations to minimize non-compliant crop production. We found that both ‘BaOx’ and ‘Cherry Wine’ reached the total THC compliance threshold prior to achieving maximum biomass and CBD concentrations. Consequently, farmers growing these two cultivars must harvest prematurely to remain compliant. Specifically, farmers should have their crop tested no later than 20 DAFI and harvest no later than 50 DAFI. We observed differences in total CBD and total THC between the two cultivars. These differences may be due to increased floral versus leaf production. Flowers contain significantly higher amounts of glandular trichomes and, accordingly, higher amounts of cannabinoids. We did not separate leaf from floral material as farmers in the region thresh plants and sell both flower and leaf combined. Further work is warranted to investigate flower and leaf production, and their effects on total plant cannabinoid concentration.

Author Contributions

Conceptualization, D.H.S.; methodology, D.H.S.; formal analysis, D.H.S.; investigation, E.R.L. and S.H.I.; resources, D.H.S.; data curation, E.R.L.; writing—original draft preparation, E.R.L.; writing—review and editing, D.H.S., S.Y. and X.L.; visualization, D.H.S.; supervision, D.H.S.; project administration, D.H.S., S.Y. and X.L.; funding acquisition, D.H.S. All authors have read and agreed to the published version of the manuscript.

Funding

This research was funded partially by the North Carolina Agricultural Foundation, INC.

Institutional Review Board Statement

Not applicable.

Informed Consent Statement

Not applicable.

Data Availability Statement

The data presented in this study are available on request from the corresponding author. The data are not publicly available due to restrictions from the breeding company of the hemp clones used in the trials.

Acknowledgments

We would like to acknowledge the hard work and dedication of the station staff at the Piedmont Research Station, Cunningham Research Station, and Sandhills Research Station. We would also like to thank Fernando Miguez for aiding in statistical consulting.

Conflicts of Interest

The authors declare no conflict of interest.

References

  1. Radwan, M.; Chandra, S.; Gul, S.; ElSohly, M. Cannabinoids, Phenolics, Terpenes and Alkaloids of Cannabis. Molecules 2021, 26, 2774. [Google Scholar] [CrossRef] [PubMed]
  2. Happyana, N.; Agnolet, S.; Muntendam, R.; Van Dam, A.; Schneider, B.; Kayser, O. Analysis of cannabinoids in laser-microdissected trichomes of medicinal Cannabis sativa using LCMS and cryogenic NMR. Phytochemistry 2012, 87, 51–59. [Google Scholar] [CrossRef]
  3. Perrotin-Brunel, H.; Buijs, W.; van Spronsen, J.; van Roosmalen, M.J.; Peters, C.J.; Verpoorte, R.; Witkamp, G.-J. Decarboxylation of Δ9-tetrahydrocannabinol: Kinetics and molecular modeling. J. Mol. Struct. 2011, 987, 67–73. [Google Scholar] [CrossRef]
  4. Dussy, F.E.; Hamberg, C.; Luginbühl, M.; Schwerzmann, T.; Briellmann, T.A. Isolation of Δ9-THCA-A from hemp and analytical aspects concerning the determination of Δ9-THC in cannabis products. Forensic Sci. Int. 2005, 149, 3–10. [Google Scholar] [CrossRef] [PubMed]
  5. Pellati, F.; Borgonetti, V.; Brighenti, V.; Biagi, M.; Benvenuti, S.; Corsi, L. Cannabis sativa L. and Nonpsychoactive Cannabinoids: Their Chemistry and Role against Oxidative Stress, Inflammation, and Cancer. BioMed Res. Int. 2018, 2018, 1691428. [Google Scholar] [CrossRef] [PubMed] [Green Version]
  6. de Meijer, E.P.M.; Bagatta, M.; Carboni, A.; Crucitti, P.; Moliterni, V.M.C.; Ranalli, P.; Mandolino, G. The Inheritance of Chemical Phenotype in Cannabis sativa L. Genetics 2003, 163, 335–346. [Google Scholar] [CrossRef]
  7. Stack, G.M.; Toth, J.A.; Carlson, C.H.; Cala, A.R.; Marrero-González, M.I.; Wilk, R.L.; Gentner, D.R.; Crawford, J.L.; Philippe, G.; Rose, J.K.C.; et al. Season-long characterization of high-cannabinoid hemp (Cannabis sativa L.) reveals variation in cannabinoid accumulation, flowering time, and disease resistance. GCB Bioenergy 2021, 13, 546–561. [Google Scholar] [CrossRef]
  8. Zirpel, B.; Kayser, O.; Stehle, F. Elucidation of structure-function relationship of THCA and CBDA synthase from Cannabis sativa L. J. Biotechnol. 2018, 284, 17–26. [Google Scholar] [CrossRef] [PubMed]
  9. Aizpurua-Olaizola, O.; Soydaner, U.; Öztürk, E.; Schibano, D.; Simsir, Y.; Navarro, P.; Etxebarria, N.; Usobiaga, A. Evolution of the Cannabinoid and Terpene Content during the Growth of Cannabis sativa Plants from Different Chemotypes. J. Nat. Prod. 2016, 79, 324–331. [Google Scholar] [CrossRef]
  10. De Backer, B.; Maebe, K.; Verstraete, A.; Charlier, C. Evolution of the Content of THC and Other Major Cannabinoids in Drug-Type Cannabis Cuttings and Seedlings During Growth of Plants*. J. Forensic Sci. 2012, 57, 918–922. [Google Scholar] [CrossRef]
  11. Massuela, D.C.; Hartung, J.; Munz, S.; Erpenbach, F.; Graeff-Hönninger, S. Impact of Harvest Time and Pruning Technique on Total CBD Concentration and Yield of Medicinal Cannabis. Plants 2022, 11, 140. [Google Scholar] [CrossRef] [PubMed]
  12. Rosenthal, E. Marijuana Harvest: How to Maximize Quality and Yield in Your Cannabis Garden; Rosenthal, E., Ed.; Quick American Archives: San Francisco, CA, USA, 2017. [Google Scholar]
  13. R Core Team. R: A Language and Environment for Statistical Computing. R Foundation for Statistical Computing, Vienna, Austria. 2022. Available online: https://www.R-project.org/ (accessed on 29 June 2021).
  14. Miguez, F. Nlraa: Nonlinear Regression for Agricultural Applications. R Package Version 1.2. 2022. Available online: https://CRAN.R-project.org/package=nlraa (accessed on 14 July 2022).
  15. Pinheiro, J.; Bates, D.; DebRoy, S.; Sarkar, D.; Team, R.C. Nlme: Linear and Nonlinear Mixed Effects Models. R Package Version 3.1–120. 2015. Available online: https://CRAN.R-project.org/package=nlme (accessed on 14 July 2022).
  16. Moreno-Sanz, G. Can You Pass the Acid Test? Critical Review and Novel Therapeutic Perspectives of Δ9-Tetrahydrocannabinolic Acid A. Cannabis Cannabinoid Res. 2016, 1, 124–130. [Google Scholar] [CrossRef] [PubMed] [Green Version]
  17. Yang, R.; Berthold, E.C.; McCurdy, C.R.; Benevenute, S.D.S.; Brym, Z.T.; Freeman, J.H. Development of Cannabinoids in Flowers of Industrial Hemp (Cannabis sativa L.): A Pilot Study. J. Agric. Food Chem. 2020, 68, 6058–6064. [Google Scholar] [CrossRef] [PubMed]
  18. Campbell, B.J.; Berrada, A.F.; Hudalla, C.; Amaducci, S.; McKay, J.K. Genotype × Environment Interactions of Industrial Hemp Cultivars Highlight Diverse Responses to Environmental Factors. Agrosystems, Geosci. Environ. 2019, 2, 1–11. [Google Scholar] [CrossRef] [Green Version]
  19. Toth, J.A.; Smart, L.B.; Smart, C.D.; Stack, G.M.; Carlson, C.H.; Philippe, G.; Rose, J.K.C. Limited effect of environmental stress on cannabinoid profiles in high-cannabidiol hemp (Cannabis sativa L.). GCB Bioenergy 2021, 13, 1666–1674. [Google Scholar] [CrossRef]
  20. Yangsud, J.; Santasanasuwan, S.; Ahkkarachinoreh, P.; Maha, A.; Madaka, F.; Suksaeree, J.; Songsak, T.; Vutthipong, A.; Monton, C. Stability of cannabidiol, ∆9-tetrahydrocannabinol, and cannabinol under stress conditions. Adv. Tradit. Med. 2021, 21, 475–484. [Google Scholar] [CrossRef]
  21. Trofin, I.G.; Dabija, G.; Vaireanu, D.; Filipescu, L. Long-term storage and cannabis oil stability. Rev. Chim. 2012, 63, 293–297. [Google Scholar]
  22. Toth, J.A.; Stack, G.M.; Cala, A.R.; Carlson, C.H.; Wilk, R.L.; Crawford, J.L.; Viands, D.R.; Philippe, G.; Smart, C.D.; Rose, J.K.C.; et al. Development and validation of genetic markers for sex and cannabinoid chemotype in Cannabis sativa L. GCB Bioenergy 2020, 12, 213–222. [Google Scholar] [CrossRef]
Figure 1. Linear-plateau regression for per-plant biomass over time as affected by days after flower initiation. Shaded area represents 95% confidence interval for the predicted model. Circles represent plot-level data points. RMSE = Root Mean Square Error.
Horticulturae 08 00959 g001
Figure 2. Beta growth curve nonlinear function for floral hemp total THC concentration over time as affected by cultivar. Red dashed line at 0.3% total THC represents the legal threshold. Shaded area represents 95% confidence interval for the predicted model. Circles represent plot-level data points. RMSE = Root Mean Square Error.
Horticulturae 08 00959 g002
Figure 3. Nonlinear logistic regression for floral hemp total CBD concentration over time as affected by cultivar. Shaded area represents 95% confidence interval for the predicted model. Circles represent plot-level data points. RMSE = Root Mean Square Error.
Horticulturae 08 00959 g003
Figure 4. Linear regression for the effect of cultivar and total potential THC (A) and total THC (B) on total CBD. Total potential THC concentration calculated as Δ9-THC + 0.877 × THCA + CBN, total THC concentration calculated as Δ9-THC + 0.877 × THCA. Shaded area represents 95% confidence interval for the predicted model. Circles represent plot-level data points. RMSE = Root Mean Square Error.
Horticulturae 08 00959 g004
Table 1. Goodness-of-Fit criteria for mixed nonlinear asymptotic models describing temporal production of floral hemp threshed biomass.
ModelGoodness-of-Fit Criteria z
AICcBIC
Logistic6885.4086919.173
Linear-plateau6877.5256911.289
Quadratic-plateau6880.4816922.607
Asymptotic6917.3066946.878
z AICc = Corrected Akaike’s Information Criterion; BIC = Bayesian Infromation Criterion.
Table 2. Parameter estimates of the linear plateau nonlinear regression for individual plant biomass production over time for the floral hemp cultivars BaOx and Cherry Wine.
Parameter
CultivarA
(g plant−1)
B
(g day−1)
XS
(DAFI a)
BaOx271.27.477.3
Cherry Wine410.54.164.1
p-value0.5923<0.00010.1510
a Days after floral initiation.
Table 3. Goodness-of-Fit criteria for mixed nonlinear sigmoid models describing the relationship between floral hemp total THC and CBD concentrations over time.
Response zModelGoodness-of-Fit Criteria y
AICcBIC
Total THC %Logistic−1403.124−1365.121
Four-Parameter Logistic−1381.136−1351.522
Gompertz−1372.822−1343.208
Beta growth function−1432.406−1394.403
Four-parameter Beta growth function−1422.664−1393.051
Total CBD %Logistic2057.3012095.305
Four-Parameter Logistic2136.9312166.54
GompertzNC xNC
Beta growth function2161.0432199.047
Four-parameter Beta growth function2186.5232216.137
z Total CBD % calculated as %CBD + 0.877 × CBDA; Total THC % calculated as Δ9-THC + 0.877 × THCA. y AICc = Corrected Akaike’s Information Criterion; BIC = Bayesian Infromation Criterion. x NC = No convergence.
Table 4. Parameters estimates of the beta growth curve for floral hemp total THC concentration over time for the floral hemp cultivars BaOx and Cherry Wine.
Parameter
CultivarW.max
(%)
TE
(DAFI a)
TM
(DAFI)
BaOx0.4575.2044.67
Cherry Wine0.3663.1916.54
p-value0.0187<0.0001<0.0001
a Days after floral initiation.
Table 5. Parameter estimates of the logistic model for floral hemp total CBD concentration over time for the floral hemp cultivars BaOx and Cherry Wine.
Parameter
Cultivar W.max
(%)
xmid
(DAFI a)
Scale
(% DAFI−1)
BaOx15.2045.513.0
Cherry Wine11.8826.911.8
p-value0.9958<0.00010.3925
a Days after floral initiation.
Table 6. Linear regression coefficient estimates for models describing the linear relationship between floral hemp cultivars, total THC concentration, total potential THC concentration, and total CBD concentrations.
CultivarInterceptSlopeInterceptSlope
----Total Potential THC a----------Total THC b-----
%CBD%CBD %THCP−1%CBD%CBD %THC−1
BaOx−0.19616.2−0.25330.6
Cherry Wine−0.98718.2−0.72831.5
p-value0.0669<0.00010.03400.0975
a Total potential THC calculated as Δ9-THC + 0.877 × THCA + CBN. b Total THC calculated as Δ9-THC + 0.877 × THCA.
Publisher’s Note: MDPI stays neutral with regard to jurisdictional claims in published maps and institutional affiliations.

