Article

Manipulation of the Phenolic Quality of Assam Green Tea through Thermal Regulation and Utilization of Microwave and Ultrasonic Extraction Techniques

by
Kanjana Singh
1,
Somdet Srichairatanakool
2,3,4,
Teera Chewonarin
2,
Charles Stephen Brennan
5,
Margaret Anne Brennan
5,6,
Wannaporn Klangpetch
3 and
Niramon Utama-ang
1,3,4,*
1
Division of Product Development Technology, Faculty of Agro-Industry, Chiang Mai University, Chiang Mai 50100, Thailand
2
Department of Biochemistry, Faculty of Medicine, Chiang Mai University, Chiang Mai 50100, Thailand
3
Cluster of High Value Products from Thai Rice and Plant for Health, Chiang Mai University, Chiang Mai 50100, Thailand
4
Cluster of Innovative Food and Agro-Industry, Chiang Mai University, Chiang Mai 50100, Thailand
5
School of Science, RMIT University, Melbourne 3000, Australia
6
Department of Wine, Food and Molecular Biosciences, Faculty of Agriculture and Life Science, Lincoln University, Christchurch 7647, New Zealand
*
Author to whom correspondence should be addressed.
Horticulturae 2022, 8(4), 338; https://doi.org/10.3390/horticulturae8040338
Submission received: 25 March 2022 / Revised: 13 April 2022 / Accepted: 14 April 2022 / Published: 16 April 2022
(This article belongs to the Special Issue Advances in Tea Plant Biology and Tea Quality Regulation)

Abstract

:
The aim of this study was to investigate the catechin levels and antioxidant activities as manipulated by roasting temperature and roasting time of green tea. Roasting temperature and time varied between 100–300 °C and 60–240 s in green tea production. The main interactions measured were effects on the antioxidant activities, total phenolic content, DPPH, ABTS, FRAP and catechin content (catechin (C), epigallocatechin gallate (EGCG), epigallocatechin (EGC), epicatechin gallate (ECG) and epicatechin (EC)). Optimum roasting conditions were determined as 270 °C for 240 s, since this enabled high catechin contents, antioxidant activities and production yield. The extraction methods for green tea including traditional extraction (TDE), microwave-assisted extraction (MAE) and ultrasonic-assisted extraction (UAE) using 60% ethanol as solvent were investigated to evaluate the highest bioactive compound and yield of extraction. MAE was found to be more efficient in green tea extraction compared to UAE and TDE. The extracts showed significant cytotoxic potential against the Huh-7 cell line, in concentrations ranging from 31.25 to 1000 µg/mL. The results are useful in understanding the relationship between thermal treatment and extraction conditions on the chemical and nutritional properties of tea catechins, making it possible to select the production and extraction conditions that maximize the levels of beneficial tea ingredients.

Graphical Abstract

1. Introduction

Tea (Camellia sinensis L.) is one of the oldest and most popular drinks in the world, especially in Asia. It has been considered a health-promoting beverage due to containing over 2000 different active components including phenolic compounds, proteins, free amino acids, catechins, flavonoids and volatile compounds [1]. Various types of tea bioactivity have been investigated, such as anti-diabetes, immunomodulation, anticancer and antioxidant activity. The health benefits of tea polyphenols have been of interest in recent years, due to their potential for preventing metabolic syndrome and cancer [2]. The tea polyphenol (−)-epigallocatechin-3-gallate (EGCG) is recognized for cancer prevention in many animal models and human cancer cell lines [3]. A high intake of brewed tea is associated with a lower risk of cancer in the body, especially the upper gastrointestinal tract [2].
Recently, a large variety of teas have emerged in the market with unique flavor and functions. However, due to the growth of consumer interest, the aroma of roasted tea is a crucial point of consumer preference [4]. Processing methods such as thermal processing can significantly affect the physical and chemical composition of tea. Roasting is an important step in tea preparation, to improve its flavor and shelf-life, and may remove some undesirable volatile compounds that might be formed during the process [5]. Roasted green tea is characterized by a caramel-like aroma, mellow taste and a reddish-brown color [4]. Zhu et al. [4] suggested that a heavy roasting process decreases catechins and flavonol glycosides, while aldehydes, ketones, furans and pyrroles/pyrazines are increased. Moreover, different roasting processes cause changes in chemical and sensory profiles [4,6].
The extraction method has a significant influence on the yield, bioactivity and sensory qualities of tea [7]. Microwave-assisted extraction (MAE) and ultrasound-assisted extraction (UAE) are environmentally friendly and energy-saving [8]. However, each method has some advantages and disadvantages. Thus, the first objective of this study was to evaluate the effect of roasting conditions (roasting temperature and roasting time) on the yield, moisture content, water activity, antioxidant activity and catechin content of Assam tea. The second objective was to compare and investigate the effects of the extraction method—MAE, UAE and traditional extraction (TDE; Soxhlet method)—on the yield, moisture content, total phenolic compound content (TPC), antioxidant activity and catechin composition. The third objective of this study, assessing the anticancer activity of the tea extract, was evaluated in Huh-7 cells.

2. Materials and Methods

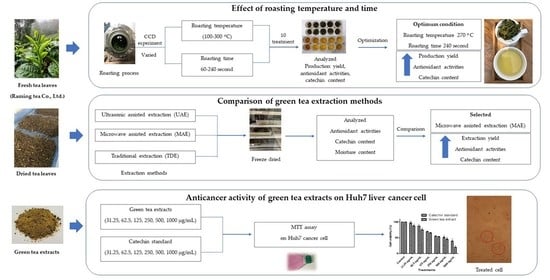
2.1. Preparation of Roasted Green Tea

Fresh green tea leaves (Camellia sinensis var. assamica) were obtained from Raming Tea Co., Ltd., Chiang Mai, Thailand. The processing of each sample imitated the industrial tea process. Fresh green tea leaves (20 kg) with the moisture content of 71.7% were submitted to withering, roasting, rolling and drying. The procedure is summarized in Figure 1. Green tea leaves were withered at room temperature for 3 h. The withered leaves were then passed through a roaster (Yuan Chang Machinery, Taoyuan, Taiwan). The roasted leaves were also pressed through a rolling machine and dried at 100 °C to reduce the humidity to below 8% on a dry basis (MC) based on Thai FDA regulations. A central composite design (CCD) was used to investigate the effect of the roasting process variables of temperature (100–300 °C) and time (60–240 s) on green tea production with 10 treatments (TR) (Table 1). Dried green tea leaves were milled in a hammer mill (Brook Crompton Series 2000, Huddersfield, UK). The temperature of sample during milling was controlled at less than 40 °C to limit bioactive compound degradation. The milling time was fixed at 2 min per round, allowing the machine to rest for 5 min, after which samples were then sieved. The particle size of the recovered green tea powder was 1.2 mm, and the green tea powder was stored in aluminum foil bags under vacuum for future analysis.

2.2. Green Tea Extraction

2.2.1. Microwave-Assisted Extraction (MAE)

MAE was conducted using a Toshiba Model ER-300C(S) microwave (settings: max power 900 W, frequency 2.45 × 10⁹ Hz), and the extract was obtained by treating green tea powder (100 g) in 60% ethanol (1000 mL) using microwave power at 600 W for 10 min as described by Wang et al. [9].

2.2.2. Ultrasound-Assisted Extraction (UAE)

UAE (Model VC505, Sonics & Materials, Inc., Newtown, CT, USA) was used to obtain an extract using green tea powder (100 g) with 60% ethanol (1000 mL) at a frequency of 20 kHz at 150 W for 26.4 min and an extraction temperature of 24 °C, as described by Lee et al. [10].

2.2.3. Traditional Extraction (TDE)

TDE was conducted using a Soxhlet apparatus to obtain an extract from green tea powder (10 g) with 60% ethanol (100 mL) for 5 h as described by Wang et al. [9].
The solvent was evaporated under vacuum at 40 °C after extraction using a rotary evaporator (Büchi Rotavapor R-200, Allschwil, Switzerland). Green tea extracts were drying using a freeze-dryer machine. After that, extracts were kept in air-tight amber bottles and stored in darkness at 4 °C for further analysis.

2.3. Production and Extraction Yield

The yield of sample was defined as the ratio of the weight of fresh green tea leaves to the weight of roasted (yield after roasting) or dried green tea leaves (yield after drying) based on the dry matter content using the following definitions.
P r o d u c t i o n   y i e l d   ( % ) = ( W 1 W 2 W 1 ) × 100
where W1 is the weight of fresh green tea leaves and W2 is the weight of roasted or dried green tea leaves.
The extraction yield of green tea extracts was defined as the ratio of the weight of green tea extracts after evaporation to that of dried green tea extracts, using the following definition:
E x t r a c t i o n   y i e l d   ( % ) = W 1 × 100 W 2
where W1 is the weight of extract after evaporation and W2 is the weight of green tea powder.

2.4. Physical and Chemical Analysis

Proximal analysis of green tea leaves was performed using standard AOAC methods: No. 955.04 for protein content, No. 905.02 for fat content, No. 945.46 for ash measurement, and No. 990.19 for moisture content [11]. Water activity was determined using an AquaLab Water Activity Meter (Decagon, Hopkins, WA, USA). Powder colors were measured in the L* a* b* system using a Konica Minolta colorimeter (CR-400 Series, Osaka, Japan).

2.5. Total Phenolic Compound (TPC) Content

TPC was determined using Folin–Ciocalteu reagent as adapted from Izzreen and Fadzelly [12]. Green tea extracts was mixed with Folin–Ciocalteu reagent (0.75 mL, previously diluted 10-fold with distilled water) and allowed to stand at 22 °C for 5 min; sodium bicarbonate (0.75 mL, 60 g/L) solution was added to the mixture. After 90 min at 22 °C, absorbance was measured at 725 nm. Results were expressed as gallic acid equivalents on dry weight (DW).

2.6. 2,2-Diphenyl-l-picryl-hydrazyl (DPPH) Assay

A methanol solution of DPPH (1 mL, 0.3 mM) was added to sample or standard (2.5 mL). The solution was vigorously mixed and allowed to stand at room temperature for 30 min in darkness. The absorbance was measured at 518 nm. Results were expressed as gallic acid equivalent on dry weight (DW) [13].

2.7. Ferric Reducing/Antioxidant Power (FRAP) Assay

The working FRAP reagent was produced by mixing acetate buffer (300 mM, pH 3.6), 2,4,6-tripyridyl-s-triazine (TPTZ) solution (10 mM) and FeCl3·6H2O (20 mM) in a 10:1:1 ratio prior to use and heating to 37 °C in a water bath. The FRAP reagent (3.0 mL) was added to a cuvette for blank reading at 593 nm using a spectrophotometer. Extract (100 µL) and distilled water (300 mL) were added to the cuvette, and a second reading at 593 nm was performed after 4 min. The change in absorbance after 4 min from the initial blank reading was compared with the standard curve and expressed as the gallic acid equivalent on dry weight (DW) [14].

2.8. ABTS Decolorization Assay

The pre-formed radical monocation of 2,2′-azino-bis(3-ethylbenzthiazoline)-6-sulfonic acid (ABTS) was generated by reacting ABTS solution (7 mM) with potassium persulfate (K2S2O8, 2.45 mM). The mixture was left to stand for 15 h in darkness at room temperature. The solution was diluted with ethanol to obtain an absorbance of 0.7 ± 0.2 units at 734 nm. An aliquot (200 µL) of each sample was added to the ABTS cation solution (2000 µL). Absorbance was monitored for 5 min and was spectrophotometric measurement at 734 nm using a spectrophotometer. The results were shown as gallic acid equivalent on dry weight (DW) [15].

2.9. Quantification of Catechin Content

Five chemical standards—catechin (C), epigallocatechin gallate (EGCG), epigallocatechin (EGC), epicatechin gallate (ECG) and epicatechin (EC)—were used to determine the bioactive compounds in extracts on dry weight (DW). All of the standards were prepared with 70% ethanol. An Agilent 1100 high-performance liquid chromatography (HPLC) system with a RESTEK Ultra C18 column (Length 250 mm, ID 4.6 mm, size 5 µm) was used to obtain the chromatograms [9]. The mobile phase consisted of a mixture of elution A (phosphoric acid 86.5% v/v, 0.2% v/v in acetonitrile 12% and tetrahydrofuran 1.5% v/v) and B (73.5% phosphoric acid v/v, 0.2% v/v in 25% acetonitrile and 1.5% tetrahydrofuran). This was followed by a linear gradient of elution with 0–100% moving phase A (30 min) and a gradual increase in the volume of mobile B phase to the initial state of 100% solvent A (10 min, hold for 20 min) at a flow rate of 1 mL/min, then a gradual decrease in the mobile phase B to the initial state of 100% solvent A (10 min, hold 20 min) for the next analysis. The detectors were defined at wavelengths of 280 nm (detector wavelength 1) and 210 nm (detector wavelength 2) with a column temperature of 25–30 °C.

2.10. Sensory Evaluation of Roasted Green Tea

Green tea leaves (3 g) were infused in hot water (150 mL, 85 °C). Consumers (n = 100, aged 20–40 years) were recruited from Chiang Mai University, Thailand and Raming Tea Co., Ltd., Chiang Mai, Thailand. In this study, a balanced incomplete block design was used. Each consumer was presented with 10 samples. The order of samples was counterbalanced within and across judges. Each consumer received samples with a three-digit code in a randomized order. A glass of water was also served to each subject to cleanse the palate between samples. Consumers were asked to provide their demographic information. They provided acceptability ratings for color, odor, taste and overall liking, all on a nine-point hedonic scale (1 = dislike extremely, 5 = neither like nor dislike, and 9 = like extremely). Binomial-type questions (yes/no) were used to evaluate overall product acceptance and purchase intent.

2.11. Human Cell Culture

Huh-7 cells were cultured in DMEM supplemented with 10% fetal bovine serum, penicillin (100 IU/mL) and streptomycin (100 IU/mL) in a humidified 5% CO2 incubator at 37 °C, using the method described previously [16]. Cells were harvested at 80–90% confluence.

2.12. Cell Viability Assay

The MTT assay was used to measure cell viability using the method previously described by Jaganathan et al. [16]. Briefly, Huh-7 cells were treated with extract (0–200 µg/mL, final ethanol concentration 0.4%) for 24 and 48 h and washed with PBS. The cells were then incubated with MTT (5 mg/mL) previously dissolved in DMEM for 4 h. The resulting MTT formazan product was dissolved with DMSO (0.1 mL), and the OD was measured at 570 nm. Percentage cell viability was plotted against extract concentration.

2.13. Statistical Analysis

Analyses were performed at least in triplicate, and data were presented as means ± standard deviation. The statistical method used for data analysis was two-way analysis of variance (ANOVA). Differences were considered to be significant at p < 0.05. Statistical analysis was performed using SPSS statistics software version 17.0. The numerical and graphical optimization techniques of Design-Expert Software (version 6.0.2; Stat Ease Inc., Minneapolis, MN, USA) were used for simultaneous optimization of the multiple responses.

3. Results and Discussions

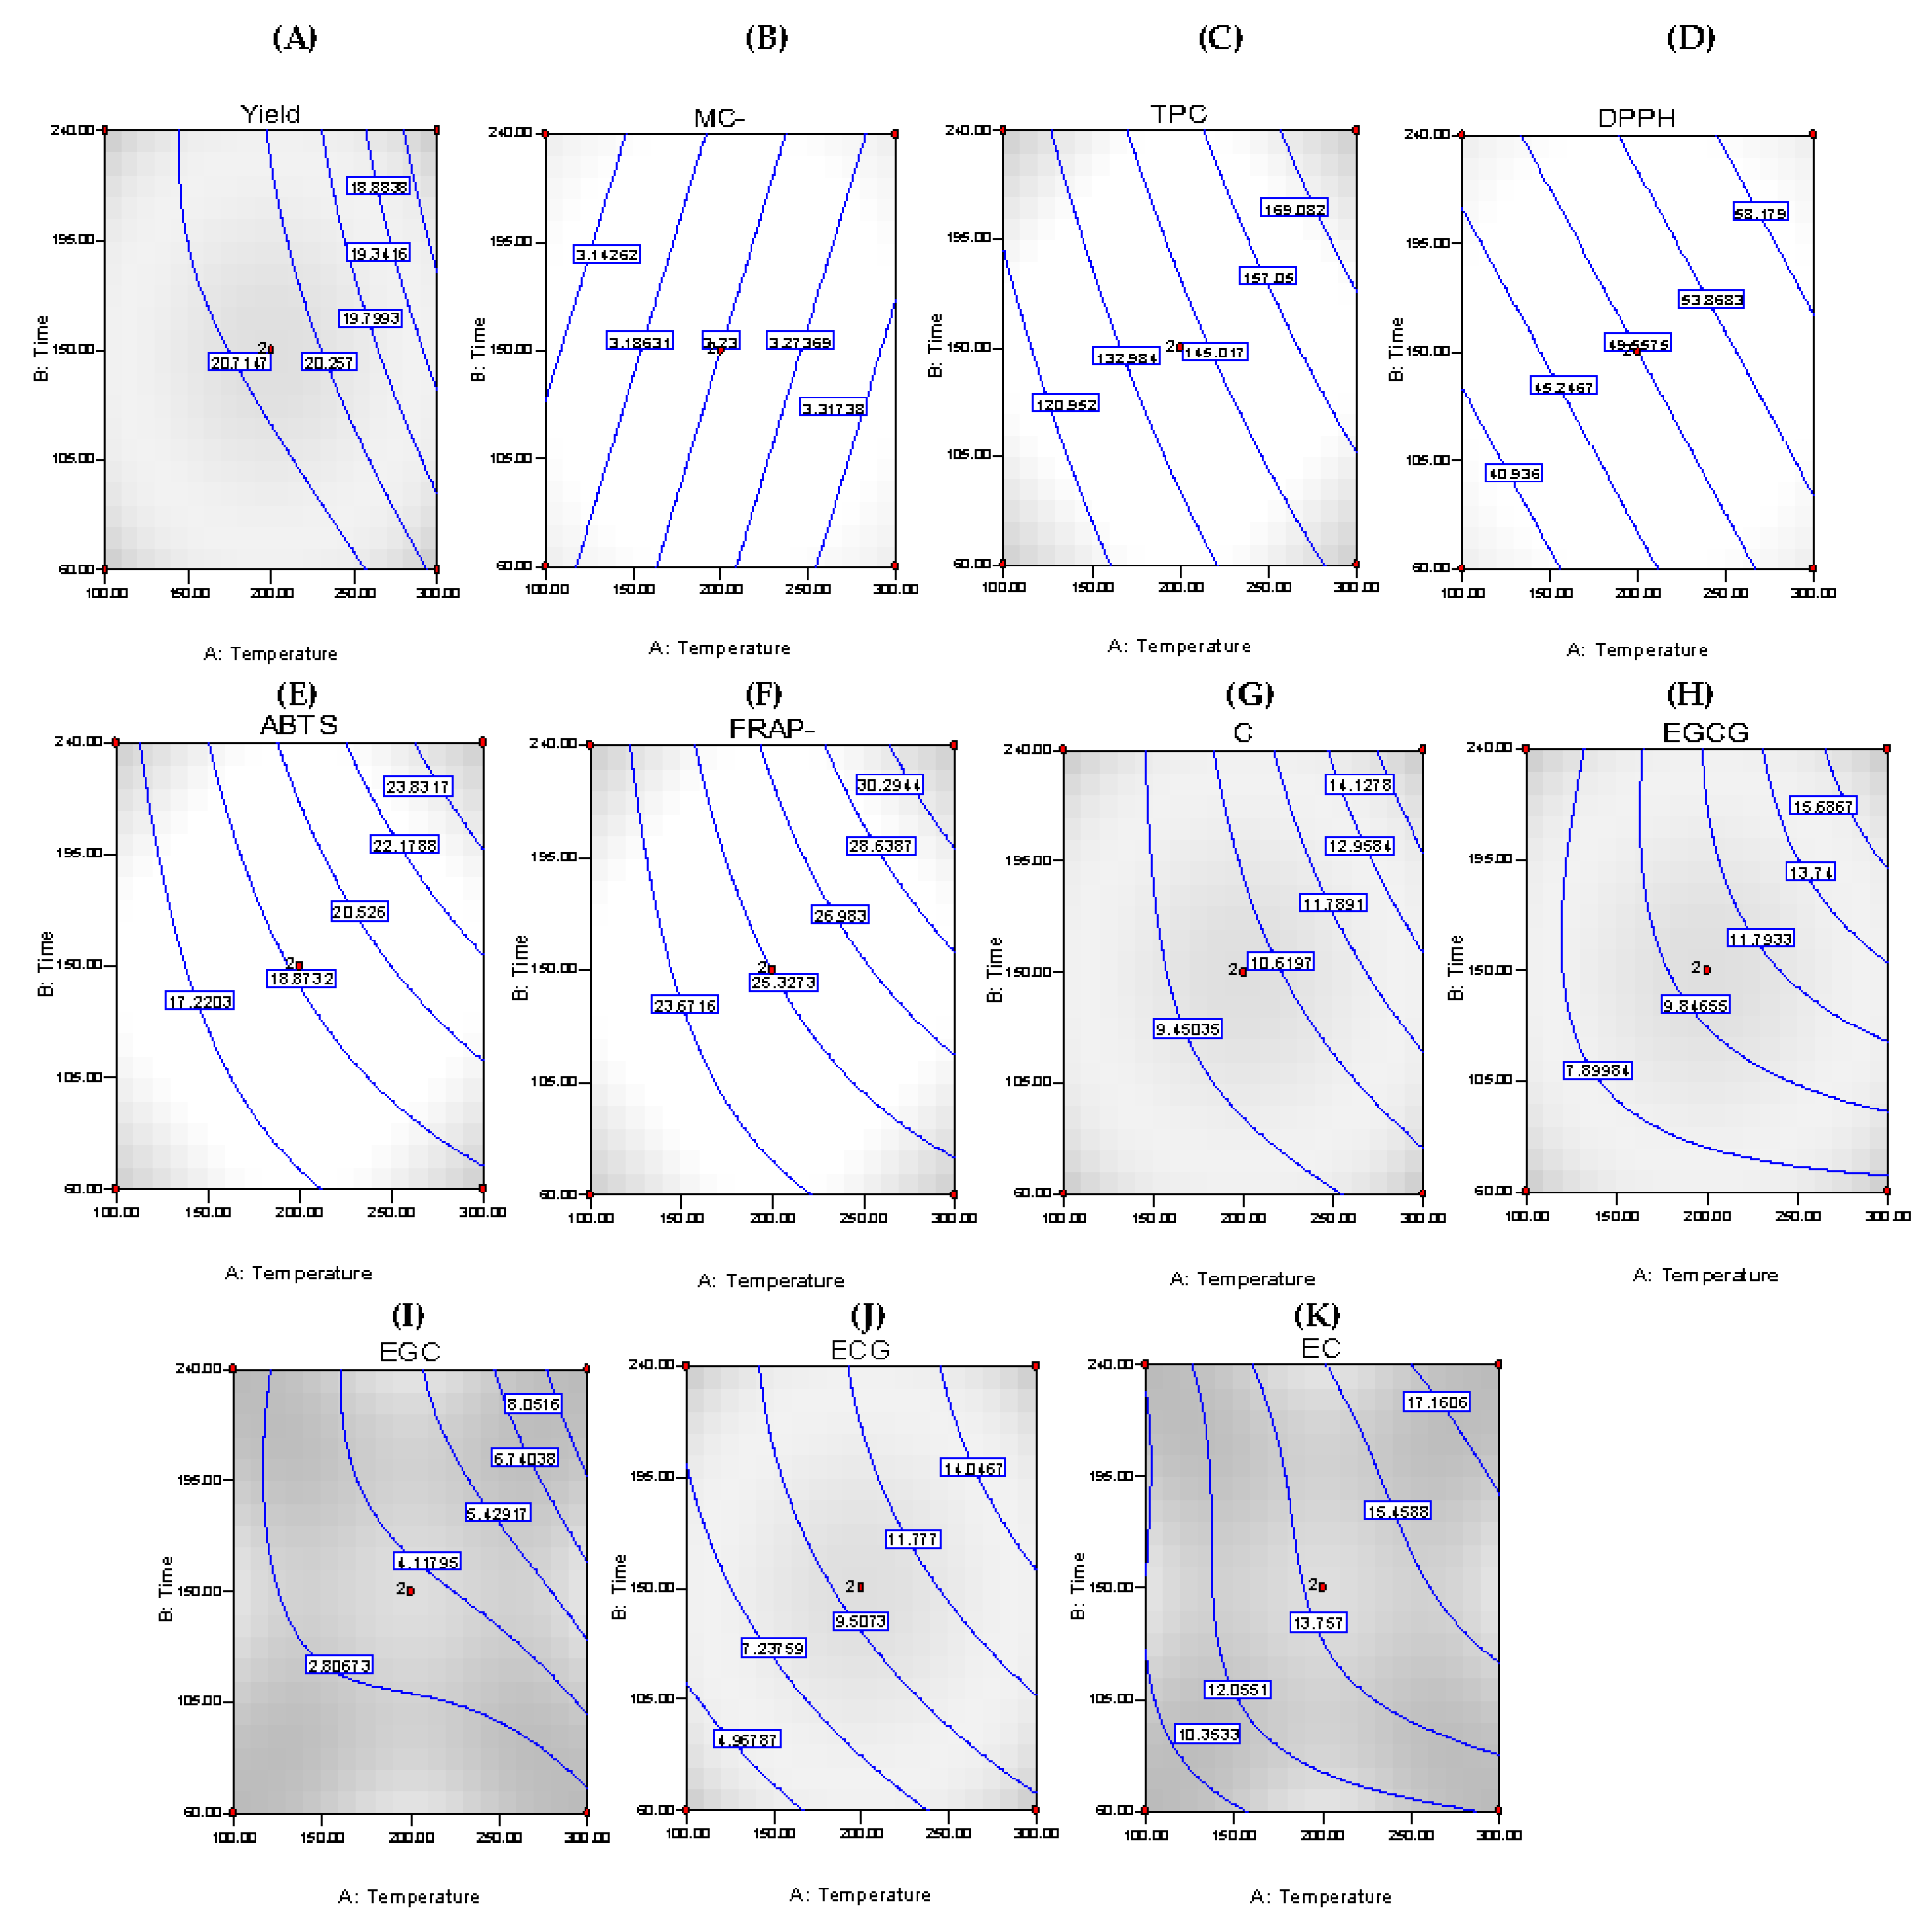
3.1. Effect of Roasting Temperature and Time on Green Tea Production Yield

Production yield after roasting was calculated as the ratio of weight of fresh green tea leaves before processing to that of roasted leaves. The production yield varied between 58.0% and 68.7% (Table 1). The results showed that roasting temperature and time affected roasted yield due to water loss during processing. These results were consistent with those for Kamairi-cha Korean green tea, which was roasted under different roasting conditions [17]. In addition to the loss of moisture content, there was also loss during processing, especially at high temperature (>300 °C), which burned and broke the tea leaves into powder that was left in the roasting machine. The production yield after drying was in a range from 18.1 to 21.2% (Table 1), which was consistent with the study of Friedman et al. [17]. Roasting temperature and time had a significant effect (p < 0.05) on the production yield of dried green tea leaves. The statistical analysis showed a lack of fit of the model (p = 0.41) for production yield, reflected in the determination coefficient (adj. R2 = 0.95) (Table 2). This indicated that the models adequately explained the effect of the independent variables (roasting temperature and time) on production yield. The regression coefficient showed that roasting time had a major influence on production yield, as it decreased with the increase in roasting time (Figure 2A). This may be due to the loss of material components during the roasting process [18].

3.2. Effect of Roasting Temperature and Time on Green Tea Antioxidant Activity

The total antioxidant capacity of green tea produced at different roasting temperatures and times was determined. The antioxidant activity determined by TPC, DPPH, ABTS and FRAP was in the range from 80.45 to 169.64 mg GAE/g dw, 28.97 to 60.16 mg GAE/g dw, 18.34 to 28.51 mg GAE/g dw and 12.76 to 24.65 mg GAE/g dw, respectively (Table 1).
The antioxidant activity of the roasted tea was consistent with its TPC. Although the mechanisms of action of DPPH, ABTS and FRAP assays are different, i.e., scavenging of DPPH and ABTS radicals in the DPPH and ABTS assays, respectively, and the reduction of ferric ions in the FRAP assay, the rankings of the three conducted antioxidant assessments were similar to the trend for TPC [12].
According to statistical analysis (Table 2), the model seemed to be sufficient; there was no significant lack of fit, with a highly significant adj. R2 (0.69 to 0.80) for TPC, DPPH and ABTS. In the cases of TPC and DPPH, both types of antioxidant activity were significantly affected by the independent variables, with roasting temperature and time showing a positive linear effect at p < 0.05, while ABTS and FRAP assays showed a positive relationship with roasting temperature but a negative relationship with roasting time. A positive interaction from the effects of roasting temperature and time was observed for TPC, ABTS and FRAP. The antioxidant activity of roasted tea increases with increasing roasting levels. This is due to development of the Maillard reaction during the roasting process [19]. The Maillard reaction could increase flavonol-related structure such as epicatechin by activating electron-donating groups through electrophilic aromatic substitution reaction [20]. Figure 2C–F illustrates the contour plots as a function of the two factors, roasting temperature and times.

3.3. Effect of Roasting Temperature and Time on Green Tea Catechin Content

In this study, catechin (C) and the catechin derivatives EGCG, epigallocatechin (EGC), epicatechin gallate (ECG) and epicatechin (EC) were analyzed using HPLC. Table 1 shows the mean catechin/derivative content in dried green tea leaves produced under different production conditions. For catechin fractions, C varied from 7.71 to 16.06 mg/g dried sample, EGCG from 4.54 to 18.51 mg/g dried sample, EGC from 0.15 to 9.63 mg/g dried sample, ECG from 2.88 to 17.76 mg/g dried sample and EC from 7.81 to 18.82 mg/g dried sample.
Roasting temperature and time significantly (p < 0.05) affected the content of catechin and derivatives (Table 2). It was found that the coefficient of determination R2 was between 0.913 and 0.993, confirming the suitability of the model to describe the relationship between the variables. This allowed the suitability of the surface model to respond to the experimental data to be acceptable. A value close to 1 indicated that the experimental and predicted values had a high degree of correlation.
According to the response surface contour plots in Figure 2G–K, the C content had a negative linear correlation with roasting temperature and time, as did that of EGC. The C and EGC content were lower when roasting temperature and time were increased. EGCG and ECG had a negative linear correlation with roasting temperature and a positive correlation with roasting time. An increase in roasting temperature decreased the EGCG and ECG content while an increase in roasting time increased the EGCG and ECG content. Both roasting temperature and time had a positive linear correlation with EC content: it was higher for increased roasting temperature and time.
A significant quadratic effect of roasting temperature and time was noted. EGCG, ECG and EC contents were slightly affected by a decrease in roasting temperature and time, while C and EGC contents were slightly affected by an increase in roasting temperature and decrease in roasting time. Roasting temperature had different significant effects on the content of catechin and derivatives. These changes showed two different patterns, a decrease with increasing roasting temperature (C, EGCG, EGC, ECG; p < 0.05) and an increase with increasing roasting temperature (EC; p < 0.05). These findings could reflect the epimerization of catechins during green tea processing. This is supported by the study of the stability of green tea catechin content by Khokhar and Magnusdottir [21], who found that steaming green tea leaves at high temperature (more than 120 °C) causes epimerization of C, EGCG, ECG, EGC and EC, which undergo conversion to suitable epimers: gallocatechin gallate (GCG), catechin gallate (CG) and gallocatechin (GC). In general, epimerization is the transformation of catechin into isomers, and this mechanism often occurs during processing. In this study, it can be seen that there was a decrease in individual catechins—C, EGCG, EGC and ECG—when roasting temperature was increased, caused by epimerization from the epistructure. Additionally, in their study on the effect of processing conditions on green tea leaves, Donlao and Ogawa [22] found that the epimerization of individual catechins was more pronounced at a higher drying temperature, and this behavior was indicated by a decrease in the amounts of catechins while their isomers increased: EGC and EGCG were changed to GC and GCG. Roasting time also had a significant effect on the content of catechin and derivatives (p < 0.05): an increase in roasting temperature decreased the content of catechin and derivatives. An increase in roasting time increased the EGCG, ECG and EC content, while C and EGC content decreased. Chen et al. [23] reported that catechin and derivatives are flavonols that have different molecules; during processing or infusion, small molecules are extracted and degraded more quickly than larger ones. In this study, it could be noticed that an increase in roasting time increased EGCG and ECG while C and EGC decreased because they are larger flavonol molecules; EGCG and ECG were extracted more slowly than C and EGC [23]. This is supported by Gramza et al. [24], who reported that during investigations on catechin migration to infusion, the smaller catechin molecules were extracted more quickly than larger ones.
Fresh tea leaves contain many catechins and their derivatives. However, in the processing of green tea, some amount of flavonols may be converted to oxidized catechin polymers, especially by the enzyme polyphenol oxidase (PPO), which transforms green tea catechin to theaflavins, the complex compound during the fermentation of tea leaves. Blocking the activity of PPO enzyme is a way to stop the transformation of catechin content [25]. The optimum temperature of PPO is 30 °C [26], with a notable decrease in PPO activity being observed at temperatures above 40 °C [27]. There are two processes for inactivating PPO, the use of chemical inhibitors and the use of mechanical methods. Inactivation by mechanical methods using heat during processing for a short period is the best way to retain catechin content and good quality and taste attributes of tea such as color, aroma and tea leaf texture [24]. Gejima and Nagata [28] prevented fermentation by inactivating PPO by steaming tea leaves for 20–60 min, while Friedman et al. [17] pan-fried or roasted tea for 10 min and then dried it. Roasting temperature and time affect the PPO enzyme during processing. Nguyen et al. [29] reported that in addition to denaturation, irreversible reactions such as deamination and peptide bond cleavage also occur at a temperature of 100 °C and above. A study characterizing PPO in green tea leaves found that increasing temperature indicated that the enzyme was less thermostable at higher temperatures. Cloughley [30] also reported that PPO activity decreased with increasing temperature. Nguyen et al. [29] found that PPO enzyme activity decreased significantly when roasting temperature was increased during oolong tea processing. This is because during the roasting process, the moisture content and PPO activity are decreased by increasing the roasting temperature and time. Ullah and Roy [31] attributed the loss of PPO activity to the loss of moisture during processing.

3.4. Effect of Roasting Temperature and Time on Green Tea Sensory Acceptance

Undertreatment causes browning of the leaves, whereas overtreatment leads to burning, which will present off-notes in the flavor of tea [31]. PPO is one of the key enzymes affecting the sensory taste of green tea. During the roasting process, an increase in roasting temperature damages the PPO enzyme, preventing it from changing green tea catechin to theaflavin (green tea to black tea), so the sensory taste of tea infusion is better than when using a lower roasting temperature [32]. Similarly to this study, Table 3 shows sensory scores for tea infusions obtained from tea leaves processed with different roasting temperatures and times. At a lower tea roasting temperatures, sensory scores were lower than those for tea roasted at higher temperatures. This is supported by the results of Donlao and Ogawa [22], who found that the variation in catechins due to variable processing conditions was a key factor influencing constituent differences in the final tea infusion. The contents of five catechin compounds (C, EGCG, EGC, ECG and EC) were all significantly affected by roasting temperature [22]. Wang et al. [33] reported that green tea roasted at 300 °C requires a shorter drying time than that roasted at 200 °C. Generally, thermal degradation during the drying process depends on both temperature and time. Drying time also affected the chlorophyll in green tea leaves. A short drying time may cause less chlorophyll degradation. Chlorophyll is released from the dried leaves into the water during the infusion. This contributes to the greenness of brewed tea. It may also increase the turbidity of tea beverages, and this increase might represent an adverse effect on the sensory characteristics of the tea.

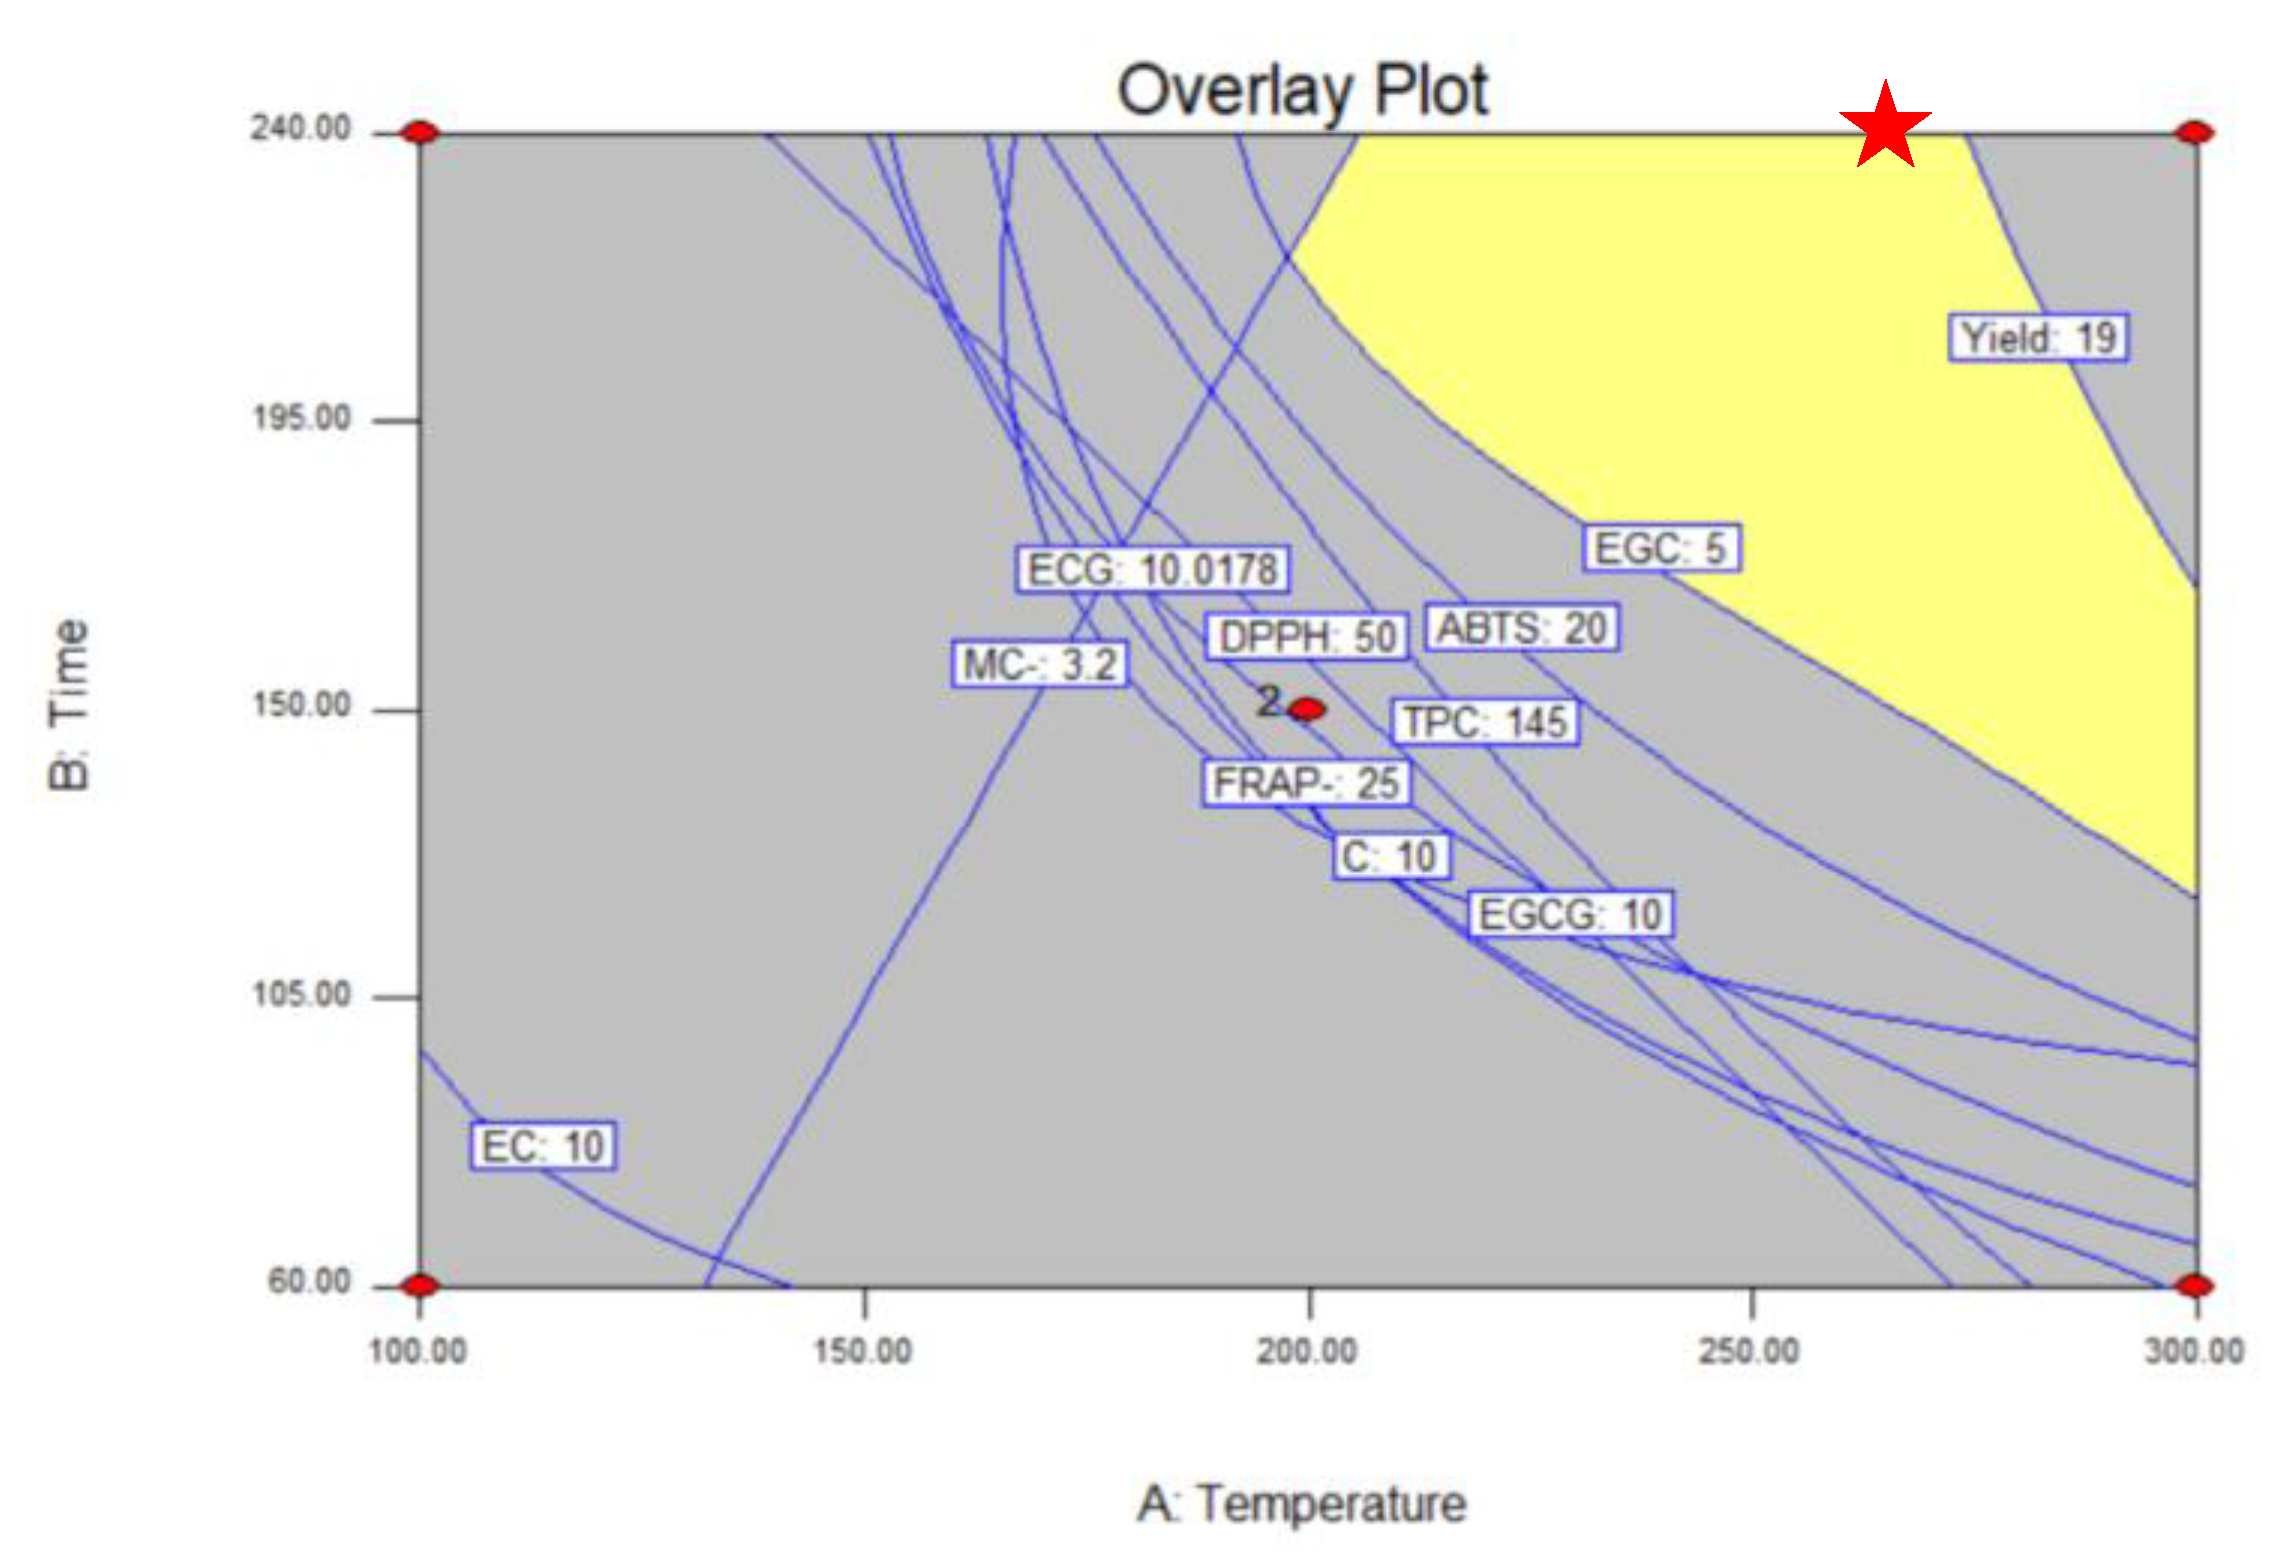
3.5. Optimization of the Roasting Process

For roasting temperature and time to be considered desirable, they should at least provide these characteristics: (1) high production yield, antioxidant activity and content of catechin and derivatives, (2) low moisture content and water activity [19]. It was found that the characteristics of all responses to temperature and roasting time obtained from this study were consistent with those characteristics. Upon merging and overlapping the concurrent optimized contour plot of all responses, the optimal roasting process was reached by roasting at 270 °C for 240 s, as illustrated by the optimum area as shown in Figure 3.
Verification of predicted and observed values for all parameters of the selected model were similar, with slight discrepancies. The verified experimental values obtained for production yield, moisture content, TPC, DPPH, ABTS, FRAP, C, EGCG, EGC, ECG and EC were 58.2 ± 3.6%, 3.0 ± 0.1%, 180.25 ± 5.44 mg GAE/g dw, 65.87 ± 4.23 mg GAE/g dw, 33.43 ± 2.21 mg GAE/g dw, 26.20 ± 1.56 mg GAE/g dw, 15.98 ± 0.87 mg/g dw, 17.74 ± 1.01 mg/g dw, 9.25 ± 0.75 mg/g dw, 16.32 ± 1.11 mg/g dw and 19.81 ± 0.88 mg/g dw, respectively. This will make it possible to minimize the degradation of catechins, which are endowed with high antioxidant activity. The experimental error for the 11 parameters ranged from 2.57% to 12.82%. It can be concluded that there was little variance between the predicted and experimental values, indicating that the fitted model for green tea roasting is satisfactory and reliable.

3.6. Effect of Extraction Method on Catechin Content

Green tea leaves for the evaluation of extraction methods were processed using the optimum roasting temperature and time from the previous experiment. Extraction of catechin is the major step required for human consumption of tea [34]. It has been proved that a higher temperature (100 °C) and prolonged extraction (2 h) leads to degradation of the bioactive molecules in tea [35]. Therefore, it is necessary to optimize the extraction methods at as low a temperature and as short a time as possible.

3.6.1. Effect of Ultrasonic Assisted Extraction (UAE)

The choice of solvent for extraction generally depends on the solubility of the desired components, the polarity of desired and undesirable components, and overall cost and safety [33]. The most widely used solvents for extracting phenolic compounds are methanol, ethanol, acetone and water [36]. Grujic et al. [37] reported that UAE of green tea using ethanol resulted in favorable properties such as a higher yield of extract and bioactive compounds. Chew et al. [38] reported that using 60% ethanol for UAE of green tea yields higher catechin content than using 50% and 40% ethanol. In this study, 60% v/v ethanol was used for UAE. From Table 4, the extraction yield of turmeric extracts by UAE was 4.02%. The polarity of ethanol is an important factor affecting extraction yield, as it increases cell wall permeability and improves extraction yield [38]. Ultrasonic power of 150 W and ultrasound frequency of 20 kHz were selected as a suitable parameters for green tea extraction by Lee et al. [10]. Most of the UAE mechanism involves the propagation of ultrasound pressure waves within the medium. This is followed by the formation of cavitation bubbles. The bubbles burst and microturbulence occurs. This disrupts the cell membrane to increase biomass permeability and accelerate the decomposition of the target solvent into its constituents [39]. The TPC of extracts was 395.13 mg GAE/g, and the DPPH antioxidant activity was 130.71 mg GAE/g (Table 4). The contents of C, EGCG, EGC, ECG and EC were 48.08, 52.00, 40.19, 43.63 and 44.82 mg/g, respectively. When the ultrasonic power is too high, the extracted compounds might deteriorate. Therefore, ultrasonic power must be optimized before extraction [40]. Swamy and Narayana [41] reported that at high frequencies, the rarefraction cycle during which the bubbles grow to a large size shortens the energy storage time, reducing the severity of cavitation. In this study, the temperature of the solvent during extraction was controlled (40–45 °C), although an increase in temperature may result in increased opening of the matrix cells and the catechin available for extraction. However, the deterioration of the active ingredient can occur at significantly higher temperatures, resulting in reduced recovery. UAE is suitable for the extraction of catechins, as it increases the efficiency of the lower temperature extraction process and maintains the product’s medicinal value [42].

3.6.2. Effect of Microwave-Assisted Extraction (MAE)

The type of solvent is one of the important parameters for MAE [40]. Solvent selection was considered for the affinity with the target compounds and its ability to absorb microwave energy. Many organic solvents have been used to extract green tea leaves. From their study of green tea extraction solvents, Pan et al. [41] reported that more bioactive molecules were extracted using 60% ethanol as solvent than with other solvents such as methanol, water and acetone, respectively. They also reported that when the proportion of ethanol in the solvent was higher than 60% v/v, the extraction yield decreased because 60% ethanol was found to have the optimum dielectric constant, viscosity and solubility for the target compound. For this study, 60% v/v ethanol was employed for MAE. Table 4 shows that the extraction yield of green tea extracts by MAE was 8.46%. MAE has been recognized as a useful technique for improving the diffusion of solvent and extraction of bioactive compounds. Absorption of the transmitted microwave energy by the medium converts it to thermal energy by ionic conduction and dipole rotation. When microwaves pass through a biomass, the drastic rise in temperature causes vaporization of internal water and in turn disrupts the cell wall and plasma membrane of the biomass. Increased permeability of solvent to the cell matrix enhances the yield by dissolving the target molecules at elevated temperature [42]. The parameters that affect the yield of bioactive molecules by MAE are microwave power, duration and solvent, in the following order: microwave power > duration time > solvent [43]. MAE is suitable for fast extraction of polyphenols from green tea leaves. The medicinal and food industries would benefit from microwave extraction (MAE), which is safe, rapid, and more eco-friendly than TDE methods [44].

3.6.3. Effect of Traditional Extraction (TDE)

The widely used conventional systems for phytochemical recovery are mainly Soxhlet extraction, maceration and reflux. Soxhlet extraction of green tea shows better results than maceration and reflux [45]. To evaluate the efficiency of the examined methods for green tea extraction, Soxhlet extraction was considered as the base method for extraction yield, bioactive compounds and catechin content. Soxhlet extraction is one of the most common extraction techniques, wherein a high temperature and long extraction time are used. For this reason, thermosensitive active molecules undergo degradation during the process as well as incomplete extraction [46]. Moreover, the extraction efficacy of this type of system mostly depends on solvent selection according to polarity and proper heat treatment. The solvent should be easy to remove and inert. Wang and Hu [9] reported that 60–70% ethanol is the optimal extraction solution for tea using Soxhlet extraction. In this study, the TDE method of Wang and Hu [9] was selected, and 60% ethanol was used. From Table 4, it can be seen that the yield obtained by extraction using TDE was 3.25%. Zhang et al. [40] reported that a disadvantage of this extraction method is constant heating at the boiling point of the solvent and the long duration, which can damage thermolabile compounds. The TPC of extracts was 378.63 mg GAE/g, and the DPPH antioxidant activity was 127.05 mg GAE/g (Table 4). The contents of C, EGCG, EGC, ECG and EC were 41.68, 49.77, 38.56, 46.63 and 51.46 mg/g respectively.

3.6.4. Comparison of UAE, MAE and TDE

For comparison of green tea extraction methods, UAE and MAE were used as novel extraction methods and TDE was used as the reference method. In previous studies, polyphenols were extracted using a traditional extraction technique such as Soxhlet extraction. However, novel methods such as UAE and MAE, which can reduce operating time and achieve a better yield of bioactive compounds, have been widely used in recent years [47]. Previously the extraction times for curcuminoid extraction by UAE, MAE and TDE were determined as 26 min, 10 min and 5 h, respectively. Moreover, the yields of green tea extracted by UAE, MAE and TDE were significantly different (p < 0.05). MAE showed the highest extraction yield, followed by UAE and TDE, because the high temperature and long duration of UAE and TDE led to degradation of polyphenols [48]. The bioactive compounds such as antioxidants determined by TPC, DPPH and FRAP activity and the contents of C, EGCG, EGC, ECG and EC from three different extraction methods are rarely compared, and this was the aim of this work. Table 4 and Figure 3 show that MAE produced the highest content of bioactive compounds and catechins, followed by UAE and TDE (p < 0.05). This result is suppoerted by Wang et al. [9], who reported that the new extraction rate was 27% more efficient than conventional extraction. The results can be attributed to the dual heating phenomenon of the solvent and the sample matrix used. This shows that the traditional extraction method does not perform effective extraction of green tea compared to MAE and UAE. This result was similar to that of Wang et al. [9], who compared green tea extracts produced by MAE and TDE and found that the extraction yield and TPC were higher for MAE than TDE. According to Horzic et al. [46], who compared UAE and TDE, the extraction yield and antioxidant capacity of UAE extracts are higher than those from TDE. It can be assumed that MAE is a more powerful extraction method than UAE and TDE. This may be due to the enhanced ease of penetration by solvent molecules into plant material, followed by the enhanced rate of extraction [49]. As mentioned earlier, sonication induces cavitation that causes plant cell wall disruption and allows the solvent to penetrate the plant matrix, resulting in the enhancement of green tea extraction by UAE. Meanwhile, a microwave oven works by passing microwave radiant energy into the solvent, altering the conformation of cells. As a result, plant cell walls are disrupted, and the extraction process is thus facilitated even more [50]. Thus, a reduction in extraction temperature and time are the major advantages of UAE and MAE when compared to TDE.

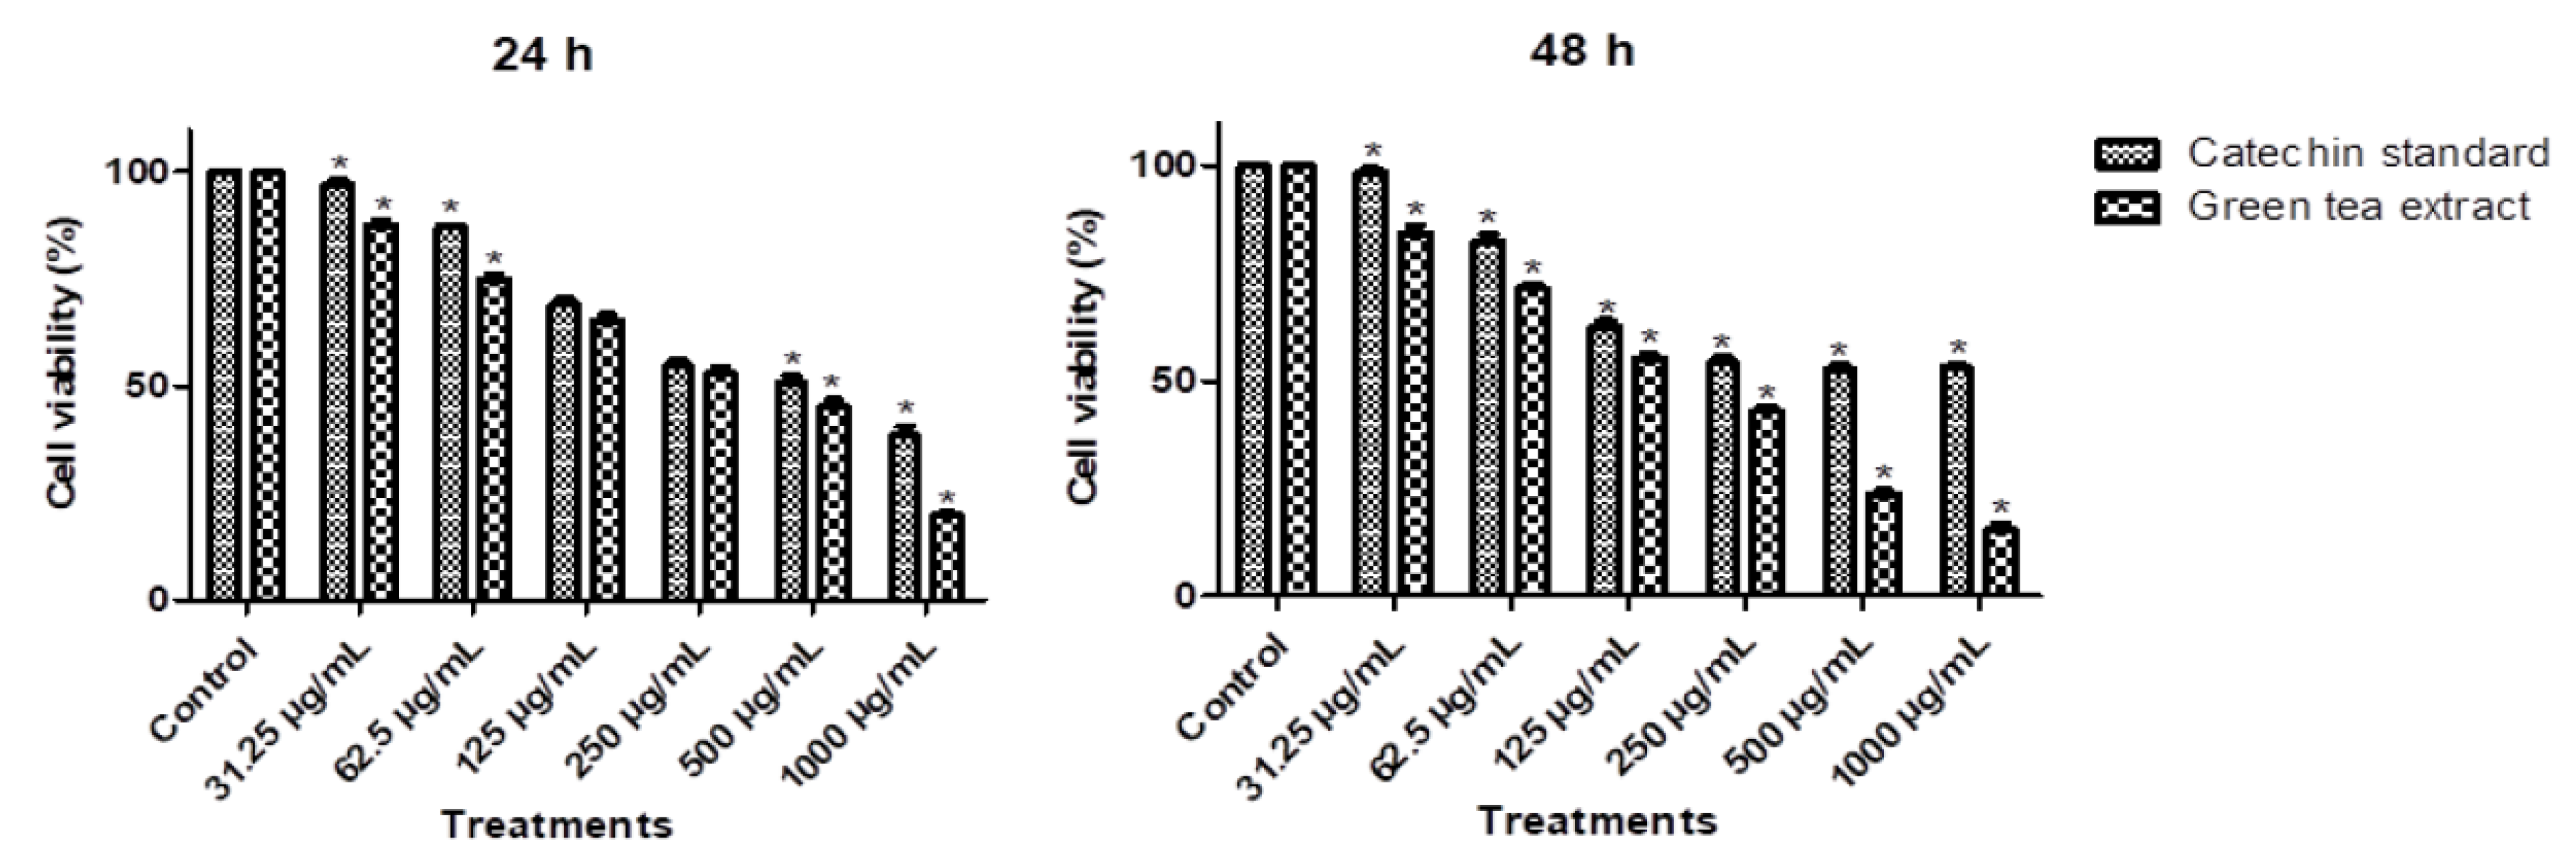
3.7. Anticancer Activity of Green Tea Extracts

As already reported, green tea extracts have a strong anti-proliferative effect on cancer cells. As shown by the MTT assay in Figure 4, green tea extracts caused an obvious inhibition of Huh-7 cell viability at various concentrations (0, 31.25, 62.5, 125, 250, 500 and 1000 µg/mL) for 24 and 48 h, as did catechin standards (0, 31.25, 62.5, 125, 250, 500 and 1000 µg/mL; Merck, Darmstadt, Germany) for 24 and 48 h. The inhibitory effect was increased on increasing the concentration. The IC50 values of green tea extracts were 250 µg/mL for both 24 and 48 h, while those of the green tea standard were 500 µg/mL for both 24 and 48 h. Green tea standard has a weaker effect than green tea extracts [50]. There is growing interest in using green tea extracts as a new cancer treatment, owing to their advantages of high content in bioactive compounds and low toxicity. Nakachi et al. [51] reported that drinking more than 10 cups of green tea slowed the onset of cancer among the general population, so the concentrated extract is one of the best choices for consuming less but still obtaining a high content of bioactive compounds. The different extraction techniques will alter the bioactive ingredients observed in extracted materials [52,53]. These extracted compounds could affect their potential cellular interactions and efficacy in cellular models, as observed by Peng et al. [54]. Thus further, work is required to evauate these compounds and their nutritional profiles.

4. Conclusions

Though numerous studies have reported the advantages of green tea, data on the roasting process and extraction methods were limited. The present study investigated optimizing the roasting process by using a roasting treatment temperature (100–300 °C) and time (60–240 s) to achieve optimal production yield, antioxidant activities and catechin contents. The results showed that both roasting temperature and time affected the production yield, moisture content, and antioxidant activities including TPC, DPPH, ABTS and FRAP. Catechin contents including C, EGCG, EGC, ECG and EC were also affected. The roasting temperature and time of 270 °C and 240 s, respectively, were chosen as optimal conditions, because they produced extracts with high antioxidant activities and catechin contents but low moisture content. Catechin and catechin derivatives were extracted by three methods; traditional extraction, microwave assisted extraction and ultrasonic extraction with 60% ethanol solvent. The results showed that extraction of green tea using MAE at 600 watts for 10 min achieved highly efficient extraction of catechin and other bioactive compounds. However, an attempt was made in this study to assess the extraction efficiency, high extraction yield, and possible separation of active ingredients. Microwave-assisted extraction and ultrasonic extraction were shown to be efficient methods for the extraction of tea leaves and, hence, can be adopted on a large scale for the extraction and isolation of bioactive components. The MAE extracts also possessed good anticancer activities.

Author Contributions

Conceptualization, K.S., S.S., T.C., W.K., C.S.B. and M.A.B.; Data curation, K.S. and N.U.-a.; Methodology, K.S. and N.U.-a.; Project Administration, K.S.; Software, K.S. and N.U.-a.; Supervision, N.U.-a.; Validation, K.S. and N.U.-a.; Visualization, K.S.; Writing—original draft, K.S.; Writing—review and editing, S.S., T.C., W.K., C.S.B., M.A.B. and N.U.-a. All authors have read and agreed to the published version of the manuscript.

Funding

This research was funded by Research and Researchers for Industries scholarship (RRI, code PHD62I0004) under the Thailand Research Fund (TRF) for providing financial support.

Institutional Review Board Statement

The study was conducted in accordance with the Declaration of Helsinki, and approved by Ethics Committee of Chiang Mai university Research Ethics Committee (CMUREC No.63/157; approved date 110920). This informed consent form was received involving human participants.

Informed Consent Statement

Informed consent was obtained from all subjects involved in the study.

Data Availability Statement

The data generated during the current study are available from the corresponding author on reasonable request.

Acknowledgments

The authors gratefully acknowledge Research and Researchers for Industries scholarship (RRI, code PHD62I0004) under the Thailand Research Fund (TRF) for providing financial support. This research work was partially supported by Chiang Mai University. Moreover, we would like to thank the Raming Tea Co., Ltd., Chiang Mai, Thailand, for material support.

Conflicts of Interest

All authors declared no conflict of interest.

Abbreviations

TRtreatment
CCDcentral composite design
Yield after roastingproduction yield after roasting: calculated as the ratio of weight of fresh green tea leaves before processing to that of roasted green tea leaves
Yield after dryingproduction yield after drying: calculated as the ratio of weight of fresh green tea leaves before processing to that of dried green tea leaves
MCmoisture content
awwater activity
DWdry weight
TPCtotal phenolic content
GAEgallic acid equivalent
DPPH2,2-diphenyl-l-picryl-hydrazyl
FRAPferric reducing antioxidant power
ABTS2,2′-azino-bis(3-ethylbenzthiazoline)-6-sulfonic acid
MAEmicrowave-assisted extraction
UAEultrasonic-assisted extraction
TDEtraditional extraction
Ccatechin
EGCGepigallocatechin gallate
EGCepigallocatechin
ECGepicatechin gallate
ECepicatechin
PPOpolyphenol oxidase

References

  1. Moderno, P.M.; Carvalho, M.; Silva, B.M. Recent patents on Camellia sinensis: Source of health promoting compounds. Recent Pat. Food Nutr. Agric. 2009, 1, 182–192. [Google Scholar] [CrossRef] [PubMed]
  2. Yuan, J.-M.; Sun, C.; Butler, L.M. Tea and cancer prevention: Epidemiological studies. Pharmacol. Res. 2011, 64, 123–135. [Google Scholar] [CrossRef] [PubMed] [Green Version]
  3. Carvalho, M.; Jerónimo, C.; Valentão, P.; Andrade, P.B.; Silva, B.M. Green tea: A promising anticancer agent for renal cell carcinoma. Food Chem. 2010, 122, 49–54. [Google Scholar] [CrossRef]
  4. Zhu, Y.-M.; Dong, J.-J.; Jin, J.; Liu, J.-H.; Zheng, X.-Q.; Lu, J.-L.; Liang, Y.-R.; Ye, J.-H. Roasting process shaping the chemical profile of roasted green tea and the association with aroma features. Food Chem. 2021, 353, 129428. [Google Scholar] [CrossRef] [PubMed]
  5. Kim, H.-J.; Han, J.-A.; Lim, S.-T.; Cho, D.-H. Effects of germination and roasting on physicochemical and sensory characteristics of brown rice for tea infusion. Food Chem. 2021, 350, 129240. [Google Scholar] [CrossRef] [PubMed]
  6. Liu, X.; Liu, Y.; Li, P.; Yang, J.; Wang, F.; Kim, E.; Wu, Y.; He, P.; Li, B.; Tu, Y. Chemical characterization of Wuyi rock tea with different roasting degrees and their discrimination based on volatile profiles. RSC Adv. 2021, 11, 12074–12085. [Google Scholar] [CrossRef]
  7. Xu, Y.-Q.; Ji, W.-B.; Yu, P.; Chen, J.-X.; Wang, F.; Yin, J.-F. Effect of extraction methods on the chemical components and taste quality of green tea extract. Food Chem. 2018, 248, 146–154. [Google Scholar] [CrossRef]
  8. Das, P.R.; Eun, J.-B. A comparative study of ultra-sonication and agitation extraction techniques on bioactive metabolites of green tea extract. Food Chem. 2018, 253, 22–29. [Google Scholar] [CrossRef]
  9. Wang, L.; Qin, P.; Hu, Y. Study on the microwave-assisted extraction of polyphenols from tea. Front. Chem. Eng. China 2010, 4, 307–313. [Google Scholar] [CrossRef]
  10. Lee, L.-S.; Lee, N.; Kim, Y.H.; Lee, C.-H.; Hong, S.P.; Jeon, Y.-W.; Kim, Y.-E. Optimization of ultrasonic extraction of phenolic antioxidants from green tea using response surface methodology. Molecules 2013, 18, 13530–13545. [Google Scholar] [CrossRef] [Green Version]
  11. AOAC. Official Methods of Analysis of AOAC International, 18th ed.; 33.2.11 (method 991.20); 33.2.27A (method 2000.18); AOAC International: Gaitherburg, MD, USA, 2006. [Google Scholar]
  12. Izzreen, N.Q.; Mohd Fadzelly, A. Phytochemicals and antioxidant properties of different parts of Camellia sinensis leaves from Sabah Tea Plantation in Sabah, Malaysia. Int. Food Res. J. 2013, 20, 307. [Google Scholar]
  13. Mensor, L.L.; Menezes, F.S.; Leitão, G.G.; Reis, A.S.; Dos Santos, T.C.; Coube, C.S.; Leitão, S.G. Screening of Brazilian plant extracts for antioxidant activity by the use of DPPH free radical method. Phyther. Res. 2001, 15, 127–130. [Google Scholar] [CrossRef] [PubMed]
  14. Benzie, I.F.F.; Strain, J.J. The ferric reducing ability of plasma (FRAP) as a measure of “antioxidant power”: The FRAP assay. Anal. Biochem. 1996, 239, 70–76. [Google Scholar] [CrossRef] [PubMed] [Green Version]
  15. Re, R.; Pellegrini, N.; Proteggente, A.; Pannala, A.; Yang, M.; Rice-Evans, C. Antioxidant activity applying an improved ABTS radical cation decolorization assay. Free Radic. Biol. Med. 1999, 26, 1231–1237. [Google Scholar] [CrossRef]
  16. Jaganathan, S.K.; Supriyanto, E.; Mandal, M. Events associated with apoptotic effect of p-Coumaric acid in HCT-15 colon cancer cells. World J. Gastroenterol. WJG 2013, 19, 7726. [Google Scholar] [CrossRef] [PubMed]
  17. Friedman, M.; Levin, C.E.; Lee, S.; Kozukue, N. Stability of green tea catechins in commercial tea leaves during storage for 6 months. J. Food Sci. 2009, 74, H47–H51. [Google Scholar] [CrossRef] [PubMed]
  18. Saloko, S.; Sulastri, Y.; Murad, M.; Rinjani, M.A. The effects of temperature and roasting time on the quality of ground Robusta coffee (Coffea rabusta) using Gene Café roaster. In Proceedings of the AIP Conference Proceedings, 23 December 2019; AIP Publishing LLC: Melville, NY, USA, 2019; Volume 2199, p. 60001. [Google Scholar]
  19. Şahin, H.; Topuz, A.; Pischetsrieder, M.; Özdemir, F. Effect of roasting process on phenolic, antioxidant and browning properties of carob powder. Eur. Food Res. Technol. 2009, 230, 155–161. [Google Scholar] [CrossRef]
  20. Lund, M.; Ray, C. Control of maillard Reactions in foods: Strategies and chemical mechanisms. J. Agric. Food Chem. 2017, 65, 4537–4552. [Google Scholar] [CrossRef] [Green Version]
  21. Khokhar, S.; Magnusdottir, S.G.M. Total phenol, catechin, and caffeine contents of teas commonly consumed in the United Kingdom. J. Agric. Food Chem. 2002, 50, 565–570. [Google Scholar] [CrossRef]
  22. Donlao, N.; Ogawa, Y. The influence of processing conditions on catechin, caffeine and chlorophyll contents of green tea (Camelia sinensis) leaves and infusions. LWT 2019, 116, 108567. [Google Scholar] [CrossRef]
  23. Chen, C.-N.; Liang, C.-M.; Lai, J.-R.; Tsai, Y.-J.; Tsay, J.-S.; Lin, J.-K. Capillary electrophoretic determination of theanine, caffeine, and catechins in fresh tea leaves and oolong tea and their effects on rat neurosphere adhesion and migration. J. Agric. Food Chem. 2003, 51, 7495–7503. [Google Scholar] [CrossRef] [PubMed]
  24. Gramza, A.; Khokhar, S.; Yoko, S.; Gliszczynska-Swiglo, A.; Hes, M.; Korczak, J. Antioxidant activity of tea extracts in lipids and correlation with polyphenol content. Eur. J. Lipid Sci. Technol. 2006, 108, 351–362. [Google Scholar] [CrossRef]
  25. Ünal, M.Ü.; Taş, C.; Şener, A. Determination of biochemical properties of polyphenol oxidase from domat olives. Gida 2011, 36, 185–192. [Google Scholar]
  26. Ünal, M.Ü.; Yabaci, S.N.; Şener, A. Extraction, partial purification and characterisation of polyphenol oxidase from tea leaf (Camellia sinesis). Gida 2011, 36, 137–144. [Google Scholar]
  27. Baruah, A.M. Fermentation characteristics of some Assamica clones and process optimization of black tea manufacturing. J. Agric. Food Chem. 2003, 51, 6578–6588. [Google Scholar] [CrossRef] [PubMed]
  28. Gejima, Y.; Nagata, M. Basic study on Kamairicha tea leaves quality judgment system. In Proceedings of the 2000 ASAE Annual International Meeting, Milwaukee, WI, USA, 9–12 July 2000; pp. 1–10. [Google Scholar]
  29. Nguyen, H.T.H.; Ong, L.; Kentish, S.E.; Gras, S.L. Homogenisation improves the microstructure, syneresis and rheological properties of buffalo yoghurt. Int. Dairy J. 2015, 46, 78–87. [Google Scholar] [CrossRef] [Green Version]
  30. Cloughley, J.B. The effect of temperature on enzyme activity during the fermentation phase of black tea manufacture. J. Sci. Food Agric. 1980, 31, 920–923. [Google Scholar] [CrossRef]
  31. Ullah, M.R.; Roy, P.C. Effect of withering on the polyphenol oxidase level in the tea leaf. J. Sci. Food Agric. 1982, 33, 492–495. [Google Scholar] [CrossRef]
  32. Buchner, N.; Krumbein, A.; Rohn, S.; Kroh, L.W. Effect of thermal processing on the flavonols rutin and quercetin. Rapid Commun. Mass Spectrom. An Int. J. Devoted to Rapid Dissem. Up-to-the-Minute Res. Mass Spectrom. 2006, 20, 3229–3235. [Google Scholar] [CrossRef]
  33. Wang, Y.; Kan, Z.; Thompson, H.J.; Ling, T.; Ho, C.-T.; Li, D.; Wan, X. Impact of six typical processing methods on the chemical composition of tea leaves using a single Camellia sinensis cultivar, Longjing 43. J. Agric. Food Chem. 2018, 67, 5423–5436. [Google Scholar] [CrossRef]
  34. Friedman, M.; Kim, S.; Lee, S.; Han, G.; Han, J.; Lee, K.; Kozukue, N. Distribution of catechins, theaflavins, caffeine, and theobromine in 77 teas consumed in the United States. J. Food Sci. 2005, 70, C550–C559. [Google Scholar] [CrossRef]
  35. Perva-Uzunalić, A.; Škerget, M.; Knez, Ž.; Weinreich, B.; Otto, F.; Grüner, S. Extraction of active ingredients from green tea (Camellia sinensis): Extraction efficiency of major catechins and caffeine. Food Chem. 2006, 96, 597–605. [Google Scholar] [CrossRef]
  36. Hemwimon, S.; Pavasant, P.; Shotipruk, A. Microwave-assisted extraction of antioxidative anthraquinones from roots of Morinda citrifolia. Sep. Purif. Technol. 2007, 54, 44–50. [Google Scholar] [CrossRef]
  37. Grujic, N.; Lepojevic, Z.; Srdjenovic, B.; Vladic, J.; Sudji, J. Effects of different extraction methods and conditions on the phenolic composition of mate tea extracts. Molecules 2012, 17, 2518–2528. [Google Scholar] [CrossRef] [Green Version]
  38. Chew, K.K.; Khoo, M.Z.; Ng, S.Y.; Thoo, Y.Y.; Aida, W.W.M.; Ho, C.W. Effect of ethanol concentration, extraction time and extraction temperature on the recovery of phenolic compounds and antioxidant capacity of Orthosiphon stamineus extracts. Int. Food Res. J. 2011, 18, 1427. [Google Scholar]
  39. Shirsath, S.R.; Sonawane, S.H.; Gogate, P.R. Intensification of extraction of natural products using ultrasonic irradiations—A review of current status. Chem. Eng. Process. Process Intensif. 2012, 53, 10–23. [Google Scholar] [CrossRef]
  40. Lou, Z.; Wang, H.; Zhang, M.; Wang, Z. Improved extraction of oil from chickpea under ultrasound in a dynamic system. J. Food Eng. 2010, 98, 13–18. [Google Scholar] [CrossRef]
  41. Swamy, K.M.; Narayana, K.L. Intensification of leaching process by dual-frequency ultrasound. Ultrason. Sonochem. 2001, 8, 341–346. [Google Scholar] [CrossRef]
  42. Banerjee, S.; Chatterjee, J. Efficient extraction strategies of tea (Camellia sinensis) biomolecules. J. Food Sci. Technol. 2015, 52, 3158–3168. [Google Scholar] [CrossRef] [Green Version]
  43. Zhang, L.; Tu, Z.; Yuan, T.; Wang, H.; Fu, Z.; Wen, Q.; Wang, X. Solvent optimization, antioxidant activity, and chemical characterization of extracts from Artemisia selengnesis Turcz. Ind. Crops Prod. 2014, 56, 223–230. [Google Scholar] [CrossRef]
  44. Pan, X.; Niu, G.; Liu, H. Microwave-assisted extraction of tea polyphenols and tea caffeine from green tea leaves. Chem. Eng. Process. Process Intensif. 2003, 42, 129–133. [Google Scholar] [CrossRef]
  45. John, K.M.M.; Vijayan, D.; Kumar, R.R.; Premkumar, R. Factors influencing the efficiency of extraction of polyphenols from young tea leaves. Asian J. Plant Sci. 2006, 5, 123–126. [Google Scholar]
  46. Ananingsih, V.K.; Sharma, A.; Zhou, W. Green tea catechins during food processing and storage: A review on stability and detection. Food Res. Int. 2013, 50, 469–479. [Google Scholar] [CrossRef]
  47. Yeong, Y.L.; Pang, S.F.; Chong, S.Y.; Gimbun, J. Comparison of microwave and ultrasonic assisted extraction of kaempferol from Cassia alata. Int. J. Eng. Technol. 2018, 7, 84–89. [Google Scholar] [CrossRef]
  48. Xia, T.; Shi, S.; Wan, X. Impact of ultrasonic-assisted extraction on the chemical and sensory quality of tea infusion. J. Food Eng. 2006, 74, 557–560. [Google Scholar] [CrossRef]
  49. Horžić, D.; Jambrak, A.R.; Belščak-Cvitanović, A.; Komes, D.; Lelas, V. Comparison of conventional and ultrasound assisted extraction techniques of yellow tea and bioactive composition of obtained extracts. Food Bioprocess Technol. 2012, 5, 2858–2870. [Google Scholar] [CrossRef]
  50. Rha, C.-S.; Jeong, H.W.; Park, S.; Lee, S.; Jung, Y.S.; Kim, D.-O. Antioxidative, anti-inflammatory, and anticancer effects of purified flavonol glycosides and aglycones in green tea. Antioxidants 2019, 8, 278. [Google Scholar] [CrossRef] [Green Version]
  51. Nakachi, K.; Matsuyama, S.; Miyake, S.; Suganuma, M.; Imai, K. Preventive effects of drinking green tea on cancer and cardiovascular disease: Epidemiological evidence for multiple targeting prevention. Biofactors 2000, 13, 49–54. [Google Scholar] [CrossRef]
  52. Zhu, Y.; Zhang, J.; Chen, F.; Hu, X.; Xu, D.; Cao, Y. Epimerisation and hydrolysis of catechins under ultrasonic treatment. Int. J. Food Sci. Technol. 2021, 56, 312–320. [Google Scholar] [CrossRef]
  53. Huang, X.; Cao, H.; Guo, Y.; Liu, J.; Sun, Y.; Liu, S.; Lin, J.; Wei, S.; Wu, L. The dynamic change of oolong tea constitutes during enzymatic-catalysed process of manufacturing. Int. J. Food Sci. Technol. 2020, 55, 3604–3612. [Google Scholar] [CrossRef]
  54. Peng, Y.; Xi, J.; Sun, Y.; Chen, G.; Li, D.; Peng, C.; Wan, X.; Cai, H. Tea components influencing bioavailability of fluoride and potential transport mechanism in the Caco-2 cell line model. Int. J. Food Sci. Technol. 2020, 55, 1792–1799. [Google Scholar] [CrossRef]
Figure 1. Research methodology of green tea production using CCD experiment with varying roasting temperatures and roasting times. (A) Fresh green tea leaves were harvested, withered, roasted, rolled and dried. (B) Comparison of green tea extraction methods by UAE, MAE, TDE. (C) Direct microscopic observations of Huh7 cells treated with green tea extracts at 125 µg/mL under microscope with 10× magnification compared to untreated control.
Horticulturae 08 00338 g001
Figure 2. Response surface plots showing the effect of roasting temperature and time on production yield (A), moisture content (B), total phenolic content (C), DPPH (D), ABTS (E), FRAP (F), catechin (G), epigallocatechin gallate (H), epigallocatechin (I), epicatechin gallate (J), epicatechin (K).
Horticulturae 08 00338 g002
Figure 3. Response surface plots of optimized condition. The plots show the effect of roasting temperature and roasting time Horticulturae 08 00338 i001: optimum point.
Horticulturae 08 00338 g003
Figure 4. The viability of Huh7 cancer cells treated with standard catechin and green tea extracts at concentrations of 31.25, 62.5, 125, 250, 500, and 1000 µg/mL compared to untreated control. Cells were treated with the indicated concentrations for 24 h and 48 h using the MTT assay * (p < 0.05).
Horticulturae 08 00338 g004
Table 1. Operating parameters of roasting temperature and time for all 10 runs carried out according to the central composite design (CCD) and the responses for green tea production by CCD a.
TR bTemperature (°C)Time (s)Yield after Roasting c (%)Yield after Drying d (%)MC e (%)aWAntioxidant Activities
(mg GAE/ g DW f)
Catechin Content
(mg/g DW f)
TPCDPPHABTSFRAPCEGCGEGCECGEC
158.515066.020.73.10.3180.45 ± 6.8428.97 ± 0.5618.34 ± 1.2912.76 ± 0.657.71 ± 0.484.54 ± 0.300.15 ± 0.093.29 ± 0.867.97 ± 0.87
2100.06068.720.93.10.32124.60 ± 2.3948.14 ± 1.2324.23 ± 2.0617.77 ± 1.719.51 ± 1.246.95 ± 0.991.92 ± 0.253.63 ± 0.458.61 ± 0.53
3100.024064.020.63.20.30128.83 ± 4.1145.08 ± 3.8223.31 ± 1.3417.07 ± 1.559.59 ± 1.197.48 ± 0.872.18 ± 0.549.03 ± 1.4110.48 ± 1.28
4200.02268.021.23.20.31107.02 ± 5.8333.60 ± 1.6520.02 ± 1.7812.92 ± 0.828.77 ± 0.404.88 ± 0.630.50 ± 0.122.88 ± 0.217.81 ± 1.39
5200.015066.020.73.30.32154.63 ± 3.3453.56 ± 2.0126.98 ± 2.2821.11 ± 1.1210.11 ± 0.8810.57 ± 0.983.73 ± 0.439.92 ± 0.7513.45 ± 1.04
6200.015065.520.43.20.30168.28 ± 4.1255.43 ± 1.4627.03 ± 1.7720.78 ± 1.1310.24 ± 0.2910.51 ± 0.653.87 ± 0.2310.26 ± 1.1014.63 ± 1.63
7200.027763.520.33.10.29159.25 ± 7.0959.23 ± 1.2127.78 ± 1.6721.12 ± 2.1310.31 ± 0.4810.52 ± 0.674.99 ± 0.6910.77 ± 1.0417.20 ± 1.82
8300.06067.520.53.30.31148.98 ± 6.8851.88 ± 2.2225.76 ± 2.5319.45 ± 1.769.76 ± 0.937.30 ± 1.212.65 ± 0.3510.01 ± 2.0312.16 ± 0.77
9300.024058.018.53.20.31169.01 ± 4.4360.16 ± 0.9131.42 ± 2.3424.65 ± 1.3416.06 ± 0.8718.51 ± 0.679.63 ± 0.1917.76 ± 0.8418.82 ± 0.63
10341.515058.018.13.50.32169.64 ± 5.5659.50 ± 1.1428.51 ± 1.6722.88 ± 1.4814.01 ± 1.0114.41 ± 0.878.55 ± 0.2313.95 ± 1.7217.38 ± 0.88
a Values are the mean ± standard deviation (n = 3). b TR: treatment. c Production yield after roasting, calculated as the ratio of weight of fresh green tea leaves before processing to that of roasted green tea leaves. d Production yield after drying, calculated as the ratio of weight of fresh green tea leaves before processing to that of dried green tea leaves. e MC: moisture content of dried green tea leaves. f DW: dry weight.
Table 2. Regression equations for the responses affected by roasting temperature and time, and the evaluation parameters: coefficients of determination (adj-R2). ANOVA results: p-value and lack of fit.
FactorRegression Coefficient (β)
Yield after Drying (%)Moisture Content (%)Antioxidant Activities
(mg GAE/g DW2)
Catechin Content
(mg/g DW2)
TPCDPPHABTSFRAPCEGCGEGCECGEC
Constant (β0)20.5553.09786.11625.42114.72121.54111.9075.4242.117−4.0662.214
Linear
β1−0.450.00950.1720.0770.004880.00261−0.030−0.0062−0.019−0.00340.032
β2−0.78−0.00390.0480.057−0.0100−0.014−0.0200.0069−0.00390.0590.049
Quadratic
β11−0.58-----0.000060−0.000020.000041−0.000015−0.00007
β220.12-----−0.00001−0.00013−0.00005−0.00130−0.00009
Interaction
β12−0.43ns0.00043ns0.000160.000180.000170.002900.000180.00006540.00013
Adj−R20.95950.6900.71130.69520.78730.80530.91300.95910.99330.94220.9752
F18.965.054.936.657.408.278.3918.7642.1913.0331.5
p-value0.00690.04390.04660.02410.01930.01490.03030.00700.02330.01380.0026
Lack of fit0.41620.52080.33090.12930.07240.01140.05510.02140.08220.07090.5288
β0: intercept; β1: roasting temperature (°C); β2: roasting time (s); β11: roasting temperature (°C) x roasting temperature (°C); β12: roasting temperature (°C) x roasting time (s); β22: roasting time(s) x roasting time (s); Values are mean ± SD (n = 3).
Table 3. Hedonic score of sensory attributes of green tea leaves from 10 different roasting temperatures and times of production z.
TRTemperature (°C)Time (s)Sensory Scores
Tea Leaves-AppearanceTea Leaves-ColorAppearanceColorOverall Odor (ns)Green Tea Odor (ns)Overall FlavorGreen Tea FlavorOverall TasteBitter TasteSweet TasteAstringent TasteOverall Liking
158.51505.2 ± 0.5d5.1 ± 1.4cd7.0 ± 0.8 a6.5 ± 0.7 a6.9 ± 0.66,7 ± 0.95.8 ± 1.3 c5.1 ± 0.84.8 ± 1.0 c4.8 ± 1.2 d4.7 ± 1.3 c4.8 ± 1.4 d4.8 ± 1.4 d
2100.0605.1 ± 1.5 de4.7 ± 1.6 d5.7 ± 1.3 b5.1 ± 1.2 b6.8 ± 0.66.4 ± 1.36.0 ± 1.0 c6.1 ± 1.3 bcd6.1 ± 1.0 b6.0 ± 1.1 bcd5.9 ± 0.8 bc6.0 ± 1.1 abcd6.2 ± 1.2 bc
3100.02407.0 ± 05 ab7.0 ± 0.8 a7.1 ± 1.0 a6.8 ± 1.2 a6.6 ± 0.97.4 ± 0.96.5 ± 0.9 abc7.4 ± 0.5 cd6.0 ± 1.0 b6.4 ± 0.9 abc6.1 ± 1.1 ab6.1 ± 1.0 abcd6.1 ± 1.1 bcd
4200.0225.4 ± 0.9 cd5.4 ± 1.1 bcd6.7 ± 1.3 ab6.7 ± 1.1 a6.9 ± 0.86.7 ± 1.26.7 ± 0.7 abc6.0 ± 1.1 bcd6.1 ± 1.2 b5.4 ± 1.3 cd5.4 ± 1.1 bc5.4 ± 1.4 cd5.7 ± 1.3 cd
5200.01507.4 ± 0.7 a7.0 ± 0.8 a7.8 ± 1.0 a7.7 ± 1.1 a7.1 ± 1.27.0 ± 1.46.1 ± 0.1 bc6.0 ± 1.0 bcd6.0 ± 0.5 b5.6 ± 1.6 cd5.6 ± 1.1 bc5.8 ± 1.5 bcd6.1 ± 1.2 bcd
6200.01506.3 ± 04 bc6.4 ± 0.5 ab7.6 ± 0.5 a7.1 ± 0.6 a6.7 ± 0.96.8 ± 1.26.7 ± 0.7 abc6.5 ± 0.5 abc6.1 ± 1.2 b6.4 ± 1.1 abc6.4 ± 0.5 ab6.4 ± 0.7 abc6.5 ± 0.7 bc
7200.02776.6 ± 0.5 ab6.1 ± 1.4 abc7.6 ± 0.7 a7.4 ± 0.7 a7.7 ± 1.17.4 ± 1.17.1 ± 0.6 ab7.4 ± 0.5 a7.4 ± 0.7 a6.6 ± 0.5 abc6.4 ± 1.2 ab6.7 ± 1.2 abc7.1 ± 0.8 ab
8300.0607.3 ± 0.7 ab6.8 ± 0.8 a7.1 ± 0.8 a7.1 ± 1.2 a6.4 ± 0.76.0 ± 1.16.0 ± 0.8 c5.8 ± 1.2 cd5.7 ± 0.7 bc6.0 ± 0.8 bcd5.7 ± 1.1 bc6.0 ± 0.8 abcd6.0 ± 0.8 bcd
9300.02407.4 ± 0.8 a7.1 ± 0.7 a7.7 ± 0.7 a7.7 ± 0.7 a7.4 ± 1.17.2 ± 1.17.2 ± 0.4 a7.0 ± 0.8 ab7.5 ± 0.5 a7.4 ± 0.5 a7.4 ± 1.2 a7.4 ± 1.5 a8.0 ± 0.8 a
10341.51507.4 ± 1.2 a7.1 ± 0.6 a7.3 ± 0.9 a7.0 ± 1.2 a6.8 ± 1.56.7 ± 1.26.9 ± 0.8 abc6.3 ± 1.1 a7.5 ± 0.9 a7.2 ± 1.3 ab6.7 ± 1.3 ab7.0 ± 1.2 ab7.2 ± 0.9 ab
z Values are the mean ± standard deviation (n = 50). a–d represent significant differences in the same columns at p < 0.05; ns: not significant (p > 0.05) within the same column.
Table 4. Extraction yield, moisture content, antioxidant properties: total phenolic content, DPPH and catechin contents of roasting green tea extracted by different extraction techniques 1.
Extraction Technique
MAEUAETDE
Extraction yield (%, DW)8.46 ± 1.43 a4.02 ± 0.88 b3.25 ± 0.65 c
Moisture content (%)12.21 ± 2.74 b13.09 ± 1.23 a11.55 ± 1.74 c
TPC (mg GAE/g DW)462.87 ± 8.23 a395.13 ± 10.64 b378.63 ± 7.71 c
DPPH (mg GAE/g DW)165.02 ± 13.48 a130.71 ± 14.11 b127.05 ± 10.55 b
C (mg/g DW)72.53 ± 6.37 a48.08 ± 6.24 b41.86 ± 2.61 c
EGCG (mg/g DW)76.74 ± 7.76 a52.99 ± 4.94 b49.77 ± 16.62 b
EGC (mg/g DW)52.25 ± 4.50 a40.19 ± 8.73 b38.56 ± 6.91 b
ECG (mg/g DW)61.71 ± 4.91 a43.63 ± 1.92 b46.63 ± 4.41 b
EC (mg/g DW)69.6 ± 4.21 a44.82 ± 6.73 c51.46 ± 4.80 b
1 values are the mean ± standard deviation (n = 3). Means within each column followed by MAE: microwave assisted extraction; UAE: ultrasonic assisted extraction; TDE: traditional extraction; DW: dry weight; a–c represent significant difference in the rows at p > 0.05.
Publisher’s Note: MDPI stays neutral with regard to jurisdictional claims in published maps and institutional affiliations.

