
Fractional Flow Reserve Derived from Computer Tomography in Asymptomatic Patients with Type 2 Diabetes and Albuminuria without Significant Coronary Artery Stenosis—A Surrogate for Coronary Microvascular Dysfunction?

 and
and
Abstract
:1. Introduction
2. Methods
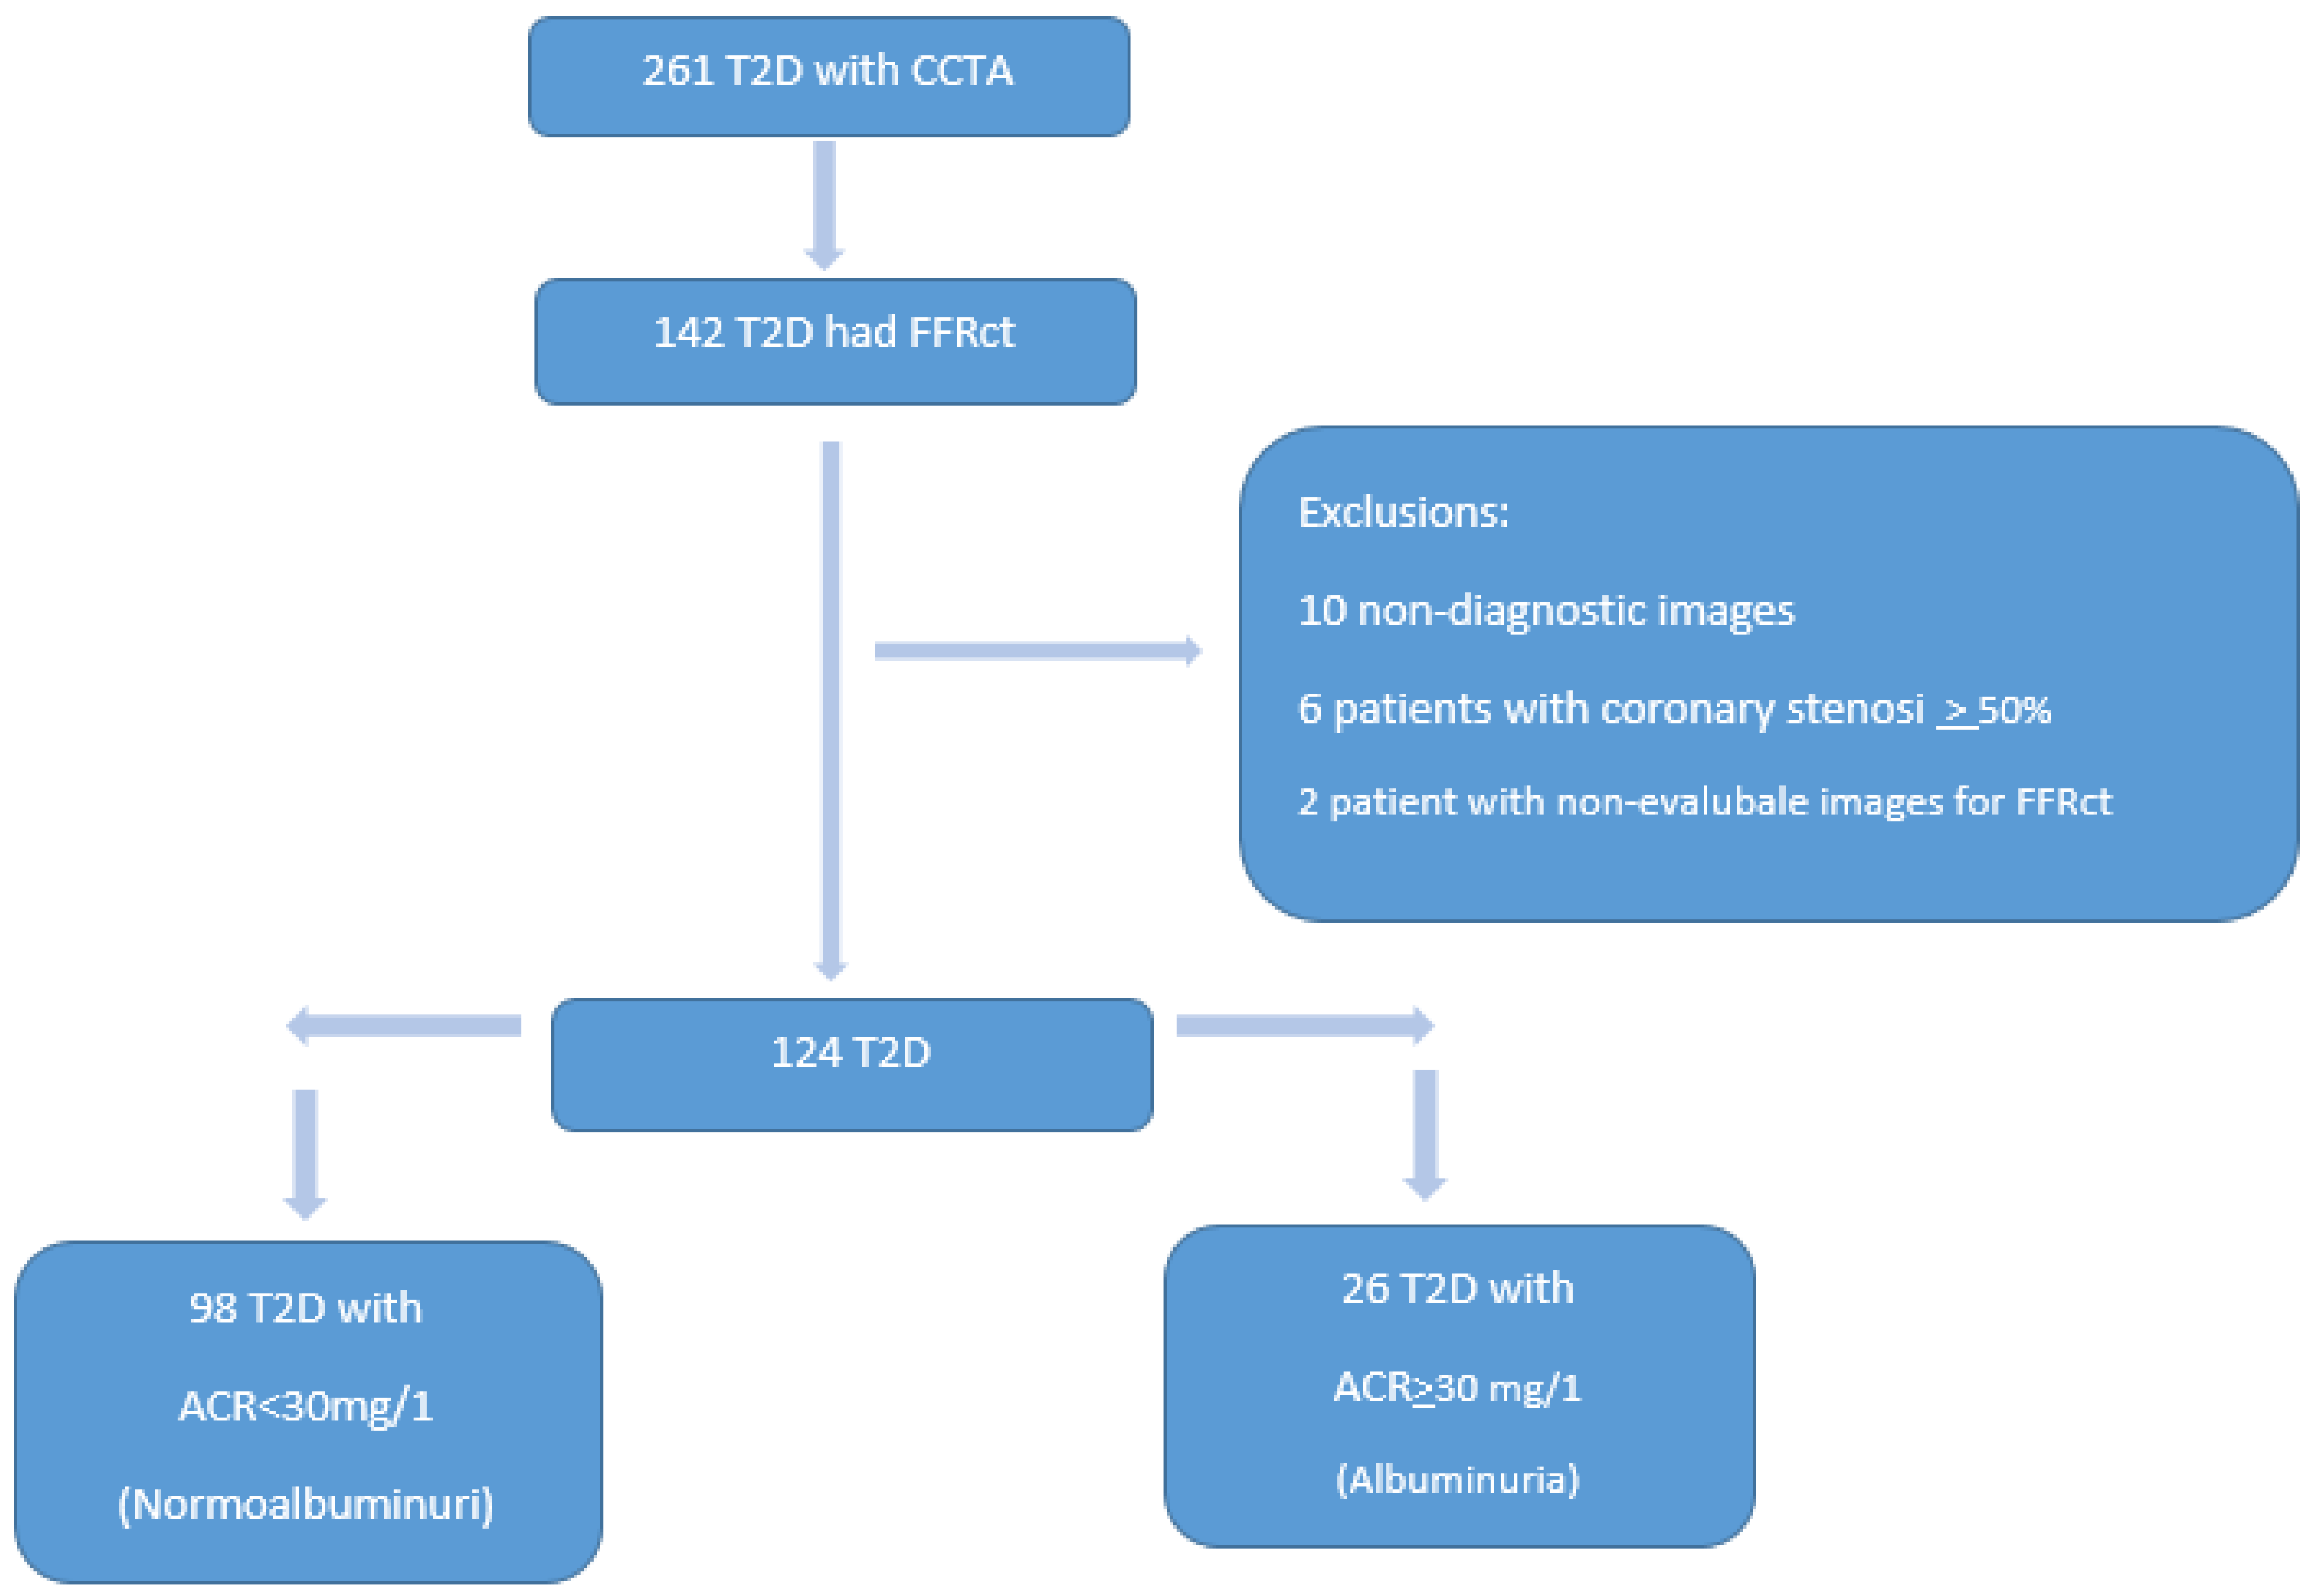
2.1. Study Populations
2.2. CCTA
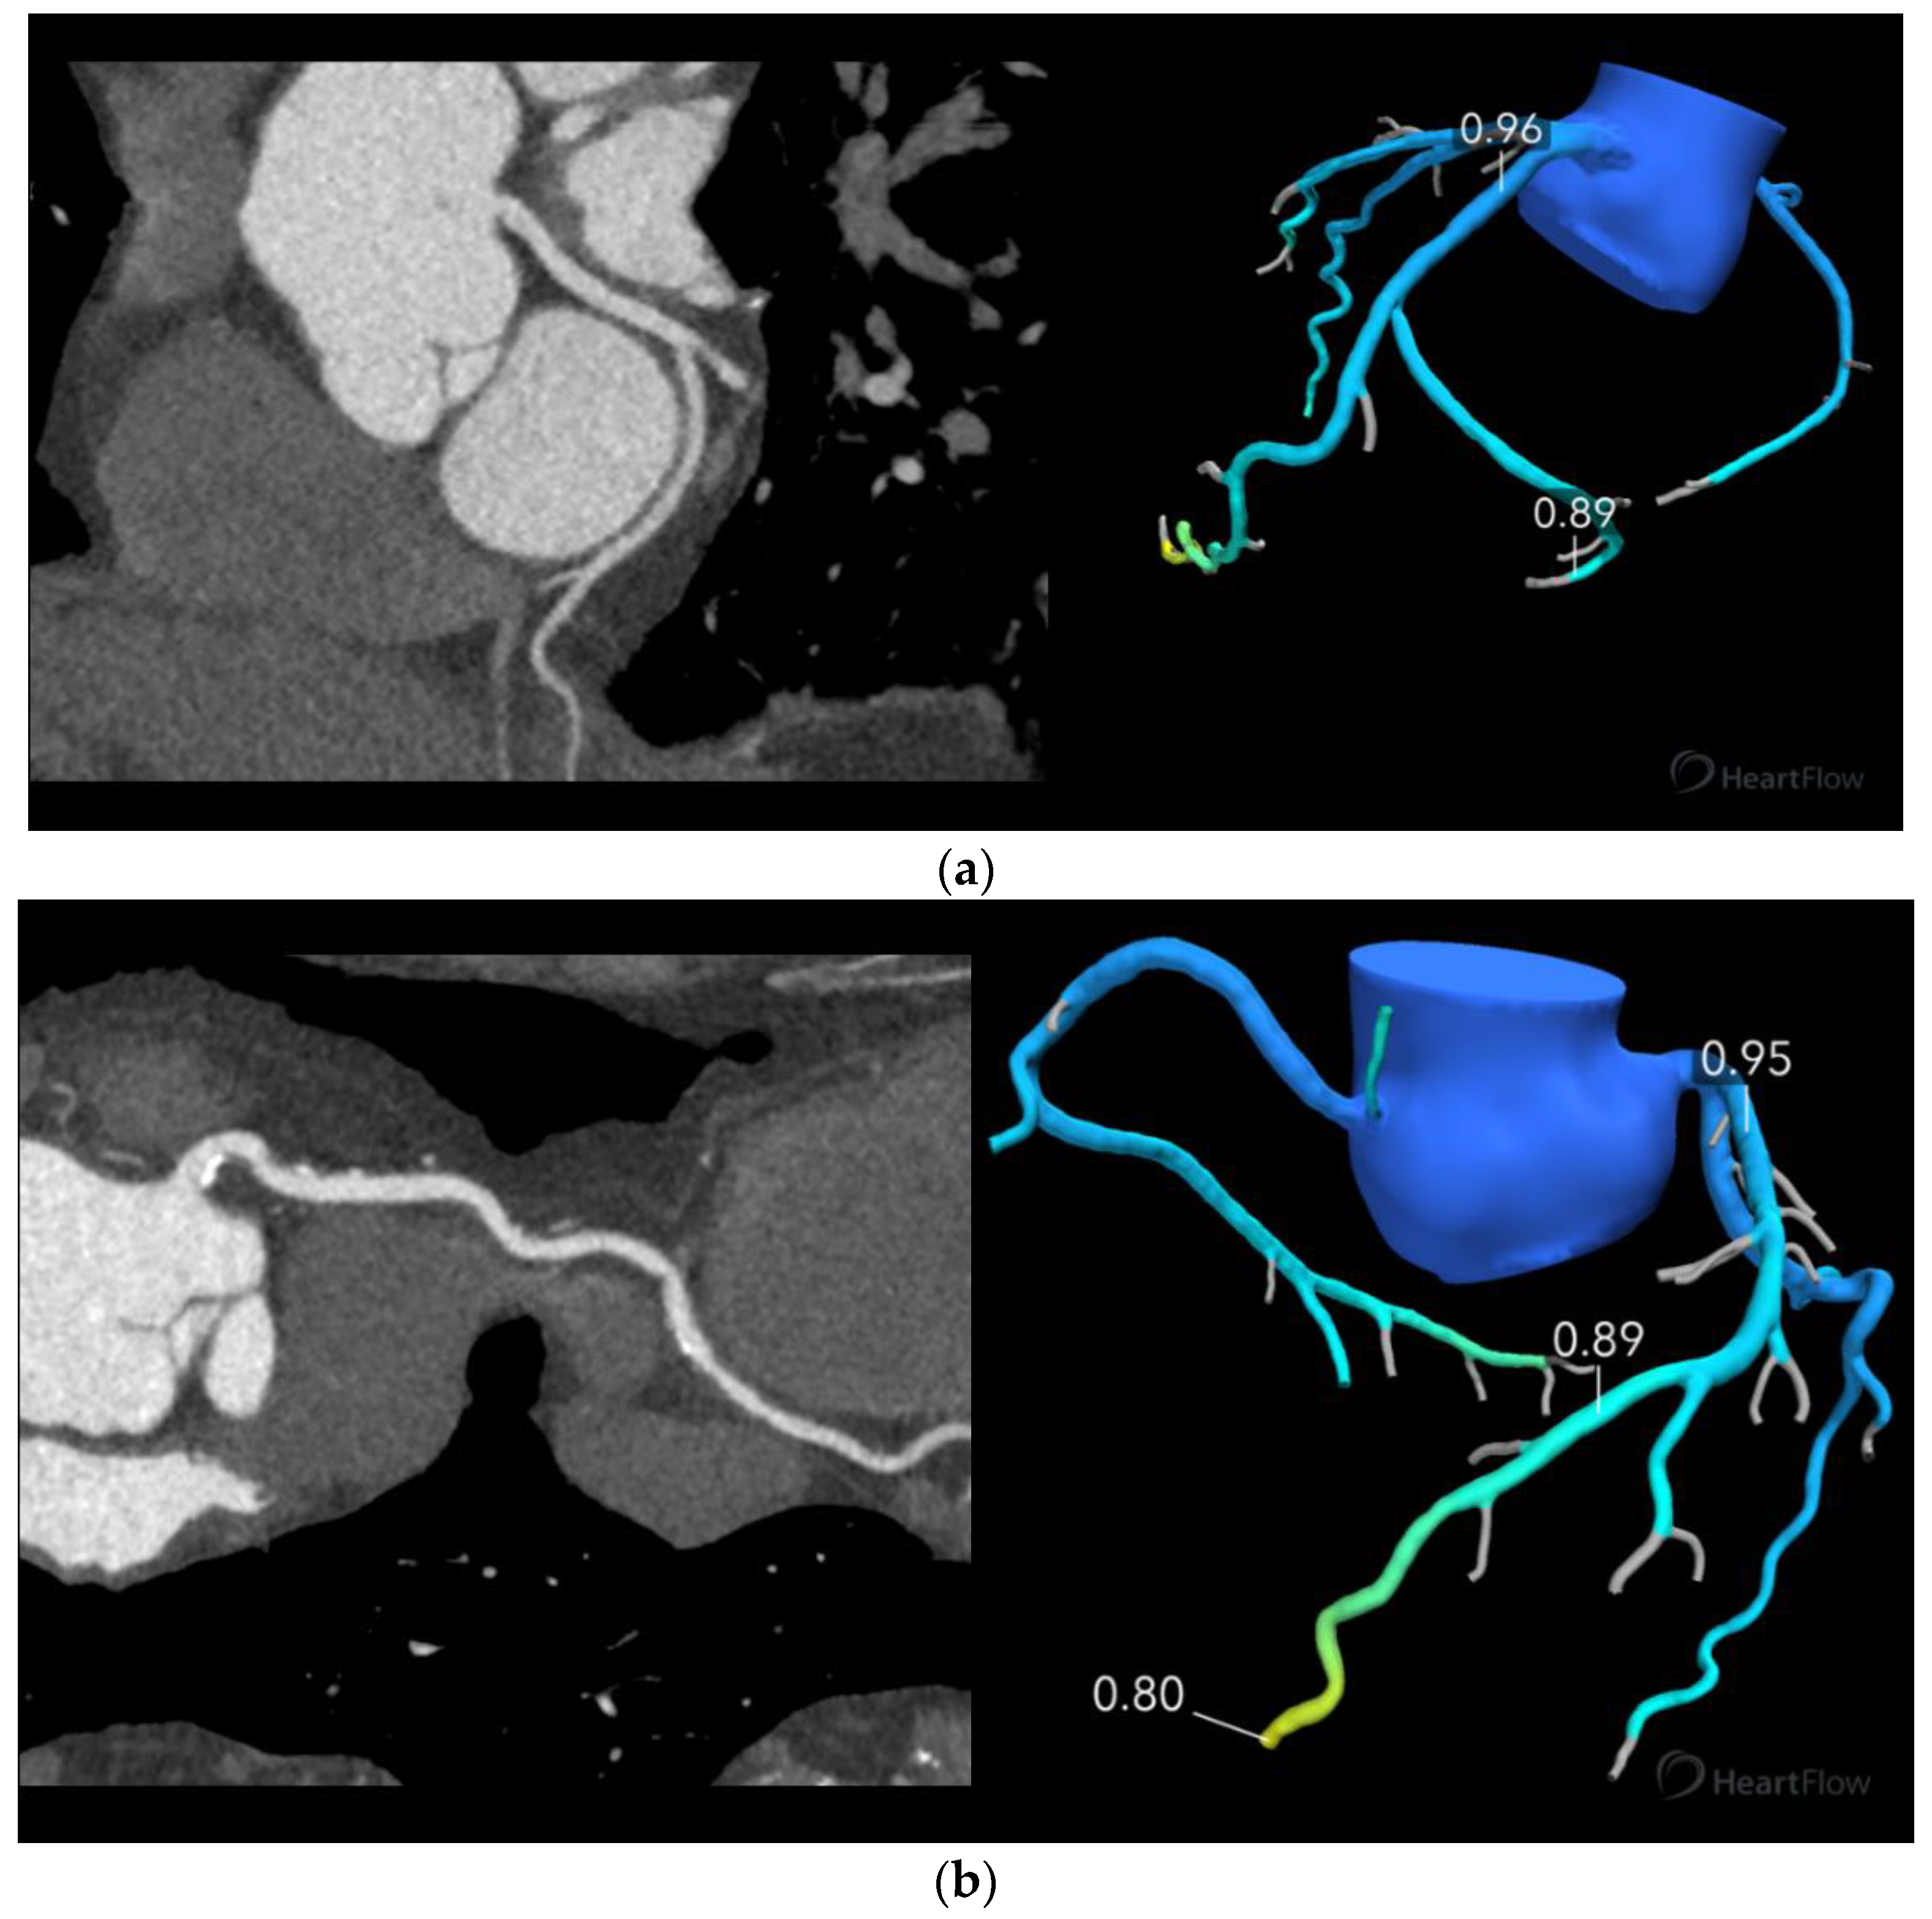
2.3. FFRct
2.4. Statistics
3. Results
3.1. Study Population
3.2. FFRct
4. Discussion
5. Limitations
6. Conclusions
Author Contributions
Funding
Institutional Review Board Statement
Informed Consent Statement
Data Availability Statement
Acknowledgments
Conflicts of Interest
Abbreviations
| T2D | type 2 diabetes mellitus |
| CMD | coronary microvascular dysfunction |
| FFRct | fractional flow reserve assessed by coronary computed tomography angiography |
| CCTA | coronary computed tomography angiography |
| ACR | albumin–creatinine-ratio |
| HR | heart rate |
| CAC | coronary artery calcium |
References
- Sarwar, N.; Gao, P.; Seshasai, S.R.; Gobin, R.; Kaptoge, S.; Di Angelantonio, E.; Ingelsson, E.; Lawlor, D.A.; Selvin, E.; Stampfer, M.; et al. Diabetes mellitus, fasting blood glucose concentration, and risk of vascular disease: A collaborative meta-analysis of 102 prospective studies. Lancet 2010, 375, 2215–2222. [Google Scholar] [CrossRef] [Green Version]
- Hudspeth, B. The burden of cardiovascular disease in patients with diabetes. Am. J. Manag. Care 2018, 24, S268–S272. [Google Scholar]
- Cox, A.J.; Hsu, F.C.; Carr, J.J.; Freedman, B.I.; Bowden, D.W. Glomerular filtration rate and albuminuria predict mortality independently from coronary artery calcified plaque in the Diabetes Heart Study. Cardiovasc. Diabetol. 2013, 12, 68. [Google Scholar] [CrossRef] [PubMed] [Green Version]
- Nezarat, N.; Budoff, M.J.; Luo, Y.; Darabian, S.; Nakanishi, R.; Li, D.; Sheidaee, N.; Kim, M.; Alani, A.; Matsumoto, S.; et al. Presence, Characteristics, and Volumes of Coronary Plaque Determined by Computed Tomography Angiography in Young Type 2 Diabetes Mellitus. Am. J. Cardiol. 2017, 119, 1566–1571. [Google Scholar] [CrossRef] [Green Version]
- Murthy, V.L.; Naya, M.; Foster, C.R.; Gaber, M.; Hainer, J.; Klein, J.; Dorbala, S.; Blankstein, R.; Di Carli, M.F. Association between coronary vascular dysfunction and cardiac mortality in patients with and without diabetes mellitus. Circulation 2012, 126, 1858–1868. [Google Scholar] [CrossRef] [Green Version]
- Strain, W.D.; Paldanius, P.M. Diabetes, cardiovascular disease and the microcirculation. Cardiovasc. Diabetol. 2018, 17, 57. [Google Scholar] [CrossRef] [PubMed] [Green Version]
- Di Carli, M.F.; Janisse, J.; Grunberger, G.; Ager, J. Role of chronic hyperglycemia in the pathogenesis of coronary microvascular dysfunction in diabetes. J. Am. Coll. Cardiol. 2003, 41, 1387–1393. [Google Scholar] [CrossRef] [Green Version]
- Tsiachris, D.; Tsioufis, C.; Dimitriadis, K.; Syrseloudis, D.; Rousos, D.; Kasiakogias, A.; Papademetriou, V.; Tousoulis, D.; Stefanadis, C. Relation of impaired coronary microcirculation to increased urine albumin excretion in patients with systemic hypertension and no epicardial coronary arterial narrowing. Am. J. Cardiol. 2012, 109, 1026–1030. [Google Scholar] [CrossRef]
- Potier, L.; Chequer, R.; Roussel, R.; Mohammedi, K.; Sismail, S.; Hartemann, A.; Amouyal, C.; Marre, M.; Le Guludec, D.; Hyafil, F. Relationship between cardiac microvascular dysfunction measured with 82Rubidium-PET and albuminuria in patients with diabetes mellitus. Cardiovasc. Diabetol. 2018, 17, 11. [Google Scholar] [CrossRef]
- Patel, M.B.; Bui, L.P.; Kirkeeide, R.L.; Gould, K.L. Imaging Microvascular Dysfunction and Mechanisms for Female-Male Differences in CAD. JACC Cardiovasc. Imaging 2016, 9, 465–482. [Google Scholar] [CrossRef]
- Lee, B.-K.; Lim, H.-S.; Fearon, W.F.; Yong, A.S.; Yamada, R.; Tanaka, S.; Lee, D.P.; Yeung, A.C.; Tremmel, J.A. Invasive evaluation of patients with angina in the absence of obstructive coronary artery disease. Circulation 2015, 131, 1054–1060. [Google Scholar] [CrossRef] [Green Version]
- Galderisi, M.; Capaldo, B.; Sidiropulos, M.; D’Errico, A.; Ferrara, L.; Turco, A.; Guarini, P.; Riccardi, G.; de Divitiis, O. Determinants of reduction of coronary flow reserve in patients with type 2 diabetes mellitus or arterial hypertension without angiographically determined epicardial coronary stenosis. Am. J. Hypertens. 2007, 20, 1283–1290. [Google Scholar] [CrossRef] [Green Version]
- Sara, J.D.; Widmer, R.J.; Matsuzawa, Y.; Lennon, R.J.; Lerman, L.O.; Lerman, A. Prevalence of Coronary Microvascular Dysfunction Among Patients With Chest Pain and Nonobstructive Coronary Artery Disease. JACC Cardiovasc. Interv. 2015, 8, 1445–1453. [Google Scholar] [CrossRef]
- von Scholten, B.J.; Hasbak, P.; Christensen, T.E.; Ghotbi, A.A.; Kjaer, A.; Rossing, P.; Hansen, T.W. Cardiac (82)Rb PET/CT for fast and non-invasive assessment of microvascular function and structure in asymptomatic patients with type 2 diabetes. Diabetologia 2016, 59, 371–378. [Google Scholar] [CrossRef] [PubMed] [Green Version]
- Emami, T.; Naeimei, Z.; Salehifard, A.; Azizmohammadi, Z.; Iranpour, D.; Kalantarhormozi, M.; Jafari, E.; Gholamrezanezhad, A.; Assadi, M. Significance of Microalbuminuria in Predicting Silent Myocardial Ischemia in Patients with Type 2 Diabetes Using Myocardial Perfusion Imaging. Mol. Imaging Radionucl. Ther. 2019, 28, 62–68. [Google Scholar] [CrossRef] [PubMed]
- Koo, B.-K.; Erglis, A.; Doh, J.-H.; Daniels, D.V.; Jegere, S.; Kim, H.-S.; Dunning, A.; De France, T.; Lansky, A.; Leipsic, J.; et al. Diagnosis of ischemia-causing coronary stenoses by noninvasive fractional flow reserve computed from coronary computed tomographic angiograms: Results from the prospective multicenter DISCOVER-FLOW (Diagnosis of Ischemia-Causing Stenoses Obtained Via Noninvasive Fractional Flow Reserve) study. J. Am. Coll. Cardiol. 2011, 58, 1989–1997. [Google Scholar] [CrossRef] [Green Version]
- Min, J.K.; Taylor, C.A.; Achenbach, S.; Koo, B.K.; Leipsic, J.; Norgaard, B.L.; Pijls, N.J.; De Bruyne, B. Noninvasive Fractional Flow Reserve Derived From Coronary CT Angiography: Clinical Data and Scientific Principles. JACC Cardiovasc. Imaging 2015, 8, 1209–1222. [Google Scholar] [CrossRef] [PubMed] [Green Version]
- Secchi, F.; Ali, M.; Faggiano, E.; Cannao, P.M.; Fedele, M.; Tresoldi, S.; Di Leo, G.; Auricchio, F.; Sardanelli, F. Fractional flow reserve based on computed tomography: An overview. Eur. Heart J. Suppl. 2016, 18, e49–e56. [Google Scholar] [CrossRef] [PubMed] [Green Version]
- Abbara, S.; Blanke, P.; Maroules, C.D.; Cheezum, M.; Choi, A.D.; Han, B.K.; Marwan, M.; Naoum, C.; Norgaard, B.L.; Rubinshtein, R.; et al. SCCT guidelines for the performance and acquisition of coronary computed tomographic angiography: A report of the society of Cardiovascular Computed Tomography Guidelines Committee: Endorsed by the North American Society for Cardiovascular Imaging (NASCI). J. Cardiovasc. Comput. Tomogr. 2016, 10, 435–449. [Google Scholar] [CrossRef] [PubMed]
- Leipsic, J.; Yang, T.H.; Thompson, A.; Koo, B.K.; Mancini, G.B.; Taylor, C.; Budoff, M.J.; Park, H.B.; Berman, D.S.; Min, J.K. CT angiography (CTA) and diagnostic performance of noninvasive fractional flow reserve: Results from the Determination of Fractional Flow Reserve by Anatomic CTA (DeFACTO) study. Am. J. Roentgenol. 2014, 202, 989–994. [Google Scholar] [CrossRef]
- Nørgaard, B.L.; Leipsic, J.; Gaur, S.; Seneviratne, S.; Ko, B.S.; Ito, H.; Jensen, J.M.; Mauri, L.; De Bruyne, B.; Bezerra, H. Diagnostic performance of noninvasive fractional flow reserve derived from coronary computed tomography angiography in suspected coronary artery disease: The NXT trial (Analysis of Coronary Blood Flow Using CT Angiography: Next Steps). J. Am. Coll. Cardiol. 2014, 63, 1145–1155. [Google Scholar] [CrossRef] [Green Version]
- Sand, N.P.R.; Veien, K.T.; Nielsen, S.S.; Norgaard, B.L.; Larsen, P.; Johansen, A.; Hess, S.; Deibjerg, L.; Husain, M.; Junker, A.; et al. PRrospEctive Comparison of FFR Derived From Coronary CT Angiography With SPECT PerfuSion Imaging in Stable Coronary ArtEry DiSeaSe: The ReASSESS Study. JACC Cardiovasc. Imaging 2018, 11, 1640–1650. [Google Scholar] [CrossRef] [PubMed]
- Taylor, C.A.; Fonte, T.A.; Min, J.K. Computational fluid dynamics applied to cardiac computed tomography for noninvasive quantification of fractional flow reserve: Scientific basis. J. Am. Coll. Cardiol. 2013, 61, 2233–2241. [Google Scholar] [CrossRef] [Green Version]
- Eftekhari, A.; Min, J.; Achenbach, S.; Marwan, M.; Budoff, M.; Leipsic, J.; Gaur, S.; Jensen, J.M.; Ko, B.S.; Christiansen, E.H.; et al. Fractional flow reserve derived from coronary computed tomography angiography: Diagnostic performance in hypertensive and diabetic patients. Eur. Heart J. Cardiovasc. Imaging 2017, 18, 1351–1360. [Google Scholar] [CrossRef] [PubMed]
- Nous, F.M.A.; Coenen, A.; Boersma, E.; Kim, Y.H.; Kruk, M.B.P.; Tesche, C.; de Geer, J.; Yang, D.H.; Kepka, C.; Schoepf, U.J.; et al. Comparison of the Diagnostic Performance of Coronary Computed Tomography Angiography-Derived Fractional Flow Reserve in Patients With Versus Without Diabetes Mellitus (from the MACHINE Consortium). Am. J. Cardiol. 2019, 123, 537–543. [Google Scholar] [CrossRef]
- Osawa, K.; Miyoshi, T.; Miki, T.; Koide, Y.; Kawai, Y.; Ejiri, K.; Yoshida, M.; Sato, S.; Kanazawa, S.; Ito, H. Coronary lesion characteristics with mismatch between fractional flow reserve derived from CT and invasive catheterization in clinical practice. Heart Vessel. 2017, 32, 390–398. [Google Scholar] [CrossRef] [PubMed]
- Malota, Z.; Glowacki, J.; Sadowski, W.; Kostur, M. Numerical analysis of the impact of flow rate, heart rate, vessel geometry, and degree of stenosis on coronary hemodynamic indices. BMC Cardiovasc. Disord. 2018, 18, 132. [Google Scholar] [CrossRef]
- Norgaard, B.L.; Gaur, S.; Leipsic, J.; Ito, H.; Miyoshi, T.; Park, S.J.; Zvaigzne, L.; Tzemos, N.; Jensen, J.M.; Hansson, N.; et al. Influence of Coronary Calcification on the Diagnostic Performance of CT Angiography Derived FFR in Coronary Artery Disease: A Substudy of the NXT Trial. JACC Cardiovasc. Imaging 2015, 8, 1045–1055. [Google Scholar] [CrossRef] [Green Version]
- Schofield, I.; Malik, R.; Izzard, A.; Austin, C.; Heagerty, A. Vascular structural and functional changes in type 2 diabetes mellitus: Evidence for the roles of abnormal myogenic responsiveness and dyslipidemia. Circulation 2002, 106, 3037–3043. [Google Scholar] [CrossRef] [PubMed] [Green Version]
- Sorensen, B.M.; Houben, A.J.; Berendschot, T.T.; Schouten, J.S.; Kroon, A.A.; van der Kallen, C.J.; Henry, R.M.; Koster, A.; Sep, S.J.; Dagnelie, P.C.; et al. Prediabetes and Type 2 Diabetes Are Associated With Generalized Microvascular Dysfunction: The Maastricht Study. Circulation 2016, 134, 1339–1352. [Google Scholar] [CrossRef] [PubMed] [Green Version]
- Tousoulis, D.; Papageorgiou, N.; Androulakis, E.; Siasos, G.; Latsios, G.; Tentolouris, K.; Stefanadis, C. Diabetes mellitus-associated vascular impairment: Novel circulating biomarkers and therapeutic approaches. J. Am. Coll. Cardiol. 2013, 62, 667–676. [Google Scholar] [CrossRef] [PubMed] [Green Version]
- Lynch, F.M.; Izzard, A.S.; Austin, C.; Prendergast, B.; Keenan, D.; Malik, R.A.; Heagerty, A.M. Effects of diabetes and hypertension on structure and distensibilty of human small coronary arteries. J. Hypertens. 2012, 30, 384–389. [Google Scholar] [CrossRef] [PubMed]


| Baseline Characteristics | Non-Albuminuria (n = 98) | Albuminuria (n = 26) |
|---|---|---|
| Sex male n (%) | 57 (58) | 16 (62) |
| Age (y) mean ± SD | 61.2 ± 9.4 | 61.3 ± 9.1 |
| HbA1C mmol/mol | 59 ± 13 | 62 ± 12 |
| Risk factors | ||
| Hypertension n (%) | 60 (61) | 16 (62) |
| Urine-albumin-creatinine ratio Mmol/L mean (CI) | 13.0 (10.5–15.6) | 104 (63.7–144.6) * |
| Dyslipidemia n (%) | 73 (75) | 22 (85) |
| Active Smoking n (%) | 53 (54) | 13 (50) |
| BMI, kg/m2 mean ± SD | 30 ± 4.4 | 31 ± 4.5 |
| CCTA | ||
| Heart rate (beats/min) mean ± SD | 57 ± 8.1 | 58 ± 7.4 |
| DLP (mGy * cm) mean (CI) | 92.9 (86.1–99.7) | 99.9 (82.2–117.7) |
| CAC (Agatston) mean (min–max) | 293 (0–2722) | 298 (70–700) |
| FFRct | Non-Albuminuria (n = 98) | Albuminuria (n = 26) | p-Value |
|---|---|---|---|
| CX | 0.86 (0.07) | 0.88 (0.05) | ns |
| LAD | 0.82 (0.07) | 0.82 (0.07) | ns |
| RCA | 0.88 (0.05) | 0.88 (0.07) | ns |
Publisher’s Note: MDPI stays neutral with regard to jurisdictional claims in published maps and institutional affiliations. |
© 2021 by the authors. Licensee MDPI, Basel, Switzerland. This article is an open access article distributed under the terms and conditions of the Creative Commons Attribution (CC BY) license (https://creativecommons.org/licenses/by/4.0/).
Share and Cite
Lambrechtsen, J.; Heinsen, L.J.; Larsson, J.; Pararajasingam, G.; Egstrup, K. Fractional Flow Reserve Derived from Computer Tomography in Asymptomatic Patients with Type 2 Diabetes and Albuminuria without Significant Coronary Artery Stenosis—A Surrogate for Coronary Microvascular Dysfunction? Hearts 2021, 2, 369-378. https://doi.org/10.3390/hearts2030029
Lambrechtsen J, Heinsen LJ, Larsson J, Pararajasingam G, Egstrup K. Fractional Flow Reserve Derived from Computer Tomography in Asymptomatic Patients with Type 2 Diabetes and Albuminuria without Significant Coronary Artery Stenosis—A Surrogate for Coronary Microvascular Dysfunction? Hearts. 2021; 2(3):369-378. https://doi.org/10.3390/hearts2030029
Chicago/Turabian StyleLambrechtsen, Jess, Laurits Juhl Heinsen, Johanna Larsson, Gokulan Pararajasingam, and Kenneth Egstrup. 2021. "Fractional Flow Reserve Derived from Computer Tomography in Asymptomatic Patients with Type 2 Diabetes and Albuminuria without Significant Coronary Artery Stenosis—A Surrogate for Coronary Microvascular Dysfunction?" Hearts 2, no. 3: 369-378. https://doi.org/10.3390/hearts2030029