Article

Structure and Metabolic Activity of the Gut Microbiota in Diarrhea-Predominant Irritable Bowel Syndrome Combined with Functional Dyspepsia

1
Department of Internal Medicine, Gastroenterology and Hepatology, Sechenov University, Moscow 119991, Russia
2
The Interregional Public Organization “Scientific Community for the Promotion of the Clinical Study of the Human Microbiome”, Moscow 119991, Russia
3
Consultative and Diagnostic Center No. 2 of the Moscow Health Department, Moscow 107564, Russia
4
Post-Genomic Research Laboratory, Engelhardt Institute of Molecular Biology, Russian Academy of Sciences, Moscow 119991, Russia
*
Author to whom correspondence should be addressed.
Gastrointest. Disord. 2023, 5(3), 296-309; https://doi.org/10.3390/gidisord5030024
Submission received: 16 July 2023 / Accepted: 26 July 2023 / Published: 31 July 2023
(This article belongs to the Topic Gut Microbiota in Human Health)

Abstract

:
Gut dysbiosis presents in many digestive diseases. The aim of this study is to investigate the composition of the gut microbiota and its metabolic activity in patients with diarrhea-predominant irritable bowel syndrome combined with functional dyspepsia (I + D). This study included 60 patients with I + D and 20 healthy controls. Gut microbiota composition was studied using 16S rRNA gene sequencing. The short-chain fatty acids (SCFAs) spectrum was determined via gas–liquid chromatography. Patients with I + D had an increase in the abundance of Holdemanella, Erysipelotrichaceae, Erysipelotrichales, Prevotellaceae, Agathobacter, Slackia, Lactococcus, Pseudomonadaceae, Stenotrophomonas, Xanthomonadaceae, Rhizobiaceae, Erysipelatoclostridiaceae, Lachnospiraceae, and other taxa in addition to a decrease in the abundance of Frisingicoccus, Ralstonia, Burkholderiaceae, Hungatella, Eisenbergiella, Parabacteroides, Peptostreptococcaceae, Merdibacter, Bilophila, Rikenellaceae, Tannerellaceae, Bacteroidaceae, and Flavonifractor in comparison to controls. Patients with I + D showed significantly higher total SCFA content in feces; increased absolute content of acetic acid, propionic acid, butyric acid, and isoacids; and a significant negative shift in the anaerobic index. The relative levels of the main SCFAs and isoacids in the patient group did not differ significantly from those in the control group. The fecal acetate and isoacid levels correlated with the severity of diarrhea. The fecal butyrate level correlated with the severity of flatulence.

1. Introduction

Irritable bowel syndrome (IBS) is a functional bowel disease in which recurrent abdominal pain is associated with defecation or a change in bowel habits [1]. Depending on the prevailing disorders, the following variants of IBS are distinguished: with predominant diarrhea (IBS-D), with predominant constipation, mixed, and unclassified [1]. Functional dyspepsia (FD) is a medical condition that significantly impacts on the usual activities of a patient and is characterized by one or more of the following symptoms: postprandial fullness, early satiation, epigastric pain, and epigastric burning that are unexplained after a routine clinical evaluation [2]. In both cases, the absence of any organic digestive disease that could explain the presence of these symptoms is implied. The exact criteria for these diseases are defined in the latest Rome IV criteria [1,2]. The worldwide prevalence of IBS is 11.2% [1], and the prevalence of FD varies from 10% to 30% of the population [2]. Many individuals have overlapping IBS and FD (13–87%) [3].
The gut microbiota is a complex of microorganisms that colonizes the small and large intestines. The human gut microbiota is dominated by the phyla Firmicutes, Bacteroidetes, Actinobacteria, and Proteobacteria. According to one study, Firmicutes normally account for 80% of bacteria in the gut microbiota, followed by Bacteroidetes (approximately 10%), Actinobacteria (1.5%), and Proteobacteria (approximately 1%); less than 10% of the bacteria belong to other phyla [4]. The gut microbiota in the human body performs several functions.
The protective function of the microbiota is to maintain the immune response and create colonization resistance, which prevents the action of pathogenic and opportunistic pathogenic bacteria on the mucoepithelial barrier of the gastrointestinal tract. An increase in the permeability of the mucoepithelial barrier leads to increased adhesion of potential and overt pathogenic bacteria to the intestinal wall, which in turn causes nonspecific inflammation [5,6,7]. Minimal inflammation is observed in patients with irritable bowel syndrome (IBS) and functional dyspepsia (FD) [8].
Metabolic function refers to the ability of bacteria to ferment dietary fibers (polysaccharides) with the formation of short-chain fatty acids (SCFAs), utilize hydrogen, and synthesize amino acids, vitamins, and antimicrobial substances [9]. The main SCFAs include acetic, propionic, and butyric acids. A change in the composition of the gut microbiota inevitably affects its metabolic activity, which may promote gastrointestinal tract dysfunction and aggravate the clinical symptoms of IBS.
Numerous studies have described changes in the intestinal microbiota composition in patients with IBS compared to that in healthy individuals [10]. Results demonstrate that in patients with IBS, including those with IBS-D, there are changes in the level and spectrum of SCFAs [10,11,12]. However, the SCFA profile and gut microbiota state in patients with other functional gastrointestinal diseases, including FD, have not been studied. In addition, despite the availability of data on the SCFA profile and gut microbiota composition in IBS (in particular, IBS-D), these indices have not been analyzed simultaneously in a single study. Accordingly, the aim of the current study was to evaluate and compare the gut microbiota composition and SCFA profiles in patients with IBS-D combined with FD (I + D) with those in healthy control subjects.

2. Results

There were no significant differences between the tested patients and healthy controls in terms of age and sex distribution. The mean age was 33.75 ± 9.52 years in the patient group and 39.13 ± 15.20 in the control group (p = 0.195). The sex ratio (m/w) in the patient group was 23/37 in the control group and 5/15 in the experimental group (p = 1.000). The housing, other living conditions and diet of the controls were similar to those of the patients.
All patients and controls had normal complete blood counts and biochemical blood analysis data. Gastrointestinal Symptom Rating Scale (GSRS) parameters represented in Table 1.

2.1. Gut Microbiota Data

Patients with IBS-D and FD did not show any significant difference in the abundance of bacteria phyla and classes and in the alpha-diversity indices of the gut microbiota in comparison to healthy controls (Table 2).
At the levels of orders, families, and genera, patients with I + D showed an increase in the abundance of Holdemanella, Erysipelotrichaceae, Erysipelotrichales, Prevotellaceae, Agathobacter, Slackia, Lactococcus, Pseudomonadacea, Stenotrophomonas, Xanthomonadaceae, Rhizobiaceae, Erysipelatoclostridiaceae, Lachnospiraceae, and other taxa in addition to a decrease in the abundance of Frisingicoccus, Ralstonia, Burkholderiaceae, Hungatella, Eisenbergiella, Parabacteroides, Peptostreptococcaceae, Merdibacter, Bilophila, Rikenellaceae, Tannerellaceae, Bacteroidaceae, and Flavonifractor in comparison to healthy individuals (Table 3).
There was no significant correlation between the abundance of gut microbiota taxa on the one hand and drugs used, GSRS and laboratory parameters on the other.

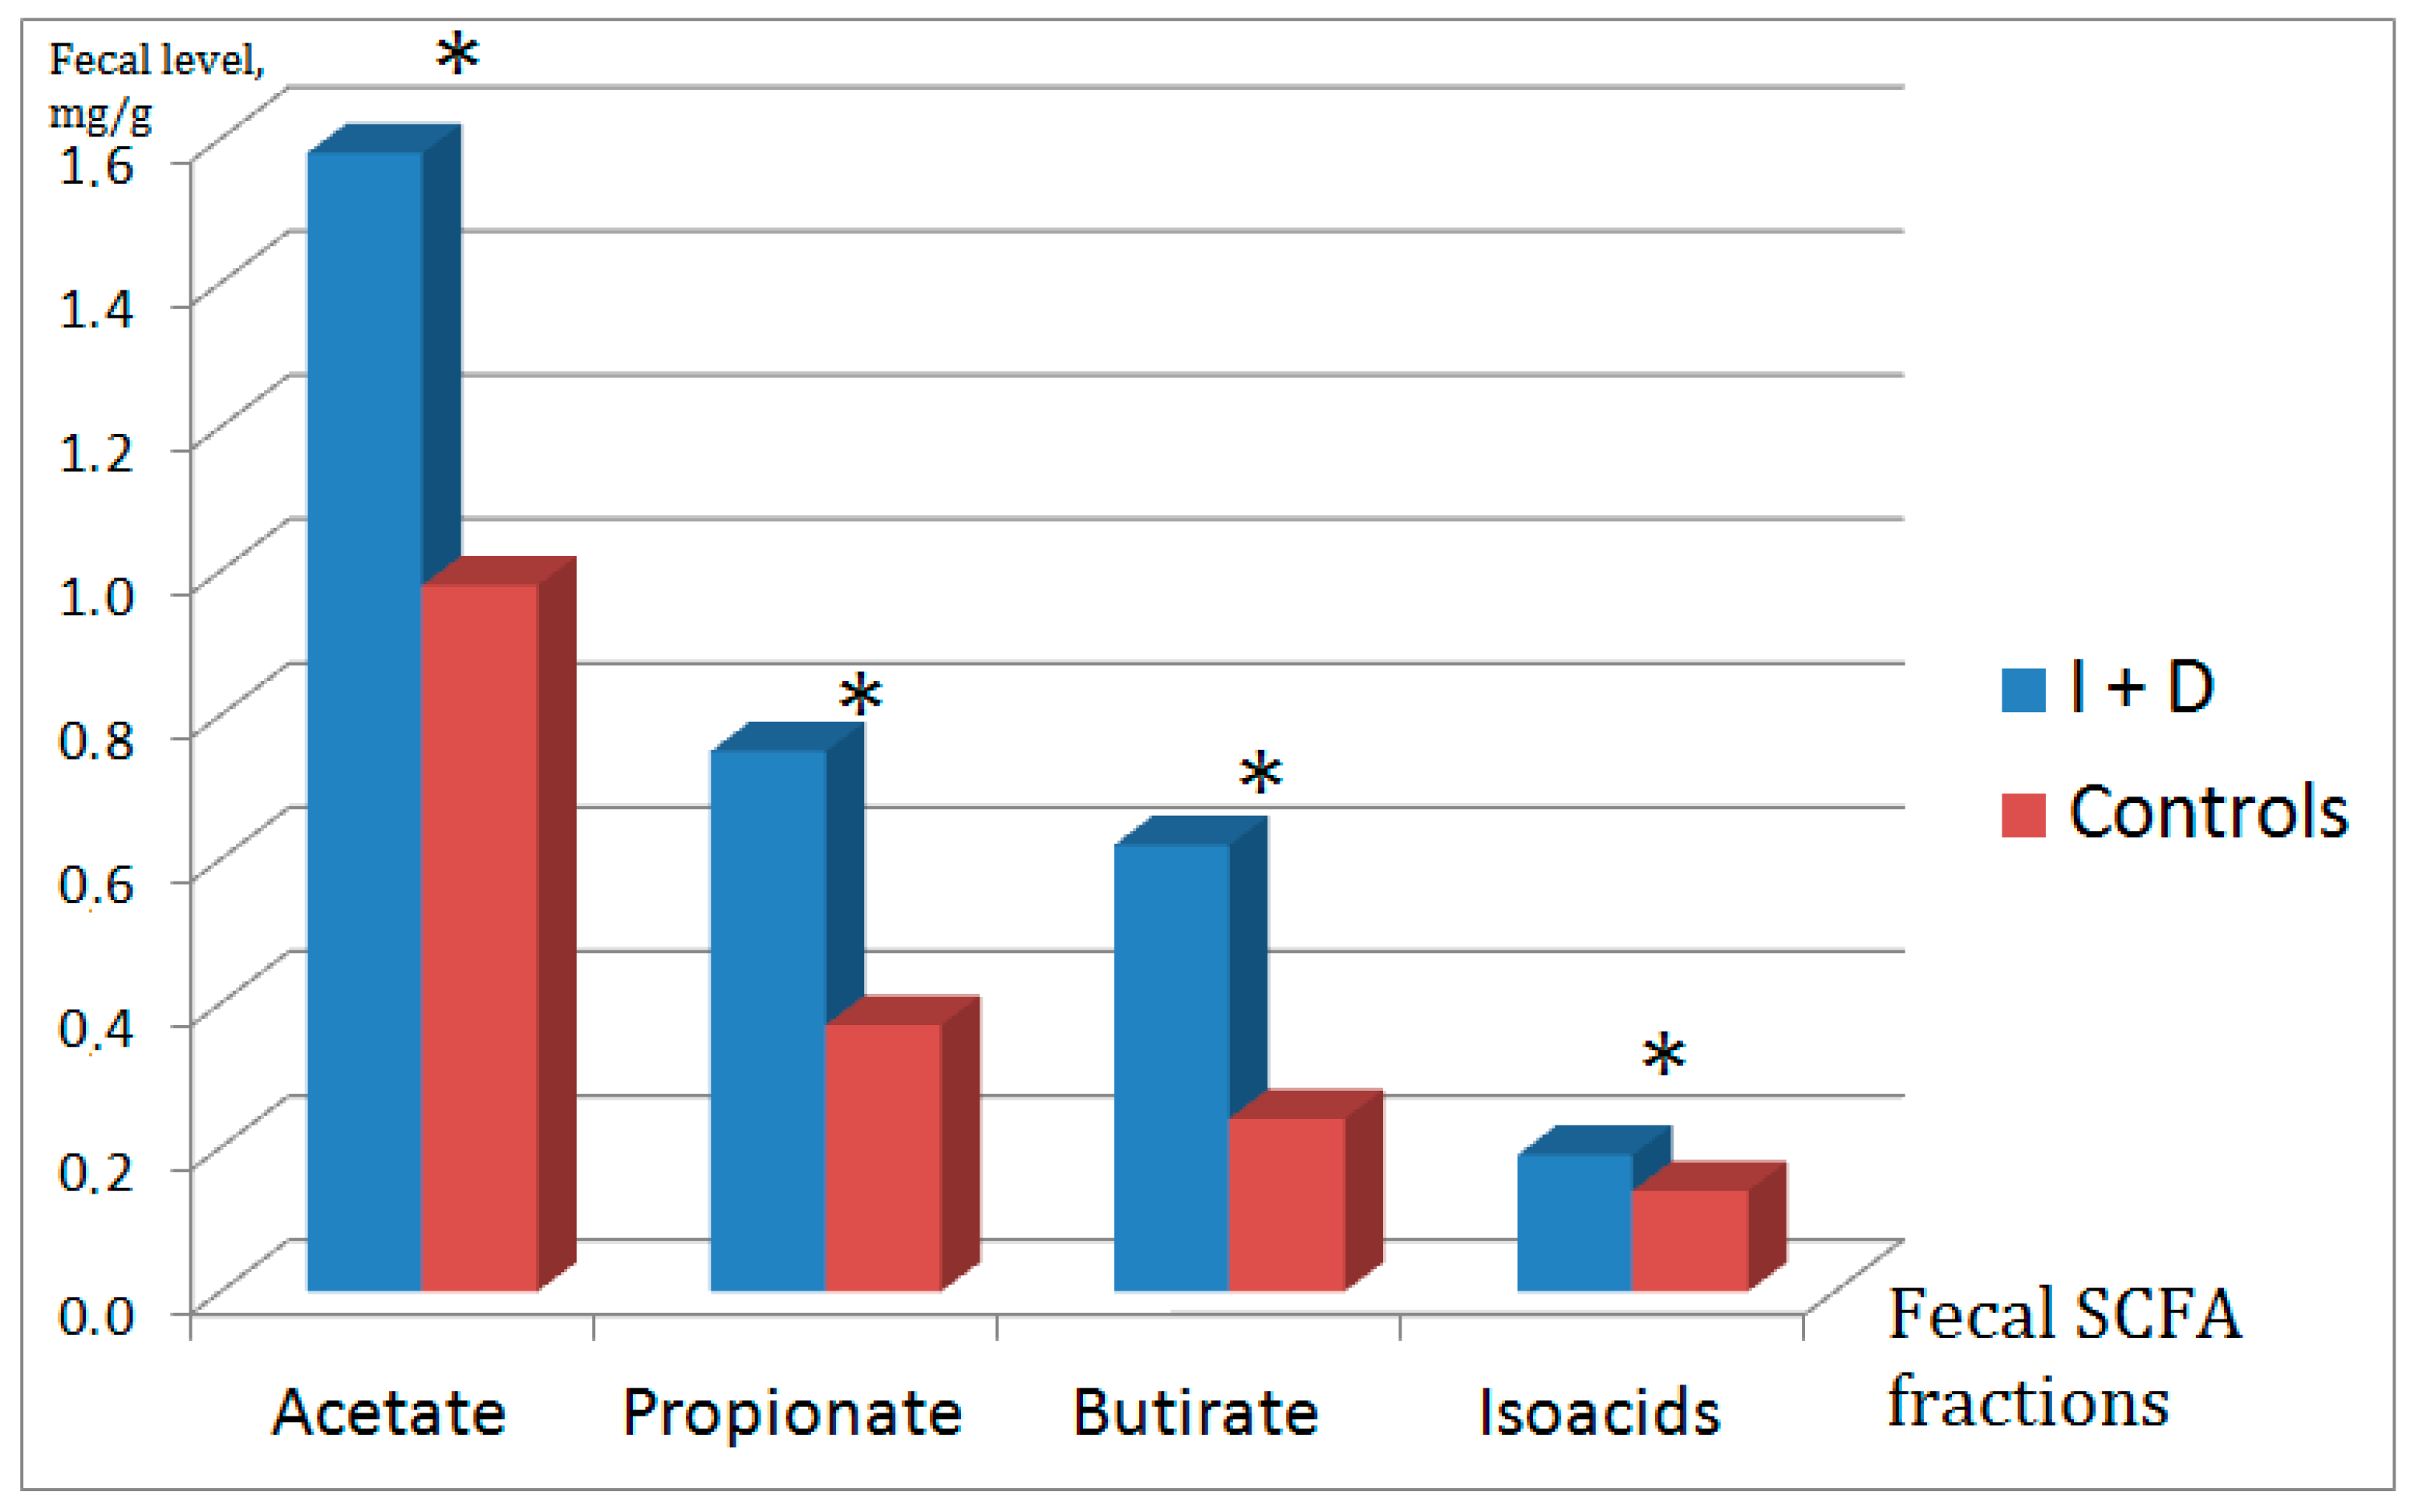
2.2. Fecal Short-Chain Fatty Acids

Patients with I + D showed an increase in the total level of SCFAs as well as absolute levels of acetic acid, propionic acid, butyric acid, and isoacids in comparison with the control group (Figure 1). The IsoCn/Cn ratio increased and the anaerobic index decreased in these patients compared to those in healthy individuals. The relative levels of the main SCFAs and isoacids in the patient group did not differ significantly from those in the control group (Table 4).
Our study also included a correlation analysis between the absolute levels of SCFAs and the main bacterial taxa in the gut microbiota (Table 5).
The amount of acetate in feces correlated with the severity of diarrhea, defined as an increase in the frequency of stools (r = 0.364; p = 0.014) and loose stool (r = 0.377; p = 0.011), as well as with urgent need to have a bowel movement (r = 0.525; p < 0.001). The severity of the latter symptom also correlated with the amount of propionate (r = 0.459; p = 0.002), butyrate (r = 0.363; p = 0.014), and the total amount of SCFA (r = 0.434; p = 0.003) in the feces. The number of isoacids in the feces correlated significantly with the frequency of stools (r = 0.355; p = 0.017), but not with the severity of loose stools. The level of butyrate in feces correlated with the severity of flatulence (r = 0.339; p = 0.023). There were no significant correlations between fecal SCFA levels and other GSRS parameters, as well as with drugs used, and laboratory parameters.

3. Materials and Methods
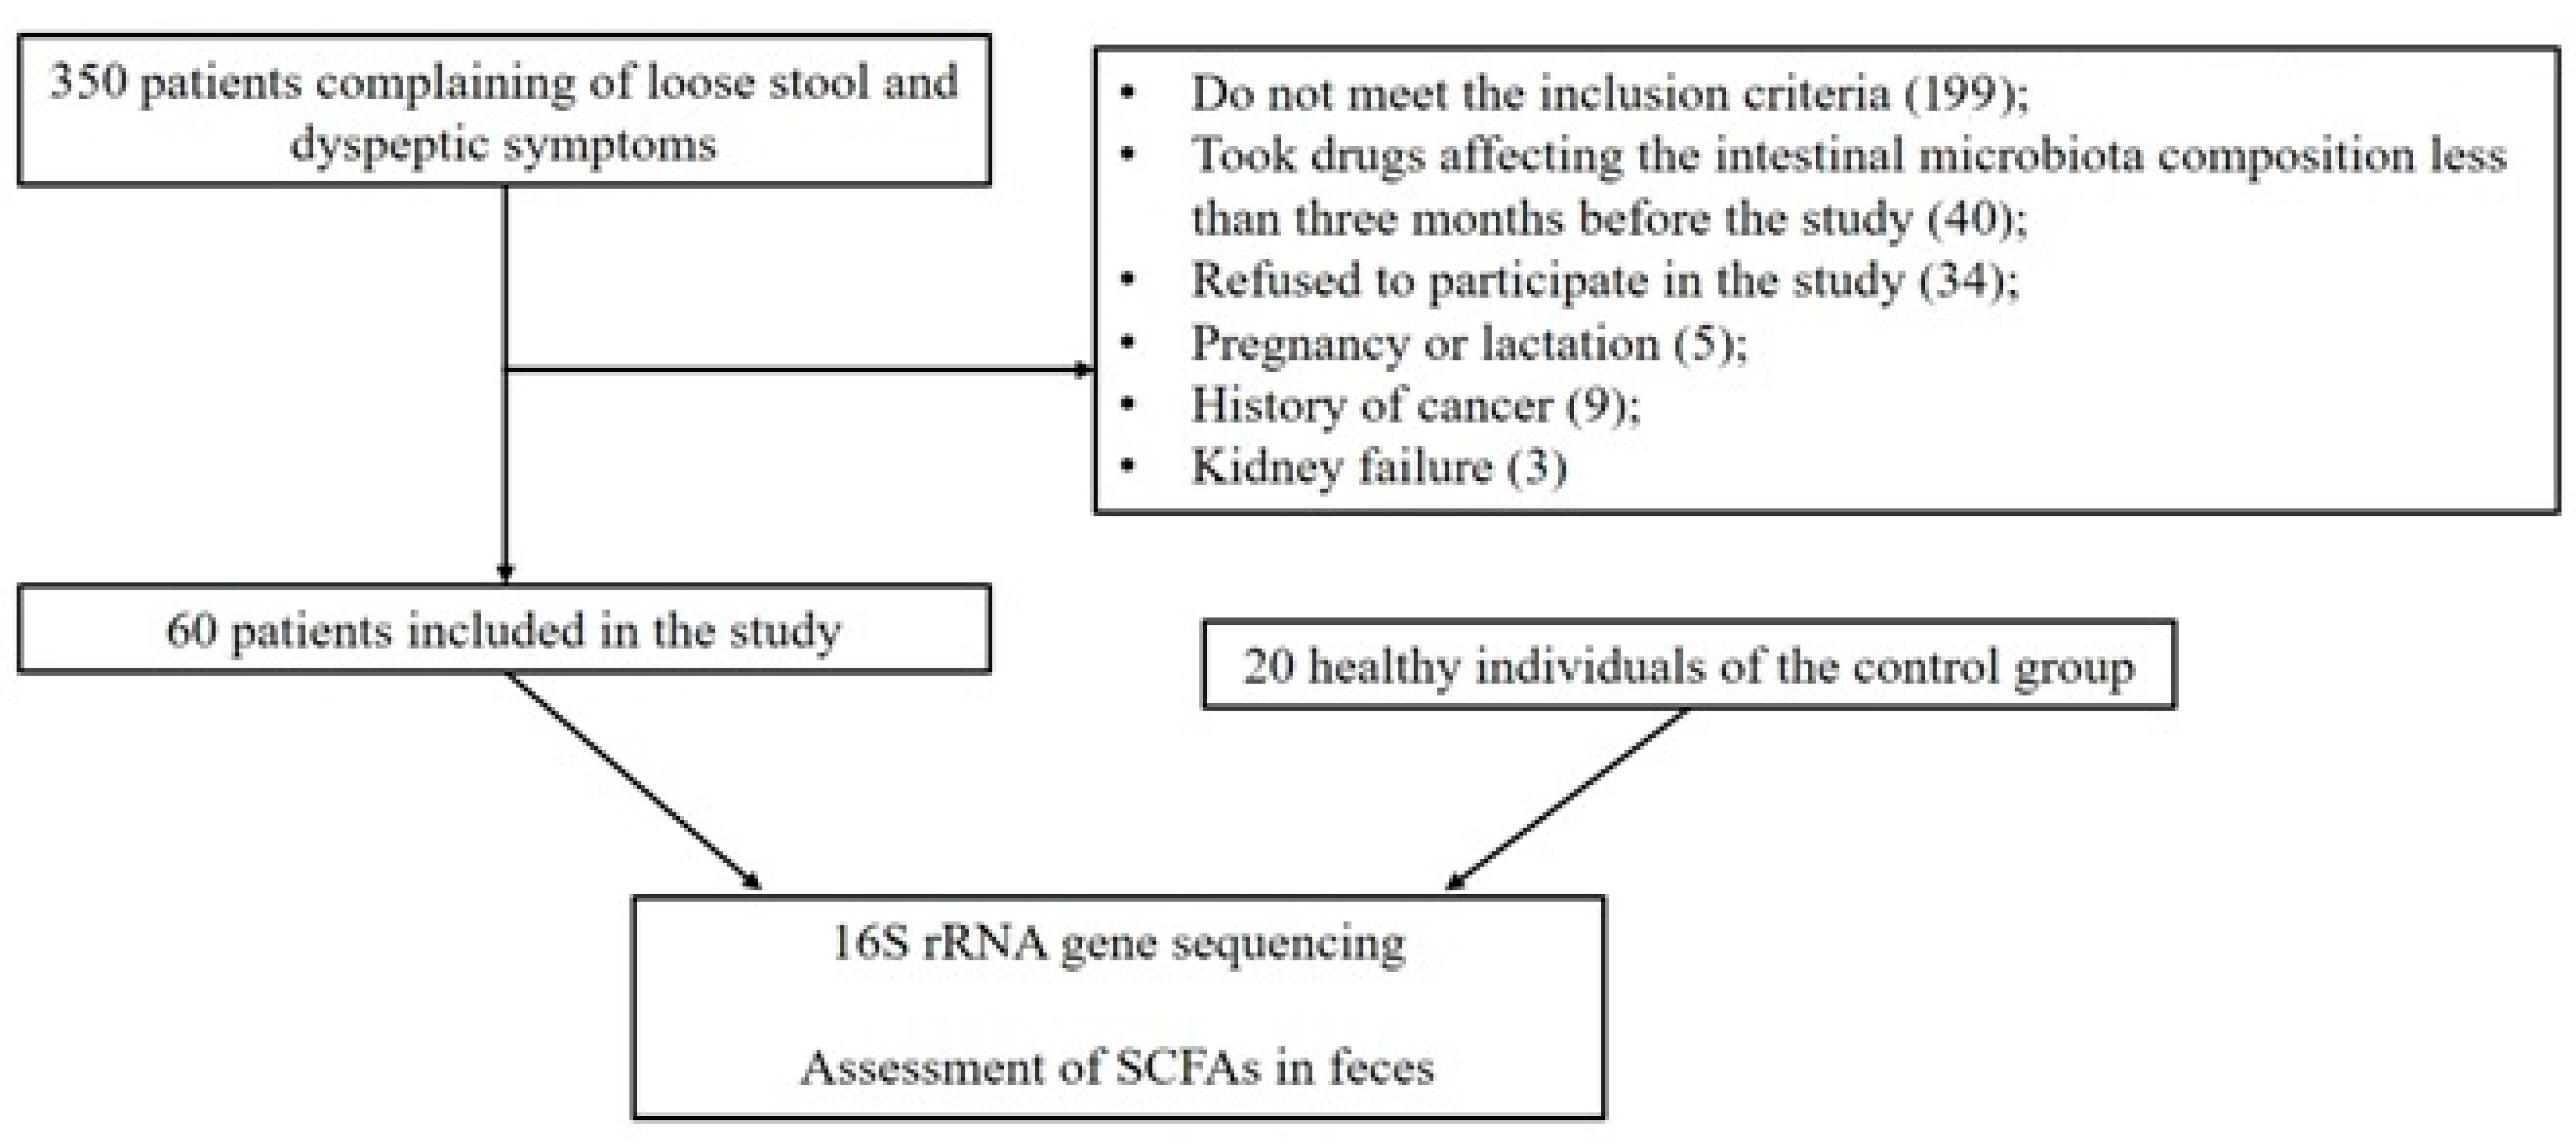
3.1. Patients

This study was approved by the Local Ethic Committee (No. 06-21 d/d 7 April 2021) of Sechenov University, and all participants provided written informed consent. All patients admitted to the Department of Chronic Intestinal and Pancreatic Diseases of the Clinic with complaints of loose stools and dyspepsia were screened for inclusion. The inclusion criterion was the presence of both IBS-D and FD. The clinical diagnosis was established based on the Rome IV Criteria [1,2] and the exclusion of organic diseases according to the results of an examination as recommended the national guidelines [3,13].
The exclusion criteria were as follows: presence of digestive disease other than IBS and FD (including Helicobacter pylori infection, inflammatory bowel diseases, microscopic colitis, and celiac disease); age under 18 years and over 59 years; refusal to sign the informed consent form for participation in this study; pregnancy; lactation; history of cancer or digestive tract surgeries (except for appendectomy); renal failure (creatinine clearance < 50 mL/min); liver failure, confirmed by clinical and laboratory data; other severe somatic diseases (any disease or conditions threatening the patient’s life or worsening the prognosis); known sensitivity to any component of the drugs to be administered in this study; a positive blood test result for biomarkers of human immunodeficiency virus infection, syphilis, hepatitis B or/and C; and use of drugs that could affect the composition of the gut microbiota (probiotics, prebiotics, antibiotics, prokinetics, and proton pump inhibitors) within the previous three months. The stool of the patients was subjected to microbiological analysis. When intestinal pathogens (Salmonella, Shigella and others) were detected, such patients were excluded as having organic bowel disease.
In total, 60 of 350 screened patients met the criteria described above and were enrolled in this study. The control group consisted of 20 healthy individuals aged 18–59 years, comparable to the patient group in sex and age, without gastrointestinal tract complaints and concomitant diseases of the respiratory, urinary, endocrine, and cardiovascular systems, who applied to the clinic for scheduled prophylactic medical examinations. The study design is shown in Figure 2.

3.2. Severity of Symptoms Assessment

The severity of symptoms was assessed using the Gastrointestinal Symptom Rating Scale (GSRS) [14]. Symptoms were scored semiquantitatively from 1 (no symptom) to 7 (very severe symptom).

3.3. 16S rRNA Genes Library Preparartion and Sequencing

After receipt from the patients, the samples were frozen and stored at −70 °C until sample preparation. Patient and control samples were processed and sequenced in parallel. Just before the library preparation, the frozen samples were placed in a container with ice to thaw for 30 min. A 10 μg sample was taken with a spatula and placed in test tubes for homogenization. Sample tubes were incubated for 10 min at 65 °C, and then for 10 min more at 95 °C. Subsequently, the samples were homogenized using a MagNA Lyser automatic homogenizer (Roche, Basel, Switzerland) according to the manufacturer’s instructions, following which they were centrifuged at 14,000 rpm for 10 min. The resulting supernatant (400 µL) was used for further isolation of nucleic acids. Total DNA was isolated using reagents of the MagNA Pure Compact Nucleic Acid Isolation Kit I (Roche, Basel, Switzerland) in a MagNA Pure LC automated nucleic acid extraction system. The isolated DNA was stored at −20 °C. A NanoDrop 1000 (Thermo Fisher Scientific, Waltham, MA, USA) was used for DNA qualitative and quantitative evaluation. The 16S metagenomic libraries were prepared according to the 16S Metagenomic Sequencing Library Preparation protocol (Illumina, San Diego, CA, USA) recommended by Illumina for the MiSeq sequencer. The following primers were used for the amplification of V3-V4 16S rDNA variable regions: TCGTCGGCAGCGTCAGATGTGTATAAGAGACAG-CCTACGGGNGGCWGCAG and GTCTCGTGGGCTCGGAGATGTGTATAAGAGACAG-GACTACHVGGGTATCTAATCC [15]. The part of the sequence before the dash refers to Illumina adapters. These primers are aimed at the amplification of bacterial (more than 90% taxon coverage) but not archaeal (less than 5%) rRNA genes. The average amplicon length was approximately 450 bp with minimal variation. Applied Biosystems 2720 Thermal Cycler amplifier (Thermo Fisher Scientific, Waltham, MA, USA) was used.
The amplification program was as follows: 95 °C—3 min; 30 cycles: 95 °C—30 s, 55 °C—30 s, 72 °C—30 s; 72 °C—5 min; 4 °C finally. PCR products were purified using Agencourt AMPure XP beads (Beckman Coulter, Blair, CA, USA) according to the manufacturer′s protocol.
Then, the second round of amplification was performed for double indexing of samples using a specific combination of index sequences from the Nextera XT Index kit (Illumina, San Diego, CA, USA). The amplification program was similar except that the number of cycles was 8. PCR products were also purified using Agencourt AMPure XP beads. The concentration of the resulting 16S libraries was determined using the Qubit® 2.0 fluorimeter (Invitrogen, Waltham, MA, USA) and QuantiT™ dsDNA High-Sensitivity Assay Kit.
The purified amplicons were mixed equimolarly according to the obtained concentrations. The quality of the prepared libraries was performed on an Agilent 2100 Bioanalyzer (Agilent Technologies, Santa Clara, CA, USA) using an Agilent DNA 1000 Kit Bioanalyzer (Agilent Technologies, Santa Clara, CA, USA).
Sequencing was performed with the MiSeq sequencer (Illumina, San Diego, CA, USA) in the paired-end mode (2 × 250 bp) using the MiSeq Reagent Kit v2.

3.4. 16S rRNA Sequencing Data Analysis

First, forward and reverse Illumina reads were pre-trimmed with Trimmomatic 0.38 and merged with MeFiT tool [16] into a single amplicon sequence sequence (because of the small length of the overlapping regions with high quality). Then, the merged reads were processed with the DADA2 1.22 package (Bioconductor project) [17], including reads filtering, denoising, RSV inference and detecting chimeras. Taxonomic annotation was performed using the naive RDP classifier algorithm (built-in default DADA2 annotation engine) [18] based on the Silva 138.1 database [19]. The taxon assignment confidence threshold was set to 80%. It should be noted that the reads were merged even before the DADA2 analysis because of the relatively small overlap region size.
To take into account the compositionality of microbiome communities, the differential taxon abundance analysis was performed using the ALDEx2 package [20] (Bioconductor) for centered log ratio (CLR)-transformed read counts. The default Monte-Carlo samples count was elevated to 1000. We considered the Mann–Whitney test for CLR values as the main criterion, due to the high heterogeneity of the patients’ samples. Welch’s t-test and GLM/ANOVA were also applied for CLR values. Additionally, we performed the same tests for normalized reads counts without CLR transformation. Finally, the false discovery rate (FDR) calculation was performed with the Benjamini–Hochberg algorithm.

3.5. Evaluation of the Content of Acetic, Propionic, Butyric, Acids and SCFA in Fecal Samples

In all study participants, the absolute and relative content of acetic (C2), propionic (C3) and butyric (C4) acids, the level of isoacids (SCFA isomers), and the ratio of isoacids to unbrached acids (isoCn/Cn) were determined with the following method. Fecal samples were collected from all study participants and kept at −80 °C until further analysis. After defrosting, 0.1 g fecal sample was placed in a tube with a conical bottom, and 2 mL distilled water and 1 mL calibration solution was added and mixed by shaking for 10 min. Further, 0.5 mL of 1 N HCl was added and the mixture was centrifuged at 5000 rpm for 10 min. A volume of 1 μL supernatant was injected with a microsyringe into the Khromos GCh-1000 gas chromatograph evaporator with a flame ionization detector equipped with a 36 m-long quartz capillary column with an inner diameter of 0.32 mm and with a stationary free fatty acids phase in the form of films 0.33 µm thick. The chromatograph operation mode was isothermal with a thermostat temperature of 150 °C, and an evaporator and detector temperature of 230 °C. The carrier gas was nitrogen, with a column inlet pressure of 1.8 atm. Carrier gas flow was 2.0 mL/min, and air flow was 300 mL/min. Chromatography time was approximately 8 min. Determination of the absolute content of individual acids in a mixture is carried out by calculating the areas of chromatographic peaks both by the “triangle” method and by computer processing of chromatograms.

3.6. Statistical Analysis

Statistical data processing was performed using STATISTICA 10 software (StatSoft Inc., Tulsa, OK, USA). Differences between groups in continuous variable values were assessed using Student’s t-test for normal distribution and the Mann–Whitney method for other distributions. Comparison of the abundance of gut microbiota taxa was carried out using the Mann–Whitney method corrected for FDR (see above). The abundance of gut microbiota taxa are presented as the average number of reads in the studied groups. Significant differences in categorical variables were determined using Fisher’s exact test. Spearman’s correlation was used to assess the links between the abundance of the taxa and SCFA levels. If the probability of making a type I error was p < 0.05, the difference was considered significant.

4. Discussion

When studying the composition of the gut microbiota in patients with IBS, different data have been obtained in various studies. According to two meta-analyses, individuals with IBS demonstrate a decrease in the levels of Lactobacillus (phylum Firmicutes) and Bifidobacterium (phylum Actinobacteria) in feces [21,22]. A meta-analysis of 16 studies performed by Duan et al. showed an increase in the abundance of Firmicutes in the gut microbiota of patients with IBS; this was mainly due to an increase in the number of bacteria belonging to order Clostridiales [23]. Most recent meta-analysis revealed that Bacteroides, Fecalibacterium prausnitzii, Ruminococcus spp., and Bifidobacteria implicated in IBS and treatment response [10]. However, in these cases, the microbiota of patients with IBS was analyzed without considering the clinical variants of the disease course.
Some changes in the gut microbiota composition have been observed in IBS-D. According to Zhuang et al., these patients with IBS-D showed a decrease in the abundance of Firmicutes and an increase in the abundance of the Bacteroidetes in feces, when compared to healthy individuals [24]. Among Firmicutes, at the family level, the abundance of Ruminococcaceae and Lachnospiraceae reduced [25] and at the genus level, according to Su et al., the abundance of Lactobacillus was reduced [26]. Liu et al. reported a decrease in the abundance of Fecalibacterium prausnitzii (phylum Firmicutes) in the feces of patients with IBS-D [22]. In addition, according to the results of Rangel et al., the abundance of bacteria belonging to phylum Firmicutes in IBS-D patients exceeds that in healthy individuals, including the classes Bacilli and Clostridia [26]. According to Carroll et al., patients with IBS-D have an increased abundance of Proteobacteria due to an increased in abundance of Enterobacteriaceae [27].
Data on changes in Bacteroidetes levels are contradictory. According to Krogius-Kurikka et al., patients with IBS-D have a reduced number of bacteria of this phylum when compared to healthy controls; however, according to Shukla et al., the level of bacteria of the Bacteroides genus in the feces of patients with IBS-D is higher than that in healthy individuals [28,29].
In the current study, patients with IBS-D and FD overlap also had increased abundance of bacteria belonging to phylum Firmicutes and decreased Bacteroidetes level in the gut microbiota in comparison with healthy controls. However, after adjusting for FDR, these differences were no longer significant. At the same time, there continued to be a significant increase in the abundance of representatives of Erysipelotrichales and Lachnospiraceae, which belong to phylum Firmicutes. Lachnospiraceae included Clostridium cluster XIVa that are involved in immune response regulation due to an increase in T-regulatory lymphocyte (Treg) production. A decrease in the Treg pool can lead to the development of inflammatory changes in the intestinal wall, and Treg synthesis induction, in turn, helps reduce the severity of this reaction [30]. Since IBS is characterized by a permeability disorder of the intestinal barrier, an increase in the levels in Lachnospiraceae may prevent the pronounced development of inflammation in the intestinal wall in response to bacterial translocation. Moreover, previous studies established a direct correlation between the content of Erysipelotrichales class bacteria and expression of tumor necrosis factor alpha (TNF-α) [31] and also showed an increase in the expression of TNF-α in the mucous membrane of the small and large intestine in patients with IBS [32,33].
Changes in the gut microbiota composition in patients with functional gastrointestinal diseases affect the normal activity of the gastrointestinal tract owing to the impact on motility, sensitivity, permeability of the mucoepithelial barrier, and regulation of the local immune response [34,35] which is related to a change in the level of SCFAs.
The ratio of acetate, propionate, and butyrate has a normal value close to 60:20:20 [36]. The concentration of isoacids (isobutyric, isovaleric, and isocaproic) makes it possible to evaluate proteolytic bacterial activity as the ratio of all isoacids to unbranched chain acids (IsoCn/Cn) [9]. The anaerobic index reflects the ratio of aerobic to anaerobic bacteria. The shift of this index towards more negative values indicates a change in the balance of aerobic and anaerobic microorganisms in favor of the latter [9].
The results of a meta-analysis of 15 studies conducted by Sun et al. suggest that patients with IBS-D have an increased concentration of butyric acid in fecal samples [11]. Farup et al. demonstrated that patients with IBS-D, as compared with the control group, showed an increased content of acetate and propionate as well as an increase in the total concentration of SCFAs in their feces in comparison with healthy controls [12].
In our study, patients with IBS-D and FD overlap demonstrated an increase in the absolute levels of the main types of SCFAs: acetate, propionate, and butyrate. The observed increase in absolute propionic acid content is consistent with the results of almost all previously published studies where patients with IBS-D were examined as the main group. The data on changes in the content of acetic and butyric acids are contradictory; studies have reported both a decrease [37] and an increase in the level of these acids [38] as well as a level comparable to that of the control [39].
SCFAs are involved in several physiological processes. Their regulatory functions depend on the activation of specific G protein-coupled receptors, which subsequently initiate cell-specific signaling cascades. Butyric acid is known to inhibit interleukin-12 and increases the production of interleukin-10, thereby preventing the formation of an excessive immune response [12]. However, butyric acid enhances gastrointestinal motility, which can lead to diarrhea. In IBS-D, the first effect is beneficial, considering the regression of inflammatory changes in the intestinal wall, while the second mechanism may augment clinical manifestations. Although in our study it was butyrate that did not show a significant correlation with the severity of diarrhea, it did exist for acetate and isoacids. At the same time, almost all SCFA fractions showed a positive correlation with the severity of the need to urgently empty the intestines. This confirms the controversial role of SCFA in IBS-D. Butyric acid also contributes to maintaining favorable conditions for bacterial activity by limiting oxygen diffusion from colonocytes to the luminal part of the colon [40].
Acetic and propionic acids, which are ligands of the GPR43 receptor, inhibit the NF-κB signaling pathway and reduce the local inflammatory response in the intestine [41,42]. In addition, propionic acid interacts with the GPR41 receptor and reduces the secretion of pro-inflammatory cytokines, such as interleukins-4 and -5, and TNF-α [43].
Indirect proof of the beneficial effect of increased SCFA production in IBS-D on the suppression of intestinal inflammation can be found when analyzing changes in the production of these acids in inflammatory bowel disorder (IBD). A meta-analysis from Xu et al. showed a decrease in the content of all main forms of SCFAs (acetic, propionic, and butyric acid) in the exacerbation of ulcerative colitis when compared to that in healthy individuals. Concurrently, the level of butyric acid increased, compared to that in the control group, in patients with ulcerative colitis in remission [44]. Therefore, marked inflammation in the intestine during IBD exacerbation is associated with a low level of SCFAs in the feces, while minimal inflammation in IBS and IBD remission is associated with their high levels. This suggests that the metabolic function of the intestinal microbiota may play an important role in both the development of IBD remission and in maintaining intestinal inflammation at a minimum level in IBS, preventing its potential transformation into IBD.
Normally, SCFAs are synthesized in a certain proportion, close to 60:20:20. A change in the relative content of the main SCFAs may indicate the predominance of the metabolic activity of aerobic or anaerobic flora [9]. However, no data suggesting a significant change in the relative content of SCFAs were obtained in this study. When analyzing the literature data, we did not find information on whether this proportion was maintained in patients with IBD.
SCFA isoforms are normally formed in minimal amounts in the intestines. Intestinal mucus proteins normally serve as substrates for the formation of isoSCFAs. Therefore, the increase in the number of isoacids and the ratio of IsoCn/Cn observed in our patients suggests an increase in the activity of bacteria with a pronounced proteolytic potential. According to the literature, pronounced proteolytic activity is typical for Streptococcus, Lachnospiraceae, Lactobacillales, Clostridium, and Pseudomonadaceae [45]. In our study, patients had a significantly higher content of bacteria of the Pseudomonadaceae family, compared to the control group, which may be the reason for the increase in the overall proteolytic activity of the microbiota.
A limitation of our study is the lack of analysis of intestinal inflammation markers, including fecal calprotectin levels. Further research is required to verify our finding in larger and different populations and to clarify the role of the intestinal microbiota in inhibiting the progression of minimal intestinal inflammation in functional digestive diseases.

5. Conclusions

This study revealed that patients with IBS-D and FD overlap demonstrated changes in the composition and function of the gut microbiota that can favor the inhibition of intestinal inflammation in response to bacterial translocation caused by an increase in the permeability of the intestinal barrier in IBS.

Author Contributions

Conceptualization, E.P. and V.I.; formal analysis, A.K. (Aleksandra Kovaleva), R.M., O.Z., G.K. and V.I.; investigation, A.K. (Aleksandra Kovaleva), M.F. and A.K. (Anna Karchevskaya); methodology, E.P. and V.I.; software, G.K.; supervision, E.P., O.S., A.K. (Anna Kudryavtseva) and V.I.; writing—original draft, A.K. (Aleksandra Kovaleva) and R.M.; writing—review and editing, E.P., O.Z., O.S., A.K. (Anna Kudryavtseva), G.K., M.F., A.K. (Anna Karchevskaya) and V.I. All authors have read and agreed to the published version of the manuscript.

Funding

This research received no external funding.

Institutional Review Board Statement

This study was approved by the Local Ethic Committee (No. 06-21 d/d 7 April 2021) of Sechenov University.

Informed Consent Statement

Informed consent was obtained from all subjects involved in the study.

Data Availability Statement

The datasets may be available from the corresponding author on reasonable request.

Conflicts of Interest

The authors declare no conflict of interest.

References

  1. Lacy, B.E.; Mearin, F.; Chang, L.; Chey, W.D.; Lembo, A.J.; Simren, M.; Spiller, R. Bowel Disorders. Gastroenterology 2016, 150, 1393–1407. [Google Scholar] [CrossRef] [Green Version]
  2. Stanghellini, V.; Chan, F.K.; Hasler, W.L.; Malagelada, J.R.; Suzuki, H.; Tack, J.; Talley, N.J. Gastroduodenal Disorders. Gastroenterology 2016, 150, 1380–1392. [Google Scholar] [CrossRef] [PubMed]
  3. Ivashkin, V.T.; Maev, I.V.; Shelygin, Y.A.; Baranskaya, E.K.; Belous, S.S.; Belousova, E.A.; Beniashvili, A.G.; Vasilyev, S.V.; Veselov, A.V.; Grigoryev, E.G.; et al. Diagnosis and Treatment of Irritable Bowel Syndrome: Clinical Recommendations of the Russian Gastroenterological Association and Association of Coloproctologists of Russia. Russ. J. Gastroenterol. Hepatol. Coloproctol 2021, 31, 74–95. [Google Scholar] [CrossRef]
  4. Jalanka-Tuovinen, J.; Salonen, A.; Nikkilä, J.; Immonen, O.; Kekkonen, R.; Lahti, L.; Palva, A.; de Vos, W.M. Intestinal Microbiota in Healthy Adults: Temporal Analysis Reveals Individual and Common Core and Relation to Intestinal Symptoms. PLoS ONE 2011, 6, e23035. [Google Scholar] [CrossRef]
  5. Shreiner, A.B.; Kao, J.Y.; Young, V.B. The gut microbiome in health and in disease. Curr. Opin. Gastroenterol. 2015, 31, 69–75. [Google Scholar] [CrossRef]
  6. Jandhyala, S.M.; Talukdar, R.; Subramanyam, C.; Vuyyuru, H.; Sasikala, M.; Nageshwar Reddy, D. Role of the normal gut microbiota. World J. Gastroenterol. 2015, 21, 8787–8803. [Google Scholar] [CrossRef]
  7. Al Bander, Z.; Nitert, M.D.; Mousa, A.; Naderpoor, N. The Gut Microbiota and Inflammation: An Overview. Int. J. Environ. Res. Public Health 2020, 17, 7618. [Google Scholar] [CrossRef] [PubMed]
  8. Ng, Q.X.; Soh, A.Y.S.; Loke, W.; Lim, D.Y.; Yeo, W.-S. The role of inflammation in irritable bowel syndrome (IBS). J. Inflamm. Res. 2018, 11, 345–349. [Google Scholar] [CrossRef] [PubMed] [Green Version]
  9. Zolnikova, O.Y.; Potskhverashvili, N.D.; Kokina, N.I.; Trukhmanov, A.S.; Ivashkin, V.T. Intestinal Short-Chain Fatty Acids in Patients with Bronchial Asthma. Russ. J. Gastroenterol. Hepatol. Coloproctol. 2019, 29, 53–59. [Google Scholar] [CrossRef]
  10. Ng, Q.X.; Yau, C.E.; Yaow, C.Y.L.; Chong, R.I.H.; Chong, N.Z.-Y.; Teoh, S.E.; Lim, Y.L.; Soh, A.Y.S.; Ng, W.K.; Thumboo, J. What Has Longitudinal ‘Omics’ Studies Taught Us about Irritable Bowel Syndrome? A Systematic Review. Metabolites 2023, 13, 484. [Google Scholar] [CrossRef]
  11. Sun, Q.; Jia, Q.; Song, L.; Duan, L. Alterations in fecal short-chain fatty acids in patients with irritable bowel syndrome. Medicine 2019, 98, e14513. [Google Scholar] [CrossRef] [PubMed]
  12. Farup, P.G.; Rudi, K.; Hestad, K. Faecal short-chain fatty acids - a diagnostic biomarker for irritable bowel syndrome? BMC Gastroenterol. 2016, 16, 51. [Google Scholar] [CrossRef] [PubMed] [Green Version]
  13. Ivashkin, V.; Sheptulin, A.; Lapina, T.; Trukhmanov, A.; Kartavenko, I.; Kiprianis, V.; Okhlobystina, O.; Mayev, I. Diagnosis and treatment of the functional dyspepsia: Clinical guidelines of the Russian Gastroenterological Association. Russ. J. Gastroenterol. Hepatol. Coloproctol. 2017, 27, 50–61. [Google Scholar] [CrossRef]
  14. Kulich, K.R.; Madisch, A.; Pacini, F.; Piqué, J.M.; Regula, J.; Van Rensburg, C.J.; Újszászy, L.; Carlsson, J.; Halling, K.; Wiklund, I.K. Reliability and validity of the Gastrointestinal Symptom Rating Scale (GSRS) and Quality of Life in Reflux and Dyspepsia (QOLRAD) questionnaire in dyspepsia: A six-country study. Health Qual. Life Outcomes 2008, 6, 12. [Google Scholar] [CrossRef] [PubMed] [Green Version]
  15. Herlemann, D.P.R.; Labrenz, M.; Jürgens, K.; Bertilsson, S.; Waniek, J.J.; Andersson, A.F. Transitions in bacterial communities along the 2000 km salinity gradient of the Baltic Sea. ISME J. 2011, 5, 1571–1579. [Google Scholar] [CrossRef] [Green Version]
  16. Parikh, H.I.; Koparde, V.N.; Bradley, S.P.; Buck, G.A.; Sheth, N.U. MeFiT: Merging and filtering tool for illumina paired-end reads for 16S rRNA amplicon sequencing. BMC Bioinform. 2016, 17, 491. [Google Scholar] [CrossRef] [Green Version]
  17. Callahan, B.J.; Mcmurdie, P.J.; Rosen, M.J.; Han, A.W.; Johnson, A.J.A.; Holmes, S.P. DADA2: High-resolution sample inference from Illumina amplicon data. Nat. Methods 2016, 13, 581–583. [Google Scholar] [CrossRef] [Green Version]
  18. Wang, Q.; Garrity, G.M.; Tiedje, J.M.; Cole, J.R. Naïve Bayesian Classifier for Rapid Assignment of rRNA Sequences into the New Bacterial Taxonomy. Appl. Environ. Microbiol. 2007, 73, 5261–5267. [Google Scholar] [CrossRef] [PubMed] [Green Version]
  19. Quast, C.; Pruesse, E.; Yilmaz, P.; Gerken, J.; Schweer, T.; Yarza, P.; Peplies, J.; Glöckner, F.O. The SILVA Ribosomal RNA Gene Database Project: Improved Data Processing and Web-Based Tools. Nucleic Acids Res. 2013, 4, D590–D596. [Google Scholar] [CrossRef]
  20. Fernandes, A.D.; Macklaim, J.M.; Linn, T.G.; Reid, G.; Gloor, G.B.; Fernandes, A.D.; Macklaim, J.M.; Linn, T.G.; Reid, G.; Gloor, G.B. ANOVA-Like Differential Expression (ALDEx) Analysis for Mixed Population RNA-Seq. PLoS ONE 2013, 8, e67019. [Google Scholar] [CrossRef]
  21. Zhuang, X.; Xiong, L.; Li, L.; Li, M.; Chen, M. Alterations of gut microbiota in patients with irritable bowel syndrome: A systematic review and meta-analysis. J. Gastroenterol. Hepatol. 2017, 32, 28–38. [Google Scholar] [CrossRef] [PubMed]
  22. Liu, H.N.; Wu, H.; Chen, Y.Z.; Chen, Y.J.; Shen, X.Z.; Liu, T.T. Altered molecular signature of intestinal microbiota in irritable bowel syndrome patients compared with healthy controls: A systematic review and meta-analysis. Dig. Liver Dis. 2017, 49, 331–337. [Google Scholar] [CrossRef] [PubMed]
  23. Duan, R.; Zhu, S.; Wang, B.; Duan, L. Alterations of Gut Microbiota in Patients With Irritable Bowel Syndrome Based on 16S rRNA-Targeted Sequencing. Clin. Transl. Gastroenterol. 2019, 10, e00012. [Google Scholar] [CrossRef] [PubMed]
  24. Zhuang, X.; Tian, Z.; Li, L.; Zeng, Z.; Chen, M.; Xiong, L. Fecal Microbiota Alterations Associated With Diarrhea-Predominant Irritable Bowel Syndrome. Front. Microbiol. 2018, 9, 1600. [Google Scholar] [CrossRef] [PubMed] [Green Version]
  25. Su, T.; Liu, R.; Lee, A.; Long, Y.; Du, L.; Lai, S.; Chen, X.; Wang, L.; Si, J.; Owyang, C.; et al. Altered Intestinal Microbiota with Increased Abundance of Prevotella Is Associated with High Risk of Diarrhea-Predominant Irritable Bowel Syndrome. Gastroenterol. Res. Pr. 2018, 2018, 6961783. [Google Scholar] [CrossRef] [PubMed] [Green Version]
  26. Rangel, I.; Sundin, J.; Fuentes, S.; Repsilber, D.; de Vos, W.M.; Brummer, R.J. The relationship between faecal-associated and mucosal-associated microbiota in irritable bowel syndrome patients and healthy subjects. Aliment. Pharmacol. Ther. 2015, 42, 1211–1221. [Google Scholar] [CrossRef] [Green Version]
  27. Carroll, I.M.; Ringel-Kulka, T.; Siddle, J.P.; Ringel, Y. Alterations in composition and diversity of the intestinal microbiota in patients with diarrhea-predominant irritable bowel syndrome. Neurogastroenterol. Motil. 2012, 24, 521–530. [Google Scholar] [CrossRef] [Green Version]
  28. Krogius-Kurikka, L.; Lyra, A.; Malinen, E.; Aarnikunnas, J.; Tuimala, J.; Paulin, L.; Mäkivuokko, H.; Kajander, K.; Palva, A. Microbial community analysis reveals high level phylogenetic alterations in the overall gastrointestinal microbiota of diarrhoea-predominant irritable bowel syndrome sufferers. BMC Gastroenterol. 2009, 9, 95. [Google Scholar] [CrossRef] [Green Version]
  29. Shukla, R.; Ghoshal, U.; Dhole, T.N.; Ghoshal, U.C. Fecal Microbiota in Patients with Irritable Bowel Syndrome Compared with Healthy Controls Using Real-Time Polymerase Chain Reaction: An Evidence of Dysbiosis. Dig. Dis. Sci. 2015, 60, 2953–2962. [Google Scholar] [CrossRef]
  30. Himmel, M.E.; Yao, Y.; Orban, P.C.; Steiner, T.S.; Levings, M.K. Regulatory T-cell therapy for inflammatory bowel disease: More questions than answers. Immunology 2012, 136, 115–122. [Google Scholar] [CrossRef]
  31. Kaakoush, N.O. Insights into the Role of Erysipelotrichaceae in the Human Host. Front. Cell. Infect. Microbiol. 2015, 5, 84. [Google Scholar] [CrossRef] [Green Version]
  32. Ivashkin, V.; Poluektov, Y.; Kogan, E.; Shifrin, O.; Sheptulin, A.; Kovaleva, A.; Kurbatova, A.; Krasnov, G.; Poluektova, E. Disruption of the pro-inflammatory, anti-inflammatory cytokines and tight junction proteins expression, associated with changes of the composition of the gut microbiota in patients with irritable bowel syndrome. PLoS ONE 2021, 16, e0252930. [Google Scholar] [CrossRef] [PubMed]
  33. Mitselou, A.; Grammeniatis, V.; Varouktsi, A.; Papadatos, S.S.; Katsanos, K.; Galani, V. Proinflammatory cytokines in irritable bowel syndrome: A comparison with inflammatory bowel disease. Intest. Res. 2020, 18, 115–120. [Google Scholar] [CrossRef] [PubMed] [Green Version]
  34. Ivashkin, V.T.; Zolnikova, O.Y. Irritable Bowel Syndrome in Terms of Changes in the Microbiota. Russ. J. Gastroenterol. Hepatol. Coloproctol. 2019, 29, 68–76. [Google Scholar] [CrossRef]
  35. Ulyanin, A.; Poluektova, Y.; Pavlov, C.; Ivashkin, V. Potential of nutraceutical products for irritable bowel syndrome remission maintenance. Russ. J. Gastroenterol. Hepatol. Coloproctol. 2018, 28, 101–108. [Google Scholar] [CrossRef]
  36. Den Besten, G.; van Eunen, K.; Groen, A.K.; Venema, K.; Reijngoud, D.-J.; Bakker, B.M. The role of short-chain fatty acids in the interplay between diet, gut microbiota, and host energy metabolism. J. Lipid Res. 2013, 54, 2325–2340. [Google Scholar] [CrossRef] [Green Version]
  37. Fredericks, E.; Theunissen, R.; Roux, S. Short chain fatty acids and monocarboxylate transporters in irritable bowel syndrome. Turk. J. Gastroenterol. 2020, 31, 840–847. [Google Scholar] [CrossRef]
  38. Gargari, G.; Taverniti, V.; Gardana, C.; Cremon, C.; Canducci, F.; Pagano, I.; Barbaro, M.R.; Bellacosa, L.; Castellazzi, A.M.; Valsecchi, C.; et al. Fecal Clostridiales distribution and short-chain fatty acids reflect bowel habits in irritable bowel syndrome. Environ. Microbiol. 2018, 20, 3201–3213. [Google Scholar] [CrossRef] [PubMed]
  39. Ringel-Kulka, T.; Choi, C.H.; Temas, D.; Kim, A.; Maier, D.M.; Scott, K.; A Galanko, J.; Ringel, Y. Altered Colonic Bacterial Fermentation as a Potential Pathophysiological Factor in Irritable Bowel Syndrome. Am. J. Gastroenterol. 2015, 110, 1339–1346. [Google Scholar] [CrossRef] [Green Version]
  40. De Vos, W.M.; Tilg, H.; Van Hul, M.; Cani, P.D. Gut microbiome and health: Mechanistic insights. Gut 2022, 71, 1020–1032. [Google Scholar] [CrossRef]
  41. Kobayashi, M.; Mikami, D.; Kimura, H.; Kamiyama, K.; Morikawa, Y.; Yokoi, S.; Kasuno, K.; Takahashi, N.; Taniguchi, T.; Iwano, M. Short-chain fatty acids, GPR41 and GPR43 ligands, inhibit TNF-α-induced MCP-1 expression by modulating p38 and JNK signaling pathways in human renal cortical epithelial cells. Biochem. Biophys. Res. Commun. 2017, 486, 499–505. [Google Scholar] [CrossRef] [PubMed]
  42. Park, B.-O.; Kang, J.S.; Paudel, S.; Park, S.G.; Park, B.C.; Han, S.-B.; Kwak, Y.-S.; Kim, J.-H.; Kim, S. Novel GPR43 Agonists Exert an Anti-Inflammatory Effect in a Colitis Model. Biomol. Ther. 2022, 30, 48–54. [Google Scholar] [CrossRef] [PubMed]
  43. He, J.; Zhang, P.; Shen, L.; Niu, L.; Tan, Y.; Chen, L.; Zhao, Y.; Bai, L.; Hao, X.; Li, X.; et al. Short-Chain Fatty Acids and Their Association with Signalling Pathways in Inflammation, Glucose and Lipid Metabolism. Int. J. Mol. Sci. 2020, 21, 6356. [Google Scholar] [CrossRef] [PubMed]
  44. Xu, H.-M.; Zhao, H.-L.; Guo, G.-J.; Xu, J.; Zhou, Y.-L.; Huang, H.-L.; Nie, Y.-Q. Characterization of short-chain fatty acids in patients with ulcerative colitis: A meta-analysis. BMC Gastroenterol. 2022, 22, 117. [Google Scholar] [CrossRef]
  45. Carroll, I.M.; Maharshak, N. Enteric bacterial proteases in inflammatory bowel disease- pathophysiology and clinical implications. World J. Gastroenterol. 2013, 19, 7531–7543. [Google Scholar] [CrossRef]
Figure 1. Absolute levels of fecal short-chain fatty acids (SCFA) fractions (acetate, propionate, butyrate, and isoacids) in diarrhea-predominant irritable bowel syndrome and functional dyspepsia combination (I + D) and in healthy individuals from the control group. *—the difference between the groups reached statistical significance.
Gastrointestdisord 05 00024 g001
Figure 2. Flow diagram.
Gastrointestdisord 05 00024 g002
Table 1. Symptoms of digestive disorders according to Gastrointestinal Symptom Rating Scale (GSRS) in patients with diarrhea-predominant irritable bowel syndrome and functional dyspepsia combination (I + D) and in healthy individuals from the control group.
SymptomI + D (n = 60)Control (n = 20)p
Pain or discomfort in upper abdomen2 [1–3]1 [1–1]<0.001
Heartburn2 [1–3]1 [1–1]<0.001
Acid reflux1 [1–3]1 [1–1]0.002
Hunger pangs1 [1–3]1 [1–1]0.002
Nausea2 [1–3]1 [1–1]<0.001
Rumbling4 [3–5]1 [1–1]<0.001
Stomach felt bloating3 [3–5]1 [1–1]<0.001
Burping2 [2–4]1 [1–1]<0.001
Passing gas or flatus3 [2–4]1 [1–1]<0.001
Constipation1 [1–1]1 [1–1]0.116
Increased stool frequency3 [2–4]1 [1–1]<0.001
Loose stool4 [3–5]1 [1–1]<0.001
Hard stool1 [1–2]1 [1–1]0.056
Urgent need to have a bowel movement1 [1–2]1 [1–1]<0.001
Sensation of incomplete bowel emptying2 [2–3]1 [1–1]<0.001
Table 2. Comparative assessment of the abundance (reads) of the main bacterial phyla and classes and alpha-diversity indices of fecal microbiota in patients with diarrhea-predominant irritable bowel syndrome and functional dyspepsia (I + D) and in healthy individuals from the control group.
Taxon/IndexTaxon RankI + D (n = 60)Control (n = 20)p
Shannon index-4.52 [4.08–4.83]4.54 [4.43–4.79]0.562
Chao1 index-567 [456–758]600 [477–690]1.000
ACE index-554 [455–746]589 [469–680]0.918
Firmicutesphylum83,560.270,600.20.075
Bacteroidotaphylum13,721.427,140.80.075
Actinobacteriotaphylum3733.04357.40.411
Proteobacteriaphylum2410.62739.50.570
Verrucomicrobiotaphylum628.7138.80.340
Desulfobacterotaphylum98.8137.60.189
Clostridiaclass66,610.164,506.20.632
Bacilliclass14,653.13373.50.102
Bacteroidiaclass13,719.227,140.70.115
Actinobacteriaclass3147.13317.00.434
Gammaproteobacteriaclass2339.42712.10.678
Negativicutesclass2157.12683.90.737
Verrucomicrobiaeclass628.7138.60.434
Coriobacteriiaclass583.61040.10.853
Table 3. Comparative assessment of the abundance (reads) of gut bacterial orders, families, and genera in fecal samples in patients with diarrhea-predominant irritable bowel syndrome and functional dyspepsia (I + D) and in healthy individuals from the control group (only significant differences are shown).
TaxonTaxon RankLogFCI + D (n = 60)Control (n = 20)p
Holdemanellagenus9.016183.80.0<0.001
Erysipelotrichaceaefamily5.027294.1212.90.035
Prevotellaceaefamily2.881956.4254.50.036
Erysipelotrichalesorder2.709965.01527.80.001
Agathobactergenus2.287555.11547.10.003
Slackiagenus2.2344.40.00.009
Lactococcusgenus1.8440.92.70.011
Pseudomonadalesorder1.73144.835.30.006
Pseudomonadaceaefamily1.69139.535.10.013
Pseudomonasgenus1.67137.134.90.009
Stenotrophomonasgenus1.6076.417.10.003
Xanthomonadaceaefamily1.6077.117.40.003
Xanthomonadalesorder1.6077.117.40.001
Rhizobiaceaefamily1.1028.46.80.036
Erysipelatoclostridiaceaefamily1.022669.31314.80.039
Lachnospiraceaefamily0.3332,140.125,607.60.035
Lachnospiralesorder0.3332,154.725,619.30.02
Flavonifractorgenus−1.0768.5156.40.039
Bacteroidaceaefamily−1.159830.421,868.10.036
Tannerellaceaefamily−1.33590.31501.80.036
Rikenellaceaefamily−1.42893.92404.90.047
Bilophilagenus−1.4642.3137.40.009
Merdibactergenus−1.496.239.30.003
Peptostreptococcaceaefamily−1.51332.4971.80.044
Parabacteroidesgenus−1.53504.61475.00.018
Eisenbergiellagenus−1.966.359.40.003
Hungatellagenus−2.0816.5108.70.009
Burkholderiaceaefamily−2.1411.692.1<0.001
Ralstoniagenus−2.1711.292.1<0.001
Frisingicoccusgenus−3.990.2182.10.003
LogFC is a binary logarithm of the ratio of the average proportion of bacteria of a given taxa in patients to that in healthy individuals.
Table 4. Absolute level of SCFAs (mg/g), IsoCn/Cn ratio, anaerobic index value, and relative level of SCFAs in patients with IBS-D and FD as well as healthy individuals in the control group.
ParameterGroupMean ValueSDp
Absolute total level of SCFAsI + D3.191.690.003
Control1.811.29
Absolute level of acetic acid (C2)I + D1.580.780.003
Control0.930.64
Absolute level of propionic acid (C3)I + D0.750.490.002
Control0.370.3
Absolute level of butyric acid (C4)I + D0.620.40<0.001
Control0.240.21
Absolute level of isoacidsI + D0.190.100.028
Control0.140.1
IsoCn/CnI + D0.571.40.013
Control0.520.23
Anaerobic indexI + D−0.790.330.046
Control−0.690.19
Relative level of acetic acid (C2)I + D0.550.070.111
Control0.560.12
Relative level of propionic acid (C3)I + D0.240.050.463
Control0.230.04
Relative level of butyric acid (C4)I + D0.210.060.178
Control0.170.07
Relative level of isoacidsI + D0.070.0350.107
Control0.090.03
Table 5. Significant correlations between the abundances of bacterial families in the gut microbiota and biomarkers of their metabolic activities (r; p).
Gut Microbiota TaxonAcetic Acid (C2)Propionic Acid (C3)Butyric Acid (C4)IsoacidsTotal Acid ContentAnaerobic Index
Acidaminococcaceae −0.55; <0.001 0.31; 0.04
Actinomycetaceae 0.30; 0.050.39; 0.0080.30; 0.04−0.45; 0.002
Aerococcaceae0.42; 0.0040.35; 0.020.55; <0.001 0.46; 0.001
Akkermansiaceae 0.38; 0.01 0.32; 0.04
Anaerovoracaceae−0.61; <0.001−0.63; <0.001−0.71; <0.001 −0.65; <0.0010.51; <0.001
Atopobiaceae 0.39; 0.008
Bacteroidaceae 0.39; 0.008
Barnesiellaceae −0.35; 0.02−0.49; <0.001 −0.36; 0.020.60; <0.001
Bifidobacteriaceae −0.32; 0.03
Burkholderiaceae−0.32; 0.03−0.38; 0.01 −0.31; 0.04
Butyricicoccaceae 0.37; 0.01
Carnobacteriaceae0.33; 0.030.52; <0.0010.47; 0.001 0.47; 0.001−0.65; <0.001
Chitinophagaceae −0.31; 0.040.32; 0.03
Christensenellaceae−0.34; 0.02−0.47; 0.001−0.54; <0.001 −0.46; 0.0010.57; <0.001
Clostridiaceae−0.31; 0.04−0.45; 0.002 −0.34; 0.020.35; 0.02
Comamonadaceae −0.41; 0.005 −0.30; 0.050.42; 0.004
Defluviitaleaceae −0.40; 0.007
Enterococcaceae 0.51; <0.001 0.32; 0.03−0.30; 0.04
Erysipelotrichaceae −0.37; 0.01
Fusobacteriaceae 0.29; 0.05 0.31; 0.04
Gemellaceae0.46; 0.0020.55; <0.0010.63; <0.001 0.57; <0.001−0.64; <0.001
Lachnospiraceae0.32; 0.030.50; <0.001 0.32; 0.04−0.55; <0.001
Lactobacillaceae−0.35; 0.02 −0.30; 0.04
Leuconostocaceae −0.48; 0.0008 0.36; 0.02
Marinifilaceae−0.37; 0.01−0.41; 0.005−0.39; 0.008 −0.33; 0.030.45; 0.002
Methanobacteriaceae−0.48; 0.001−0.42; 0.004−0.45; 0.002 −0.40; 0.006
Micrococcaceae 0.34; 0.020.38; 0.01 0.31; 0.04−0.63; <0.001
Monoglobaceae 0.32; 0.03
Mycobacteriaceae−0.32; 0.03−0.39; 0.008−0.34; 0.02 −0.33; 0.030.37; 0.01
Oscillospiraceae−0.33; 0.03−0.45; 0.002 −0.31; 0.040.34; 0.02
Oxalobacteraceae−0.31; 0.04−0.35; 0.02−0.45; 0.002 −0.34; 0.020.43; 0.004
Pasteurellaceae 0.34; 0.020.57; <0.001 0.36; 0.01−0.65; <0.001
Peptococcaceae−0.33; 0.03−0.33; 0.02
Peptostreptococcaceae−0.30; 0.05−0.45; 0.002 −0.33; 0.030.32; 0.03
Puniceicoccaceae−0.32; 0.03−0.37; 0.01−0.38; 0.01 −0.32; 0.030.40; 0.007
Rikenellaceae −0.41; 0.005−0.40; 0.007 −0.36; 0.010.56; <0.001
Saccharimonadaceae −0.56; <0.001
Selenomonadaceae 0.33; 0.020.41; 0.005−0.30; 0.05 −0.50; <0.001
Solimonadaceae−0.38; 0.009−0.40; 0.007−0.34; 0.02 −0.36; 0.01
Solirubrobacteraceae−0.30; 0.05−0.34; 0.02−0.32; 0.03 −0.31; 0.040.33; 0.03
Streptococcaceae 0.37; 0.010.42; 0.004 0.33; 0.03−0.74; <0.001
Sutterellaceae 0.33; 0.03
Tannerellaceae −0.31; 0.04−0.44; 0.002 −0.32; 0.030.55; <0.001
Vibrionaceae −0.31; 0.04
Weeksellaceae−0.30; 0.05−0.34; 0.02−0.32; 0.03 −0.31; 0.040.33; 0.03
Disclaimer/Publisher’s Note: The statements, opinions and data contained in all publications are solely those of the individual author(s) and contributor(s) and not of MDPI and/or the editor(s). MDPI and/or the editor(s) disclaim responsibility for any injury to people or property resulting from any ideas, methods, instructions or products referred to in the content.

