


In Situ Alteration of the Hydro-Mechanical Behaviour of a Compacted Stabilised Expansive Soil

1
Laboratoire Énergies & Mécanique Théorique et Appliquée LEMTA (UMR 7563), CNRS, Université de Lorraine, 54000 Nancy, France
2
Ginger CEBTP, 78990 Élancourt, France
*
Author to whom correspondence should be addressed.
Geotechnics 2023, 3(3), 921-936; https://doi.org/10.3390/geotechnics3030049
Submission received: 20 August 2023
/
Revised: 1 September 2023
/
Accepted: 4 September 2023
/
Published: 13 September 2023
(This article belongs to the Special Issue Recent Advances in Geotechnical Engineering)
Abstract
:This paper assesses the performance of an embankment constructed in 2010 with a stabilised expansive soil. Two types of treatment were employed at construction time: 4% lime and a mix of 2% lime and 3% cement. A sampling campaign was carried out in 2021 to evaluate the long-term performance of the stabilised soil properties. To assess the compressibility of the soil, oedometer tests were carried out on samples from different parts of the embankment. The results were compared to the compression curve of the untreated soil, also sampled in the same embankment. Complementary shrinkage tests were performed to investigate the effect of the treatment on swelling and shrinkage. The obtained results show that the yield stress of the material from the outer part was inferior to 100 kPa, similarly to the yield stress of the untreated soil, demonstrating a strong alteration in the effect of both treatments over time. This alteration was noticeable to a distance of approximately 2 m from the external surface. Beyond this distance, the performance of the soil was comparable to the behaviour of recently treated soil, with yield stresses close to 1000 kPa. These observations, similar for each treatment dosage, raise questions as to the durability of the treatment on the outer part of the backfill.
1. Introduction
Soil treatment with lime and/or cement is widely used in geotechnical engineering to improve low-quality soils for the construction of structures such as pavements, embankments, etc. The treatment improves the mechanical characteristics of the material, such as strength and elastic modulus, by creating cementitious bonds between the soil particles [1,2,3,4]. Soil treatment is also widely used to lower the swelling and shrinkage characteristics of expansive soils [5,6,7].
Aside from the short-term benefits of using a treatment, a key issue is the long-term behaviour of the treated soil. Numerous laboratory studies have highlighted the detrimental effects of exposure to climatic conditions on the long-term characteristics of treated materials. Freezing–thawing cycles [8,9,10,11,12,13], leaching [14,15,16,17,18,19] and carbonation processes [20,21,22,23,24,25] are known to alter the beneficial effect of treatment on soil properties. Some authors also showed that alternating dry and wet periods induce a progressive reduction in the mechanical performance of treated soils [10,26,27,28]. For instance, Nabil et al. (2020) studied the impact of subsequent wetting and drying periods on an expansive soil treated with 4% of lime [29]. These hydric cycles induced a decrease of up to 80% of the compressive strength in stabilised specimens after six cycles. Rosone et al. (2018) showed that multiple wetting and drying cycles applied on a lime-treated clay could lead to irreversible changes in its shrinkage and swelling behaviour [30]. Other studies [31,32,33] adapted the experimental procedures for water cycling by controlling the suction in the specimens, highlighting that the amplitude of the cycles controls the intensity of the degradation effects on the treatment. Thus, several concerns exist regarding the long-term characteristics of treated soils exposed to climatic conditions.
The in situ conditions experienced by soil-treated structures are a combination of natural hydric, thermal and/or chemical variations, depending on the type of structure and its location. Despite the need to assess the service life of treated earth structures, little is known about the in situ performance of such stabilised materials several years after construction, and very few studies are available, especially in the case of stabilised expansive soils [30,34,35]. Existing studies faced various issues due to the lack of knowledge about the initial conditions of the stabilised soil at the time of construction, making an analysis of the performance evolution over time difficult. Previous studies have rarely focused on evaluating the performance several years after construction. For instance, only a few authors studied the performance of expansive clays treated with lime in the 1970s [36,37]. Akula et al. (2020) showed that the amount of treatment product was sufficient to maintain a satisfactory performance without extensive comparison with initial parameters [37]. Cuisinier et al. (2012) studied the temporal evolution of the properties of a treated material for an embankment 7 years after its construction [38]. A series of triaxial tests revealed a significant disparity in results between the different specimens. The effects of treatment vanished in different samples, while others showed a significantly higher performance than the untreated soil. This disparity has been attributed to the nature of the soils and the weathering of certain areas of the structure, and it has raised questions as to the execution method at the time of construction. Therefore, it is difficult to decipher the relative impact of initial conditions and the role of climatic conditions to which the tested soil has been exposed.
The main purpose of this paper is to improve the understanding of the effect of exposure to realistic climatic variations on the performance of stabilised expansive compacted clayey soils. Based on the state of the art of the in situ performance of treated soils, it was decided to identify a structure with known initial parameters and extensive control of execution during construction. The experimental embankment selected in this work was built in Héricourt (France) in 2010 as a part of a French research program. The earth structure was constructed with an expansive clayey soil treated with lime and with a mixture of lime and cement. The construction was extensively monitored [39], and soil parameters such as moisture content, temperature and suction were measured over time until this study. Many studies related to the embankment regarding soil-atmosphere interactions have been performed [40,41,42,43,44,45]. In this paper, the characteristics of the material used and the structural characteristics of the earth structure are first detailed. Then, the sampling campaign is explained. Next, the results from compression and shrinkage tests are presented and discussed. The effect of the exposure to climatic conditions on the hydromechanical behaviour of the soil is then evaluated eleven years after completion.
2. The Experimental Embankment
2.1. Soil Characterisation
The embankment was constructed with a clayey soil extracted near the construction site. The soil is an inorganic clay of high plasticity (CH group) according to the Unified Soil Classification System, and its characteristics are given in Table 1. Smectite and muscovite have been identified as the main minerals. The swelling potential of the soil at the optimum moisture content (OMC) was measured as 14.1%, while the swelling pressure of the material treated with 1% lime was 0.1% [31]. The effect of lime treatment on the hydromechanical behaviour of the soil was also investigated in several studies [7,46].
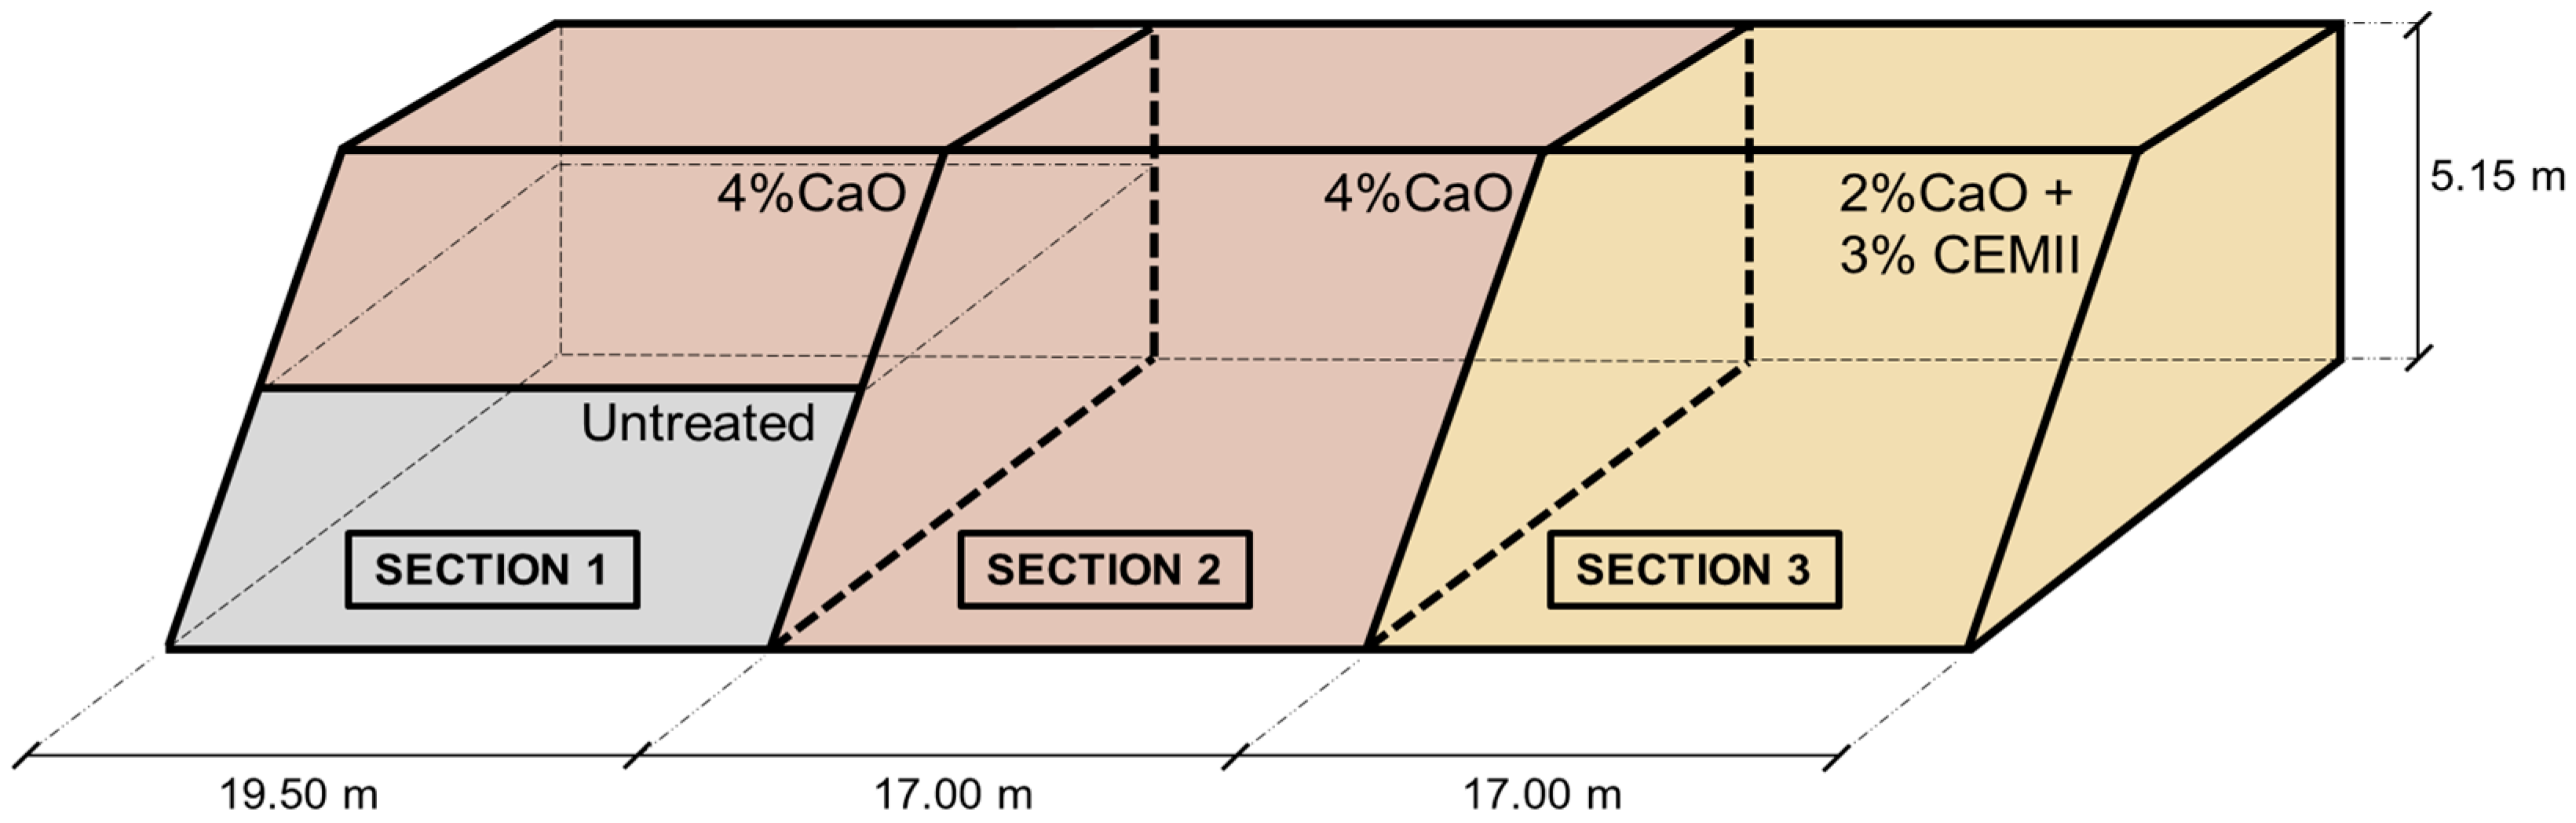
2.2. Design of the Embankment
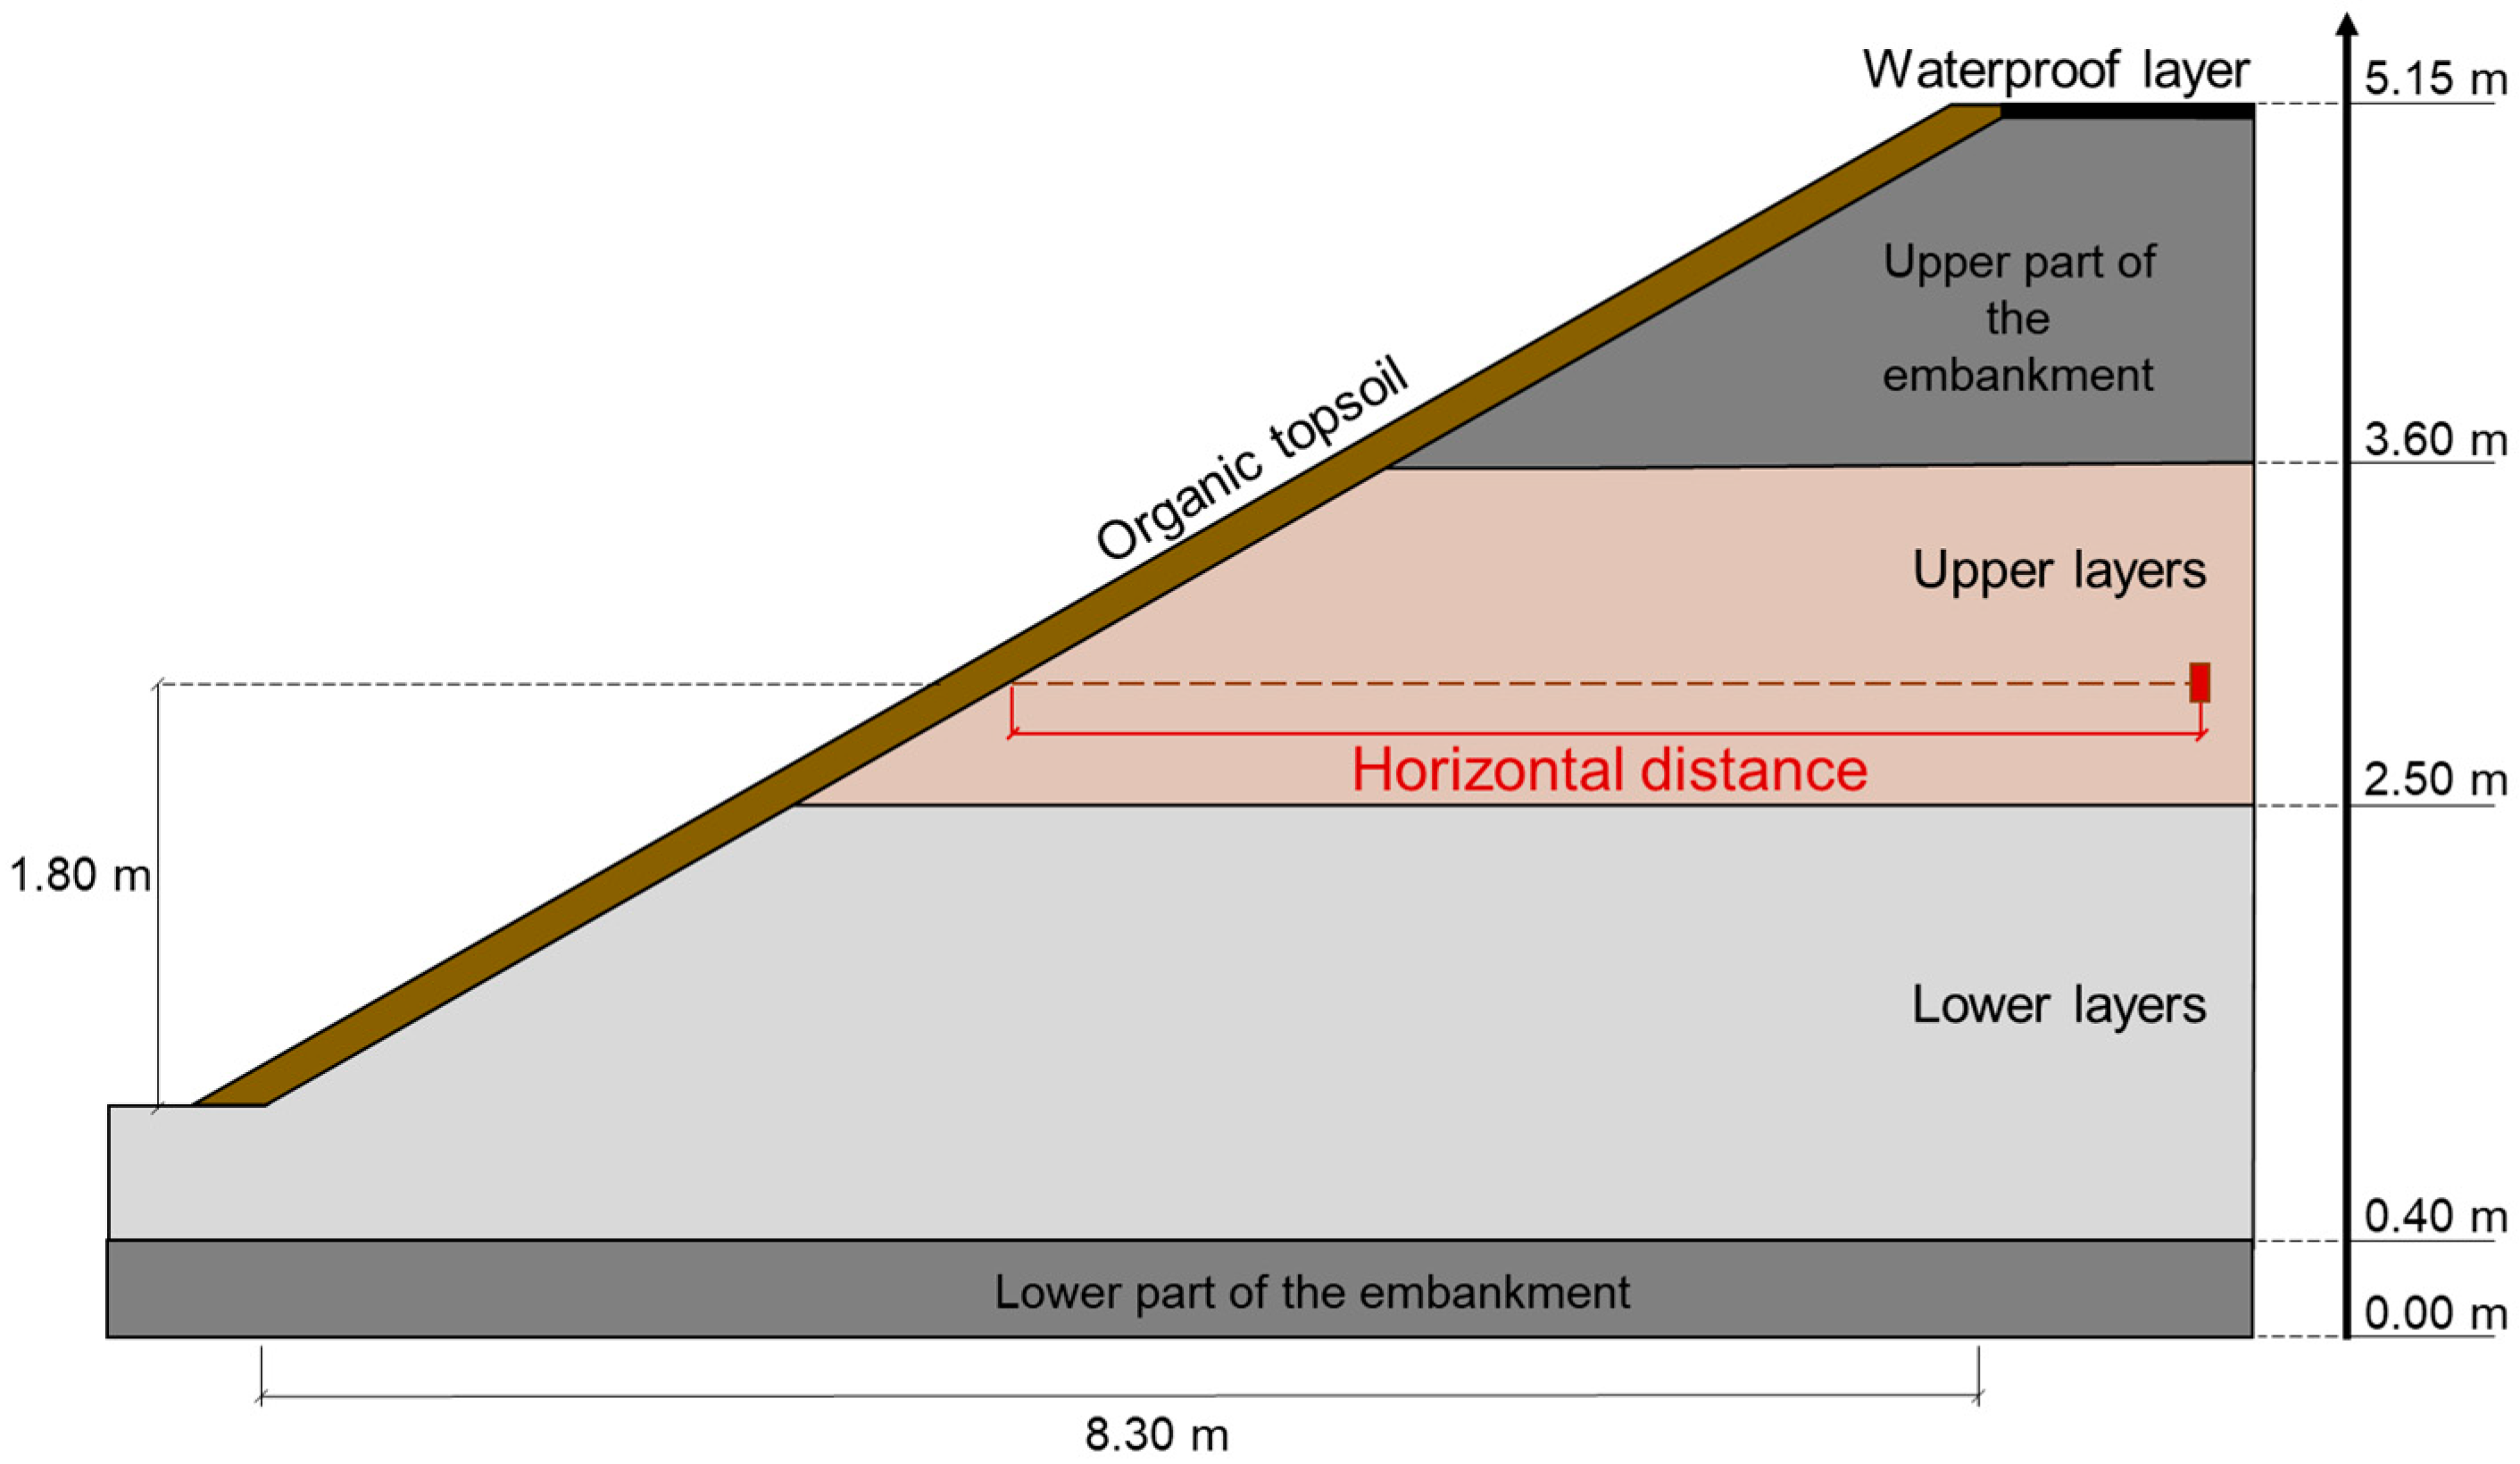
The embankment is 5 m high with a slope of 1:2, and its width is 25 m at the base and 5 m at the top [39]. The embankment was constructed with the clayey soil presented in Section 2.1 and was divided into 3 contiguous sections (Figure 1). For each section, the lower part (from 0.40 to 2.50 m of height) and the upper part (from 2.50 to 3.70 m of height) were built with different treatment mixes (Table 2). The base (from 0 to 0.40 m of height) and the top (from 3.70 to 5.15 m of height) of the embankment were not considered in this study.
Each layer was treated on-site by spreading quicklime/cement depending on the section [39]. Two sections were treated with the same amount of lime to evaluate the repeatability of the construction procedures (Table 2). The compacted untreated clay was used as a building material for the lower layers of section 1. The third section was treated with lime and cement. The quicklime used for the embankment was mainly composed of calcium oxide (97.2%), with a small proportion of magnesium oxide (0.96%). The cement selected was mainly composed of clinker (83%) and quicklime (14%). The binding agent and the soil were first mixed with a pulvimixer at optimum moisture content. Optimum moisture content was measured for each treatment at construction time by performing Proctor tests [39]. The addition of treatment was directly controlled by the self-propelled spreader thanks to a honeycomb rotor, ensuring a longitudinal variation lower than 5% of the target dosage. The soil was then compacted using a sheepsfoot roller. The target dry density during construction was 95% of the maximum dry density (given for each treatment in Table 3), according to available technical guidelines at the time of construction [47].
The embankment was constructed with an excess width of 1 m beyond the finished structure. This excess width was removed at the end of the construction. This method was intended to avoid potential compaction heterogeneities at both sides of the backfill.
An organic topsoil layer of approximately 0.10 m was also added on the edge of the embankment at the end of construction. A 0.05 m waterproof layer of asphalt emulsion was applied on the top of the structure.
2.3. Backfill Characteristics at the Time of Construction
Throughout the construction, multiple tests were performed to determine the actual characteristics of each compacted layer, and each section was investigated. The moisture content of the material was controlled for each 0.30 m layer of stabilised soil. The dry density of each layer of soil was also measured using a gamma-densimeter. The results of these tests are shown in Table 3, where they are compared to the target values of water content and dry density. The observed moisture contents showed that the soil was compacted on the dry side in the first two sections (33.0% for section 1 and 35.0% for section 2, both treated with 4% lime) and at optimum moisture content for section 3. For all sections, the compaction factor was higher than 100%, with a standard deviation of approximately 0.05 Mg/m3.
2.4. Backfill Monitoring
The studied backfill was extensively monitored during its construction [39]. Volumetric moisture content, suction and temperature were recorded every 8 h during the 11 years separating construction time and the sampling campaign in 2021. In situ thermal sensors installed at 0.25 m from the surface did not indicate any temperature below 0 °C [40]. In addition, in situ monitoring showed that suction was between 0 and 300 kPa in the first metre of the backfill [48]. Beyond this distance, temperature and moisture variations were limited.
3. Experimental Program
Samples were retrieved from the three sections of the embankment to assess the hydro-mechanical performances of the treatment. First, the operation method for sampling is discussed. Then, the storage method and sample preparation are presented. Finally, the experimental strategy is introduced.
3.1. Soil Sampling and Specimen Preparation
The sampling campaign was carried out in November 2021. Figure 1 presents the different zones sampled during the operation. Horizontal coring was carried out in the upper part of the three sections, approximately 1.80 m above the natural ground level. Vertical coring was also performed in the three sections from the top of the embankment to sample the lower part of the embankment. Rotational coring with water as the drilling fluid was chosen in order to ensure the quality of the samples. A mean recovery rate of 97% was achieved for the cores.
All cores were stored at 20 ± 5 °C in sealed tubes with an internal diameter of 100 mm and a length of 1.50 m before testing. To minimise the effect of sample preparation, soil cores were first cut with a dicing saw equipped with a diamond wire. Water was used to cool the wire during cutting. The height of the specimens after dicing was 15 ± 3 mm. The diameter of each specimen was then adjusted to the desired diameter before testing.
3.2. Laboratory Tests
Gravimetric moisture content was directly determined from the core specimens in the days following the sampling campaign. The dry density and the void index were also assessed to evaluate the compaction state of the soil 11 years after construction. These compaction parameters were compared to the moisture contents and dry densities measured during construction (Table 3).
One objective of the study was to assess the influence of cementitious bonds on the behaviour of quicklime-treated samples. Leroueil and Vaughan (1990) suggested using the compression curve of untreated soil as a reference to quantitatively determine the effect of soil structure on its behaviour [49]. In this way, the behaviour of a treated soil can be analysed similarly to that of a structured soil. Thus, the yield stress could be used to quantify the bonding associated with the treatment. In this context, oedometer tests were carried out according to the standard NF EN ISO 17892-5, and the untreated soil was employed as a reference to quantify bonding [50]. After preparation and installation in the oedometer cell, all specimens were first saturated and then loaded up to a vertical stress of 7.0 MPa. The selected approach consists of comparing the compression curves of specimens coming from different horizontal distances, as shown in Figure 2. Several tests on the horizontal cores (from 0 to 4.50 m of horizontal distance) and one on the vertical core were carried out for each part of the embankment (at the same height as the horizontal tests). An oedometer test was also performed on a sample from the untreated part of the embankment (lower portion of the first section, as shown in Table 2). This test was used as a reference to quantify the effects of the treatment. To further analyse the results, the compression curves obtained were compared to the compression curves from treated samples prepared in the laboratory by Stoltz et al. (2014), who extensively analysed the effect of lime on the compressibility of the same soil [46].
Shrinkage tests were also carried out to assess the shrinkage behaviour of the samples from the backfill since lime is known to alter swelling and shrinkage characteristics of expansive soils [16,30,46,51]. On each section of the embankment, shrinkage tests were carried out in the inner part (0.30 m from the surface) and in the outer part of the embankment (6.50 m from the surface). These tests were prepared similarly to the oedometer samples. The shrinkage test was adapted from the French standard NF XP P94-060-2 by replacing conventional displacement sensors by laser sensors to remotely measure the shrinkages [52]. This modification significantly reduced the effect of the measuring device on recording the soil shrinkage. During the drying process, the mass of the soil and its volume variation were recorded. At mass stabilisation, the sample was placed in the oven to determine the water content of the soil. Thus, the shrinkage curve as well as the shrinkage limit of each sample could be assessed.
4. Distribution of Water Content and Dry Density
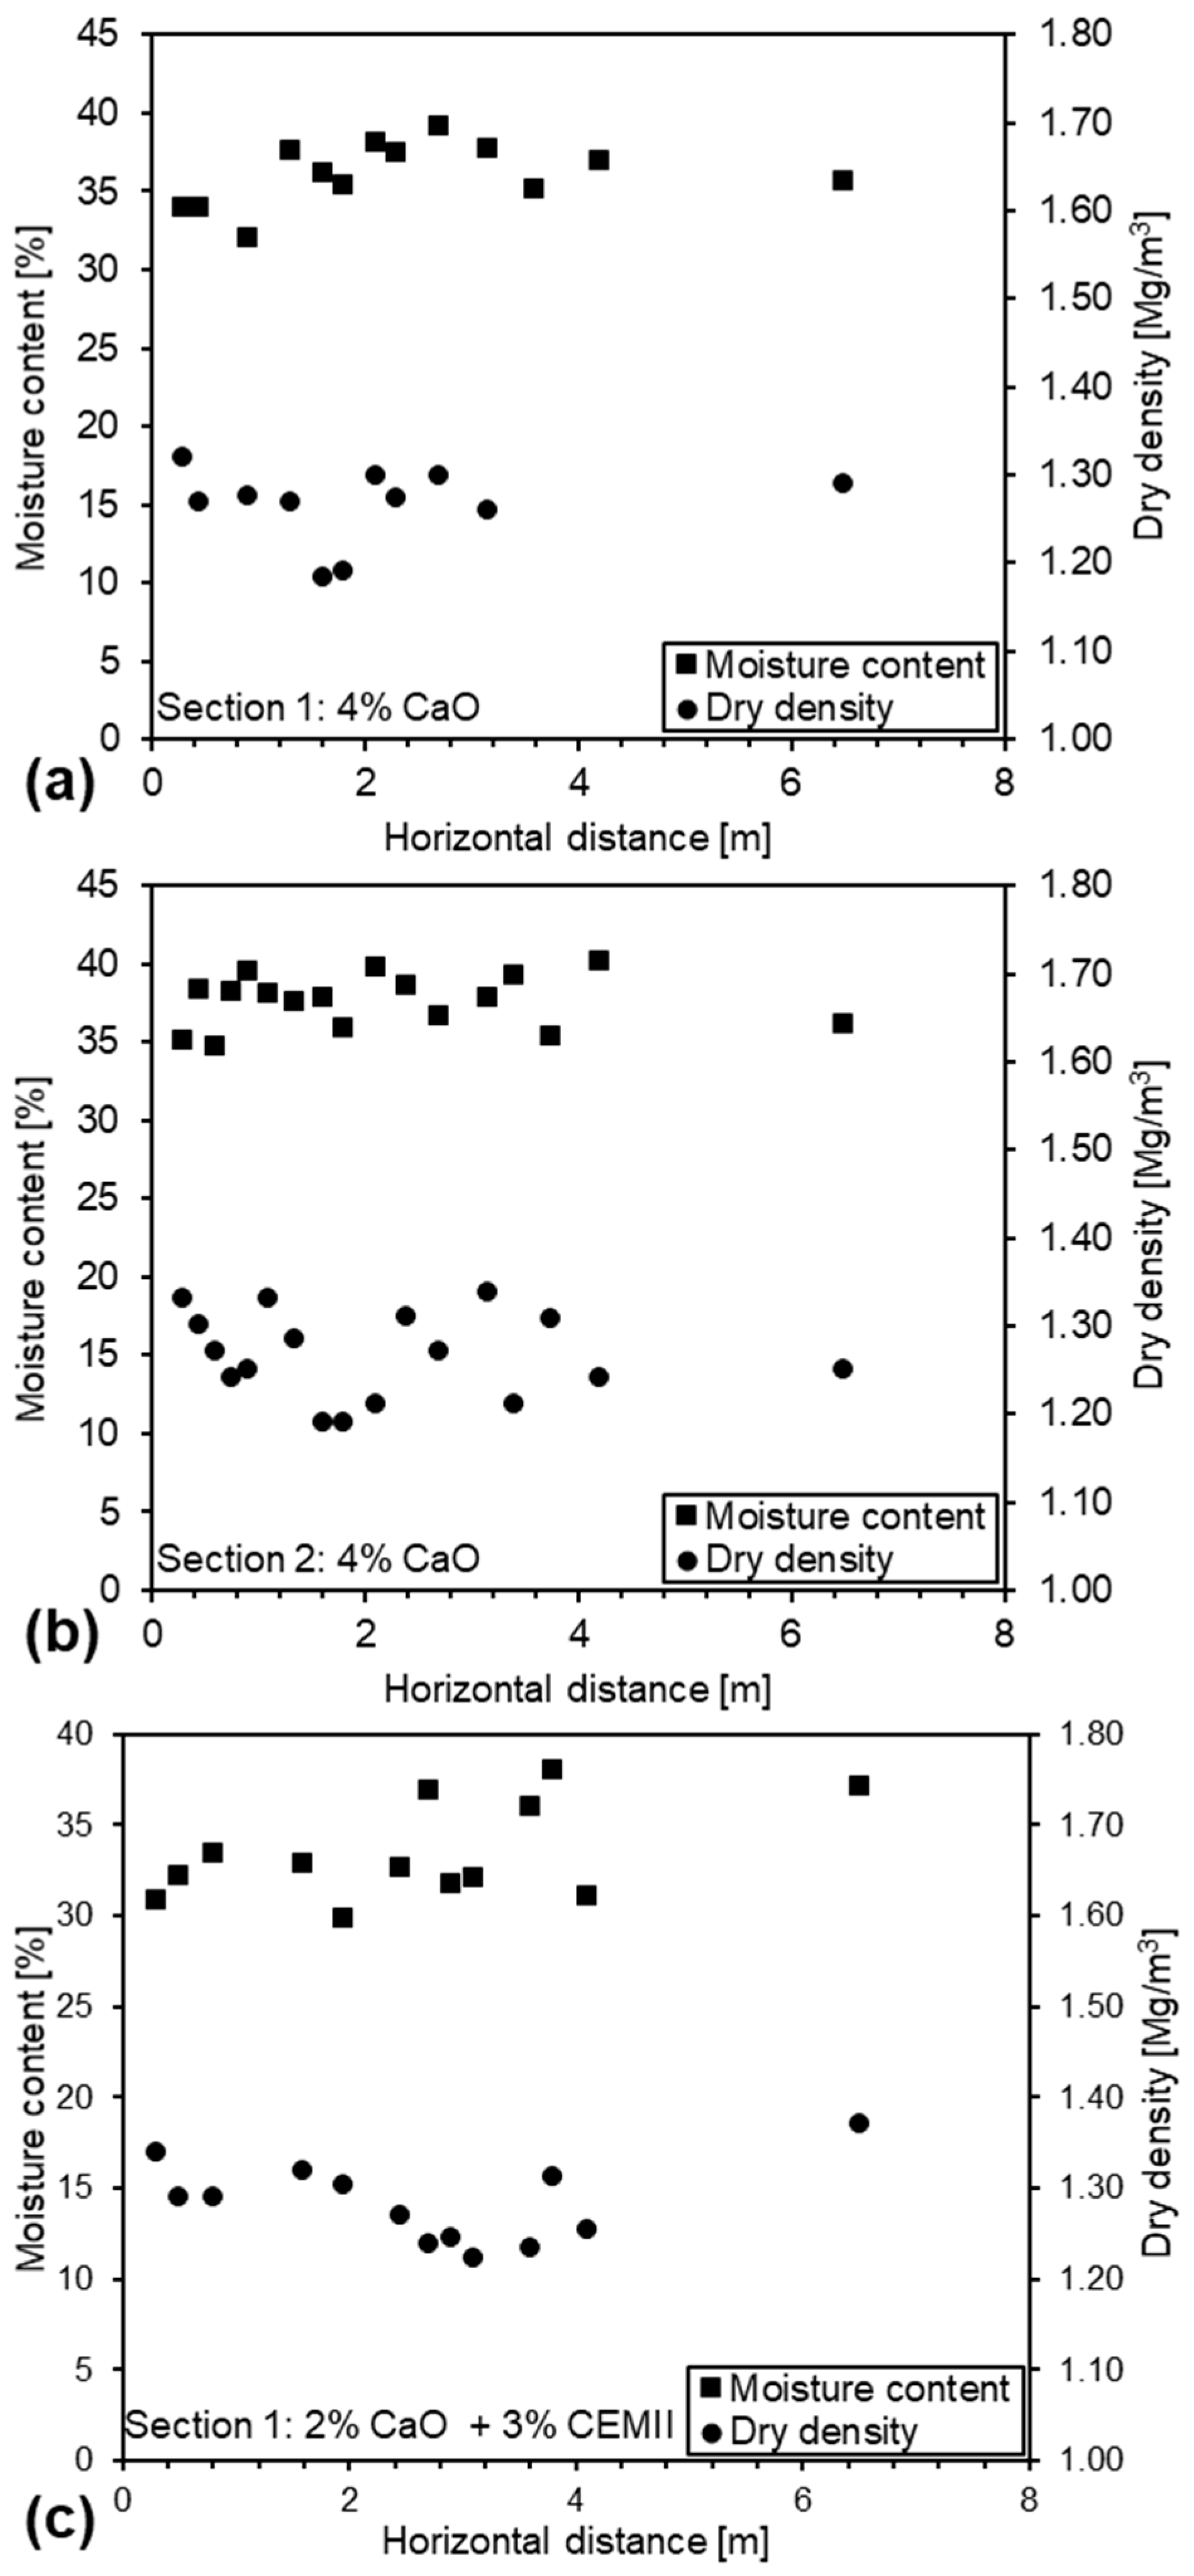
Identification tests were first carried out along the horizontal axis (Figure 2) to assess the state of the embankment at the time of sampling. Figure 3a–c correspond to the moisture content and dry density evolution along the horizontal cores for section 1 treated with 4% lime, section 2 treated with 4% lime and section 3 treated with 2% lime and 3% cement, respectively. For section 1, the mean moisture content was 36.1% (Figure 3). The average dry density was found to be 1.266 Mg/m3. In section 2, the average dry density was also 1.266 Mg/m3, while the average moisture content was 37.5%. The mean value of the moisture content in the section was 33.4%, while the average dry density was 1.284 Mg/m3. The densities and moisture contents found in section 3 were slightly different from those in the other sections, as the optimum moisture content depends on the treatment dosage. For all sections, the lowest water content values were found close to the edge of the backfill.
The 2021 measurements of moisture content and dry density determined in the embankment were compared to the state of the backfill at the time of its construction (Table 3). For sections 1 and 2 of the backfill, the mean values of gravimetric moisture content were slightly higher in 2021 compared to the initial state of the backfill, with the difference being less than 2%. Both sections returned similar moisture contents. The same observation could be made for section 3 treated with lime and cement. Even though the cores were retrieved in November, moisture contents from all sections were slightly lower at the edge of the embankment. This could result from interactions with the atmospheric conditions over the lifetime of the embankment. Thus, it can be concluded that the inner part of the backfill exhibited a moisture content of the same order of magnitude as what was observed at the time of construction.
5. Compression Behaviour
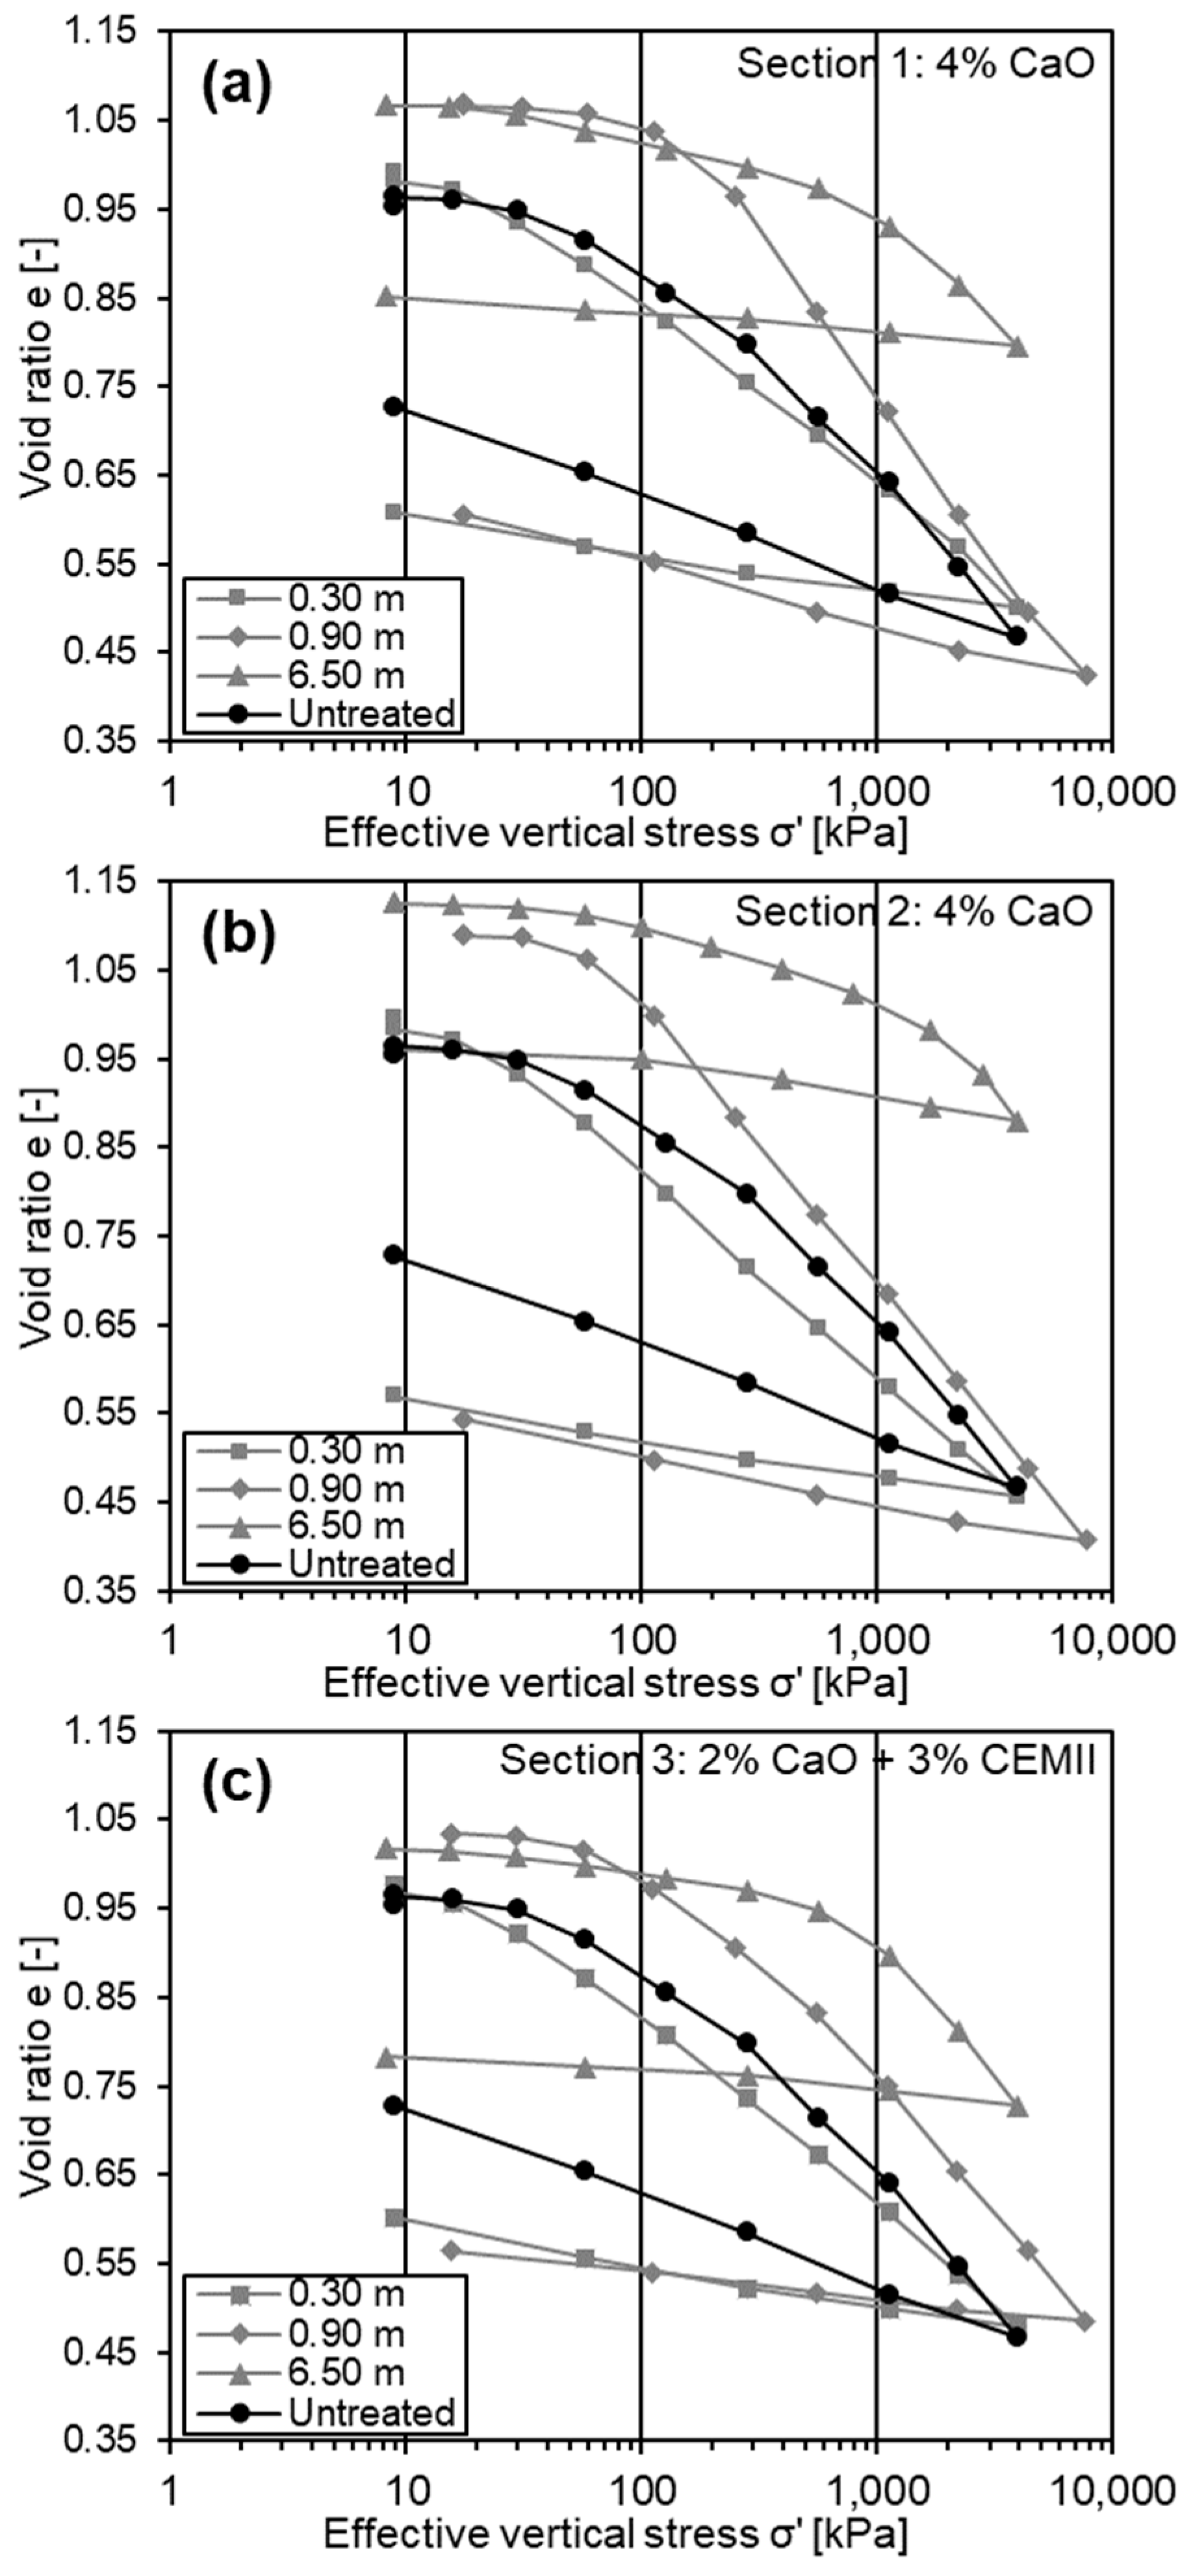
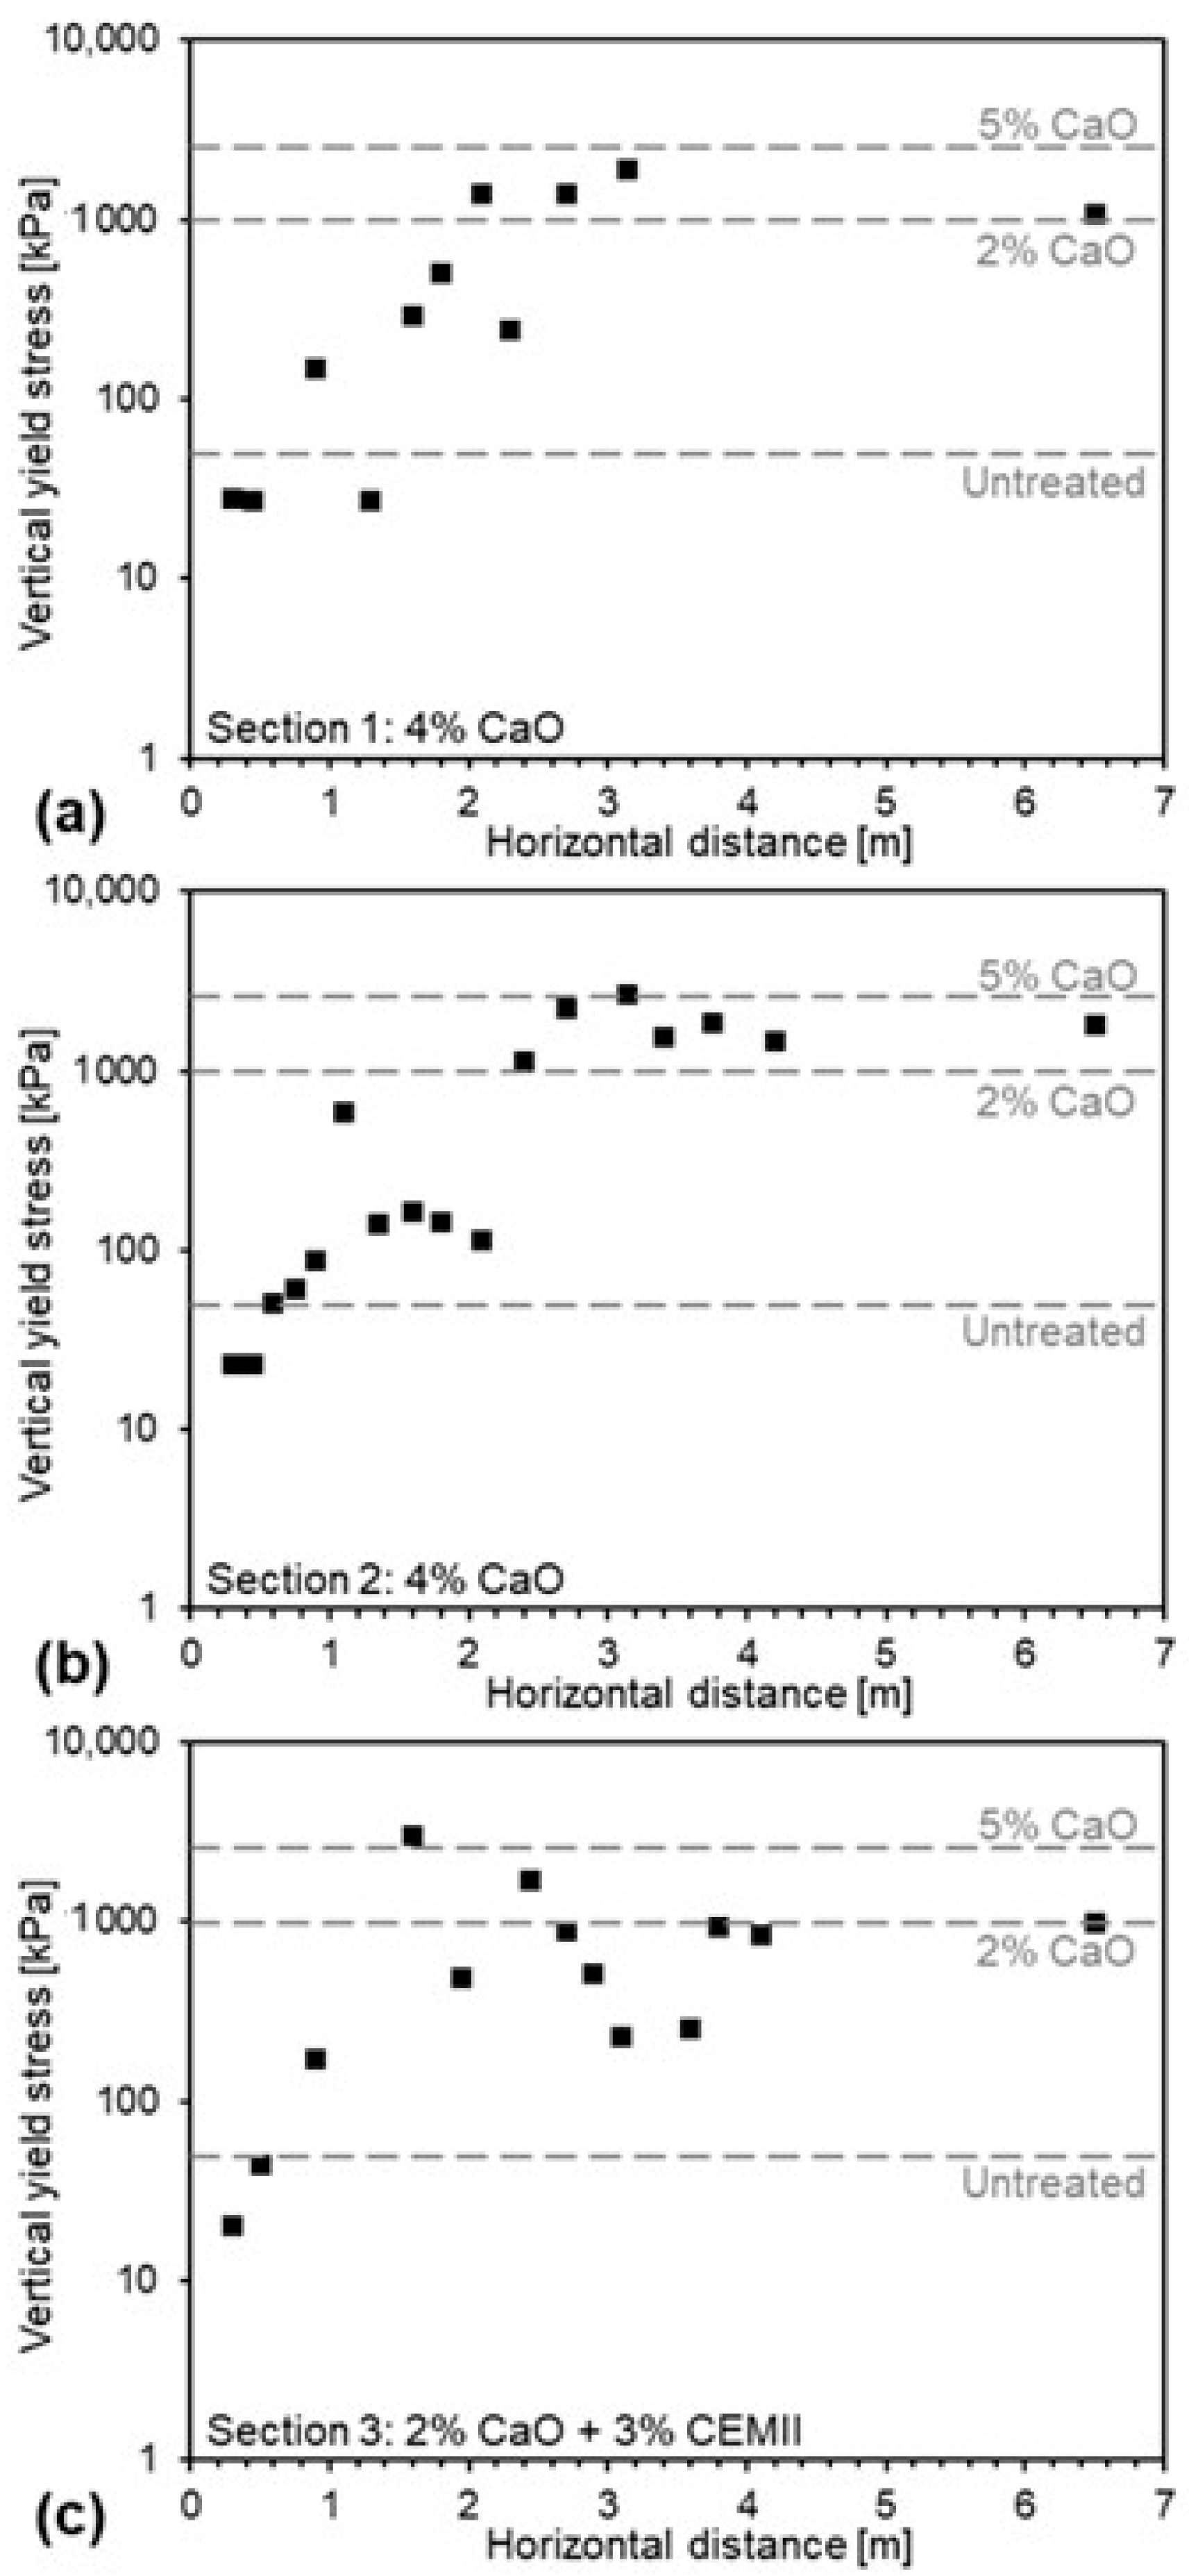
Up to 17 oedometer tests were performed for each section. Examples of the compressibility results from specimens of each section are plotted in Figure 4. The yield stresses determined in each oedometer test are shown versus the horizontal distance from the edge in section 1 (Figure 5a), section 2 (Figure 5b) and section 3 (Figure 5c). The results of these tests were compared to the curve obtained from the specimen taken from the untreated part of the backfill.
The results in Figure 4 show that there was a significant difference between the behaviour of the samples from the edge of the backfill and the one retrieved from the inner part of the backfill. For instance, the compressibility curve of the sample from the edge in section 1 was very similar to that obtained from the untreated sample (Figure 4a). The yield stresses determined from both curves were of the same order of magnitude, approximately 20 kPa. The swelling indexes CS of the two specimens were also very similar. Similar conclusions could be drawn from the results obtained in sections 2 and 3. The yield stresses from the samples taken at 6.50 m were significantly larger than 1 MPa in each of the three sections. The compressibility indexes were also significantly lower than those of the untreated soils. The compressibility of the samples taken at 0.90 m from the surface was intermediate between what was observed at the edge for all three sections.
Figure 5 highlights the evolution of the compressibility of the samples from the outer part of the backfill towards its central part. The yield stresses increased progressively from approximately a few tens of kPa at the edge up to values larger than 1200 kPa more than 2.50 m from the surface. Between 2.50 and 6.50 m from the surface, the yield stresses remained almost constant. Similar conclusions could be drawn from the results obtained from the two other sections. The variability of the yield stress values was slightly larger in the case of the section treated with lime plus cement. The results show that the compressibility of the treated soil on the very edge of the sections was equivalent to the compressibility of the untreated soil. Towards the inner part, the yield progressively increased until it reached a stable value between 2.50 and 3 m.
6. Shrinkage of the Specimens
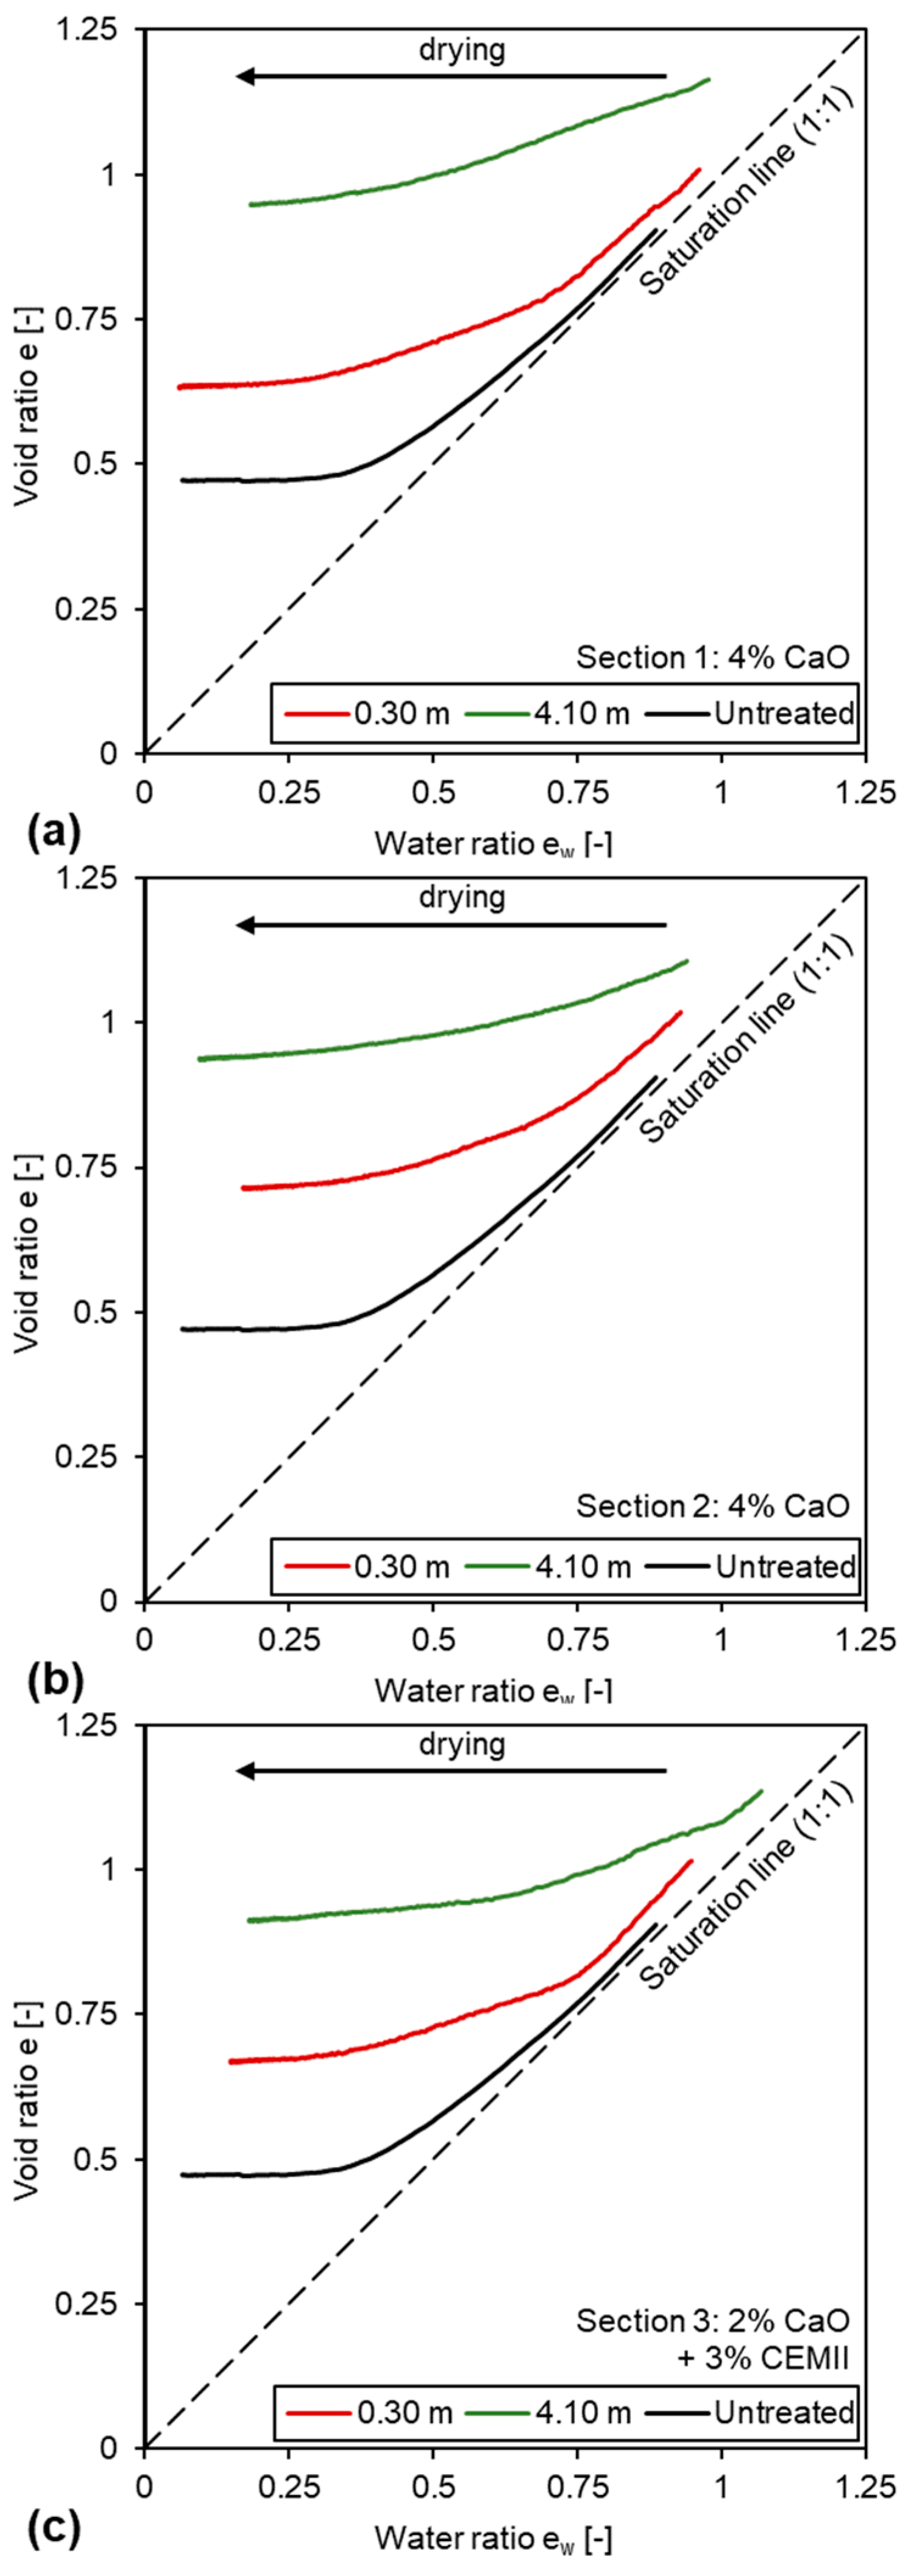
The shrinkage curves of all samples are displayed in Figure 6 in the plot of void ratio e against water ratio ew (water volume over solid volume). For each section, three results are presented: one obtained on a reference specimen from the untreated part of the embankment, one specimen from the edge of the embankment (0.30 m of horizontal distance) and one specimen from the inner part of the embankment (4.10 m of horizontal distance). The shrinkage potential values PSH and the shrinkage limits ew,SL were evaluated for each test and are presented in Table 1.
The shrinkage curve of the untreated material started at a low void index of 0.87, in accordance with the targeted void index given in Table 3. Along the drying path, the shrinkage limit ew,SL was reached at 0.35, corresponding to the end of the volume variation. Final volumetric shrinkage was assessed when the moisture content of the soil stabilised at a value of 22.8%.
The shrinkage curve of the clayey soil taken from section 1 is displayed in Figure 6a, where it can be seen that the shrinkage behaviour of the samples differed significantly as a function of the sampling position. When the samples were taken near the surface, the shrinkage potential was significantly higher than that determined for samples taken 4.10 m from the edge. For instance, in section 1, the shrinkage potential decreased from 19.2% at the edge down to approximately 10.0%. Moreover, the shrinkage curves of the samples taken at 4.10 m exhibited a slope significantly smaller than that of the samples taken at 0.30 m, the latter being comparable to that of the untreated soil. For the three sections, the shrinkage limits of the samples taken at 0.30 m from the surface were very similar to the limit of the untreated soil. It was more difficult to determine the shrinkage limit of the samples taken at 4.10 m since there was no clear indication of shrinkage stabilisation, even if the rate of shrinkage decreased upon drying. Similar tendencies were observed by Stoltz et al. (2014) working on the same expansive soil after 90 days of curing [46].
7. Discussion
The performance of the stabilised soil 11 years after its construction was assessed through tests performed on the samples retrieved from the embankment.
For all sections, the three series of oedometer tests showed a progressive increase in yield stresses from the surface until approximately 2.50 m towards the inner part of the backfill. Beyond 2.50 m, the performance of the soil remained stable, with yield stress values higher than 1000 kPa. On the edge, the behaviour of the specimens was very close to the behaviour of the untreated soil. This shows that the treatment no longer significantly impacts the yield stress of the soil and its compressibility. The repeatability between sections 1 and 2, both treated with 4% quicklime, was noticeable: the performances of the treated soil were similar in both cases. The yield stress of the same treated clayey soil after 360 days of curing at a constant moisture content was determined in the laboratory by Stoltz et al. (2014) [46]. It was equal to 3500 kPa with 5% quicklime and 1200 kPa with 2% quicklime. These results demonstrate that both the yield stresses of specimens from the inner part and those from treated specimens prepared and cured in the laboratory had the same order of magnitude. This could indicate that the inner part of the backfill was preserved from significant alteration since the time of construction, since the difference was limited to the first 2.50 m from the edge. The degradation observed on the outer part of the backfill cannot arguably originate from the initial compaction of the soil. The embankment was constructed with an excess width of 1.00 m, which was removed at the end of construction. This method is commonly chosen to limit compaction heterogeneities on the edge of earth structures. Furthermore, the low dispersion of dry density values presented for all sections in Figure 3 indicates that the compaction homogeneity was still preserved 11 years after construction.
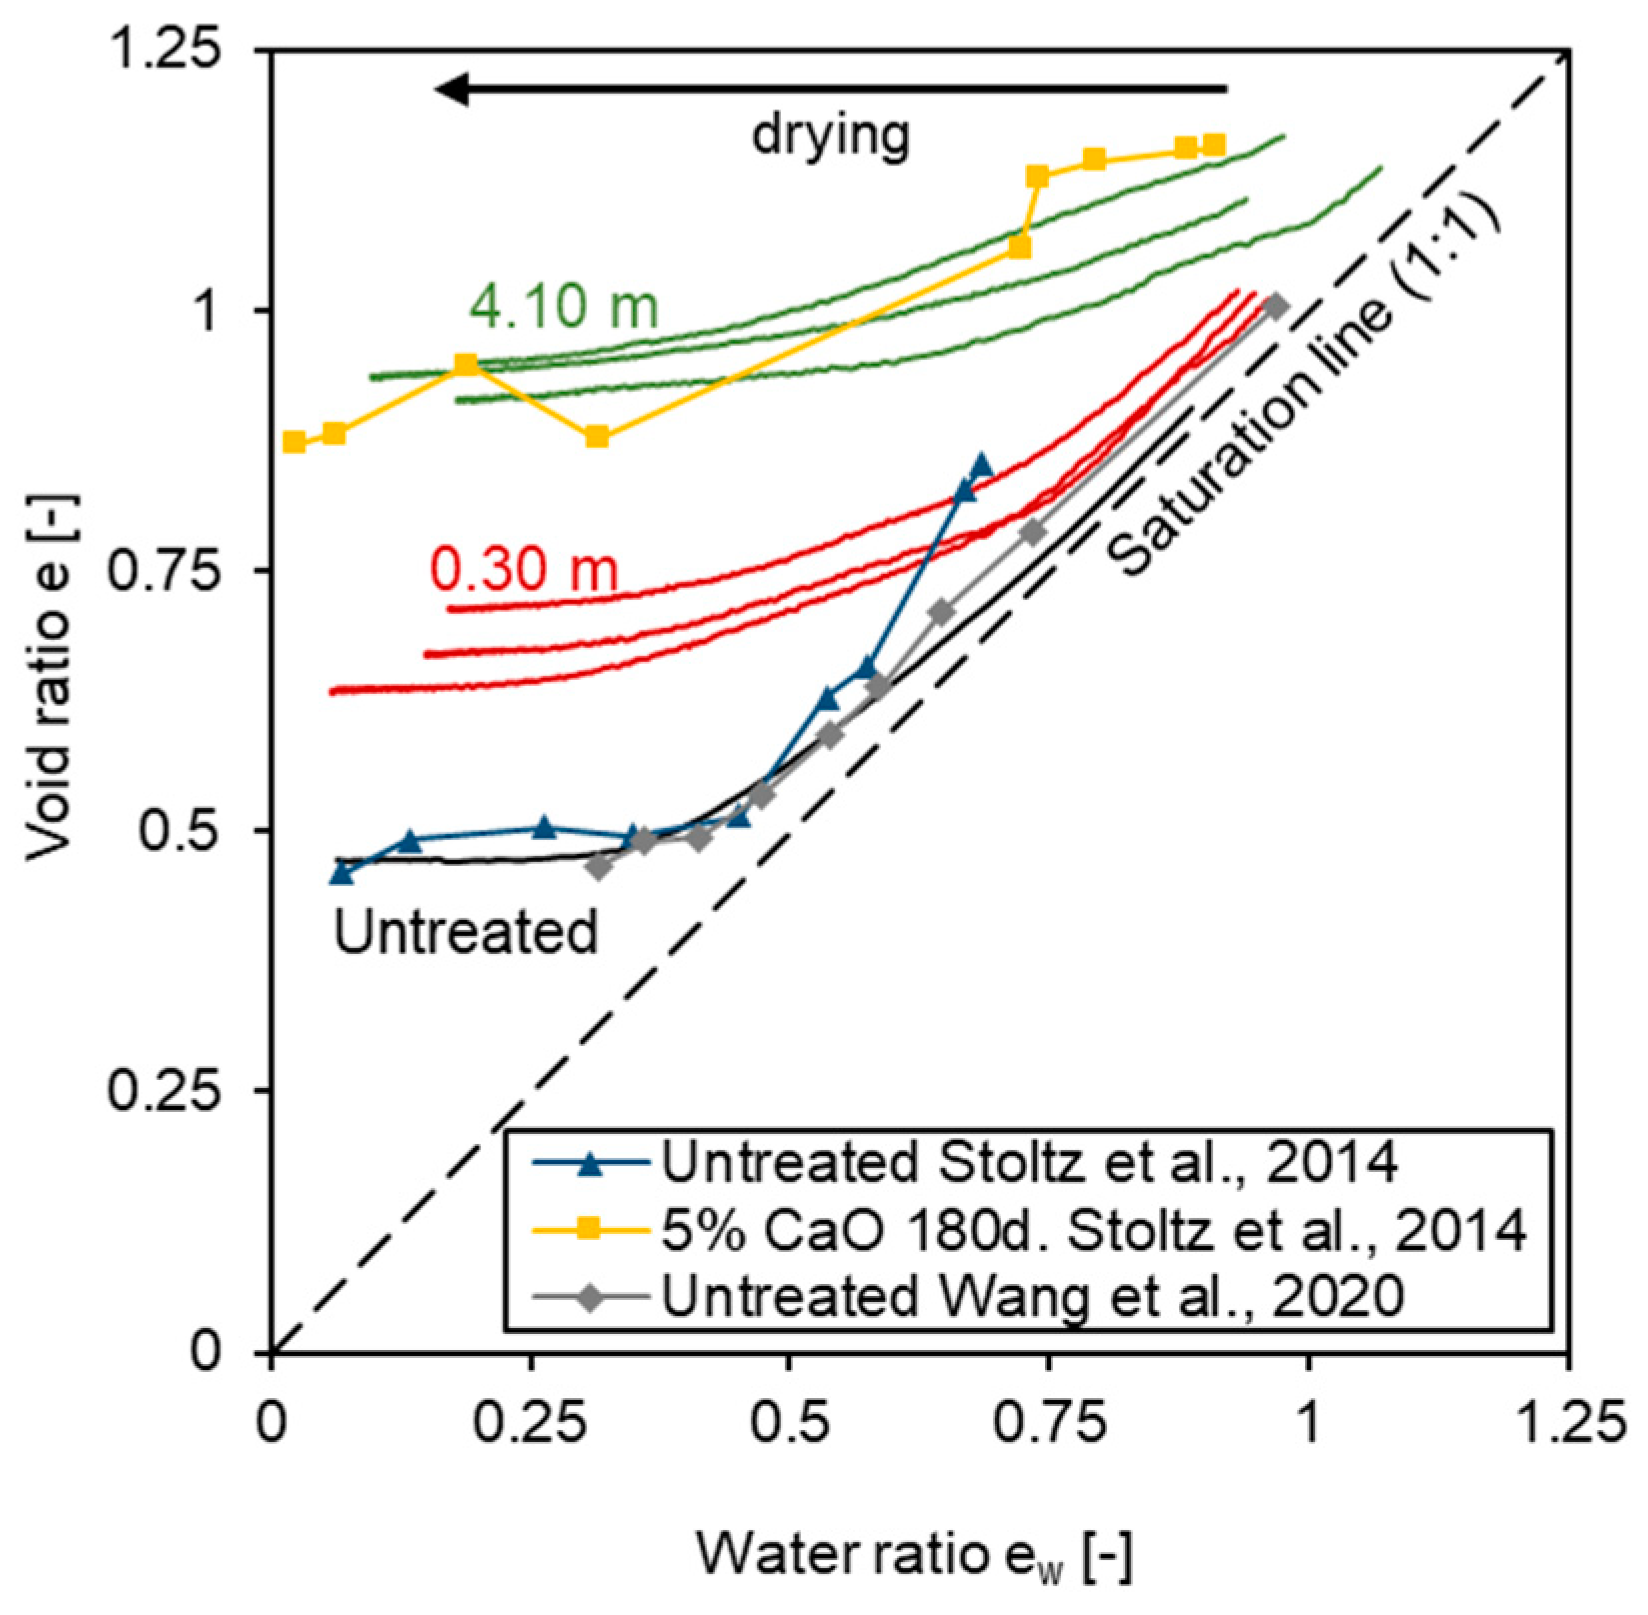
Lime is known to significantly limit the shrinkage potential of expansive soils [31,51]. The results of shrinkage tests are presented in Table 4. For all sections, the total shrinkage of the samples from the inner part of the embankment was lower than those of the samples from the edge (approximately 20% at 0.30 m and approximately 10% at 4.10 m). The volumetric final shrinkage from 0.30 m was 22.8%. It was also close to the behaviour of the untreated sample. The shrinkage behaviour of the samples retrieved from the backfill can be compared to the shrinkage behaviour of this soil as determined in previous laboratory studies (Figure 7). The shrinkage of the untreated soil was determined by Wange et al. (2020) [7] and Stoltz et al. (2014) [46]. The shrinkage curve of the soil sampled in situ was very similar to the shrinkage curve determined in the laboratory. This highlights the quality of the samples retrieved from the site and the limited impact of the sampling protocol. The shrinkage behaviour of the samples taken in the central part of the backfill was similar to the behaviour of a treated sample cured at a constant moisture content [46]. The behaviour of the samples coming from the edge of the backfill was thus intermediate between the untreated soil and the cured treated soil. These results indicate that some alteration in the effect of lime stabilisation occurred on the edge of the backfill, while the inner part appeared to be protected from deleterious climatic actions.
The degradation observed on the outer part of the backfill cannot arguably originate from the initial compaction of the soil. The embankment was constructed with an excess width of 1.00 m, which was removed at the end of construction. This method is commonly chosen to limit compaction heterogeneities on the edge of earth structures. Furthermore, the low dispersion of dry density values presented for all sections in Figure 3 indicates that the compaction homogeneity was still preserved 11 years after construction.
The alteration process can nonetheless be partly explained by moisture content variations that are known to alter the behaviour of stabilised soils [9,26,27,28]. The moisture contents presented in Figure 3 can be compared to those measured at construction time (Table 3). Moisture content values from all sections increased slightly since construction time: from 33.0% to 36.1% for section 1, from 35.0% to 37.5% for section 2 and from 32.8% to 33.4% for section 3. However, the edge of the backfill was slightly drier than the inner part of the backfill. These results indicate that the moisture content of the inner part of the backfill has not changed significantly since the time of construction. These results are in line with the data collected by the in situ sensors [40,48]. The moisture sensors installed at a horizontal distance of 4.50 m from the edge did not detect significant variations in volumetric water content.
Freezing/thawing cycles over the years could not explain the performance degradation [8,9,10,11,12,13], as in situ thermal sensors installed at 0.25 m from the surface did not indicate any temperature below 0 °C [40,48]. Other hydrochemical processes, such as carbonation or water leaching, could also have led to the degradation observed here; thus, complementary analyses are required to confirm their potential contributions.
8. Conclusions
The main objective of this study was to assess the in situ ageing and treatment performance of expansive clayey soil treated with lime and lime/cement. An existing trial embankment constructed in 2010 was sampled in 2021 between the edge and the core of the backfill. The hydro-mechanical performance was compared to the initial characteristics of the samples determined at the time of construction or available in existing studies. The following conclusions could be drawn from this study:
- The compressibility and shrinkage behaviour of the soil sampled beyond a horizontal distance of 2.50 m were equivalent to the performance of the same soil treated and cured in the laboratory at a constant moisture content for 6 months. Thus, it can be concluded that the central part of the backfill was not significantly altered since the time of construction of the backfill.
- The compressibility decreased progressively from 2.50 m towards the edge of the embankment. At the edge of the backfill, the behaviour of the specimen was comparable to the behaviour of the untreated soil. Moreover, the shrinkage behaviour at the edge was very close to the shrinkage behaviour of the untreated material. Those observations evidenced an alteration in the behaviour of the stabilised soil since the time of construction. The extent of the degradation depends on the distance to the surface.
- The altered area (from 0 to up to 2.50 m of horizontal distance) was identified on both sections treated with 4% lime. This weathered area was also found on section 3 of the embankment treated with 2% lime and 3% cement. These results suggest that both treatments led to a similar alteration process and were not able to prevent the deterioration of the treatment effects.
- The outer part of the embankment was correctly and homogeneously compacted because of the construction process, with an excess width removed at the end of construction. In addition, in situ monitoring since the time of construction shows that moisture content variations are limited to the first meter of the backfill. Thus, wetting and drying cycles at the edge of the embankment could not explain the degradation measured until 2.50 m. No freezing was detected, as the sensors positioned at 0.25 m of horizontal distance only measured positive temperatures over 10 years. Leaching and carbonation processes could explain the origin of the observed alterations.
These observations question the durability of the effects of lime and cement stabilisation at the edge of the embankment. From the current state of the art and knowledge obtained during this study, the use of lime and/or treatment applied on an expansive soil such as the clay studied in this paper should be limited to structures unexposed to environmental conditions. Complementary investigations are under progress to determine the processes involved in the alteration in the performance (mercury intrusion porosimetry, thermogravimetric analysis, XRD, etc.).
Author Contributions
Conceptualisation, N.C., O.C. and F.M.; methodology, O.C. and F.M.; validation, O.C.; investigation, N.C.; writing—original draft preparation, N.C.; writing—review and editing, O.C. and F.M.; supervision, F.M. All authors have read and agreed to the published version of the manuscript.
Funding
The project has received funding from the European Union’s Horizon 2020 research and innovation program under the Marie Skłodowska-Curie grant agreement No 778120.
Data Availability Statement
Data generated or analysed during this study are provided in full within the published article.
Acknowledgments
The study presented in this paper is a part of the first author’s PhD thesis that has been funded by Ginger CEBTP. The authors gratefully thank Michel Khatib and Jean-Marie Côme from Ginger CEBTP for their valuable support and fruitful discussions.
Conflicts of Interest
The authors declare no conflict of interest.
References
- Brandl, H. Alteration of soil parameters by stabilization with lime. In Proceedings of the 10th International Conference on Soil Mechanics and Foundation Engineering, Stockholm, Sweden, 15–19 June 1981. [Google Scholar]
- Sivapullaiah, P.V.; Sridharan, A.; Ramesh, H.N. Strength behaviour of lime-treated soils in the presence of sulphate. Can. Geotech. J. 2000, 37, 1358–1367. [Google Scholar] [CrossRef]
- Guidobaldi, G.; Cambi, C.; Cecconi, M.; Comodi, P.; Deneele, D.; Paris, M.; Russo, G.; Vitale, E.; Zucchini, A. Chemo-mineralogical evolution and microstructural modifications of a lime treated pyroclastic soil. Eng. Geol. 2018, 245, 333–343. [Google Scholar] [CrossRef]
- Consoli, N.C.; Bittar Marin, E.J.; Quiñónez Samaniego, R.A.; Scheuermann Filho, H.C.; Cristelo, N.M.C. Field and laboratory behaviour of fine-grained soil stabilized with lime. Can. Geotech. J. 2020, 57, 933–938. [Google Scholar] [CrossRef]
- Nalbantoglu, Z.; Tuncer, E.R. Compressibility and hydraulic conductivity of a chemically treated expansive clay. Can. Geotech. J. 2011, 38, 154–160. [Google Scholar] [CrossRef]
- Vitale, E.; Deneele, D.; Russo, G. Microstructural Investigations on Plasticity of Lime-Treated Soils. Minerals 2020, 10, 386. [Google Scholar] [CrossRef]
- Wang, Y.; Cui, Y.-J.; Tang, A.M.; Benahmed, N.; Duc, M.; Sun, W.J. Shrinkage behaviour of a compacted lime-treated clay. Géotech. Lett. 2020, 10, 174–178. [Google Scholar] [CrossRef]
- Dempsey, B.J.; Thompson, M.R. Durability Properties of Lime-Soil Mixtures; Highway Research Record No. 235; HRB, National Research Council: Washington, DC, USA, 1967. [Google Scholar]
- Consoli, N.C.; Prietto, P.D.M.; da Silva Lopes, L.; Winter, D. Control factors for the long term compressive strength of lime treated sandy clay soil. Transp. Geotech. 2014, 1, 129–136. [Google Scholar] [CrossRef]
- Consoli, N.C.; da Silva, K.; Filho, S.; Rivoire, A.B. Compacted clay-industrial wastes blends: Long term performance under extreme freeze-thaw and wet-dry conditions. Appl. Clay Sci. 2017, 146, 404–410. [Google Scholar] [CrossRef]
- Lu, Y.; Liu, S.; Zhang, Y.; Li, Z.; Xu, L. Freeze-thaw performance of a cement-treated expansive soil. Cold Reg. Sci. Technol. 2020, 170, 102926. [Google Scholar] [CrossRef]
- Tiwari, N.; Satyam, N.; Puppala, A.J. Strength and durability assessment of expansive soil stabilized with recycled ash and natural fibers. Transp. Geotech. 2021, 29, 100556. [Google Scholar] [CrossRef]
- Poncelet, N.; François, B. Effect of laboratory compaction mode, density and suction on the tensile strength of a lime-treated silty soil. Transp. Geotech. 2022, 34, 100763. [Google Scholar] [CrossRef]
- McCallister, L.D.; Petry, T.M. Physical property changes in a lime-treated expansive clay caused by leaching. Transp. Res. Rec. 1991, 1295, 37–44. [Google Scholar]
- De Bel, R.; Bollens, Q.; Duvigneaud, P.-H.; Verbrugge, J.-C. Influence of curing time, percolation and temperature on the compressive strength of a loam treated with lime. In Proceedings of the 2nd International Symposium on Treatment and Recycling of Materials for Transport Infrastructure (TREMTI), Paris, France, 24–26 October 2005; pp. 1–10. [Google Scholar]
- Khattab, S.A.; Al-Mukhtar, M.; Fleureau, J.-M. Long-Term Stability Characteristics of a Lime-Treated Plastic Soil. J. Mater. Civ. Eng. 2007, 19, 358–366. [Google Scholar] [CrossRef]
- Le Runigo, B.; Cuisinier, O.; Cui, Y.-J.; Ferber, V.; Deneele, D. Impact of initial state on the fabric and permeability of a lime-treated silt under long-term leaching. Can. Geotech. J. 2009, 46, 1243–1257. [Google Scholar] [CrossRef]
- Le Runigo, B.; Ferber, V.; Cui, Y.J.; Cuisinier, O.; Deneele, D. Performance of lime-treated silty soil under long-term hydraulic conditions. Eng. Geol. 2011, 118, 20–28. [Google Scholar] [CrossRef]
- Deneele, D.; Le Runigo, B.; Cui, Y.-J.; Cuisinier, O.; Ferber, V. Experimental assessment regarding leaching of lime-treated silt. Constr. Build. Mater. 2016, 112, 1032–1040. [Google Scholar] [CrossRef]
- Nakarai, K.; Yoshida, T. Effect of carbonation on strength development of cement-treated Toyoura silica sand. Soils Found. 2015, 55, 857–865. [Google Scholar] [CrossRef]
- Yi, Y.; Lu, K.; Liu, S.; Al-Tabbaa, A. Property changes of reactive magnesia–stabilized soil subjected to forced carbonation. Can. Geotech. J. 2016, 53, 314–325. [Google Scholar] [CrossRef]
- Ho, L.S.; Nakarai, K.; Duc, M.; Kouby, A.L.; Maachi, A.; Sasaki, T. Analysis of strength development in cement-treated soils under different curing conditions through microstructural and chemical investigations. Constr. Build. Mater. 2018, 166, 634–646. [Google Scholar] [CrossRef]
- Xu, L.; Zha, F.; Liu, C.; Kang, B.; Liu, J.; Yu, C. Experimental Investigation on Carbonation Behavior in Lime-Stabilized Expansive Soil. Adv. Civ. Eng. 2020, 2020, e7865469. [Google Scholar] [CrossRef]
- Deneele, D.; Dony, A.; Colin, J.; Herrier, G.; Lesueur, D. The carbonation of a lime-treated soil: Experimental approach. Mater. Struct. 2021, 54, 21. [Google Scholar] [CrossRef]
- Das, G.; Razakamanantsoa, A.; Saussaye, L.; Losma, F.; Deneele, D. Carbonation investigation on atmospherically exposed lime-treated silty soil. Case Stud. Constr. Mater. 2022, 17, e01222. [Google Scholar] [CrossRef]
- Guney, Y.; Sari, D.; Cetin, M.; Tuncan, M. Impact of cyclic wetting–drying on swelling behavior of lime-stabilized soil. Build. Environ. 2007, 42, 681–688. [Google Scholar] [CrossRef]
- Khoury, N.; Zaman, M.M. Durability of stabilized base courses subjected to wet–dry cycles. Int. J. Pavement Eng. 2007, 8, 265–276. [Google Scholar] [CrossRef]
- Liu, S.; Wen, K.; Armwood, C.; Bu, C.; Li, C.; Amini, F.; Li, L. Enhancement of MICP-Treated Sandy Soils against Environmental Deterioration. J. Mater. Civ. Eng. 2019, 31, 04019294. [Google Scholar] [CrossRef]
- Nabil, M.; Mustapha, A.; Rios, S. Impact of wetting—Drying cycles on the mechanical properties of lime-stabilized soils. Int. J. Pavement Res. Technol. 2020, 13, 83–92. [Google Scholar] [CrossRef]
- Rosone, M.; Ferrari, A.; Celauro, C. On the hydro-mechanical behaviour of a lime-treated embankment during wetting and drying cycles. Geomech. Energy Environ. 2018, 14, 48–60. [Google Scholar] [CrossRef]
- Stoltz, G.; Cuisinier, O.; Masrouri, F. Multi-scale analysis of the swelling and shrinkage of a lime-treated expansive clayey soil. Appl. Clay Sci. 2012, 61, 44–51. [Google Scholar] [CrossRef]
- Mehenni, A.; Cuisinier, O.; Masrouri, F. Alteration of the Hydromechanical Performances of a Stabilized Compacted Soil Exposed to Successive Wetting–Drying Cycles. J. Mater. Civ. Eng. 2020, 32, 04020349. [Google Scholar] [CrossRef]
- Wassermann, A.; Abdallah, A.; Cuisinier, O. Impact of wetting and drying cycles on the mechanical behaviour of a cement-treated soil. Transp. Geotech. 2022, 36, 100804. [Google Scholar] [CrossRef]
- Cuisinier, O.; Deneele, D. Effets de sollicitations hydriques cycliques sur le gonflement d’un sol argileux traité à la chaux. Rev. Fr. Géotech. 2010, 130, 51–60. [Google Scholar] [CrossRef]
- Das, G.; Razakamanantsoa, A.; Herrier, G.; Saussaye, L.; Lesueur, D.; Deneele, D. Evaluation of the long-term effect of lime treatment on a silty soil embankment after seven years of atmospheric exposure: Mechanical, physicochemical, and microstructural studies. Eng. Geol. 2021, 281, 105986. [Google Scholar] [CrossRef]
- Herrier, G.; Berger, R.; Bonelli, S. The Friant-Kern canal: A forgotten example of lime-treated structure in hydraulic conditions. In Proceedings of the 6th International Conference on Scour and Erosion, Paris, France, 27–31 August 2012; p. 9. [Google Scholar]
- Akula, P.; Hariharan, N.; Little, D.N.; Lesueur, D.; Herrier, G. Evaluating the Long-Term Durability of Lime Treatment in Hydraulic Structures: Case Study on the Friant-Kern Canal. Transp. Res. Rec. 2020, 2674, 431–443. [Google Scholar] [CrossRef]
- Cuisinier, O.; Gandille, D.; Robinet, A.; Stoltz, G.; Mehenni, A.; Robin, V. Long term behaviour of treated soils—Case study of a lime and cement stabilized backfill. In Proceedings of the 3rd International Seminar on Earthworks, Berlin, Germany, 19–20 March 2012; pp. 189–200. [Google Scholar]
- Froumentin. TerDOUEST National Project ANR-07-PCGU-006-10; Cete Normandie Centre France: Le Grand Quevilly, France, 2012. [Google Scholar]
- Bicalho, K.V.; Vivacqua, G.P.D.; Mercadier, D.; Tang, A.M. Experimental Investigation of Soil-Atmosphere Interaction in an Instrumented Embankment Constructed with Two Treated Clays. Soils Rocks 2015, 38, 149–162. [Google Scholar] [CrossRef]
- An, N.; Hemmati, S.; Cui, Y.; Tang, A. The determination of model dimension for an embankment to study soil atmosphere interaction with Finite Element Method. E3S Web Conf. 2016, 9, 08017. [Google Scholar] [CrossRef]
- Boussafir, Y.; Mercadier, D.; Cui, Y.-J. Suivi du vieillissement d’un remblai traité à Héricourt (70): Quels enseignements sur la durabilité? In Proceedings of the National Conference on Geotechnical and Geological Engineering (JNGG 2016), Nancy, France, 6–8 July 2016; p. 11. [Google Scholar]
- An, N.; Hemmati, S.; Cui, Y. Numerical analysis of soil volumetric water content and temperature variations in an embankment due to soil-atmosphere interaction. Comput. Geotech. 2017, 83, 40–51. [Google Scholar] [CrossRef]
- Boussafir, Y.; Bicalho, K.; Cui, Y.-J.; Mercadier, D. Vers une meilleure compréhension des interactions sol-atmosphère d’un remblai grâce au monitoring. In Proceedings of the 9th National Conference on Geotechnical and Geological Engineering (JNGG 2018), Champs-sur-Marne, France, 13–15 June 2018; p. 11. [Google Scholar]
- Bicalho, K.V.; Boussafir, Y.; Cui, Y.-J. Performance of an instrumented embankment constructed with lime-treated silty clay during four-years in the Northeast of France. Transp. Geotech. 2018, 17, 100–116. [Google Scholar] [CrossRef]
- Stoltz, G.; Cuisinier, O.; Masrouri, F. Weathering of a lime-treated clayey soil by drying and wetting cycles. Eng. Geol. 2014, 181, 281–289. [Google Scholar] [CrossRef]
- LCPC. Soil Treatment with Lime and/or Hydraulic Binders: Application to the Construction of Fills and Capping Layers; LCPC: Paris, France, 2000. [Google Scholar]
- Boussafir, Y.; Mercadier, D.; Bicalho, K.; Cui, Y.-J. Suivi à 10 ans du remblai expérimental en matériaux traités de Héricourt (France): Résultat du monitoring. In Proceedings of the National Conference on Geotechnical and Geological Engineering (JNGG 2022), Lyon, France, 28–30 June 2022; p. 9. [Google Scholar]
- Leroueil, S.; Vaughan, P.R. The general and congruent effects of structure in natural soils and weak rocks. Géotechnique 1990, 40, 467–488. [Google Scholar] [CrossRef]
- AFNOR NF EN ISO 17892-5; Reconnaissance et Essais Géotechniques—Essais de Laboratoire sur les Sols—Partie 5: Essai de Chargement par Palier à L’œdomètre. AFNOR: Saint-Denis, France, 2019.
- Dash, S.K.; Hussain, M. Lime Stabilization of Soils: Reappraisal. J. Mater. Civ. Eng. 2012, 24, 707–714. [Google Scholar] [CrossRef]
- AFNOR NF XP P94-060-2; Sols: Reconnaissance et Essais—Partie 2: Détermination Effective de la Limite de Retrait sur un Prélèvement Non Remanié. AFNOR: Saint-Denis, France, 1997.
Figure 1.
Structure of the studied embankment.

Figure 2.
Core-drilled zone in the upper and lower part of the embankment.

Figure 3.
Moisture content and dry density evolution along the horizontal cores for section 1 treated with 4% lime (a), section 2 treated with 4% lime (b) and section 3 treated with 2% lime and 3% cement (c), and compared to those measured at construction time.
Figure 3.
Moisture content and dry density evolution along the horizontal cores for section 1 treated with 4% lime (a), section 2 treated with 4% lime (b) and section 3 treated with 2% lime and 3% cement (c), and compared to those measured at construction time.

Figure 4.
Compression curves of specimens taken from various horizontal distances of section 1 (a), section 2 (b) and section 3 (c) of the embankment.
Figure 4.
Compression curves of specimens taken from various horizontal distances of section 1 (a), section 2 (b) and section 3 (c) of the embankment.

Figure 5.
Yield stress of specimens taken from various horizontal distances of section 1 (a), section 2 (b) and section 3 (c) and compared to the yield stress of the untreated clayey soil, and to the yield stress of specimens treated in laboratory at 2% and 5% lime.
Figure 5.
Yield stress of specimens taken from various horizontal distances of section 1 (a), section 2 (b) and section 3 (c) and compared to the yield stress of the untreated clayey soil, and to the yield stress of specimens treated in laboratory at 2% and 5% lime.

Figure 6.
Shrinkage curves of specimens from the edge and from the inner part of section 1 (a), section 2 (b) and section 3 (c) of the embankment, and compared to the shrinkage of the untreated sample.
Figure 6.
Shrinkage curves of specimens from the edge and from the inner part of section 1 (a), section 2 (b) and section 3 (c) of the embankment, and compared to the shrinkage of the untreated sample.

Figure 7.
Shrinkage curves from the edge and the inner part of all three sections and compared to shrinkage curves obtained in the laboratory by Stoltz et al. (2014) [46] and by Wang et al. (2020) [7].


Table 1.
Main geotechnical properties of the studied clayey soil.
| Parameters | Values |
|---|---|
| Passing sieve 80 μm (%) | 90 |
| Clay size content (<2 μm) (%) | 70 |
| Specific gravity Gs (-) | 2.675 |
| Liquid limit (%) | 71 |
| Plastic limit (%) | 29 |
| Plasticity index (%) | 42 |
Table 2.
Treatment dosage for each section of the embankment.
| Section | 1 | 2 | 3 |
|---|---|---|---|
| Upper part | 4% CaO | 4% CaO | 2% CaO + 3% CEM II |
| Lower part | Untreated | 4% CaO | 2% CaO + 3% CEM II |
Table 3.
Compaction characteristics under normal Proctor energy of the treated clayey soil used for the embankment, compared to compaction characteristics measured at construction time for all sections.
Table 3.
Compaction characteristics under normal Proctor energy of the treated clayey soil used for the embankment, compared to compaction characteristics measured at construction time for all sections.
| Section | 1 | 1 | 2 | 3 |
|---|---|---|---|---|
| Treatment | 0% | 4% CaO | 4% CaO | 2% CaO + 3% CEM II |
| wOMC (%) | 26.5 | 38.0 | 38.0 | 32.5 |
| qd,Max (Mg/m3) | 1.45 | 1.244 | 1.244 | 1.338 |
| ei (-) | 0.84 | 1.15 | 1.15 | 1.00 |
| w (%) | 34.0 | 33.0 | 35.0 | 32.8 |
| w-wOMC (%) | +7.5 | −5.0 | −3.0 | +0.3 |
| qd (Mg/m3) | 1.380 | 1.364 | 1.319 | 1.395 |
| qd/qd,Max (%) | 95.2 | 109.6 | 106.0 | 104.3 |
Table 4.
Shrinkage limit water ratio and shrinkage potential measured on specimens from the three sections of the embankment.
Table 4.
Shrinkage limit water ratio and shrinkage potential measured on specimens from the three sections of the embankment.
| Section | 1 | 1 | 2 | 3 | |||
|---|---|---|---|---|---|---|---|
| Treatment | Untreated | 4% CaO | 4% CaO | 2% CaO + 3% CEM II | |||
| Horizontal distance | / | 0.30 m | 4.10 m | 0.30 m | 4.10 m | 0.30 m | 4.10 m |
| ew,SL (-) | 0.35 | 0.27 | 0.22 | 0.25 | 0.22 | 0.27 | 0.25 |
| PSH (%) | 22.8 | 19.2 | 10.0 | 16.2 | 8.6 | 18.5 | 10.2 |
Disclaimer/Publisher’s Note: The statements, opinions and data contained in all publications are solely those of the individual author(s) and contributor(s) and not of MDPI and/or the editor(s). MDPI and/or the editor(s) disclaim responsibility for any injury to people or property resulting from any ideas, methods, instructions or products referred to in the content. |
© 2023 by the authors. Licensee MDPI, Basel, Switzerland. This article is an open access article distributed under the terms and conditions of the Creative Commons Attribution (CC BY) license (https://creativecommons.org/licenses/by/4.0/).
Share and Cite
MDPI and ACS Style
Chabrat, N.; Cuisinier, O.; Masrouri, F. In Situ Alteration of the Hydro-Mechanical Behaviour of a Compacted Stabilised Expansive Soil. Geotechnics 2023, 3, 921-936. https://doi.org/10.3390/geotechnics3030049
AMA Style
Chabrat N, Cuisinier O, Masrouri F. In Situ Alteration of the Hydro-Mechanical Behaviour of a Compacted Stabilised Expansive Soil. Geotechnics. 2023; 3(3):921-936. https://doi.org/10.3390/geotechnics3030049
Chicago/Turabian StyleChabrat, Nicolas, Olivier Cuisinier, and Farimah Masrouri. 2023. "In Situ Alteration of the Hydro-Mechanical Behaviour of a Compacted Stabilised Expansive Soil" Geotechnics 3, no. 3: 921-936. https://doi.org/10.3390/geotechnics3030049