
Statistical and Predictive Analyses of the Strength Development of a Cement-Treated Clayey Soil

1
LEMTA, Université de Lorraine, CNRS, F-54000 Nancy, France
2
Department of Earth Science, Environment and Resources, University of Napoli Federico II, 80126 Napoli, Italy
*
Author to whom correspondence should be addressed.
Geotechnics 2023, 3(2), 465-479; https://doi.org/10.3390/geotechnics3020026
Submission received: 18 May 2023
/
Revised: 2 June 2023
/
Accepted: 5 June 2023
/
Published: 7 June 2023
Abstract
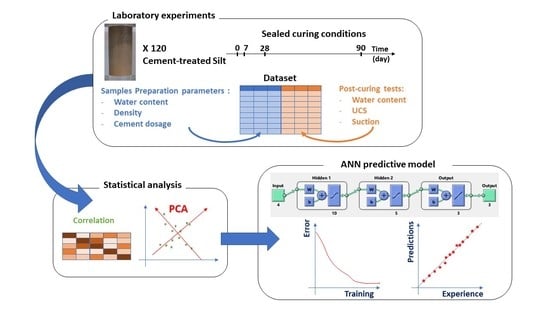
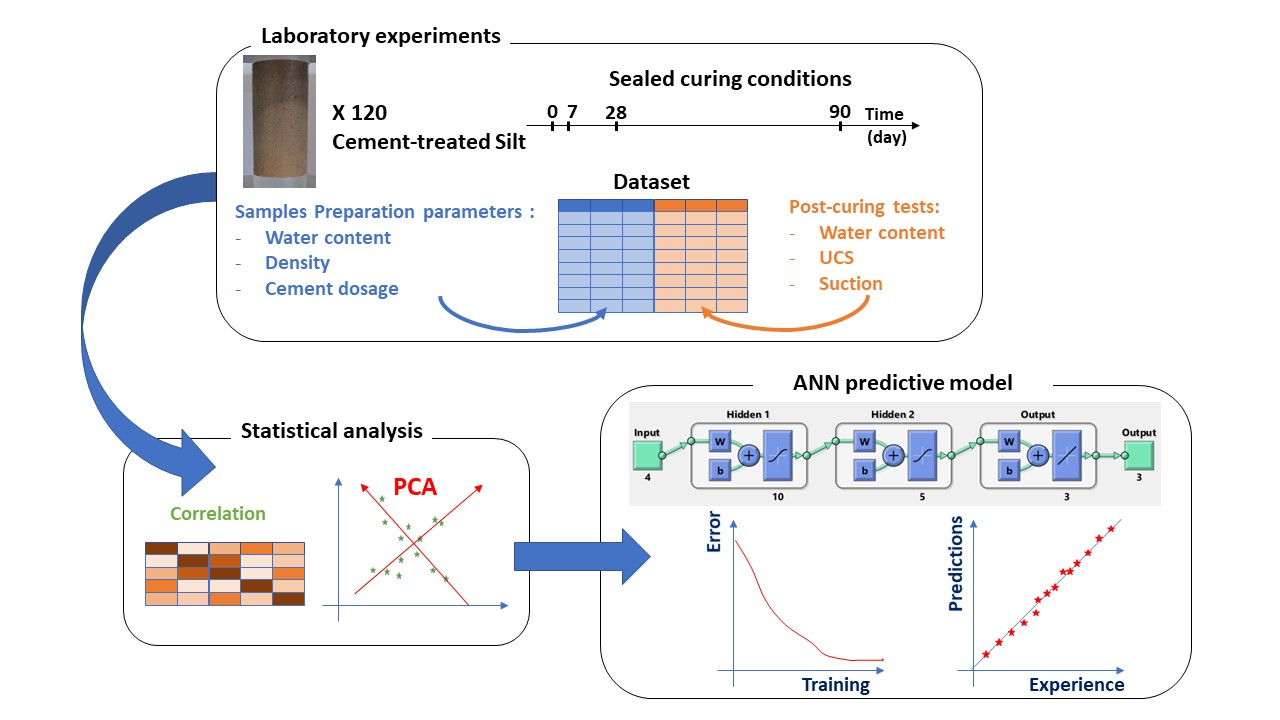
:The mechanical efficiency of soil stabilization with cement is mainly controlled by various parameters, namely, the amount of binder, the compaction soil state and the curing conditions. The strength of the treated soil is the result of a complex combination of several factors that condition the physicochemical processes involved in cement hydration, which are difficult to monitor. The objective of this study is to identify the relevant parameters governing the bonding in cement-treated soil and suggest a predictive model for strength evolution using these parameters as input. To this purpose, an extensive testing program is presented to assess the impact of the initial water content (11–18%) and dry density (1.6–1.87 Mg/m3) as well as cement dosage (3 and 6%) in sealed curing conditions for 0, 7, 28 and 90 days. The water content variation, the total suction and the compressive strength were measured after different curing durations. The experimental results are first discussed in the parameters’ space, and then through a principal components analysis to overcome the complexity due to the parameters’ interdependency. The PCA revealed that the cement dosage explained 40% of the dataset variance, the remaining 60% being related to a combination of the initial state and curing time. Finally, a predictive model based on an artificial neural network was developed and tested. The predicted results were excellent, with an R2 of +0.99 with the training data and +0.93 with the testing data. These results should be improved by extending the dataset to include different soils and additional compaction conditions.
1. Introduction
Cement stabilization is a convenient way to improve the geotechnical properties of compacted fine soils, including their mechanical strength [1,2,3,4]. The use of cement-treated or cement-stabilized soils can be employed to build road base and subbase [1,4,5], embankments and river levees [6,7], and they are also of interest for building rammed earth walls [8,9,10]. This treatment technique permits maximization of the reuse of locally available soils for the construction of earthen geostructures, upgrading them from waste to a resource. The strength of cement-treated soils is the result of a combination of several intercorrelated factors, including (i) compaction conditions, namely, the compaction energy, water content and dry density; (ii) the amount and the properties of the binder; (iii) the soil parameters such as particle size distribution and plasticity index [2,3,4,9]; and (iv) the curing conditions, including sealed or open systems. The relative impact of each factor on the resulting strength is, however, still difficult to decipher given the multiple interdependencies between all the materials, their initial state and the curing parameters.
Considering the chemistry of the soil–cement mixture, the strength development in cement-treated soils results from a combination of four interacting mechanisms: cement hydration, pozzolanic reaction, carbonation and suction development. The two latter mechanisms are effective only under drying curing conditions and can be of minor importance when sealed curing conditions are imposed. The cement hydration process produces portlandite and cementitious components (C-S-H, C-A-H, etc.) while the pozzolanic reaction consumes portlandite to produce new cementitious compounds. Ho et al. [11] investigated the contribution of each process to the treated soil’s strength by coupling various analytical techniques (X-ray diffraction, Mercury Intrusion Porosimetry and Thermogravimetric Analyses) on three different soils and under both drying and sealed curing conditions. They assumed that the suction and carbonation contribution to the strength development could be neglected when curing occurs under sealed conditions. With this assumption, they evaluated the contribution of these processes to almost 25% of the final strength for a sand–loam mixture and up to 45% of the final strength of a sand mixture using a cement dosage of 8% for both mixtures.
The initial moisture content plays a primary role at different levels. It has a major impact on cement hydration with curing time [12,13] and controls the treated soil initial microstructure [14,15]. The impact of the initial moisture content on the setting reactions and the subsequent material strength development is then a major concern. Indeed, several authors showed that at a fixed dry density, the strength of the stabilized soils is a function of the initial moisture content [16,17]. It is known that, in the case of cement, a minimum amount of water is required to fulfill the hydration process [18,19]. Only the capillary water is freely accessible for cement hydration, and this process can be significantly hindered when the amount of the available capillary water is limited. For complete hydration, 1 g of cement binds approximately 0.42 g of water (0.23 g chemically bound water and 0.19 g gel water) [19]. The hydration of cement thus results in a reduction in capillary water, provoking a moisture content decrease. Below a certain amount of water, cement hydration cannot completely proceed unless additional water is supplied, depending on curing conditions. At a certain degree of hydration, if the capillary water is consumed, the hydration can be significantly retarded as the cement attempts to react with the harder bound gel water. This results in a relative humidity decrease and a simultaneous development of pore suction. The curing conditions are therefore crucial for the strength development of cement-treated soils. In the case of cement-treated saturated soils, some authors analyzed the water–cement interaction mechanisms [12,20]. In that case, full hydration of the cement can be reached. Such a situation can be observed in certain cement treatment applications, such as deep mixing. In other applications, such as the stabilization of compacted soils, the soil remains unsaturated during the curing process and some studies showed that the curing process is associated with an increase in suction in the samples [21,22]. However, very few investigations were performed to analyze the setting reaction development as a function of the curing time under unsaturated conditions, which are more realistic for in situ soil treatment (road subbase, embankments, etc.). Morales Hernandez et al. [23] recently experimentally studied the effect of suction development during biocementation of a compacted silt–clay sand and reported a systematic increase in soil small-strain stiffness, with increasing suction revealing an important variation of the soil water potential on the microbial reactions with compaction parameters. The chemical reactions involved in cement treatment are expected to give rise to similar interactions and suction could be an interesting measurable indicator of strength development.
With regard to predictive modelling of the post-curing parameters of cement-treated soils, Kang et al. [24] provided a comprehensive review of the empirical formulae proposed by many authors for the prediction of the Unconfined Compressive Strength (UCS) of the mixture. These approaches mainly used cement dosage and/or the water/cement ratio, porosity or void ratio, and geotechnical identification parameters of the soil, such as particle size fractions, liquid and plastic limits. Often, one or two additional parameters were fitted to estimate the final UCS value. Ref. [24] suggested introducing a reduced times coefficient to predict UCS evolution during the curing. Recently, Zhang et al. [25] investigated using different machine learning techniques to predict the strength of cement-stabilized soft soil. They concluded that the cement content, water content, curing time and clay fraction were the most important variables for predicting UCS. They trained the model on a 566-sample dataset collected from the literature and achieved a satisfactory coefficient of determination of 0.93 with their extreme gradient boosting model using the training partition. The generalization of the models to the unseen testing partition was, however, less effective, with an error rate of up to 20% in the predictions. One should mention, though, that they used data mainly from deep mixing projects with specific conditions related to high water contents, variability in density and strength measurements, making it difficult to generalize their approach to a different application context.
In this context, the main objective of this study is to identify the relevant initial state parameters governing the increase in bonding for a soil stabilized with cement and cured in unsaturated conditions under controlled laboratory conditions. An original strategy was developed with a special emphasis on the assessment of the evolution of moisture content and suction, the latter being a major added value in this study. It was based first on the generation of a comprehensive set of experimental data that will be analyzed in a second step, with an advanced statistical technique. In a third step, a predictive analysis approach based on an artificial neural network (ANN) was designed to assess the relevance of the identified parameters as predictors of the hydration process advancement and the strength development of the treated soil. Unlike existing machine learning models, this study relies on the orthogonal linear transformation of the input variables to generate new independent variables and subsequently increase the interpretability of the experimental data while conserving the maximum amount of information. The use of principal components analysis (PCA) is intended to increase the predictive performance of the ANN model.
2. Experimental Program
An experimental program was defined with the objective of assessing the effect of the initial state and compaction parameters on the strength development of the treated material under sealed curing conditions. In this section, the tested materials and experimental methods are presented.
2.1. Materials
The soil selected to perform this study was sampled in Northern France (Table 1). The mineralogical content of the initial soil was determined from X-ray diffraction tests using the PANalytical X’Pert Pro, from Malvern Panalytical Ltd.,, Malvern, UK, a multipurpose X-ray diffractometer equipped with a Cu Kα source. The measurements were conducted on solid particles passed through a 50 µm sieve. The analytical conditions were as follows: 40 kV, 40 mA, Ni filter, angular domain from 2.5 to 65° with 90 s counting time. The results showed that it is mainly composed of quartz (84%) and potassium feldspars (6%) and plagioclase (4%), its clay fraction (5%) being composed of illite and kaolinite with a significant amount of interstratified illite and smectite minerals [7]. The soil can be classified as CL (lean clay) according to [26], and as an A2 soil according to the French soil classification system [27].
The soil was treated with two cement contents (3 and 6%) calculated relative to the dry soil mass. These quantities of treatment product were defined based on common practice in France [28]. The cement category was CEM II with 65% clinker, 35% limestone and fly ash.
2.2. Sample Preparation and Pre-Curing Tests
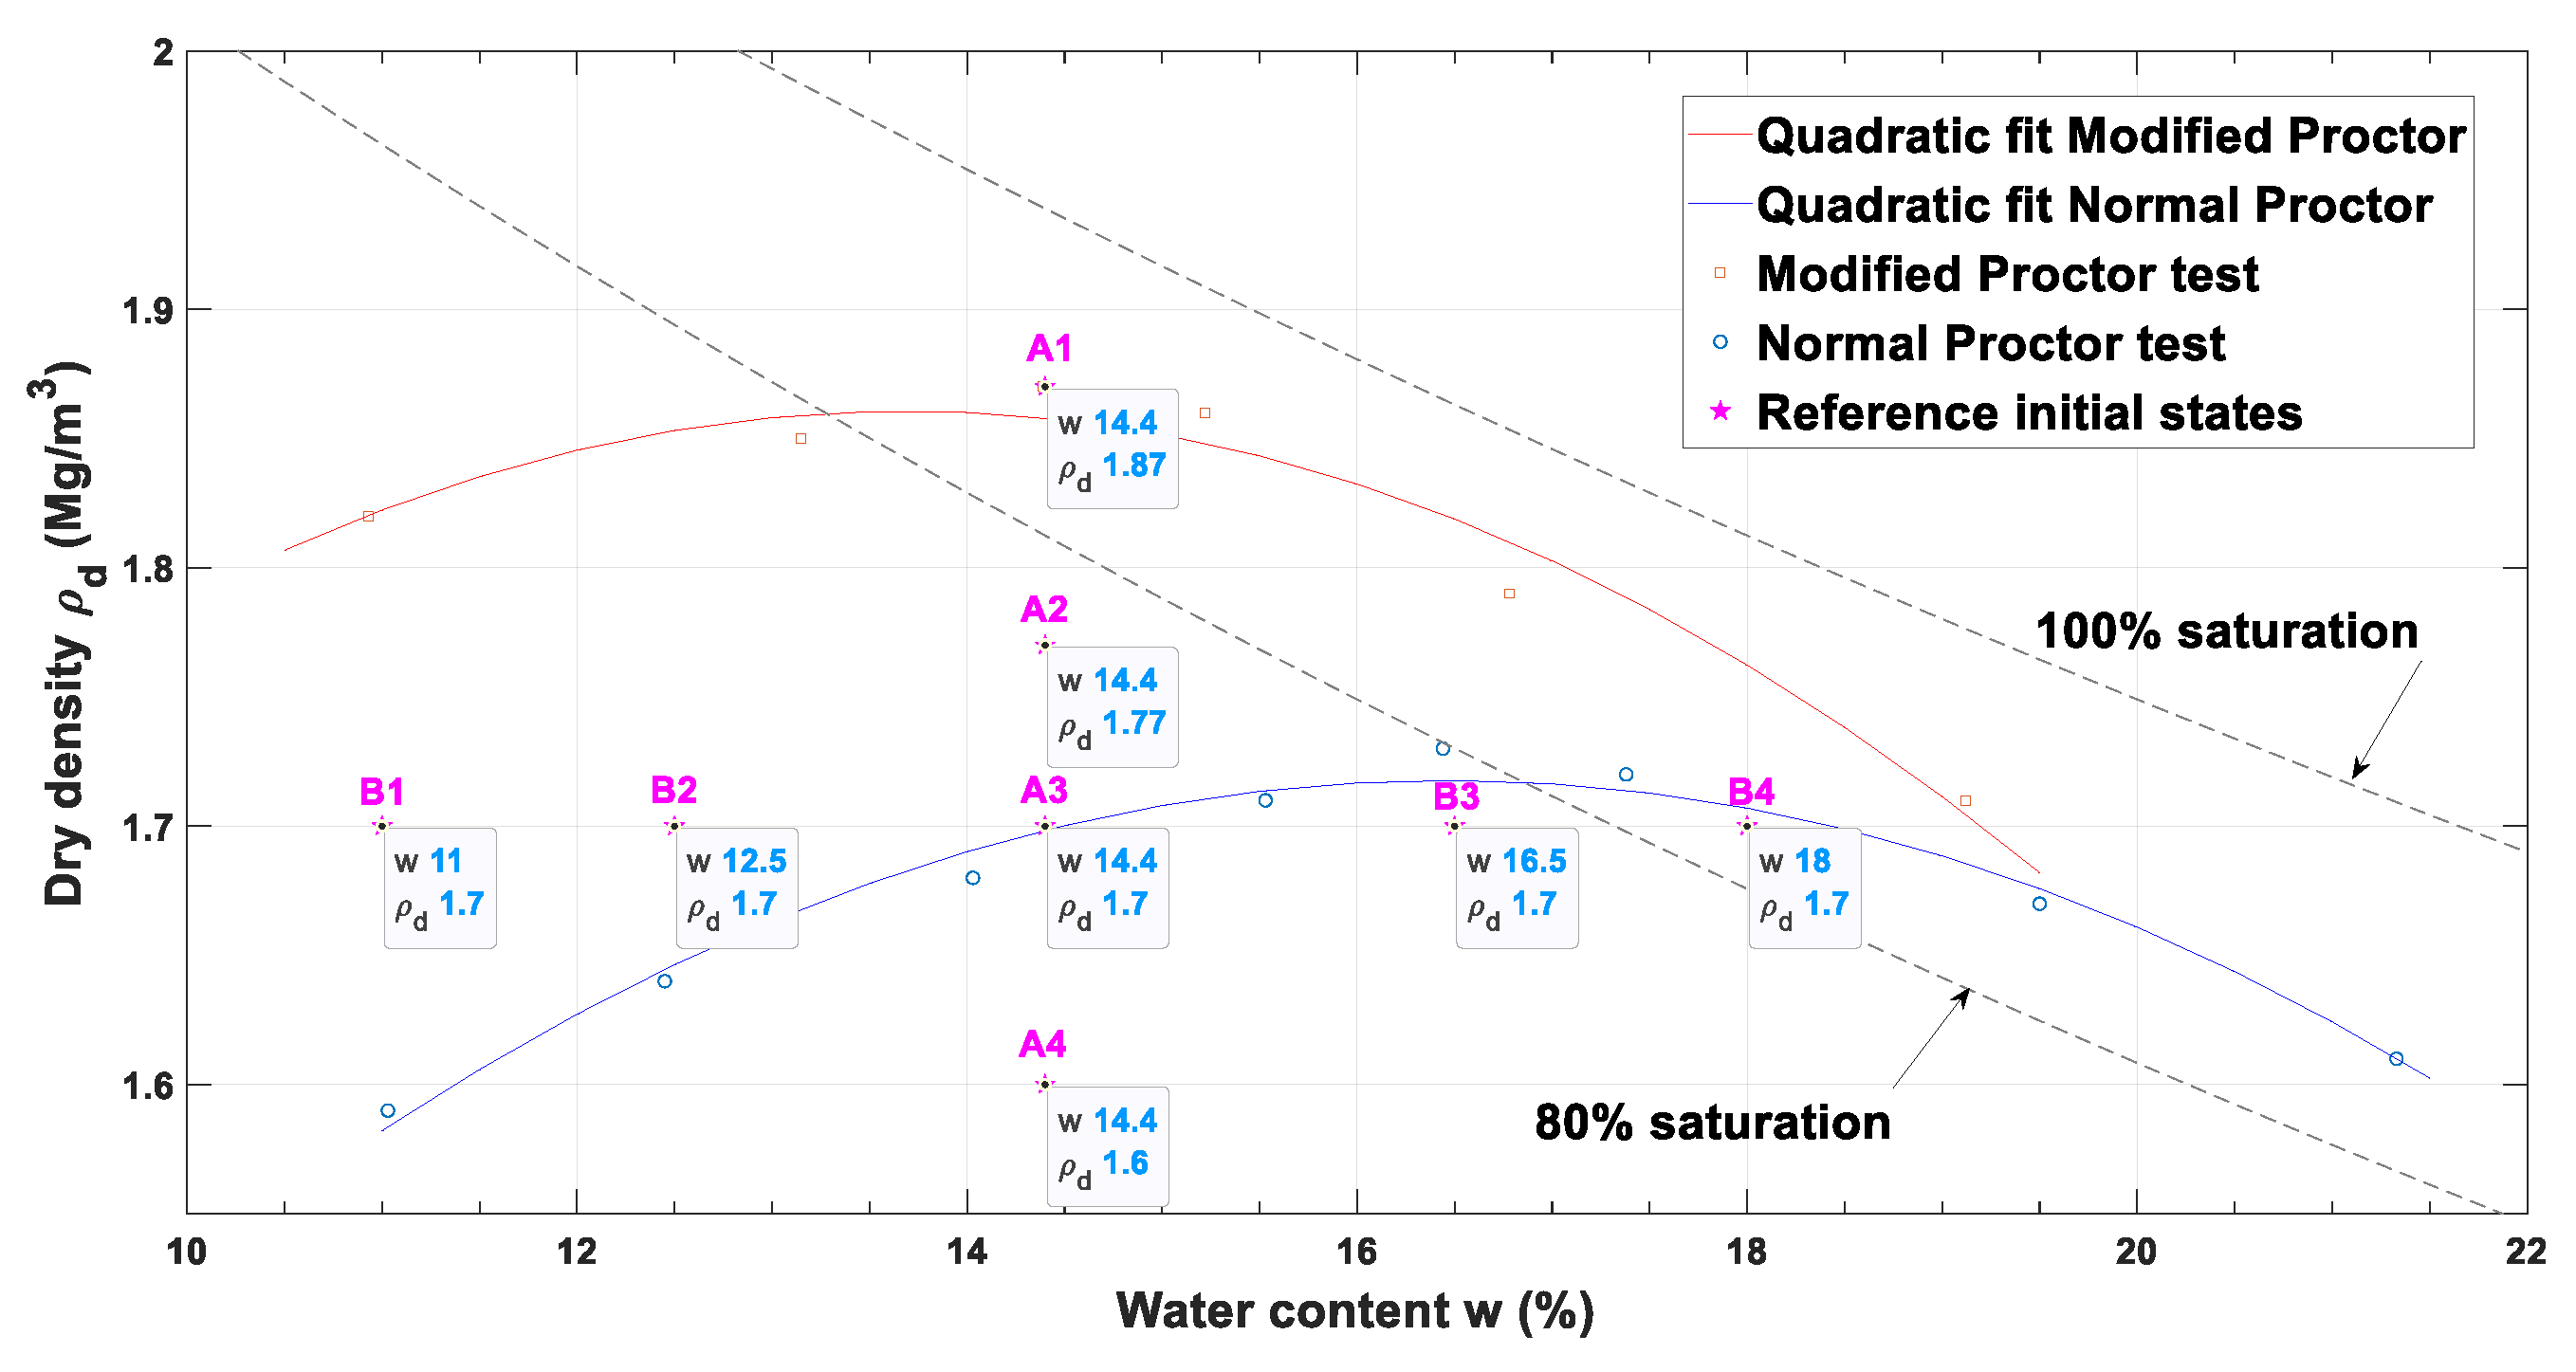
First, the compaction characteristics of the untreated soil were determined using both Normal Proctor and Modified Proctor compaction energy according to the standard ASTM-D 698 [29]. For the untreated specimen preparation, the water content of the soil was adjusted to the desired value for compaction; then the mixed soil was stored in plastic bags for 24 h before compaction. The obtained compaction curves were used to select the target initial states: five target water content values (B1, B2, B3 and B4 at a constant dry density of 1.7 Mg/m3) and four target densities (A1, A2, A3 and A4 corresponding to a constant water content of 14.4%), as shown in Figure 1.
For the cement-treated samples, after a storage period of 24 h, during which the moisture content homogenized, the soil and cement were thoroughly mixed and a double-piston density-controlled compaction was carried out within a short delay (maximum of 30 min) after treatment to account for the setting time of the cement. For each target initial state, a series of specimens (50 mm in diameter and 100 mm in height) were tested immediately after compaction (more or less 1 h later) and 3 series of specimens were wrapped in a plastic film and stored for a curing period of 7, 28 and 90 days at a controlled temperature of 20.0 ± 1.5 °C to prevent any water loss. The actual initial water content and density of each specimen were determined.
2.3. Post-Curing Tests
For each target initial state and for each curing time, the UCS was determined as well as the final water content and the final total suction. UCS is commonly used as an indicator for cement-treated soils; it was measured using a 10 kN-capacity loading machine with a resolution of 0.01 kN and a displacement rate of 1 mm/min [29]. The final suction (s) was measured to assess the evolution of the soil water potential during the cement hydration in relation to water consumption during the curing; the total suction was measured using the dew-point potentiometer WP4C™ from Decagon Devices, Inc., Pullman, WA, USA according to [30,31], with an accuracy of 50 kPa in the range 0–50,000 kPa and 1% for suction higher than 5000 kPa [30].
For the water content variation, the initial and final water contents are determined through oven drying at a temperature of 105 °C and have thus as a reference the solid dry mass of the material. The solid mass in the initial state refers to the initial dry mass of the soil plus the mass of cement while in the final state; it refers to solid materials comprising the newly formed cementitious compounds. As the reference mass is different for the two measurements, the variation needs to be corrected. One method for fixing this bias is to calculate a corrected final water content, which refers to the initial solid mass by assuming that, under sealed conditions, the total mass is constant, so that the loss of water mass is integrally compensated by an increase in the solid mass corresponding to the cementitious compounds (Equations (1) and (2)), where wf is the final (post-curing) mass water content; wi is the initial (pre-curing) mass water content; ∆w is the corrected mass water content variation during the curing (= wi − wf); Ms is the initial dry mass of soil; Mc is the initial dry mass of cement; Mw is the initial mass of water in the sample; and Mcc is the mass of cementitious compounds created during the curing. In summary, Table 2 provides the investigated parameters.
2.4. Repeatability Checking
Considering the relatively important variability that could be associated with the UCS measurement of soils, and in order to check the repeatability of the preparation of the specimens and the compression test procedure, specimens were randomly replicated at least once and up to three times. The observed coefficients of variation for UCS and , were, respectively, in the ranges from 0.003 to 0.28 and from 0 to 0.28, the highest variability being generally associated with the lowest measured values.
3. Results and Discussion
In this section, the results of the post-curing tests are presented and discussed versus the initial state parameters to identify the most efficient predictor regarding the impact of treatment strength.
3.1. Impact of Initial State Parameters on Post-Curing Properties
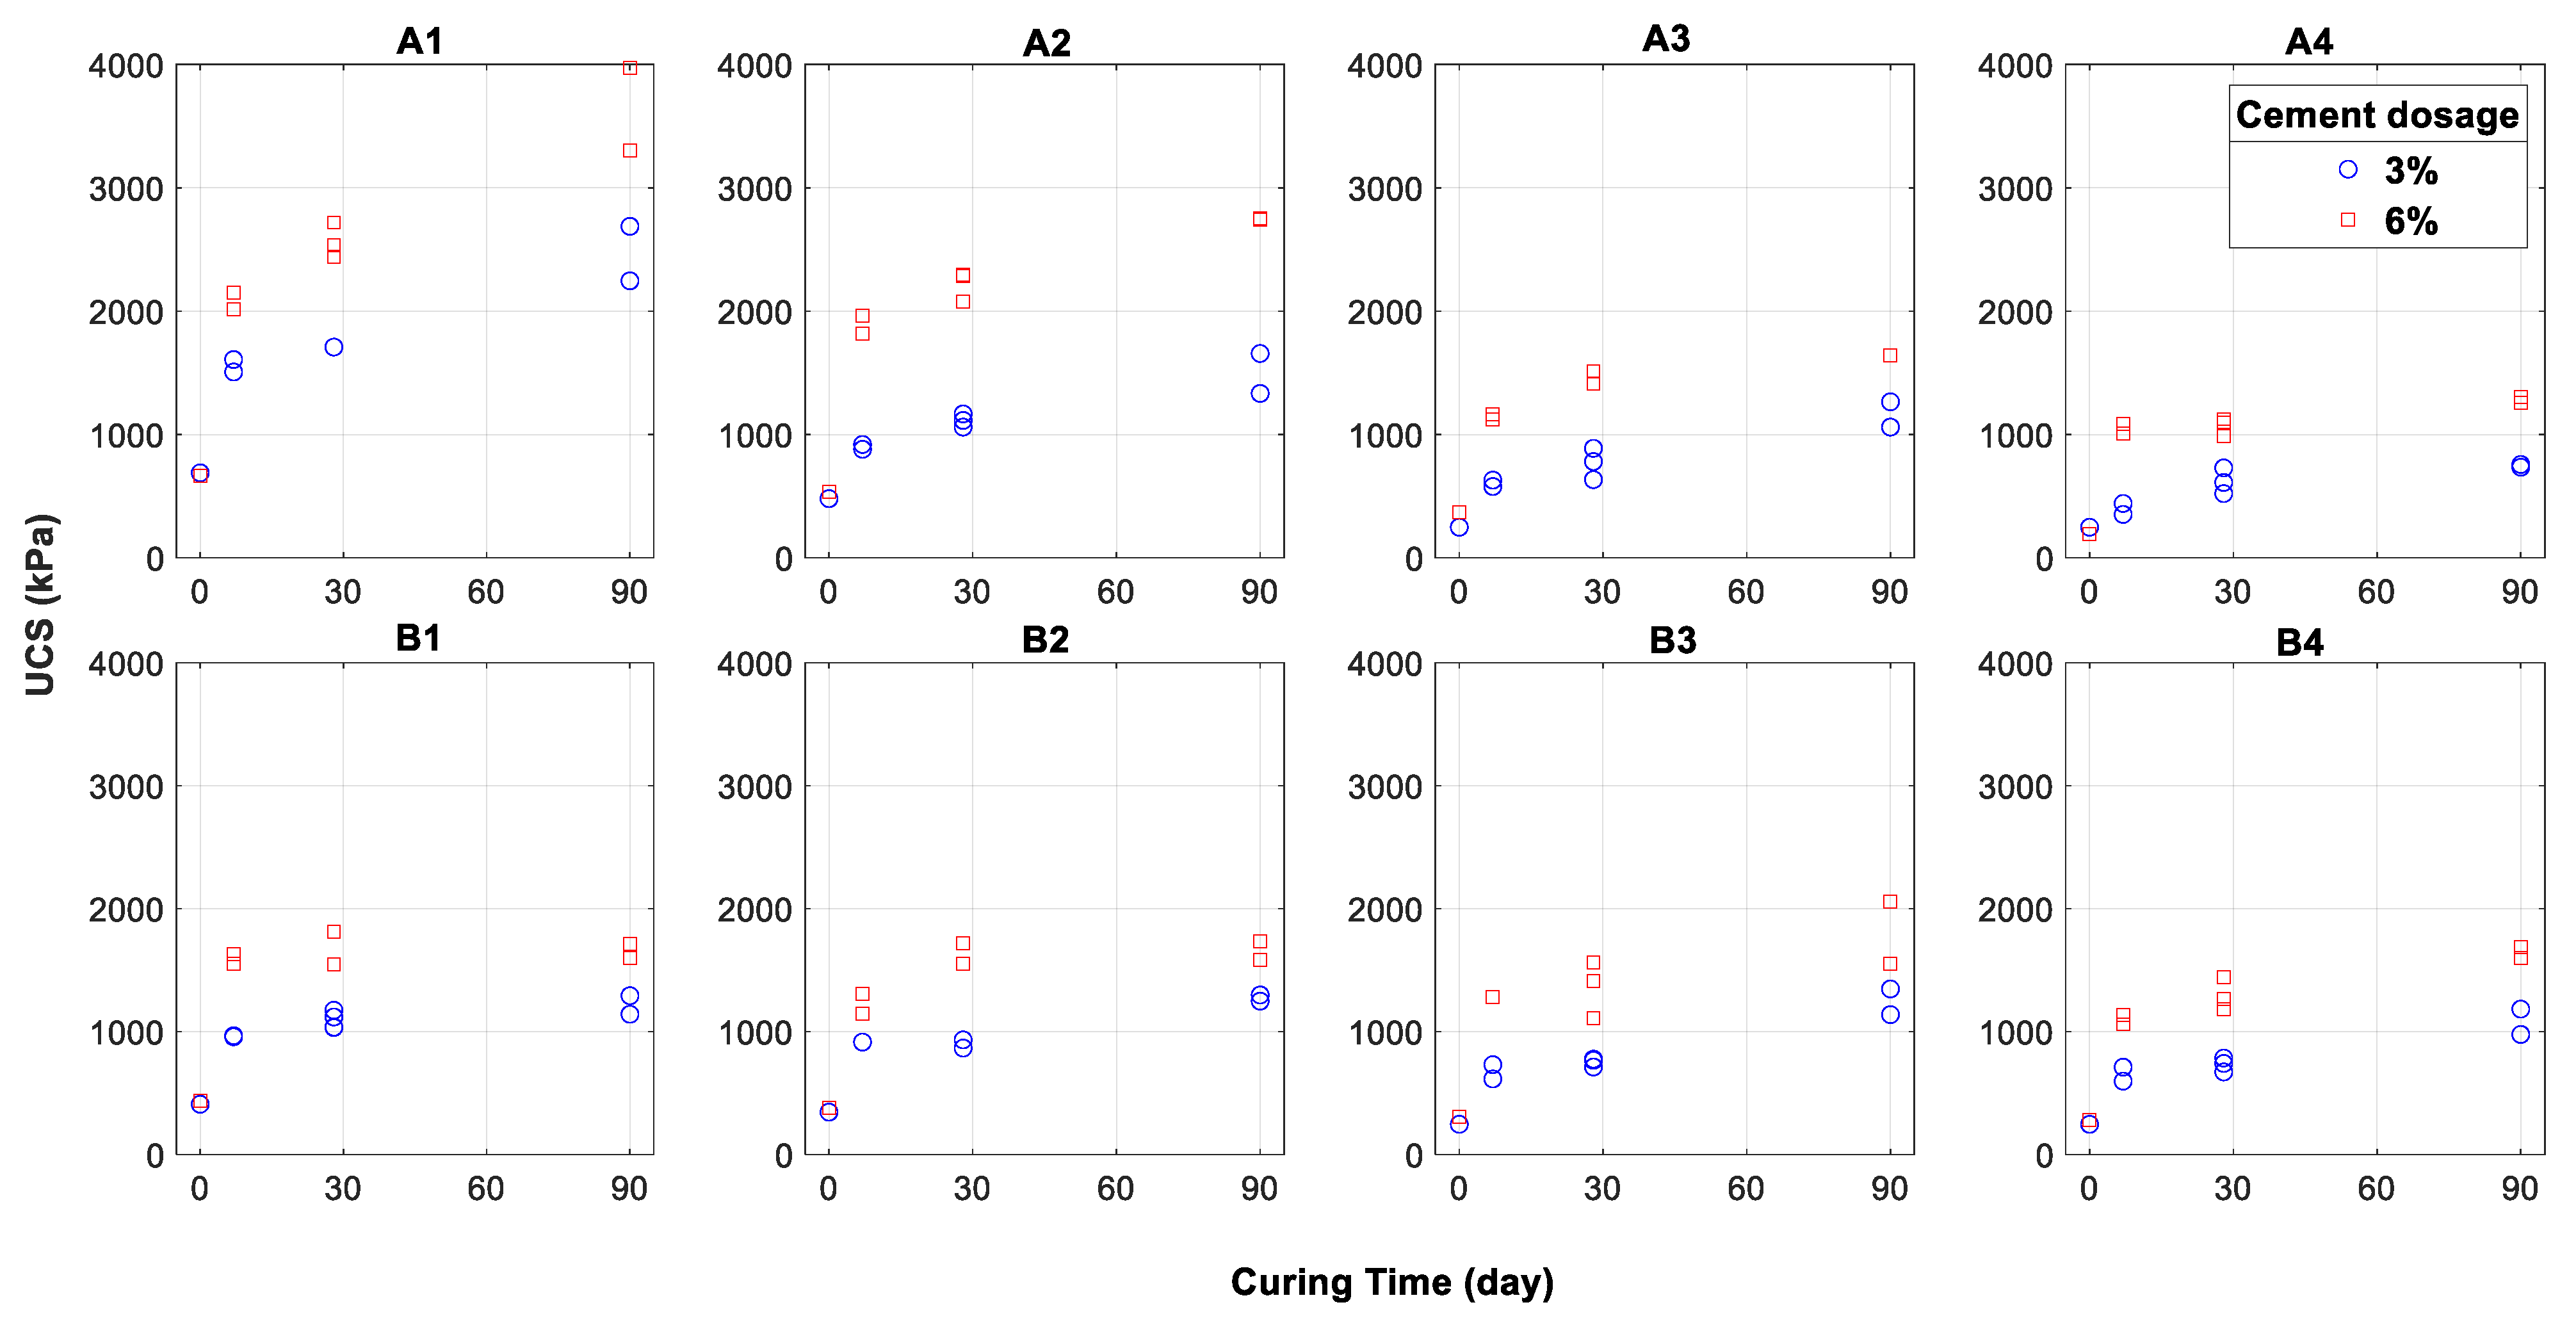
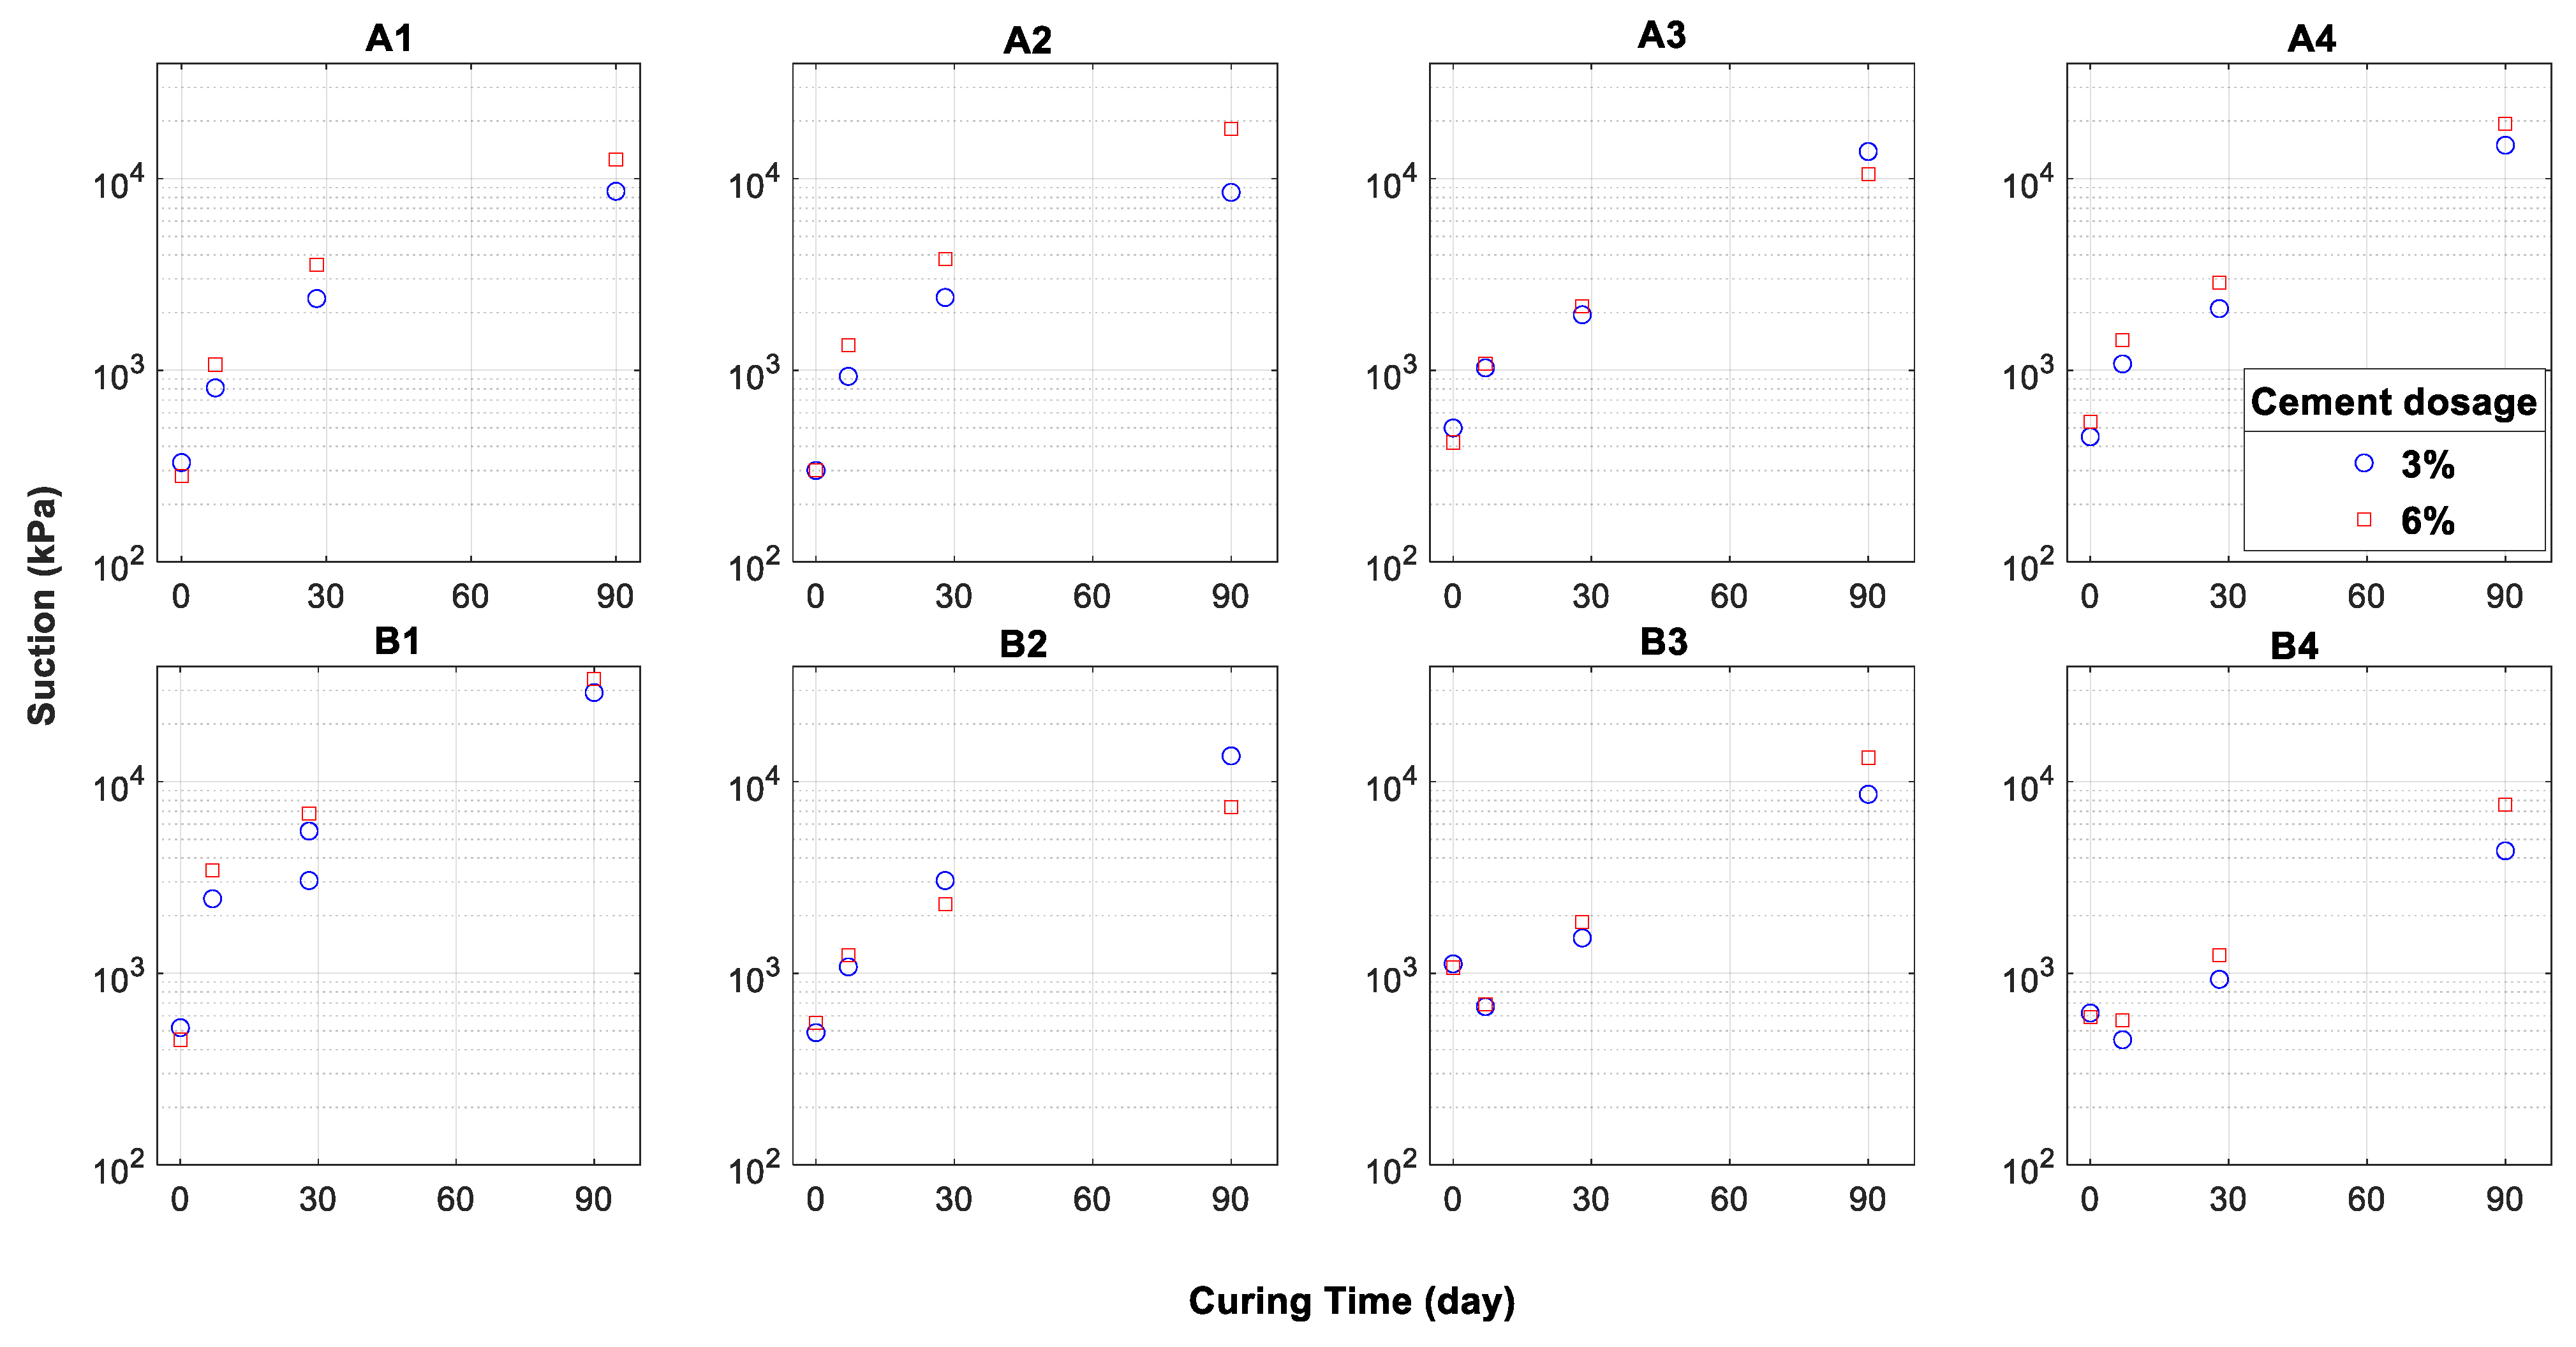
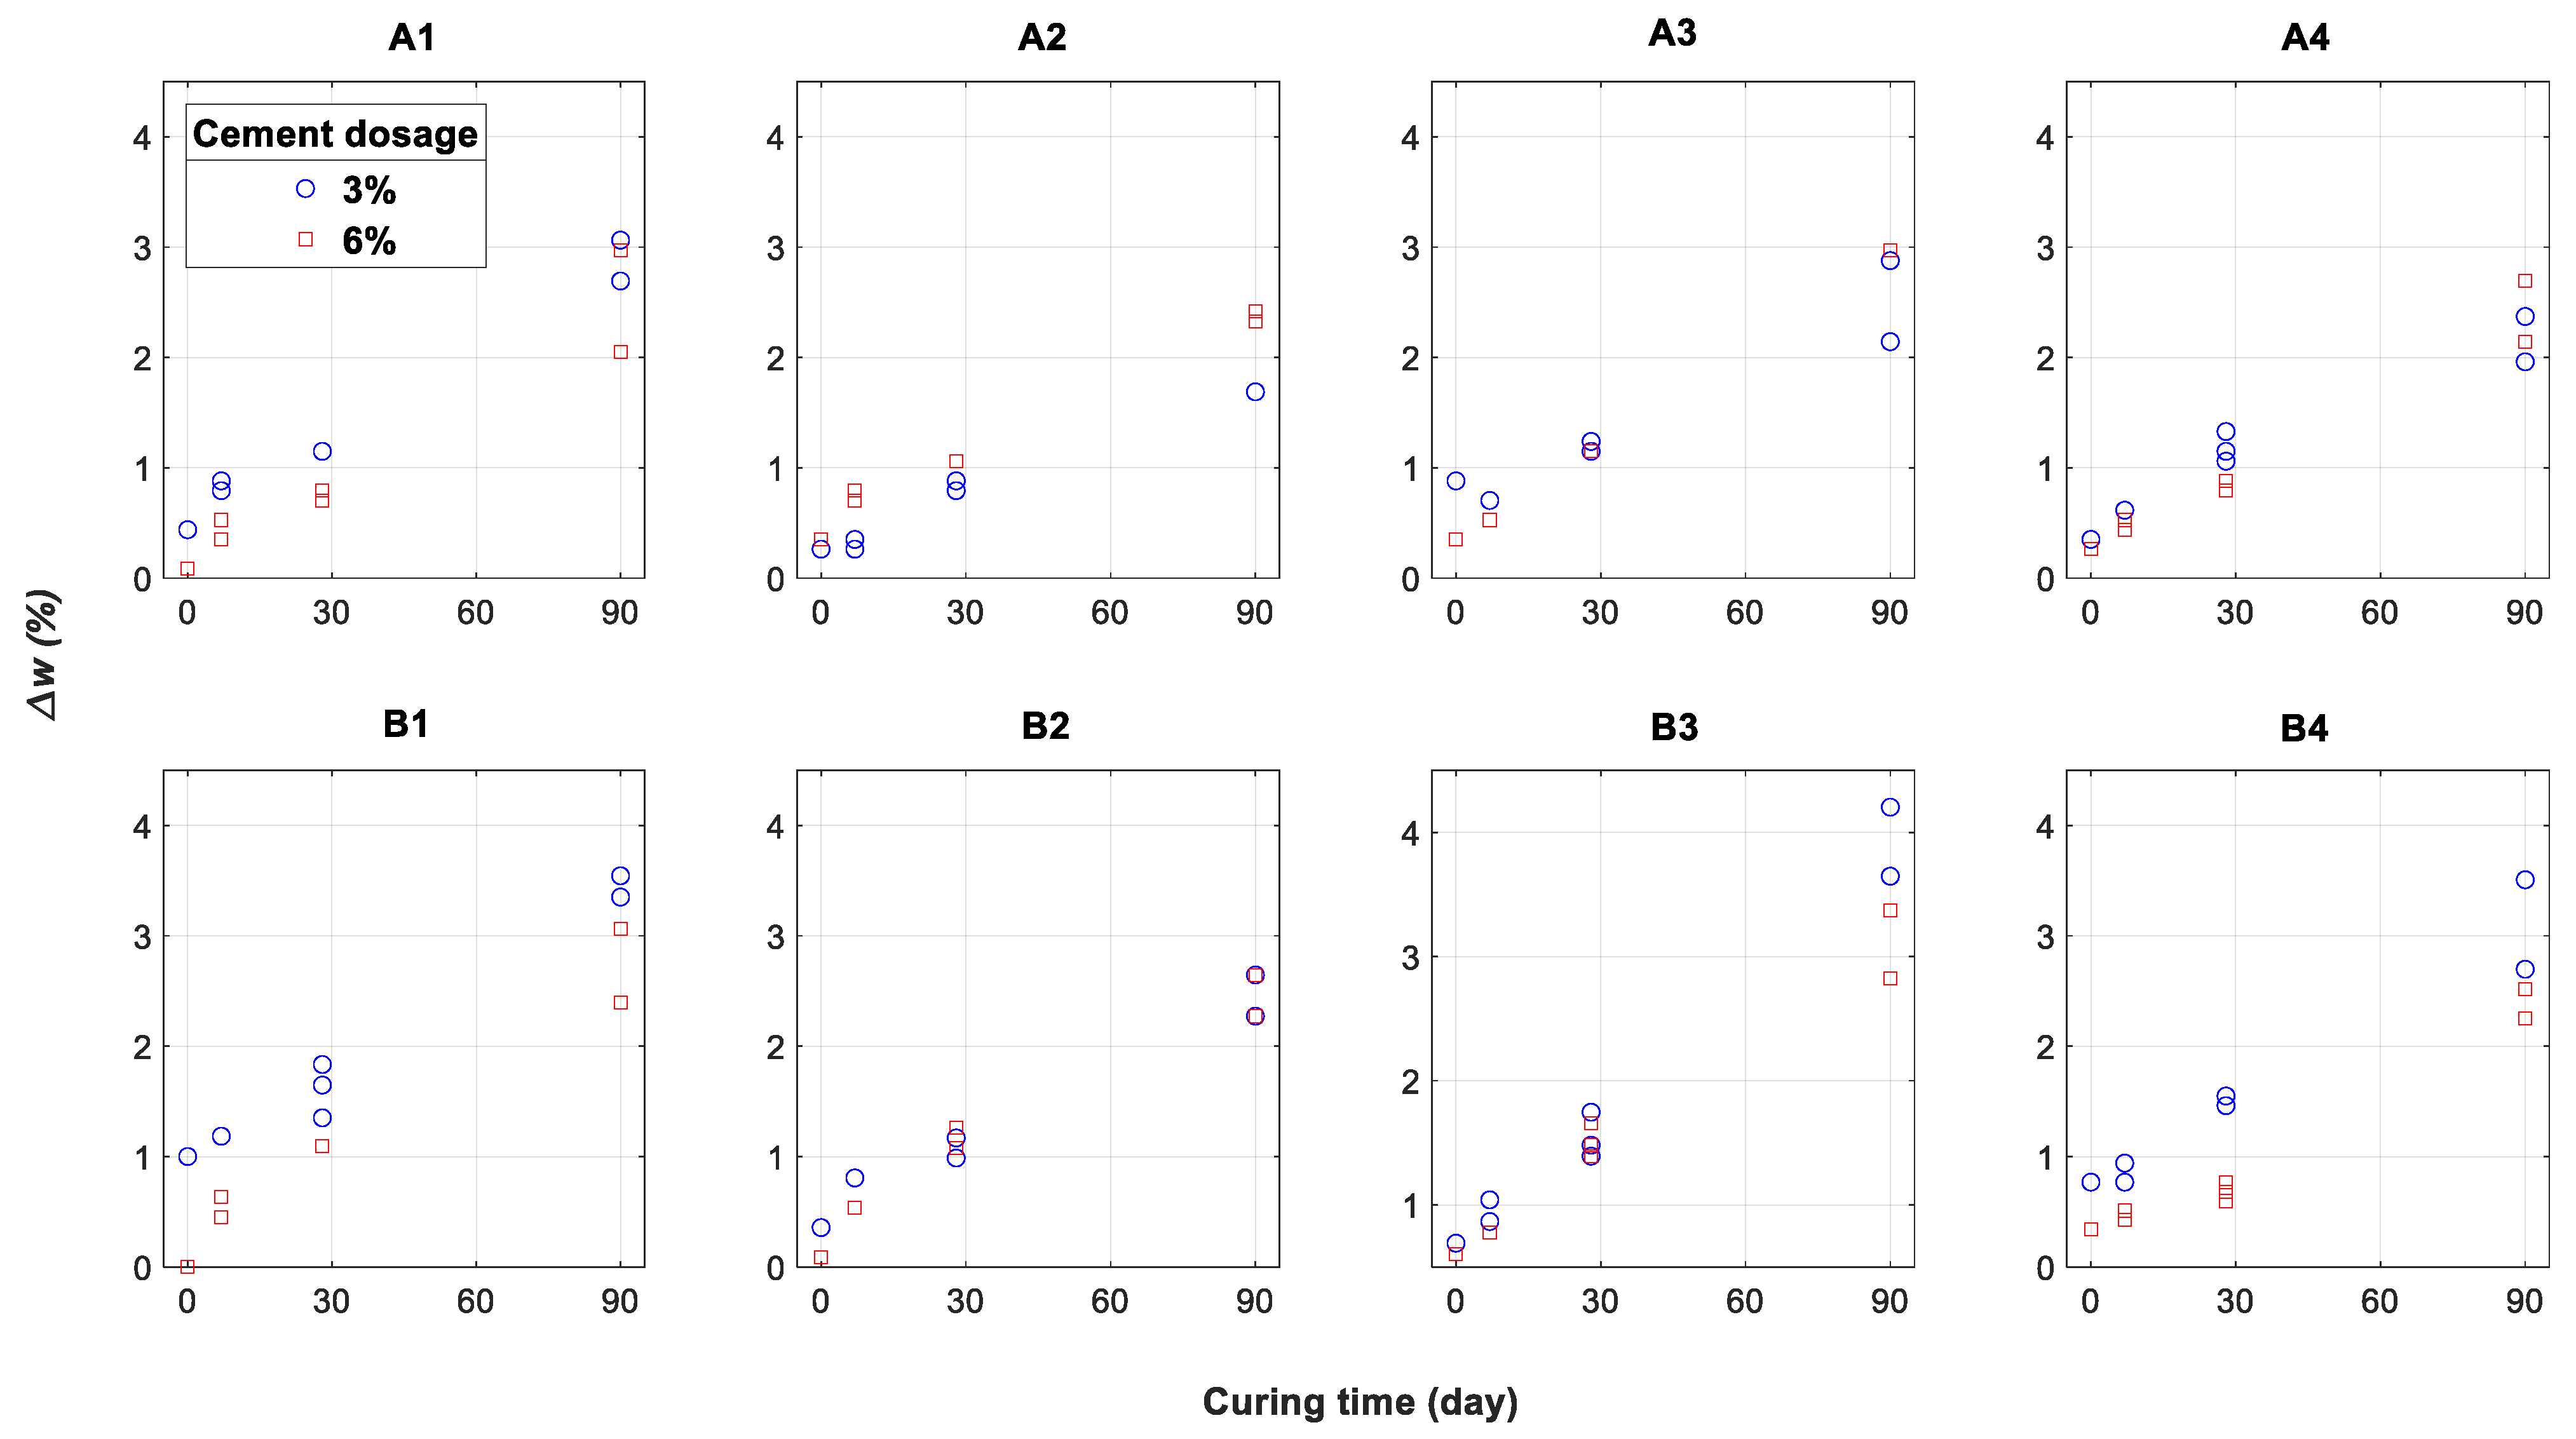
Figure 2 shows the evolution of UCS with the curing time grouped by cement dosage for the different compaction conditions. The mechanical performance decreases with decreasing initial dry density at constant water content (A1, A2, A3, A4) and slightly decreases with increasing water content at a constant dry density (B1, B2, B3, B4). The increase of the cement dosage systematically leads to a higher performance, but the magnitude of the increase appears to be highly dependent on the initial dry density. Plotting the evolution of suction (Figure 3) and the variation of water content during the curing (Figure 4) in the same manner shows that the soil water potential magnitude as well as the water content variation are not significantly affected by the initial dry density and are only slightly decreased as the initial water content increases.
3.2. Role of Void–Cement Ratio
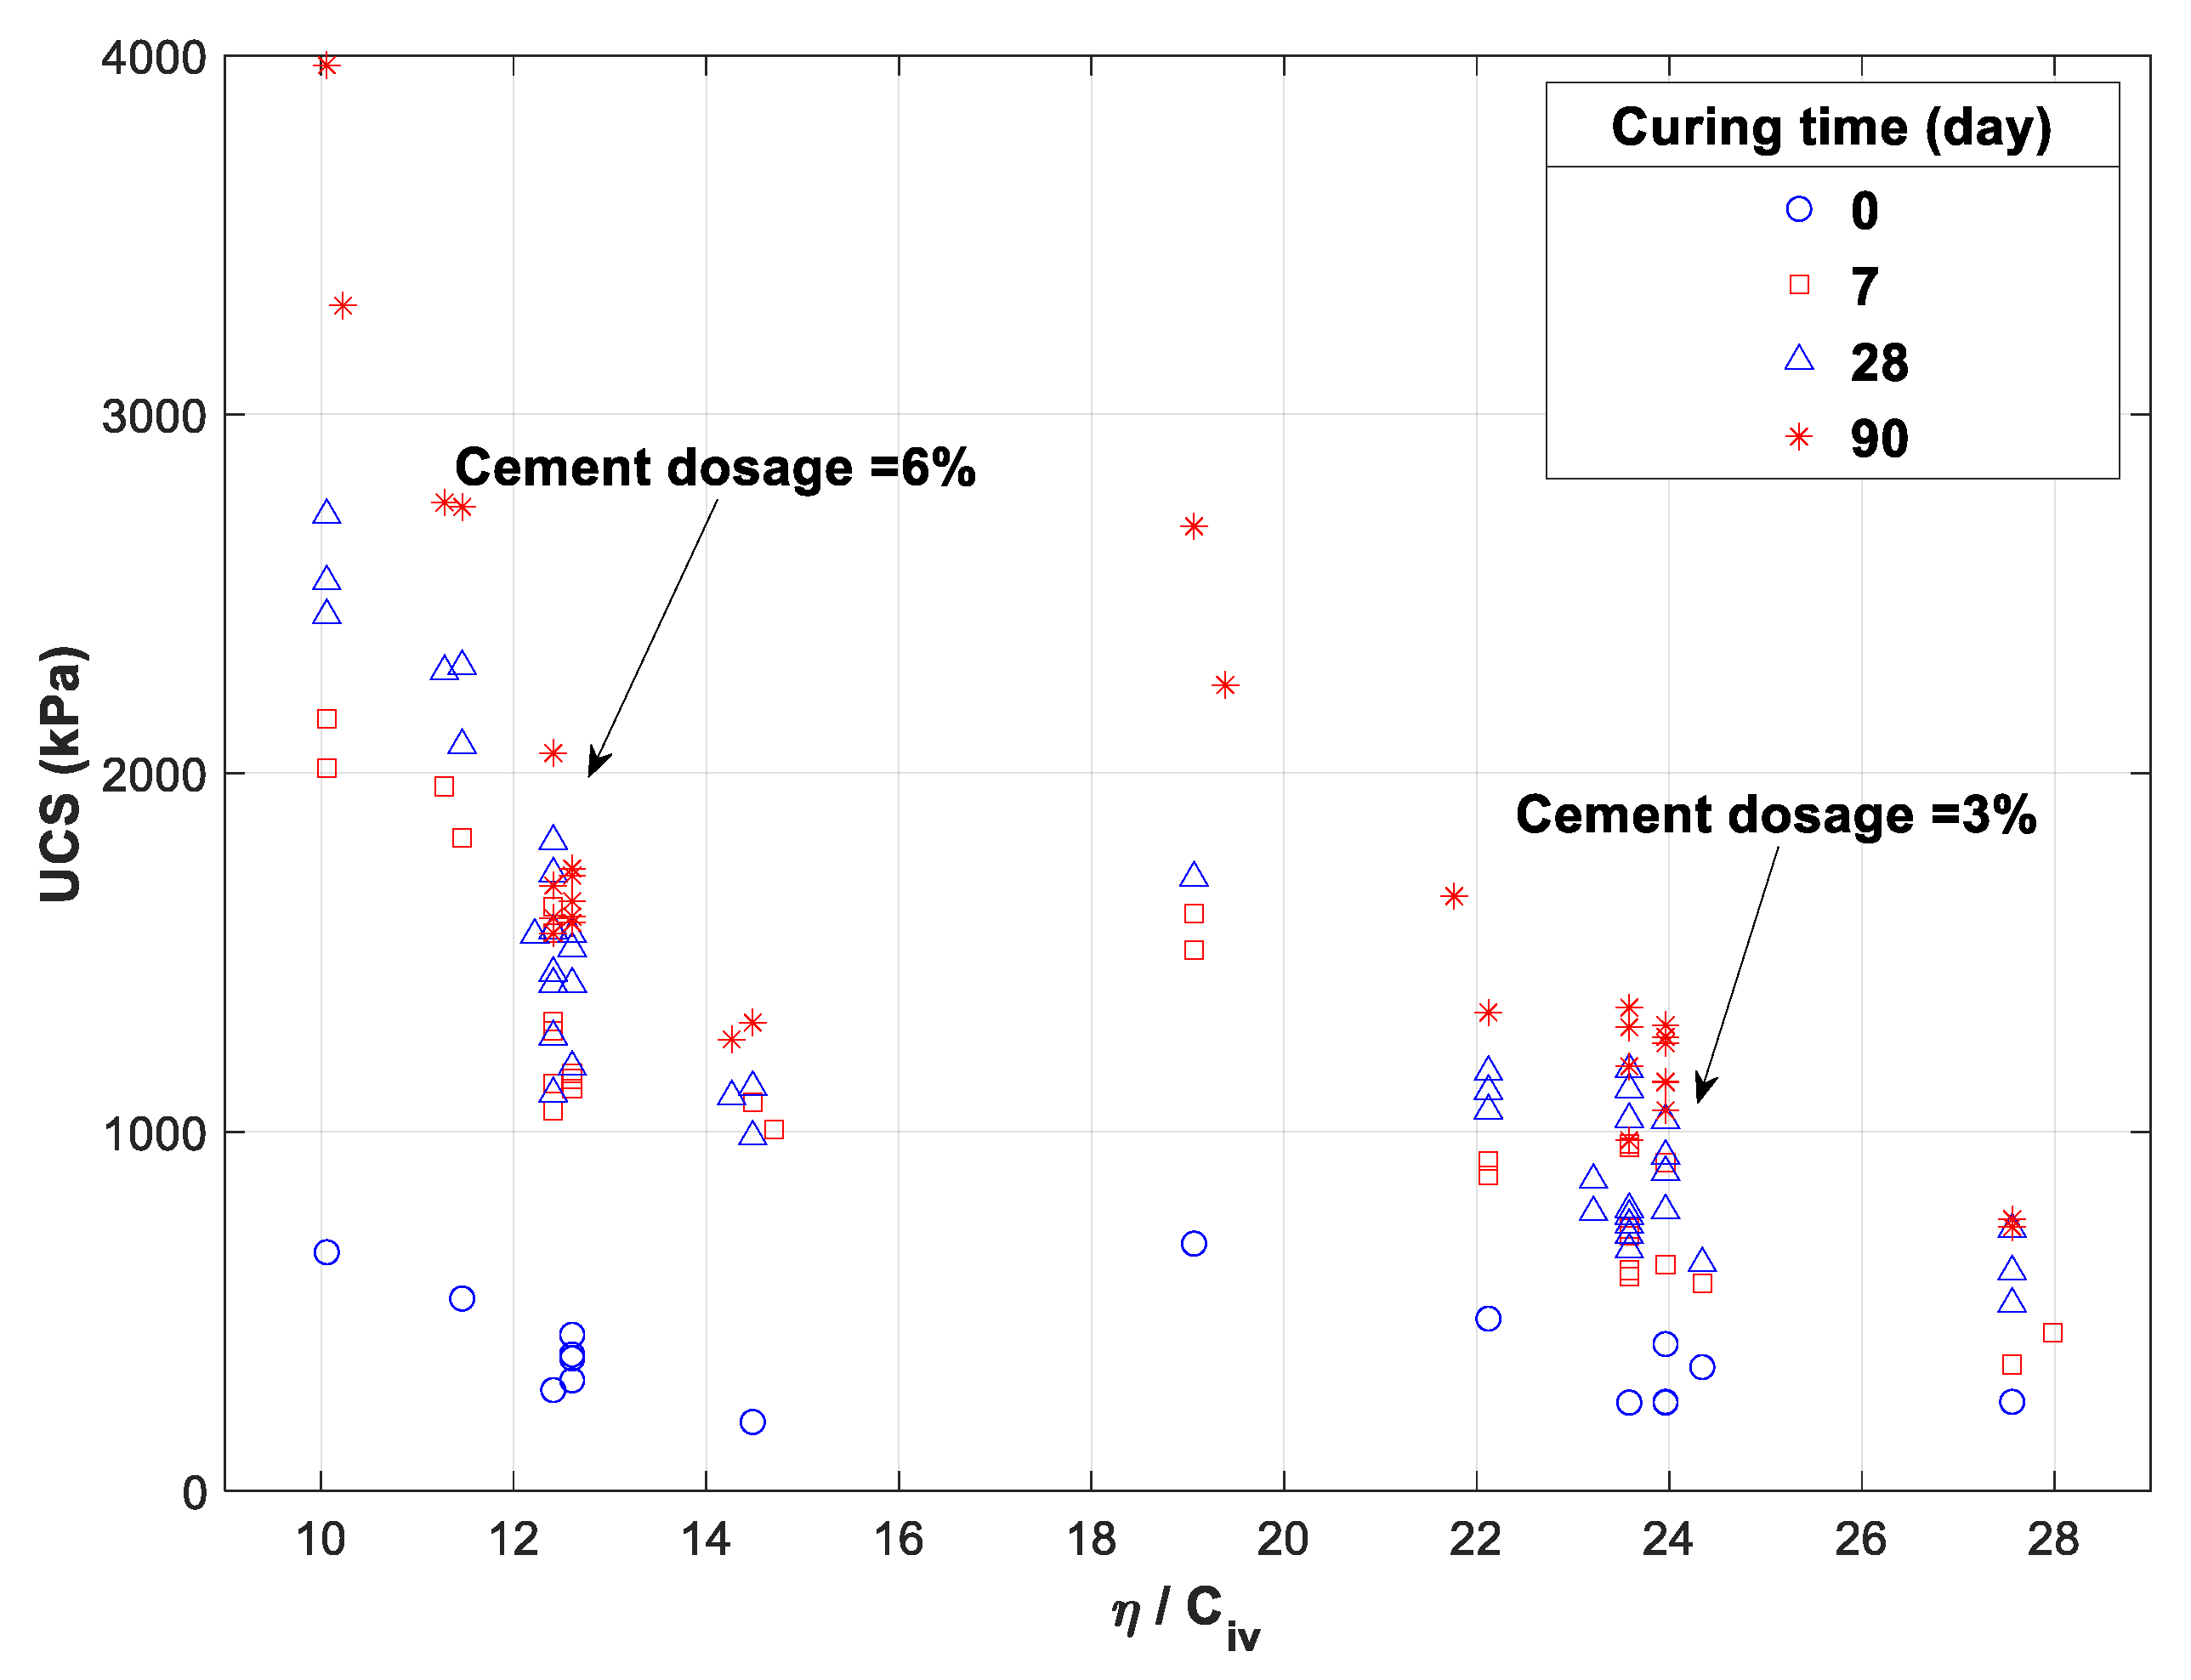
The void–cement ratio (η/Civ) was suggested by [3] as a parameter controlling the final strength of artificially cemented soils rather than the cement–water (c/w) ratio generally used in concrete formulation. η and Civ, respectively, refer to the initial mixture porosity and the volumetric cement ratio. Figure 5 represents a plot of UCS versus η/Civ grouped by curing time and cement dosage. The shape of the UCS-η/Civ curve is similar to the one evidenced by [3], provided that the data are grouped by curing time and cement dosage. This suggests that the void–cement ratio is certainly an efficient predictor for the mechanical performance of cement-treated soils, but it should be used in addition to other parameters. This is probably because it does not incorporate any information about the amount and the availability of soil water for cement hydration advancement, the latter being completed implicitly when considering the curing time and the cement dosage information in our dataset. This finding corroborates the results by Kang et al. [24], who investigated the relevance of water/cement and soil/cement ratios for predicting the UCS of fine-grained soils and suggested using a normalized curing time coefficient as a fitted predictive parameter.
3.3. The Soil-Water Potential as an Indicator of the Mechanical Performance?
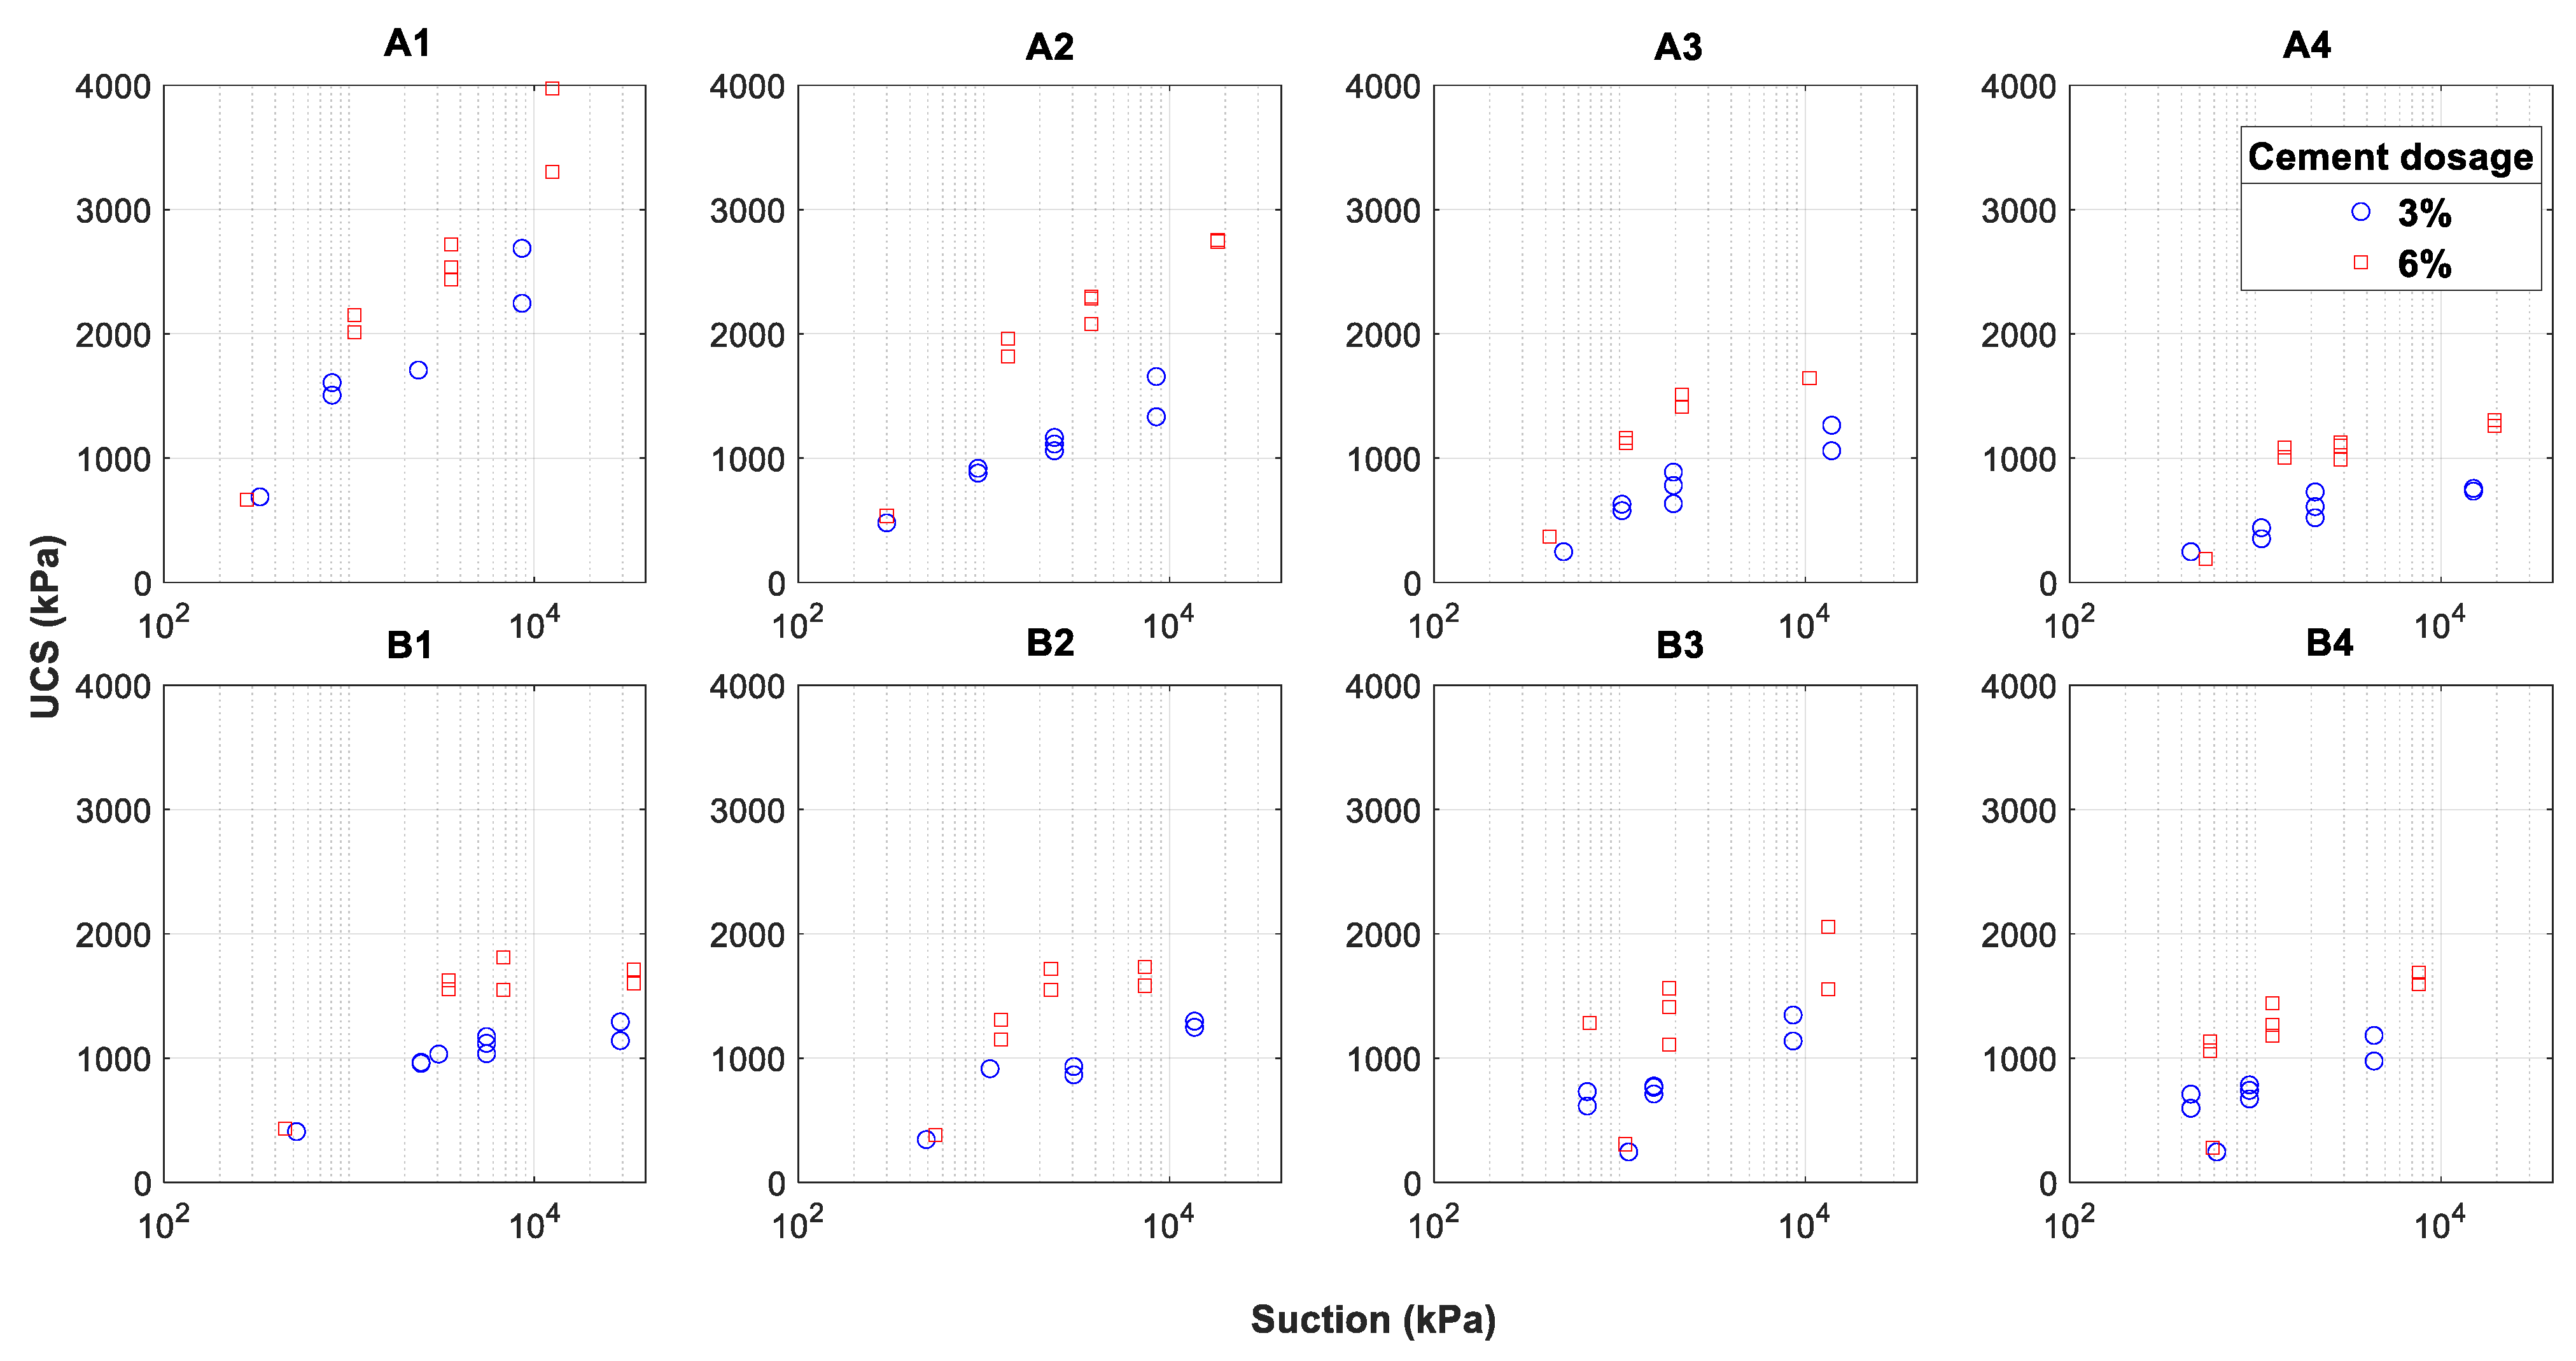
Suction is a variable allowing to quantify the pore-water potential during the curing which is related not only to the initial water content but also to the availability of pore-water for the cement hydration process essentially controlled by the soil microstructure. Figure 6 shows the evolution of UCS with suction grouped by cement dosage for the different compaction conditions. For any initial condition, a higher cement dosage results in a higher mechanical performance under constant suction and the difference is lower as the dry density decreases. The initial water content seems to have little influence on suction/UCS development. It is then clear that there is a correlation between UCS and suction while the controlling parameters of this correlation are not enough evidenced. Since the suction in the sample is an average value that is highly dependent on the microstructure (i.e., the pore-size distribution), it should be interesting to consider the compaction energy as an additional initial state variable to complete the compaction parameters.
4. Statistical and Predictive Modelling
In the previous section, the data analysis was unable to establish a comprehensive interpretation of the key parameters involved in controlling the mechanical strength development. In this section, a statistical analysis of the dataset is presented, aiming to provide a more efficient manner to represent the information it contains. The correlation between the parameters and the definition of uncorrelated combinations of the parameters are under focus. Then a predictive model using a machine learning approach (Artificial Neural Network) is presented and evaluated.
4.1. Correlation Analysis
The Pearson’s correlation coefficients between the initial state and post-curing parameters are presented in Table 3. These reveal that all the post-curing parameters are unequally correlated with the pre-curing variables. UCS, for instance, is significantly correlated with ρd, c and η/Civ, while s is only correlated (negatively) to wi, and Δw is only slightly correlated to η/Civ. These results are consistent with the available data in the literature [3,24]. It is worth noting that, as could be expected, all the post-curing parameters are significantly intercorrelated, meaning that suction and water content evolutions could be interesting indicators for the monitoring of strength development. However, since all the parameters are intercorrelated, it could be interesting to examine different combinations of parameters to find new independent variables describing the process. This will be presented in Section 4.2.
4.2. Principal Components Analysis
A PCA was performed to define new statistically uncorrelated predictors of the progress of the hydration process and the development of soil strength. The PCA is a statistical data analysis technique consisting in transforming a correlated variable space into a space for independent new variables, which are linear combinations of initial variables. The new variables, called Principal Components (PCs), are selected to reduce the dimensionality of the studied problem and, at the same time, to remove any redundancy and/or noise in the data. Here, the FactoMineR package was used in the R software environment for performing the analysis [32]. The dataset used in the PCA contains one categorical variable in reference to the sample target compaction state (A1, A2, A3, A4, B1, B2, B3 or B4) and eight numerical variables (wi, ρd, c, η/Civ, tc, s, Δw and UCS). The four first numerical variables describe the pre-curing state while the latter three describe the post-curing state, the fifth variable being the curing time. The pre-curing variables and the curing time are fully considered in the PCA, whereas the post-curing variables and the sample class are deactivated variables that will be represented besides the active variables for observation without being part of the PCA construction process. This choice was made to prevent the post-curing data from influencing the variance of the data, since our main objective is to find a means of analyzing the final state parameters, given the initial state variables and the curing time.
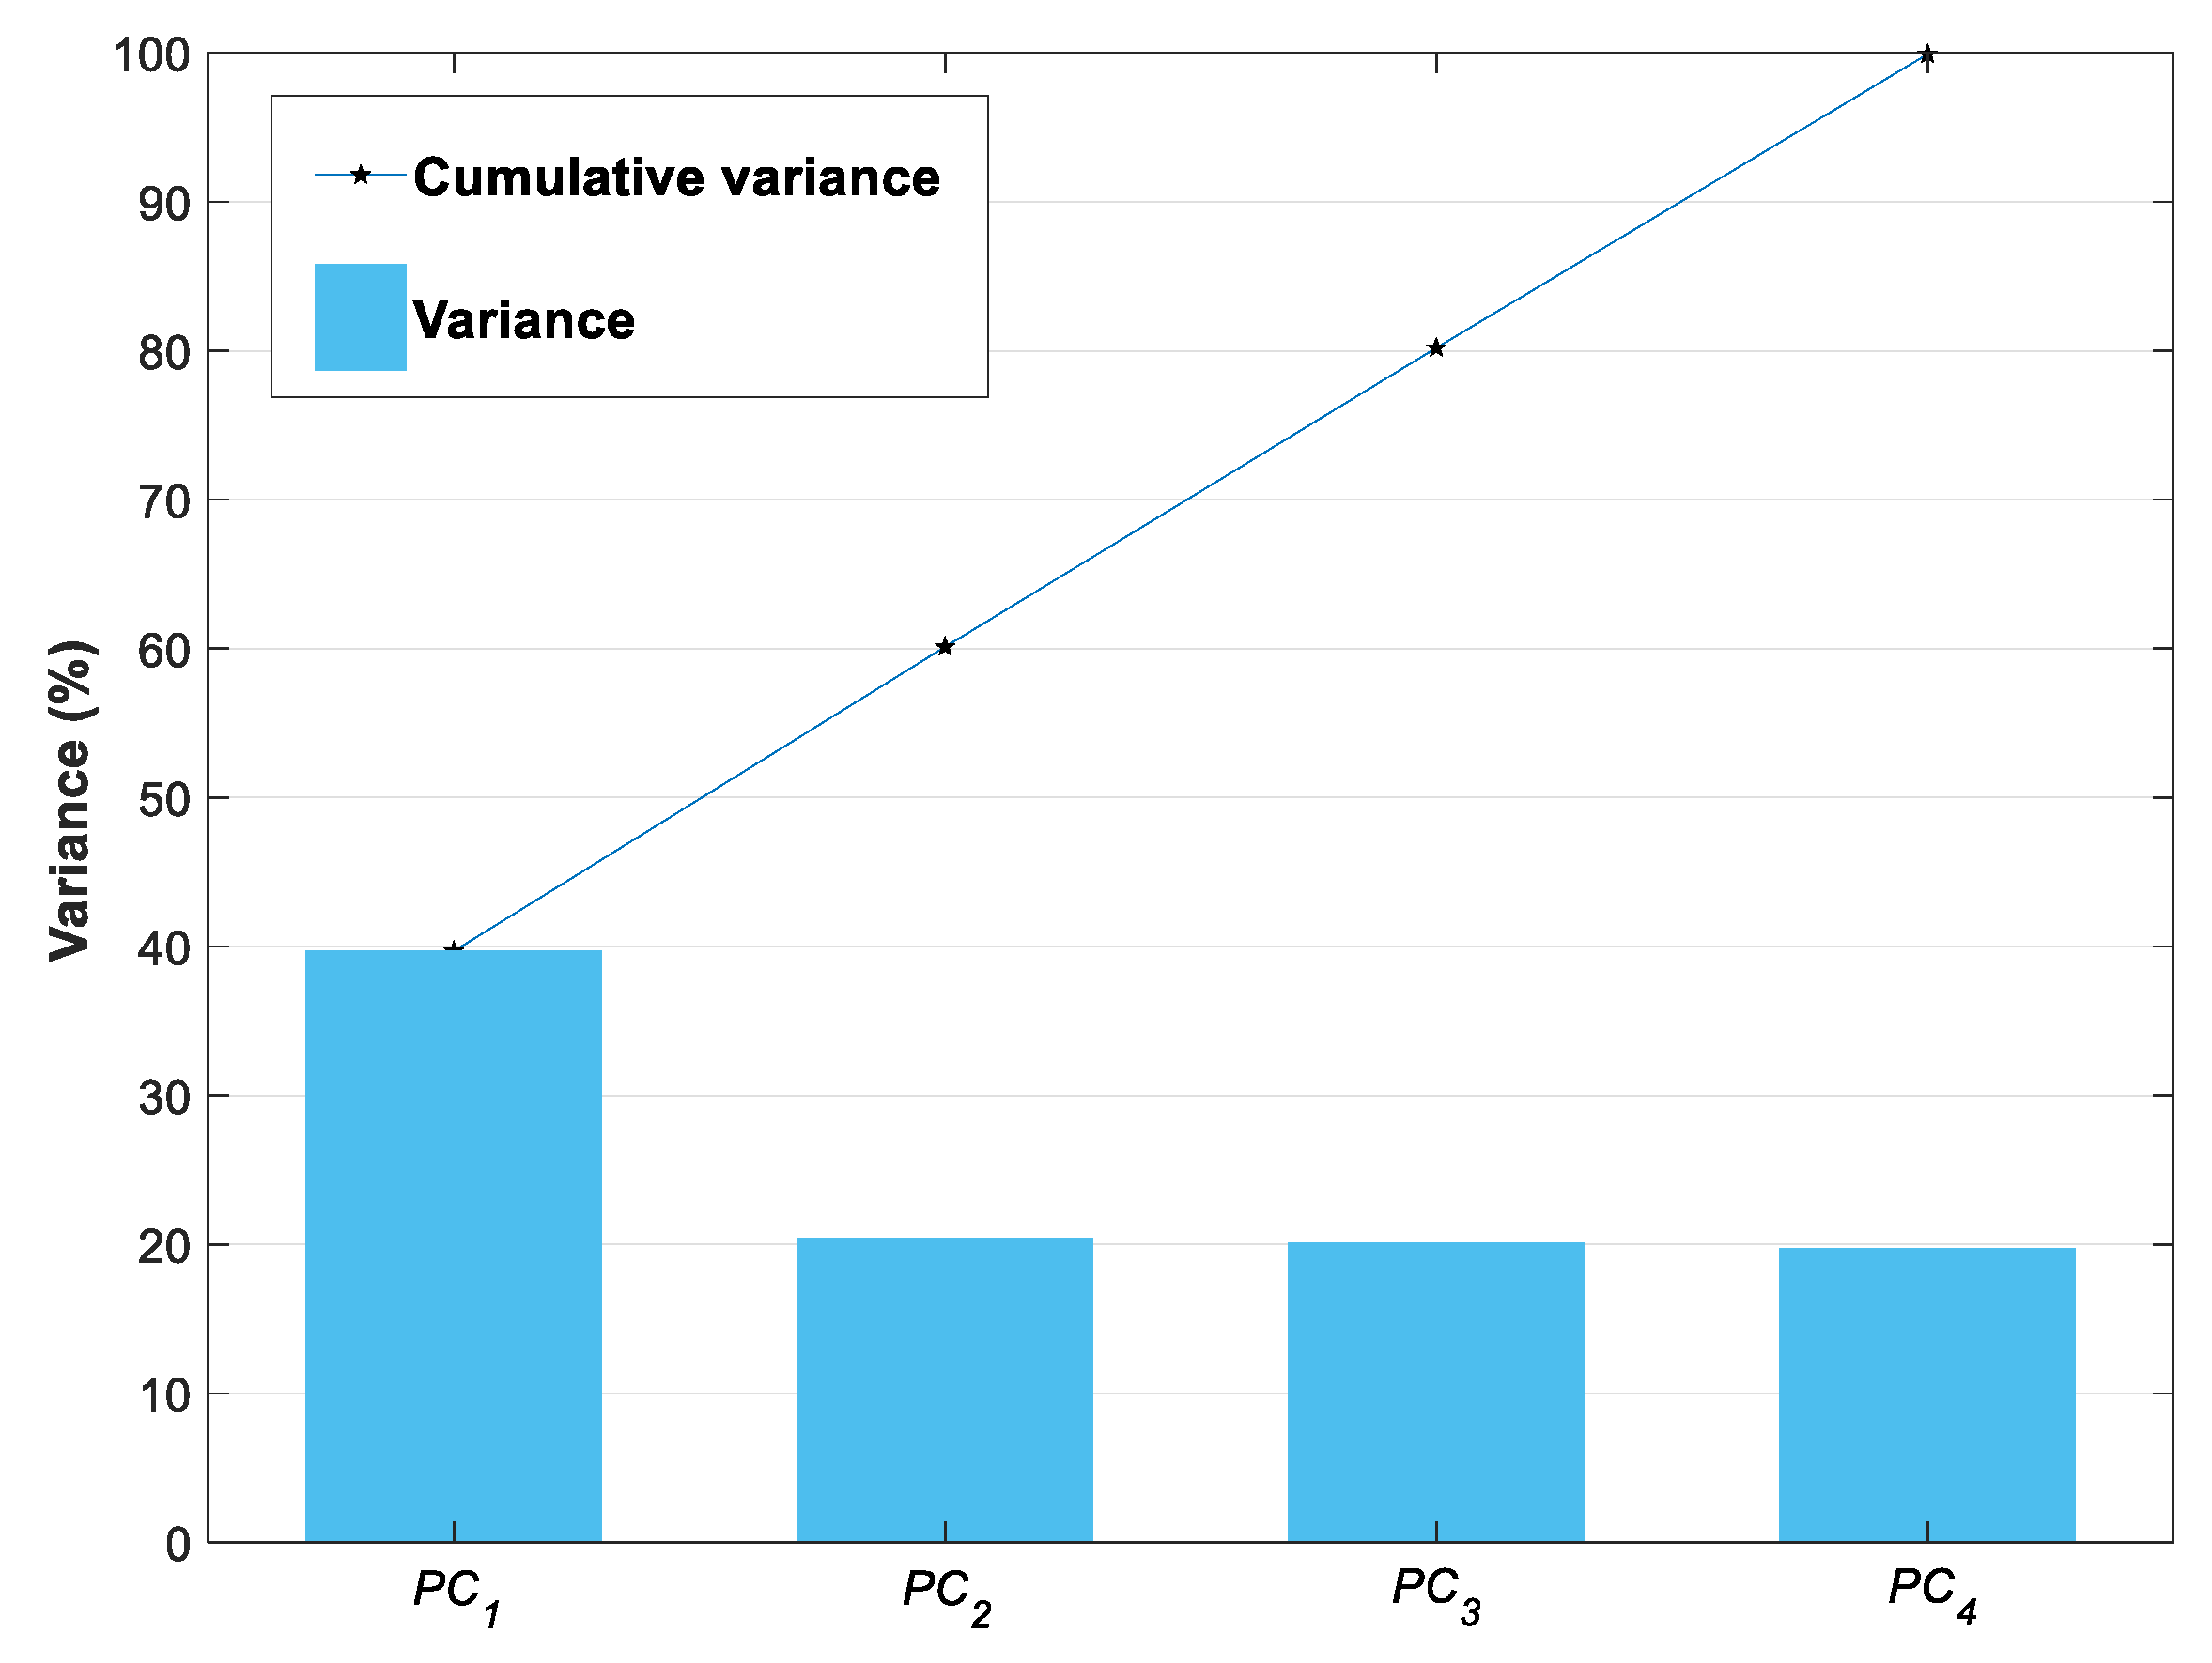
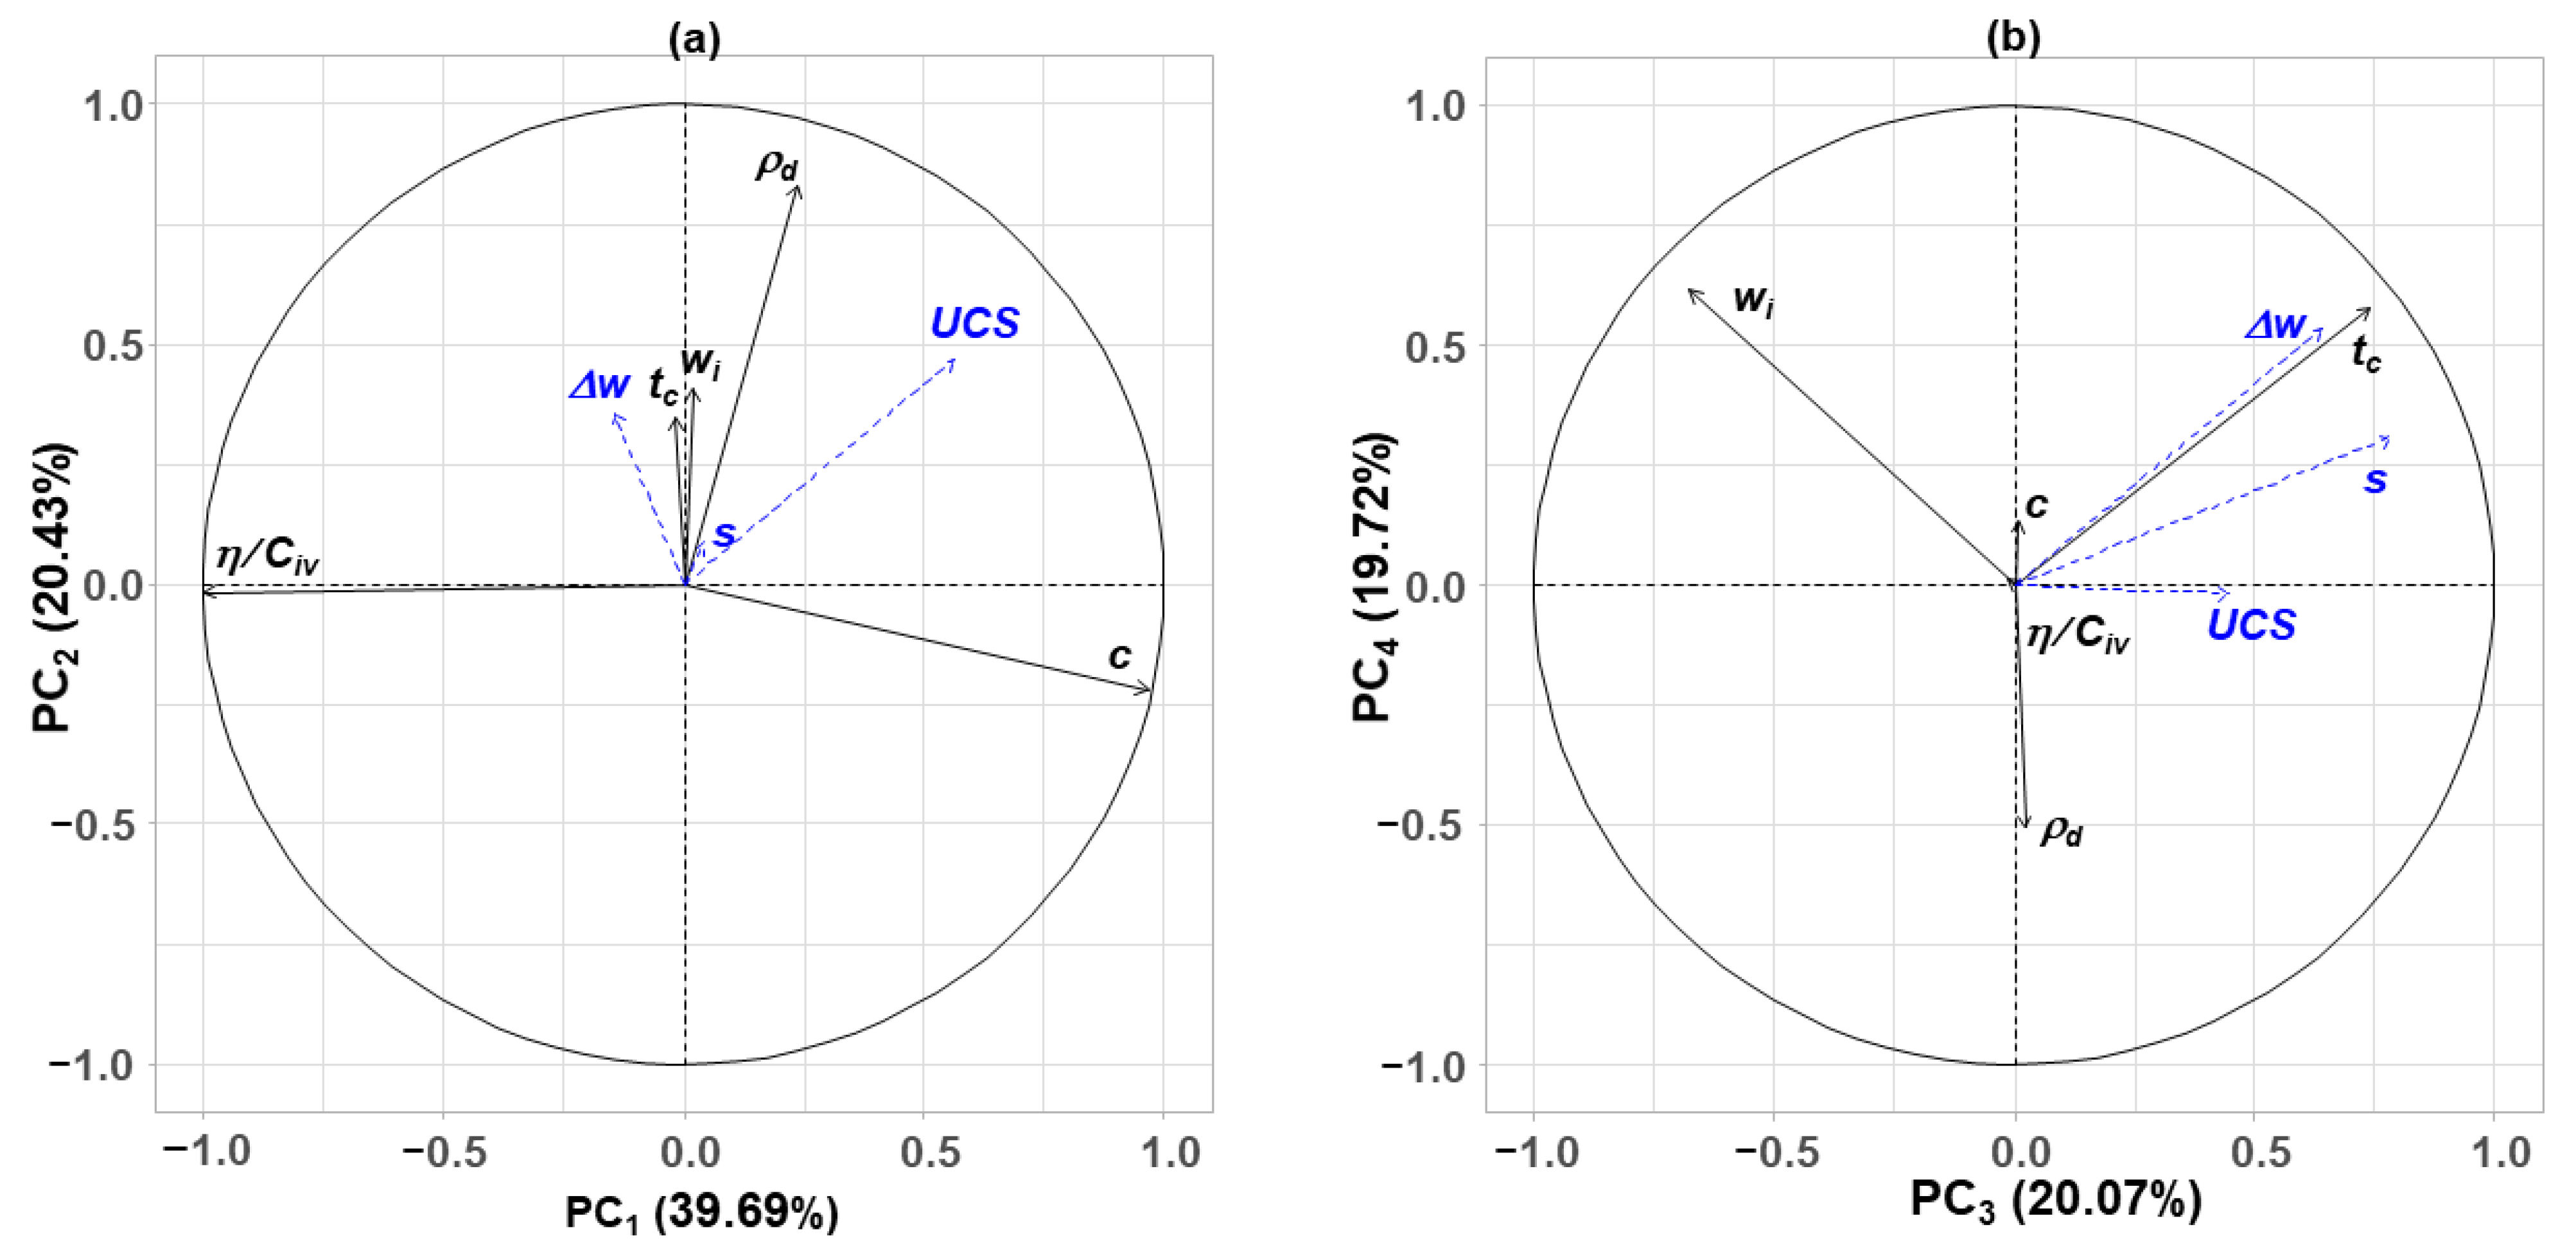
Figure 7 shows that the four most important PCs can explain 99.9% of the data variance and Figure 8 represents the considered variables plotted in the PCs’ planes. PC1 (39.7% of total variance) is highly correlated to the cement dosage c (opposite to void–cement ratio η/Civ). PC2 (20.4% of total variance) is mostly correlated with the initial dry density ρd and, to a lesser extent, to the initial water content wi and the curing time tc. The PC3 (20.1% of total variance) is related to wi and tc. The component PC4 (19.7% of total variance) combines mostly ρd and wi. The UCS appeared to be correlated to the four PCs, while s and Δw are more significantly correlated with PC3 and PC4.
Therefore, and as could be expected, the primary parameter that controls the strength of a cement-treated soil is the cement dosage. However, beyond this confirmation, the resulting UCS appeared to be a combination of initial moisture content and density, both variables having an equivalent weight. Regarding the post-curing parameters, the analysis also showed that the moisture content variation is correlated to PC3 and PC4, which combine mostly ρd and wi in addition to the curing time. This analysis showed that if the first component explains 40% of the total variance, the other three are almost equivalent in terms of contribution to data variance (around 20% each).
In the next paragraph, the four selected PCs are selected to be used as input variables to predict the post-curing parameters.
4.3. Artificial Neural Network Predictive Model
Artificial Neural Networks (ANN), which are inspired by the functioning of biological neurons, have been proven to be an efficient modelling approach that can handle nonlinear and complex system behavior. The network is made up of multiple neurons that are connected each to another in a serial manner. Each artificial neuron is a computing unit that receives a certain number of input parameters and computes a weighed linear combination of them to which a bias term can be added; the result is then passed into an activation function to calculate an output value that is transmitted to the next neuron. Typically, a neural network is organized in multiple layers that include an input layer containing as many neurons as input parameters, an output layer with as many neurons as output targets, and one or several intermediate hidden layers that make the data processing establish the right relations between the input and the output. The network hyperparameters (the weights of the different neural connections and the different bias terms) are adjusted during a training phase in which the system scans a set of training data that contains the effective outputs; this process is achieved using a specific learning algorithm. The training process passes through the dataset as many times as necessary to minimize the error gradient; each scan of the entire dataset is referred to as an epoch.
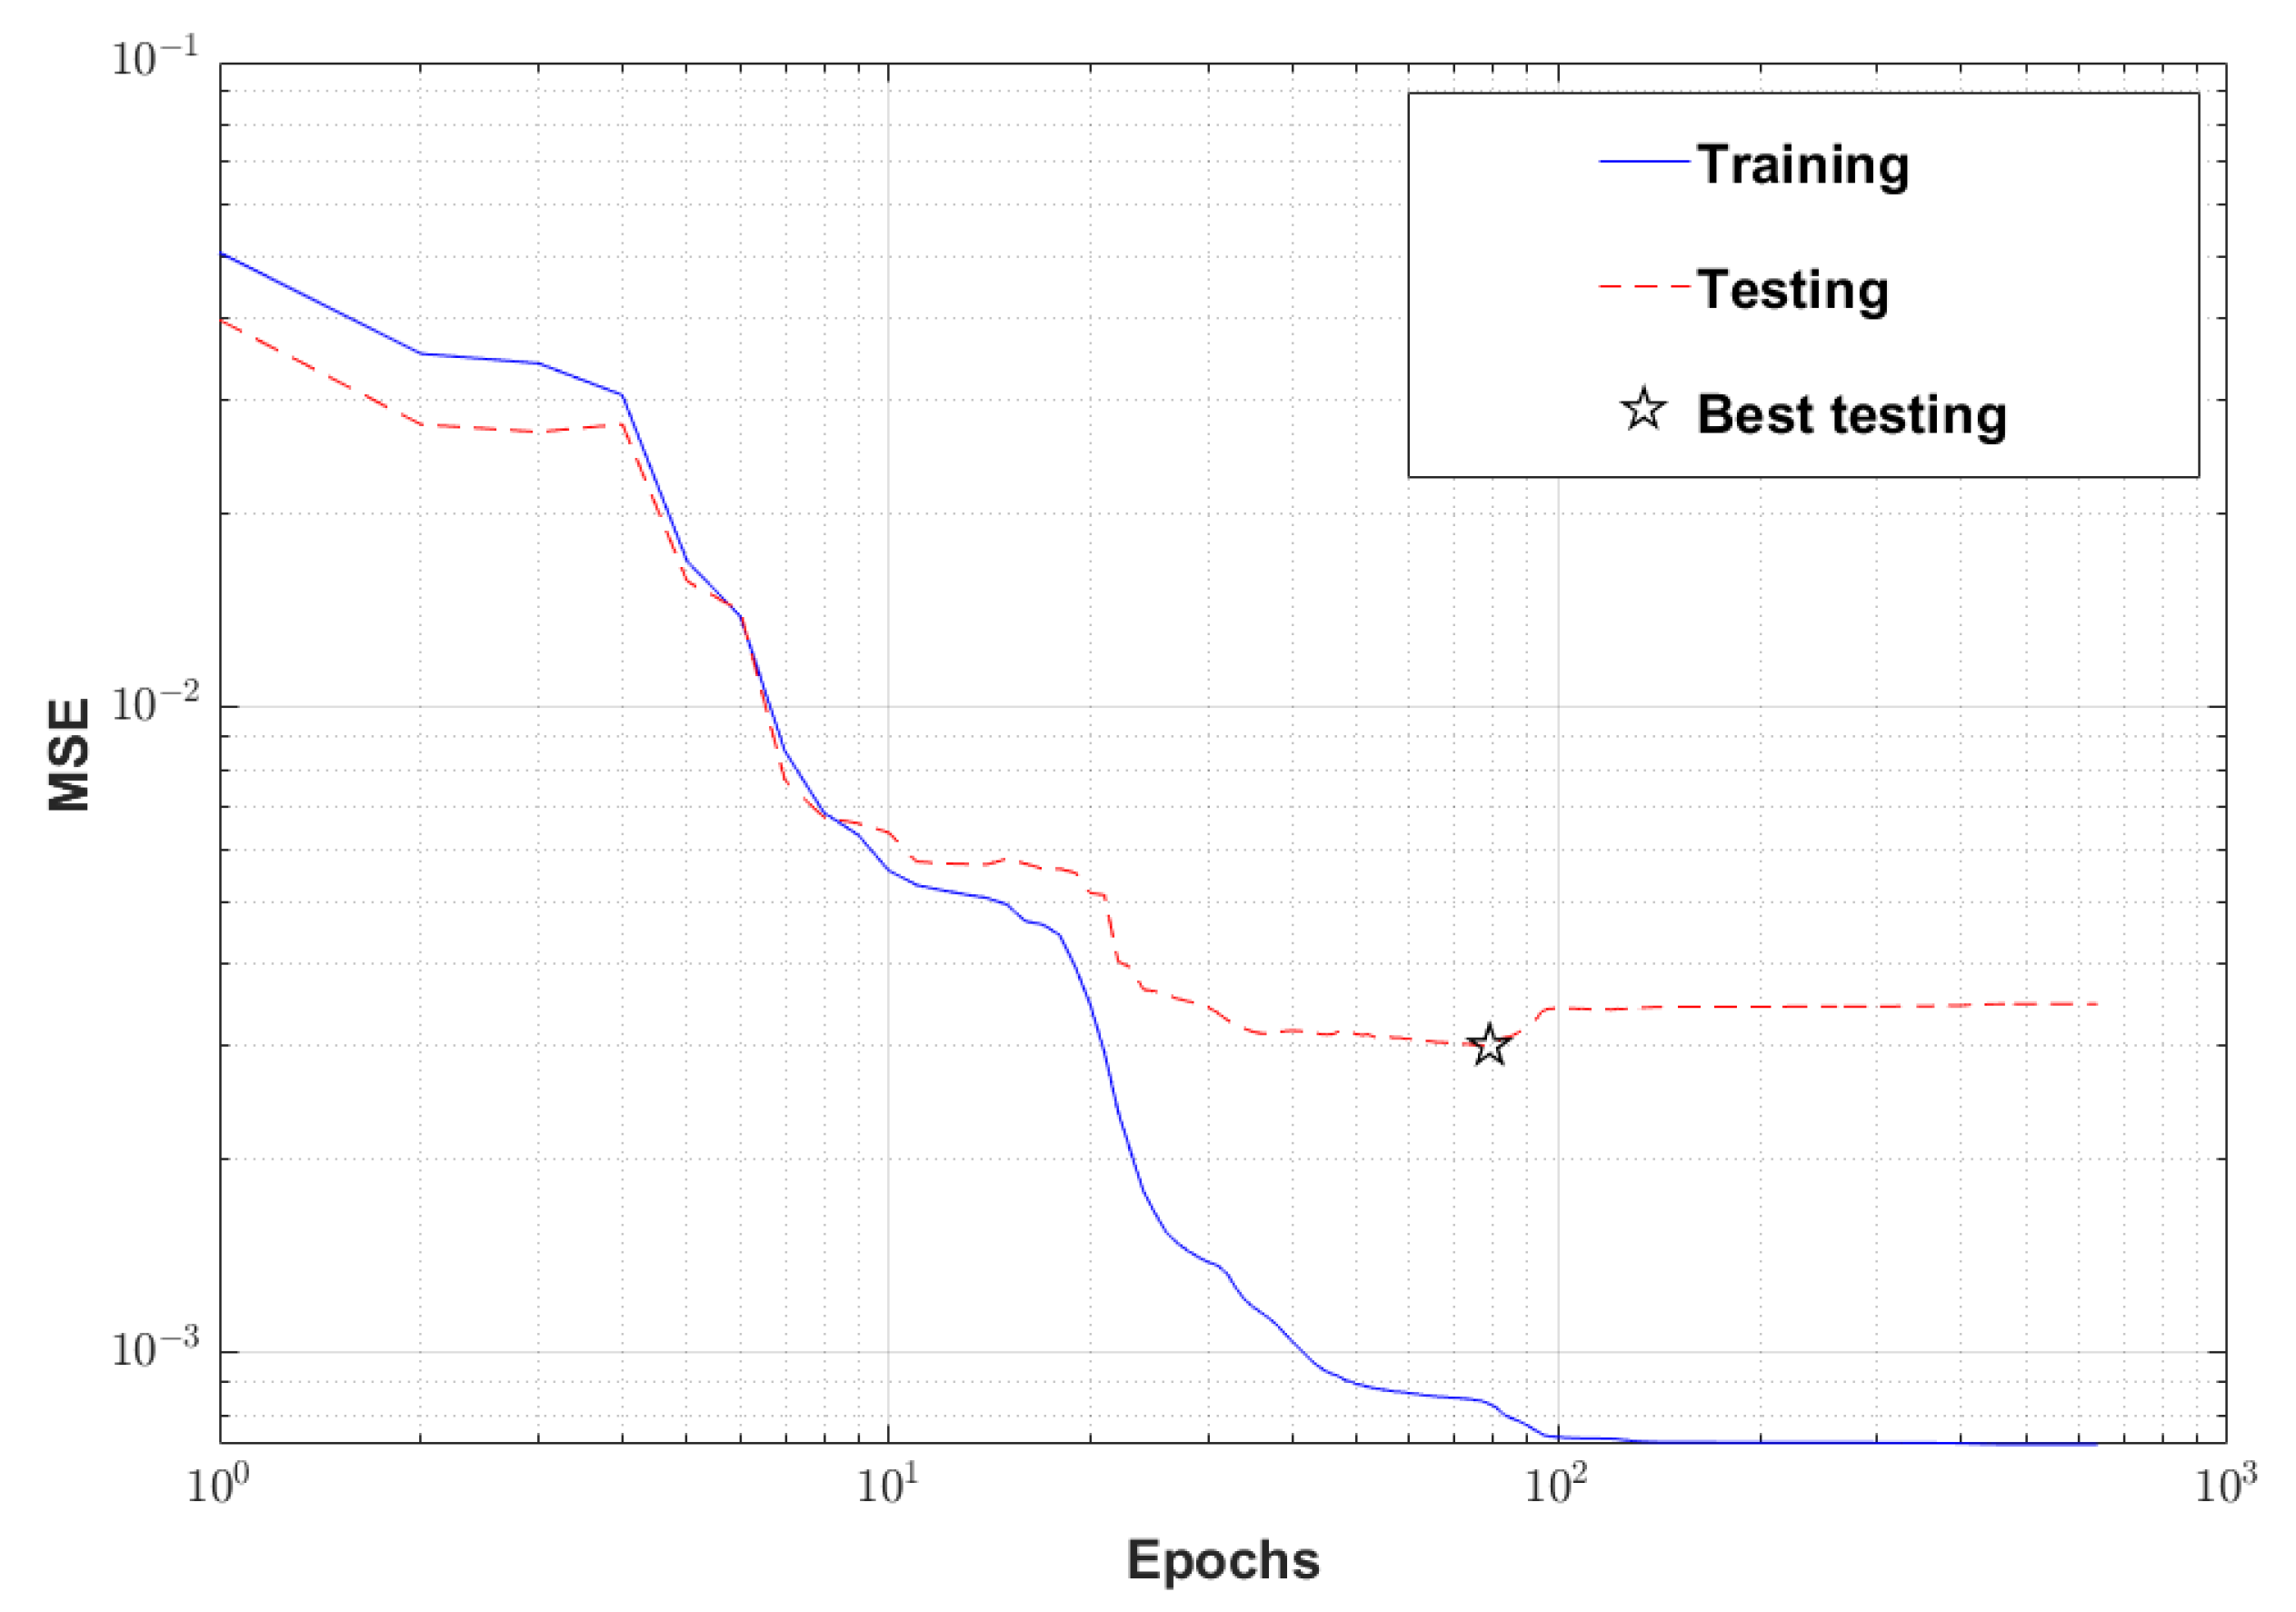
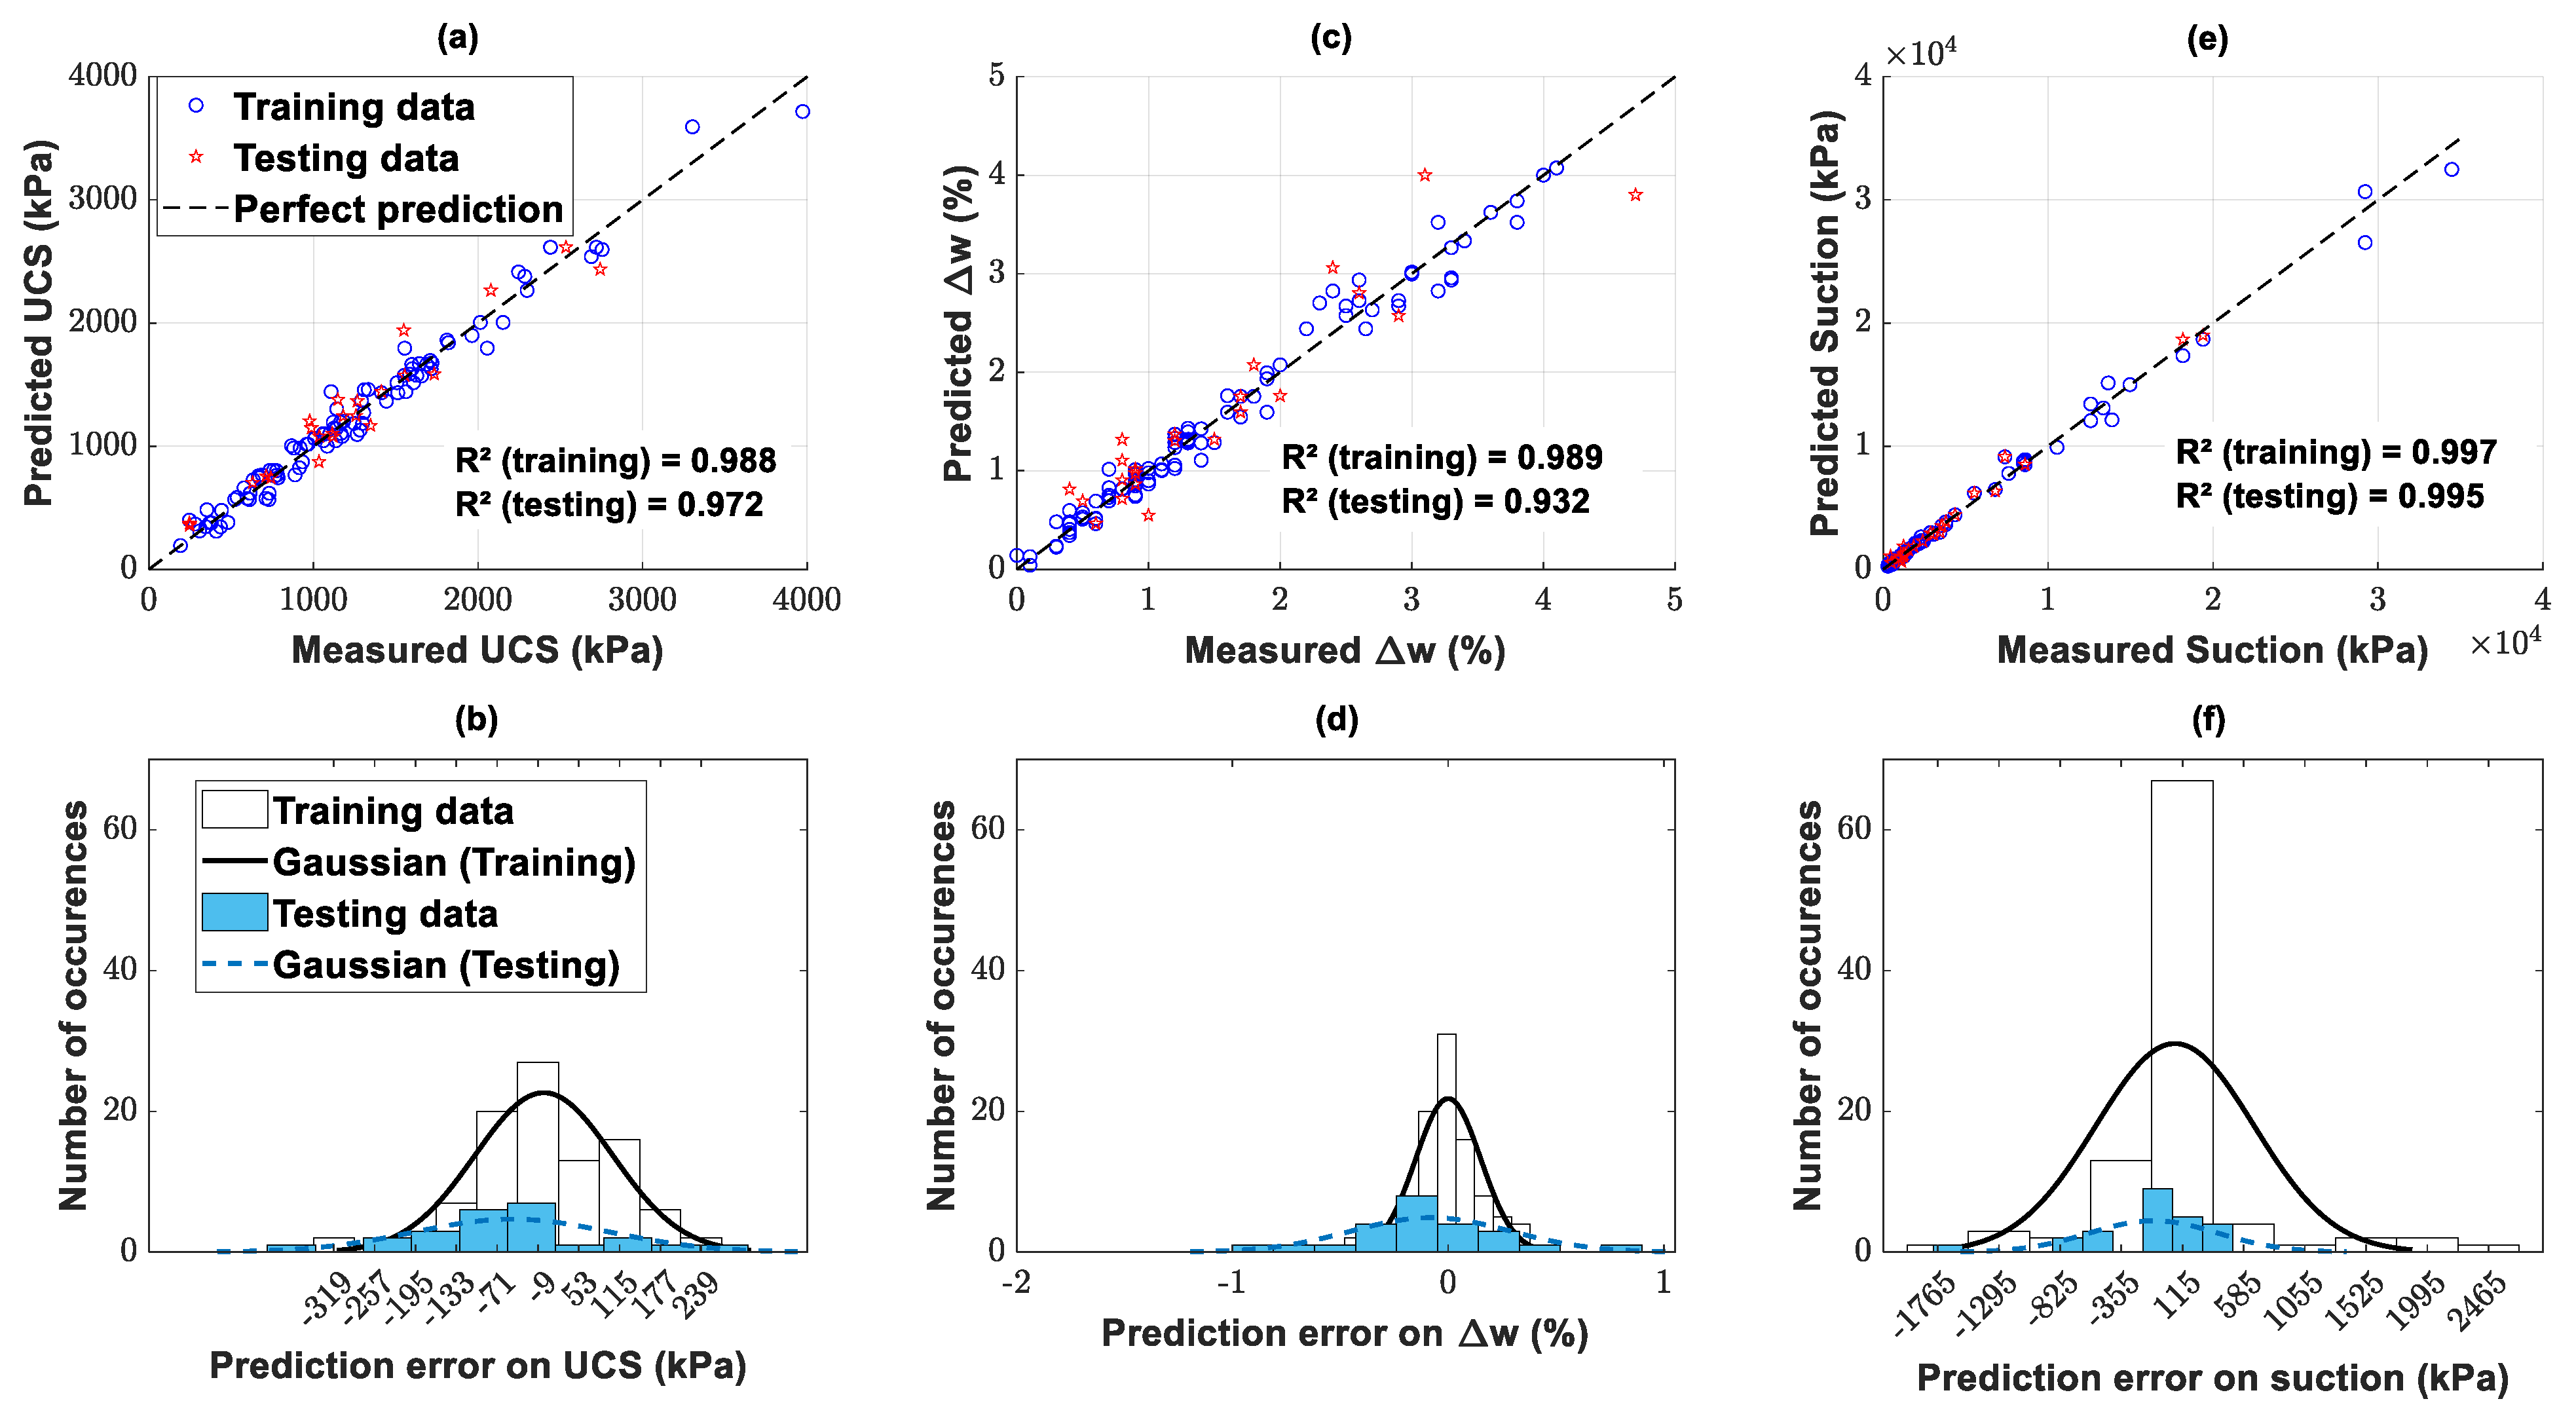
Here, one four-layer ANN was developed after several trials to adjust the network architecture. It contains an input layer with four neurons receiving the four PCs from the PCA, two hidden layers with ten and five neurons respectively, and one output layer consisting of three output neurons (respectively, for UCS, Δw and s). All the neurons use sigmoid (logistic) activation functions, and the nets were trained using the Bayesian regularization backpropagation algorithm [33]. The dataset was randomly partitioned into two subsets for training (80% of the data) and testing (20% of the data). The training subset is used for adjusting the ANN’s hyperparameters, while the testing subset does not affect the network but is used to check the model performance on unseen data. Figure 9 shows the progress of the Mean Square Error (MSE) during the training on both the training and testing subsets. To avoid overfitting the model to the training data, the training process was stopped when the MSE on testing data was minimized. Figure 10 plots the comparison between the measured post-curing parameters and the predicted ones. The overall performance of the models is excellent, with a coefficient of determination R2 systematically higher than 0.98 for the training data and higher than 0.93 for the testing data.
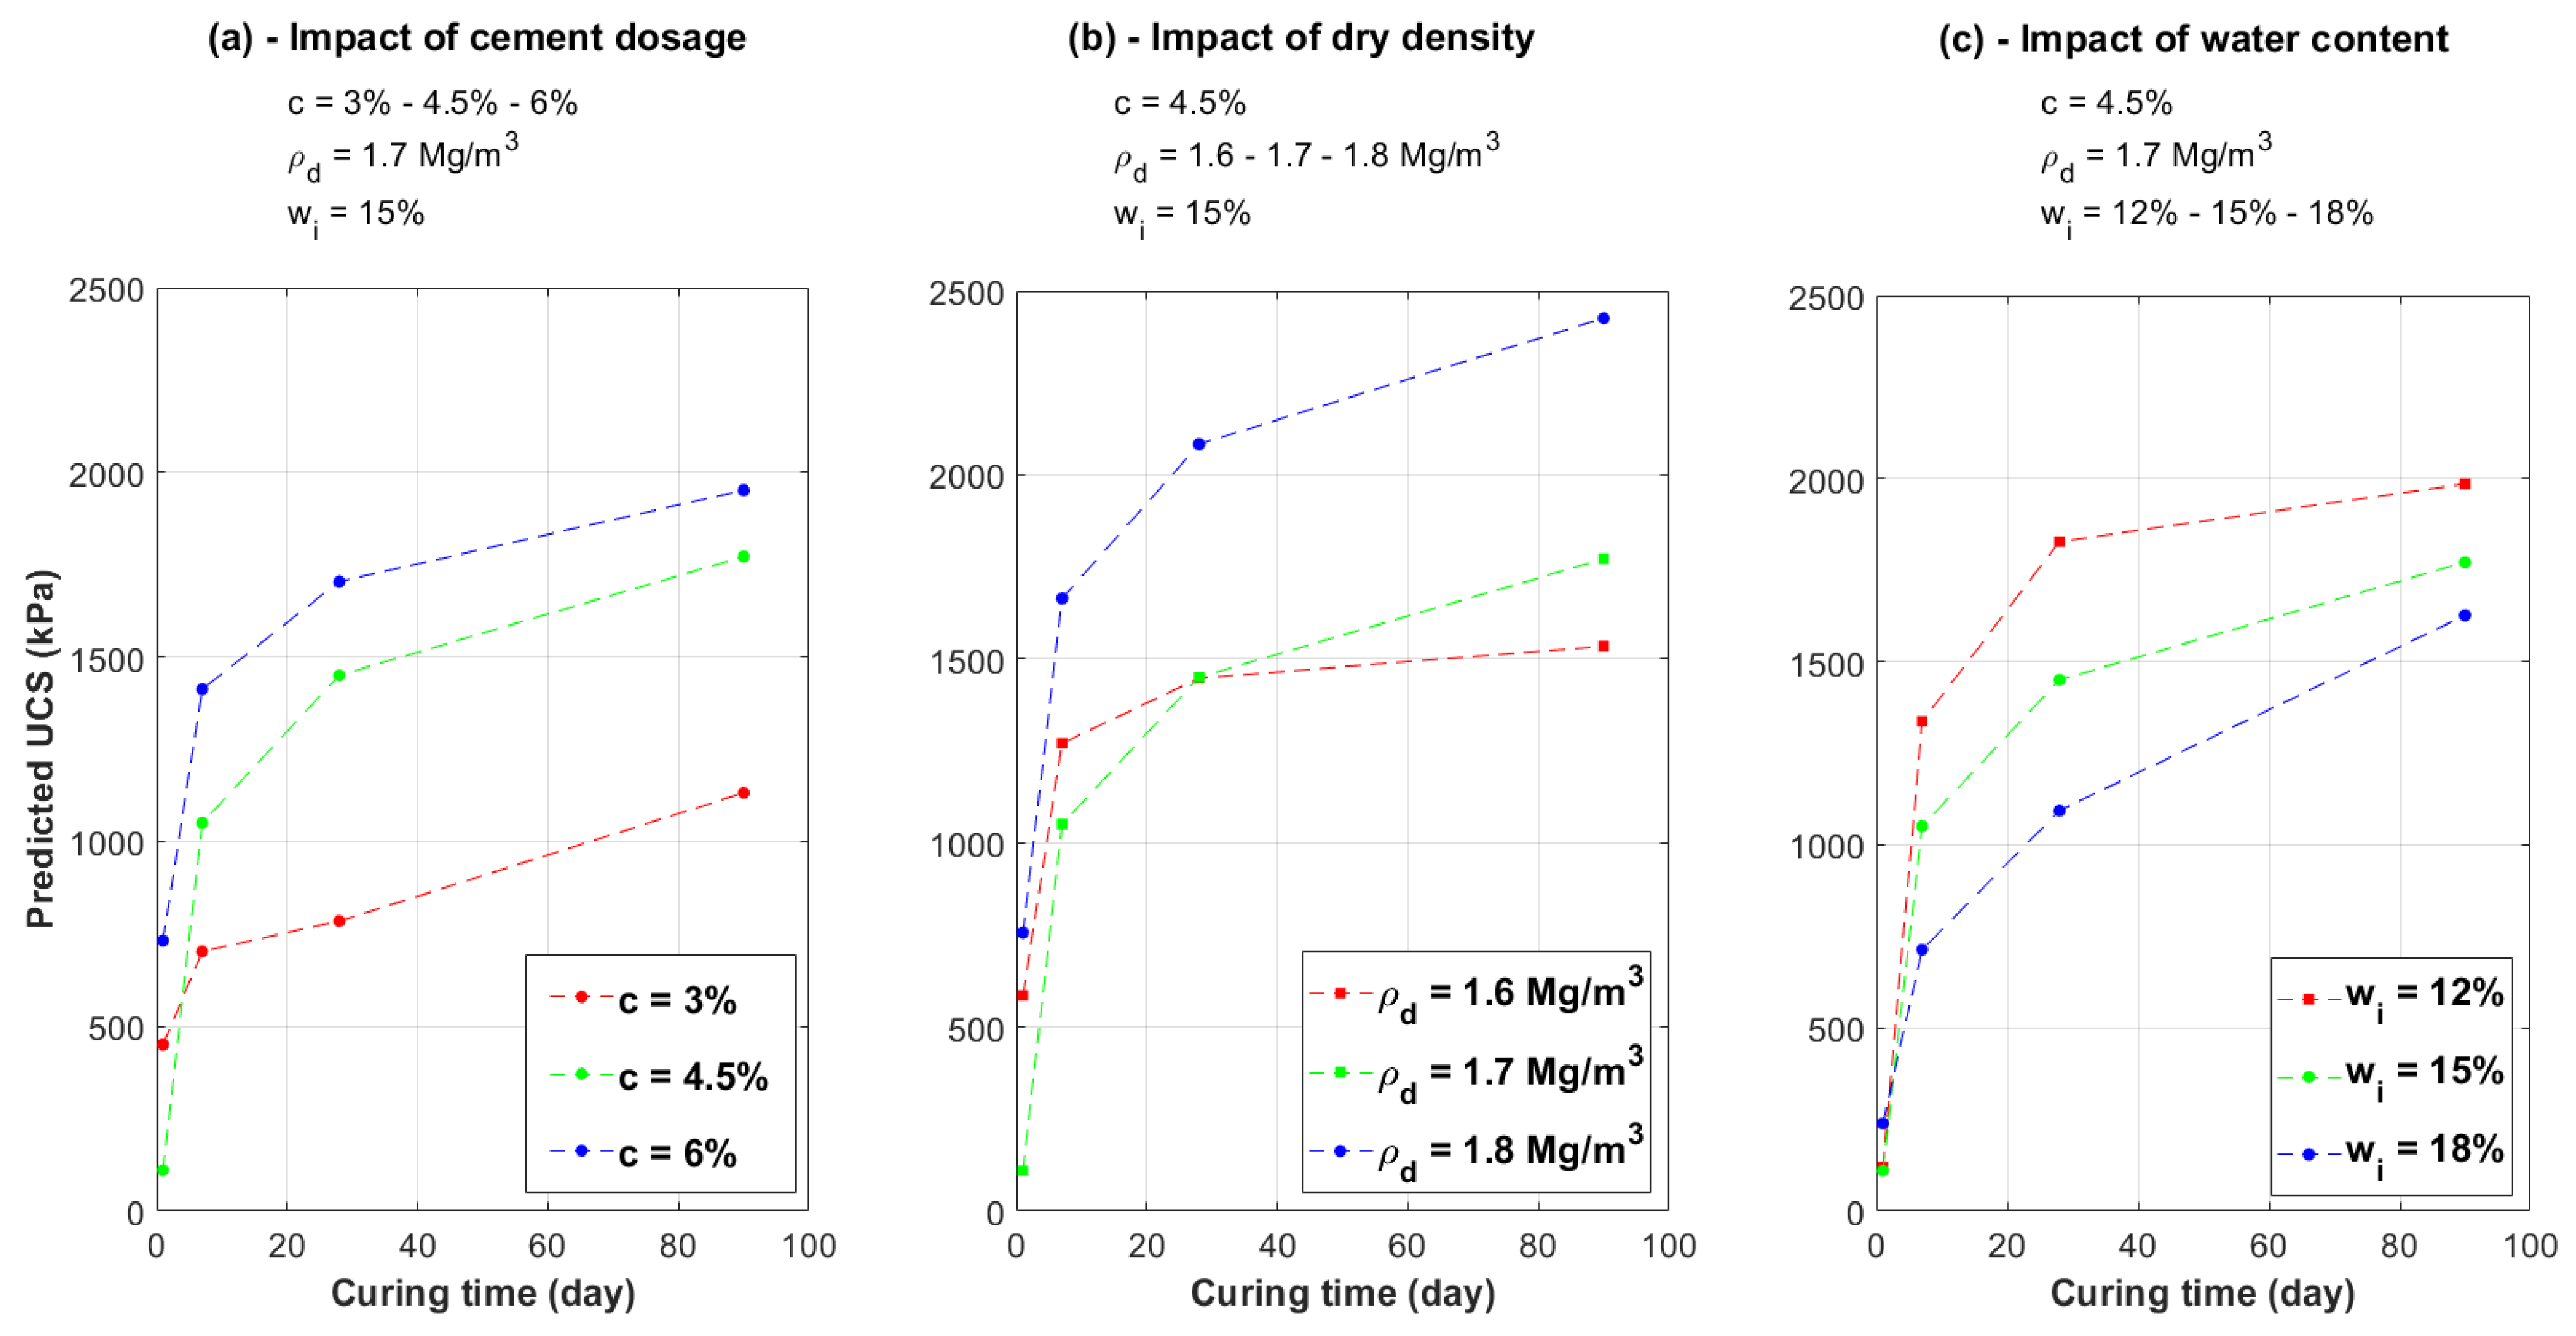
In order to check whether the ANN model captured the general tendencies in the data, predictions were made on a set of unseen data selected within the input parameter’s range covered by the training dataset. Figure 11 shows the obtained UCS predictions for curing times of 1, 7, 28 and 90 days. These results indicate that the model correctly captured the general trends in the dataset. Even if ANNs are “black box” machine learning models, in the sense that the variables’ interactions are not explained through explicit mathematical expressions, their results are interpretable and could help better understanding of the chemo-physical processes.
5. Conclusions
The main goal of this study was to investigate the relevant parameters that control strength increase with curing time in a cement-treated low plasticity clay. The initial state parameters (water content and dry density with variable compaction energy) were put under focus together with the binder dosage. An experimental campaign was performed to obtain a relevant set of data including a comprehensive analysis of the moisture content and suction variations as a function of the curing time. The curing was performed under sealed conditions (i.e., unsaturated state) to be in line with common practice in the case of road base and subbase materials. A statistics-based data analysis corroborated the observations and led to the definition of four new variables (principal components) as uncorrelated combinations of the initial ones. These principal components were then used to train an artificial neural network designed to predict mechanical performance and variation of water content, as well as suction evolution, with curing time. The study permitted us to highlight the following points.
- A significant correlation between moisture content variation and suction increase during the curing period was evidenced. Since the curing was performed under sealed conditions, this can be attributed to the cement hydration process. This results in water loss and an associated increase in the soil suction. Therefore, suction and moisture content variation can be considered as indicators of the setting reaction kinetics.
- Moisture content variation over the curing time appeared almost independent of the initial moisture content. This establishes that setting reactions in the range of the investigated moisture content are not impeded by the water availability in the system. Strength increase is thus not limited by the initial moisture content in the investigated range.
- The statistical analysis showed that, beyond the cement content, both dry density and initial moisture content cannot be considered separately to explain the resulting strength in the case of the studied silty soil. This can be explained by the fact that both parameters together control the initial soil microstructure.
- The results indicated that the chemical processes were controlled by a combination of the initial state parameters that are difficult to put into perspective when each parameter is varied separately. Furthermore, the void–cement ratio, a combined porosity–dosage parameter suggested in the literature, was shown to be relevant only when the dosage and the curing time are constant.
- To cope with the complexity of the parameters’ interactions, a statistics-based data analysis corroborated the observations and led to the definition of new variables (PCs) as uncorrelated combinations of the initial ones. The principal components were then used to train a multi-layer ANN designed to predict mechanical performance and variation of the water content, as well as suction evolution, with curing time. The regression performance of the predictive model was satisfactory and tests on unseen data provided tendencies that were consistent with the experimental dataset trends. This model was shown to be able to make reasonable predictions of the post-curing hydromechanical parameters based on the initial state parameters.
The developed model was built using a limited dataset with only one clayey soil. Its generalization to different soils/binders, different curing conditions and out-of-range initial states, binder dosage and/or curing times needs to be checked using an extended experimental dataset. The authors are presently conducting a complementary testing program to this purpose. The use of non-destructive experimental techniques for measuring suction and to indirectly assess the evolution of the elastic parameters of the cement-treated soil will also be considered.
Author Contributions
Conceptualization, A.A. and O.C.; methodology, A.A., G.R. and O.C.; software, A.A.; validation, A.A., G.R. and O.C.; formal analysis, A.A and O.C.; investigation, A.A. and O.C.; resources, O.C.; data curation, A.A. and O.C.; writing—original draft preparation, O.C.; writing—review and editing, A.A., G.R. and O.C.; visualization, A.A.; supervision, O.C.; project administration, O.C.; funding acquisition, O.C. All authors have read and agreed to the published version of the manuscript.
Funding
This work was partly funded by the European Union’s Horizon 2020 research and innovation program through the Marie Sklodowska-Curie grant agreement No 778120.
Data Availability Statement
The data presented in this study are available on request from the corresponding author.
Acknowledgments
The authors wish to acknowledge the contribution of Jacques Tisot for the samples’ preparation and technical testing aspects.
Conflicts of Interest
The authors solemnly declare that there are no known conflicts of interest associated with this publication and there has been no significant financial support for this work that could have influenced its outcome.
References
- Baghabra Al-Amoudi, O.S. Characterization and Chemical Stabilization of Al-Qurayyah Sabkha Soil. J. Mater. Civ. Eng. 2002, 14, 478–484. [Google Scholar] [CrossRef]
- Bahar, R.; Benazzoug, M.; Kenai, S. Performance of compacted cement-stabilised soil. Cem. Concr. Compos. 2004, 26, 811–820. [Google Scholar] [CrossRef]
- Consoli, N.C.; Foppa, D.; Festugato, L.; Heineck, K.S. Key Parameters for Strength Control of Artificially Cemented Soils. J. Geotech. Geoenvironmental Eng. 2007, 133, 197–205. [Google Scholar] [CrossRef]
- Sariosseiri, F.; Muhunthan, B. Effect of cement treatment on geotechnical properties of some Washington State soils. Eng. Geol. 2009, 104, 119–125. [Google Scholar] [CrossRef]
- Bellezza, I.; Fratalocchi, E. Effectiveness of cement on hydraulic conductivity of compacted soil–cement mixtures. Proc. Inst Civ. Eng. Ground Improv. 2007, 10, 77–90. [Google Scholar] [CrossRef]
- Estabragh, A.R.; Pereshkafti, M.R.S.; Parsaei, B.; Javadi, A.A. Stabilised expansive soil behaviour during wetting and drying. Int. J. Pavement Eng. 2013, 14, 418–427. [Google Scholar] [CrossRef]
- Mehenni, A.; Cuisinier, O.; Masrouri, F. Impact of Lime, Cement, and Clay Treatments on the Internal Erosion of Compacted Soils. J. Mater. Civ. Eng. 2016, 28, 04016071. [Google Scholar] [CrossRef]
- Jayasinghe, C.; Kamaladasa, N. Compressive strength characteristics of cement stabilized rammed earth walls. Constr. Build. Mater. 2007, 21, 1971–1976. [Google Scholar] [CrossRef]
- Lepakshi, R.; Venkatarama Reddy, B.V. Shear strength parameters and Mohr-Coulomb failure envelopes for cement stabilised rammed earth. Constr. Build. Mater. 2020, 249, 118708. [Google Scholar] [CrossRef]
- Tripura, D.D.; Gupta, S.; Debbarma, B.; Deep, R.S.S. Flexural strength and failure trend of bamboo and coir reinforced cement stabilized rammed earth wallettes. Constr. Build. Mater. 2020, 242, 117986. [Google Scholar] [CrossRef]
- Ho, L.S.; Nakarai, K.; Duc, M.; Le Kouby, A.; Maachi, A.; Sasaki, T. Analysis of strength development in cement-treated soils under different curing conditions through microstructural and chemical investigations. Constr. Build. Mater. 2018, 166, 634–646. [Google Scholar] [CrossRef]
- Zhu, W.; Zhang, C.L.; Chiu, A.C.F. Soil–Water Transfer Mechanism for Solidified Dredged Materials. J. Geotech. Geoenviron. Eng. 2007, 133, 588–598. [Google Scholar] [CrossRef]
- Ho, L.S.; Nakarai, K.; Ogawa, Y.; Sasaki, T.; Morioka, M. Strength development of cement-treated soils: Effects of water content, carbonation, and pozzolanic reaction under drying curing condition. Constr. Build. Mater. 2017, 134, 703–712. [Google Scholar] [CrossRef]
- Cuisinier, O.; Auriol, J.-C.; Le Borgne, T.; Deneele, D. Microstructure and hydraulic conductivity of a compacted lime-treated soil. Eng. Geol. 2011, 123, 187–193. [Google Scholar] [CrossRef]
- Russo, G.; Modoni, G. Fabric changes induced by lime addition on a compacted alluvial soil. Géotechnique Lett. 2013, 3, 93–97. [Google Scholar] [CrossRef]
- Soltani, A.; Deng, A.; Taheri, A.; Mirzababaei, M.; Jaksa, M.B. A dimensional description of the unconfined compressive strength of artificially cemented fine-grained soils. J. Adhes. Sci. Technol. 2020, 34, 1679–1703. [Google Scholar] [CrossRef]
- Williamson, S.; Cortes, D.D. Dimensional analysis of soil–cement mixture performance. Géotechnique Lett. 2014, 4, 33–38. [Google Scholar] [CrossRef]
- Jensen, O.M.; Hansen, P.F.; Lachowski, E.E.; Glasser, F.P. Clinker mineral hydration at reduced relative humidities. Cem. Concr. Res. 1999, 29, 1505–1512. [Google Scholar] [CrossRef]
- Jensen, O.M.; Hansen, P.F. Water-entrained cement-based materials. Cem. Concr. Res. 2001, 31, 647–654. [Google Scholar] [CrossRef]
- Horpibulsuk, S.; Miura, N.; Nagaraj, T.S. Clay–Water/Cement Ratio Identity for Cement Admixed Soft Clays. J. Geotech. Geoenviron. Eng. 2005, 131, 187–192. [Google Scholar] [CrossRef]
- Menaceur, H.; Cuisinier, O.; Masrouri, F.; Eslami, H. Impact of monotonic and cyclic suction variations on the thermal properties of a stabilized compacted silty soil. Transp. Geotech. 2021, 28, 100515. [Google Scholar] [CrossRef]
- Stoltz, G.; Cuisinier, O.; Masrouri, F. Weathering of a lime-treated clayey soil by drying and wetting cycles. Eng. Geol. 2014, 181, 281–289. [Google Scholar] [CrossRef]
- Morales Hernández, L.; Garzón Garzón, E.; Sánchez-Soto, P.J.; Romero Morales, E. Simultaneous biocementation and compaction of a soil to avoid the breakage of cementitious structures during the execution of earthwork constructions. Geotechnics 2023, 3, 224–253. [Google Scholar] [CrossRef]
- Kang, O.O.; Kim, Y.S.; Kang, J.G. Predictive strength model of cement-treated fine-grained soils using key parameters: Consideration of the total water/cement and soil/cement ratios. Case Stud. Constr. Mater. 2023, 18, e02069. [Google Scholar] [CrossRef]
- Zhang, C.; Zhu, Z.; Liu, F.; Yang, Y.; Wan, Y.; Huo, W.; Yang, L. Efficient machine learning compressive strength of cement stabilized soft soil. Constr. Build. Mater. 2023, 392, 131887. [Google Scholar] [CrossRef]
- ASTM. Practice for Classification of Soils for Engineering Purposes (Unified Soil Classification System); ASTM International: West Conshohocken, PA, USA, 2017. [Google Scholar]
- LCPC-SETRA. Réalisation des Remblais et des Couches de Forme: Guide Technique; LCPC and SETRA: Paris, France, 1992. [Google Scholar]
- Corté, J.-F.; Magnan, J.-P.; Guidoux, Y. Traitement des sols à la Chaux et/ou aux Liants Hydrauliques: Application à la Réalisation des Remblais et des Couches de Forme; LCPC and SETRA: Paris, France; Bagneux, France, 2000. [Google Scholar]
- ASTM. Test Method for Unconfined Compressive Strength of Cohesive Soil; ASTM International: West Conshohocken, PA, USA, 2000. [Google Scholar]
- Metergroup. Soil Water Potential Lab Instrumentation, METER Group, Inc. USA. 2017. Available online: www.metergroup.com (accessed on 17 May 2023).
- ASTM. Test Method of Measuring Humidity with Cooled-Surface Condensation (Dew-Point) Hygrometer; ASTM International: West Conshohocken, PA, USA, 2000. [Google Scholar]
- Lê, S.; Josse, J.; Husson, F. FactoMineR: An R Package for Multivariate Analysis. J. Stat. Softw. 2008, 25, 1–18. [Google Scholar] [CrossRef] [Green Version]
- Mathworks. Statistics and Machine Learning ToolboxTM User’s Guide 2020, Version 11.7; The MathWorks, Inc.: Natick, MA, USA, 2020. [Google Scholar]
Figure 1.
Compaction curves with the selected reference initial states.

Figure 2.
UCS versus curing time for the different reference initial states grouped by cement dosage for the different initial states (A1–A4,B1–B4).
Figure 2.
UCS versus curing time for the different reference initial states grouped by cement dosage for the different initial states (A1–A4,B1–B4).

Figure 3.
Suction versus curing time for the different reference initial states grouped by cement dosage for the different initial states (A1–A4,B1–B4).
Figure 3.
Suction versus curing time for the different reference initial states grouped by cement dosage for the different initial states (A1–A4,B1–B4).

Figure 4.
Variation of water content versus curing time for the different reference initial states grouped by cement dosage for the different initial states (A1–A4,B1–B4).
Figure 4.
Variation of water content versus curing time for the different reference initial states grouped by cement dosage for the different initial states (A1–A4,B1–B4).

Figure 5.
UCS versus η/Civ grouped by curing time.

Figure 6.
UCS versus suction for the different initial states grouped by cement dosage for the different initial states (A1–A4,B1–B4).
Figure 6.
UCS versus suction for the different initial states grouped by cement dosage for the different initial states (A1–A4,B1–B4).

Figure 7.
Data variance explained by the four first principal components.

Figure 8.
PCA results: variables’ plots in the PC1-PC2 (a) and PC3-PC4 (b) planes (dashed line for deactivated variables).
Figure 8.
PCA results: variables’ plots in the PC1-PC2 (a) and PC3-PC4 (b) planes (dashed line for deactivated variables).

Figure 9.
Progress of training based on mean square error of the ANN predictive model.

Figure 10.
Regression plots of the ANN predictive model with the error distributions for UCS (a,b), ∆w (c,d) and Suction (e,f).
Figure 10.
Regression plots of the ANN predictive model with the error distributions for UCS (a,b), ∆w (c,d) and Suction (e,f).

Figure 11.
ANN model predictions of UCS different curing times on unseen data.


Table 1.
Identification characteristics of the soil employed in this study.
| Liquid limit | 28.5% |
| Plasticity index | 8.0% |
| Passing 63 μm-sieve | 99.2% |
| Clay content (<2 μm) | 6.0% |
| Specific gravity Gs | 2.64 |
Table 2.
Summary of the investigated parameters in the experimental program and calculated parameters investigated as possibly relevant predictors.
Table 2.
Summary of the investigated parameters in the experimental program and calculated parameters investigated as possibly relevant predictors.
| Preparation/Curing Parameters | Values |
|---|---|
| Dry density (Mg/m3) | 1.6–1.7–1.77–1.87 |
| Initial water content wi (%) | 11–12.5–14.4–16.5–18 |
| Cement content (%) | 3–6 |
| Curing time (day) | 0–7–28–90 |
| Post-curing measured parameters UCS (kPa) Suction s (kPa) Final water content wf (%) | |
| Calculated parameters Variation of water content Δw (%) Void/cement ratio η/Civ |
Table 3.
Correlation matrix of the dataset (correlations with the post-curing parameters are highlighted).
Table 3.
Correlation matrix of the dataset (correlations with the post-curing parameters are highlighted).
| wi | ρd | c | tc | η/Civ | s | Δw | UCS | |
|---|---|---|---|---|---|---|---|---|
| wi | 1.00 | 0.01 | 0.01 | 0.00 | −0.01 | −0.30 | 0.04 | −0.11 |
| ρd | 1.00 | −0.02 | 0.01 | −0.25 | −0.06 | 0.00 | 0.54 | |
| c | 1.00 | −0.01 | −0.96 | 0.07 | −0.15 | 0.45 | ||
| tc | 1.00 | 0.01 | 0.79 | 0.91 | 0.47 | |||
| η/Civ | 1.00 | −0.05 | 0.14 | −0.57 | ||||
| s | 1.00 | 0.72 | 0.37 | |||||
| Δw | 1.00 | 0.38 |
Disclaimer/Publisher’s Note: The statements, opinions and data contained in all publications are solely those of the individual author(s) and contributor(s) and not of MDPI and/or the editor(s). MDPI and/or the editor(s) disclaim responsibility for any injury to people or property resulting from any ideas, methods, instructions or products referred to in the content. |
© 2023 by the authors. Licensee MDPI, Basel, Switzerland. This article is an open access article distributed under the terms and conditions of the Creative Commons Attribution (CC BY) license (https://creativecommons.org/licenses/by/4.0/).
Share and Cite
MDPI and ACS Style
Abdallah, A.; Russo, G.; Cuisinier, O. Statistical and Predictive Analyses of the Strength Development of a Cement-Treated Clayey Soil. Geotechnics 2023, 3, 465-479. https://doi.org/10.3390/geotechnics3020026
AMA Style
Abdallah A, Russo G, Cuisinier O. Statistical and Predictive Analyses of the Strength Development of a Cement-Treated Clayey Soil. Geotechnics. 2023; 3(2):465-479. https://doi.org/10.3390/geotechnics3020026
Chicago/Turabian StyleAbdallah, Adel, Giacomo Russo, and Olivier Cuisinier. 2023. "Statistical and Predictive Analyses of the Strength Development of a Cement-Treated Clayey Soil" Geotechnics 3, no. 2: 465-479. https://doi.org/10.3390/geotechnics3020026