Article

Spatio-Temporal Relationships between Fumarolic Activity, Hydrothermal Fluid Circulation and Geophysical Signals at an Arc Volcano in Degassing Unrest: La Soufrière of Guadeloupe (French West Indies)

by
Giancarlo Tamburello
1,2,*,
Séverine Moune
2,3,4,
Patrick Allard
2,5,
Swetha Venugopal
3,6,
Vincent Robert
2,4,
Marina Rosas-Carbajal
2,
Sébastien Deroussi
2,4,
Gaëtan-Thierry Kitou
2,4,
Tristan Didier
2,4,
Jean-Christophe Komorowski
2,
François Beauducel
2,7,
Jean-Bernard De Chabalier
2,
Arnaud Le Marchand
2,
Anne Le Friant
2,
Magali Bonifacie
2,4,
Céline Dessert
2,4 and
Roberto Moretti
2,4
1
Istituto Nazionale di Geofisica e Vulcanologia, sezione di Bologna, 40128 Bologna, Italy
2
Institut de Physique du Globe de Paris, Université de Paris, UMR7154 CNRS, 75005 Paris, France
3
Laboratoire Magmas Volcans-OPGC, Université Clermont Auvergne, 63170 Clermont Ferrand, France
4
Observatoire Volcanologique et Sismologique de Guadeloupe, Institut de Physique du Globe de Paris, 97113 Gourbeyre, France
5
Istituto Nazionale di Geofisica e Vulcanologia, sezione di Catania, 95125 Catania, Italy
6
Department of Earth Sciences, Simon Fraser University, 8888 University Drive, Vancouver, BC V5A 1S6, Canada
7
Institut des Sciences de la Terre—Institut de Recherche pour le Développement—BPPTKG—PVMBG Badan Geologi, Yogyakarta 55166, Indonesia
*
Author to whom correspondence should be addressed.
Geosciences 2019, 9(11), 480; https://doi.org/10.3390/geosciences9110480
Submission received: 1 October 2019 / Revised: 6 November 2019 / Accepted: 9 November 2019 / Published: 15 November 2019
(This article belongs to the Special Issue Exploring and Modeling the Magma-Hydrothermal Regime)

Abstract

:
Over the past two decades, La Soufrière volcano in Guadeloupe has displayed a growing degassing unrest whose actual source mechanism still remains unclear. Based on new measurements of the chemistry and mass flux of fumarolic gas emissions from the volcano, here we reveal spatio-temporal variations in the degassing features that closely relate to the 3D underground circulation of fumarolic fluids, as imaged by electrical resistivity tomography, and to geodetic-seismic signals recorded over the past two decades. Discrete monthly surveys of gas plumes from the various vents on La Soufrière lava dome, performed with portable MultiGAS analyzers, reveal important differences in the chemical proportions and fluxes of H2O, CO2, H2S, SO2 and H2, which depend on the vent location with respect to the underground circulation of fluids. In particular, the main central vents, though directly connected to the volcano conduit and preferentially surveyed in past decades, display much higher CO2/SO2 and H2S/SO2 ratios than peripheral gas emissions, reflecting greater SO2 scrubbing in the boiling hydrothermal water at 80–100 m depth. Gas fluxes demonstrate an increased bulk degassing of the volcano over the past 10 years, but also a recent spatial shift in fumarolic degassing intensity from the center of the lava dome towards its SE–NE sector and the Breislack fracture. Such a spatial shift is in agreement with both extensometric and seismic evidence of fault widening in this sector due to slow gravitational sliding of the southern dome sector. Our study thus provides an improved framework to monitor and interpret the evolution of gas emissions from La Soufrière in the future and to better forecast hazards from this dangerous andesitic volcano.

1. Introduction

Active arc volcanoes that erupt with evolved magmas commonly display long periods (decades to centuries) of dormancy between their magmatic eruptions. However, these quiescent periods are often characterized by hydrothermal manifestations (fumaroles, boiling pools, thermal springs, etc.) that attest to a persistent heat and gas supply from a magmatic source at depth. While interacting with shallow groundwater and host rocks, this continued magmatic supply sustains a hydrothermal system (e.g., [1])) and generates acid hydrothermal fluids that promote intense alteration of the host rocks. This could also lead to mechanical weakening of the volcanic edifices and their potential collapse. Moreover, an increasing gas supply from depth or/and gradual self-sealing of a constantly fed hydrothermal system are processes that can lead to shallow overpressurization followed by violent eruption of a closed-conduit volcano (e.g., [1,2,3]). As recorded by the cases of Ontake in Japan in 2014 [4] and Tongariro in New Zealand in 2012 [5], even purely phreatic eruptions at volcanoes displaying prolonged unrest can involve major hazards and risks owing to their sudden and often unpredictable onset [6]. Therefore, monitoring the spatial distribution and temporal evolution of hydrothermal manifestations at such volcanoes, in combination with geophysical surveys, is crucial to detect and interpret precursors of either non-magmatic explosive activity or, instead, a magmatic eruption.
Compositional changes in fumarolic exhalations have in fact been recognized as signals of unrest or even precursors of several eruptions at dormant volcanoes (e.g., [2,7,8,9,10]. However, unequivocal interpretation of these chemical changes is often challenging, owing to the complexity of chemical reactions and buffering effects involved in water-gas-rock interactions (e.g., [1]). Additional insight into the significance of chemical changes can be obtained by quantifying the emission rate of fumarolic gases (e.g., [11,12]). Nevertheless, flux measurements of fumarolic manifestations are not straightforward, for two main reasons: (i) hydrothermal gas emissions are often too weak to generate a sizable volcanic plume and, hence, to allow gas flux quantification with remote sensing or airborne measuring tools; and (ii) low-temperature (<100–300 °C) fumarolic gases generally contain little SO2, which impedes the use of UV sensing tools commonly applied to quantify SO2-rich gas emissions from hotter vents or erupting volcanoes (e.g., [13]). The prevalent sulfur species in hydrothermal gas emissions is usually H2S (e.g., [8]) whose remote detection still remains challenging (e.g., [14]). Alternative approaches targeting the fumarolic fluxes of H2O and CO2 were tested with success on a few volcanic sites: these include ground-based eddy gas profiling [15], CO2 plume imaging with tunable diode laser spectroscopy [16] or differential absorption lidar [17]. However, these methods are relatively difficult to carry out in the field, because they require gentle volcano topography, easy access to fumarolic fields and favorable weather conditions. Moreover, the high abundances of H2O and CO2 in the atmospheric background require substantial volcanic enrichments of these two components to allow reliable quantification.
Recently, Allard et al. [12] demonstrated that the flux of H2S-bearing fumarolic gases at dormant volcanoes in hydrothermal activity can reliably be determined from in situ gas plume concentration profiles measured with a portable Multi-component Gas Analysing System (MultiGAS). MultiGAS is a light and compact device composed of an infrared spectrometer and electrochemical sensors (plus air temperature, atmospheric pressure, and relative humidity sensors) that allows simultaneous and analysis of H2O, CO2, SO2, H2S and H2 mixing ratios in air-diluted volcanic plumes (e.g., [18,19,20]). The MultiGAS can be used for discrete measurements but also for permanent gas surveys such are currently operated on several volcanoes worldwide (e.g., [2,21]).
Using a MultiGAS instrument, Allard et al. [12] determined the mass output of fumarolic gas emissions from La Soufrière volcano in Guadeloupe, an andesitic volcanic dome of the Lesser Antilles arc that threatens several tens of thousands of people and has raised recent concern due to increasing degassing unrest over the past two decades ([22] and references therein). By coupling the measured gas composition to the horizontal and vertical distribution of H2S in the plume cross-sections and then scaling to the wind speed measured at the vent, Allard et al. [12] found that the total gas flux from La Soufrière had increased by a factor of ~3 in 2012 compared to a first measurement made in 2006 (using one simple H2S electrochemical sensor). Because isotopic tracers demonstrate a persistent supply of magma-derived volatiles and heat to La Soufrière hydrothermal system (e.g., [12,23] and references therein; [24,25,26,27]), such an increase in the gas discharge, together with other phenomena recorded by the local volcano Observatory [28], have raised concerns about the evolution of current unrest and, therefore, deserves further investigations.
Here we report on new and more extensive measurements of the gas compositions and fluxes of fumarolic emissions from the La Soufrière volcano in 2016–2017, while degassing unrest at its summit displayed continued expansion of thermal (>50 °C) ground areas, new fumaroles and the reactivation of several other vents since July 2014. For these measurements, we used a novel instrumental geometry consisting of an array of three MultiGAS devices operated simultaneously at various heights (1 to 3 m) above the ground. This instrumental array allowed us to accurately determine the fumarolic gases emitted from the different active vents of La Soufrière lava dome, as well as gas emission rates from the three major degassing vents. Moreover, in addition to be compared with previous gas data, our results are interpreted in light of three complementary information: (i) recent electrical conductivity imaging of the underground circulation of hydrothermal fluids inside the lava dome [29], (ii) ground deformation of the lava dome as revealed by extensometric survey of its main fractures since 1995 [22,30], and (iii) seismic data recorded by the Observatoire Volcanologique et Sismologique de Guadeloupe (OSVG-IPGP). With such an approach, our study provides unprecedented insight into the spatio-temporal relationships between the evolution of surface activity (fumarolic degassing and the propagation of ground thermal anomalies) and underground phenomena (hydrothermal circulation, near-field ground deformation and seismicity) at La Soufrière. Thus, we define an improved framework to interpret temporal changes in gas emissions from the volcano during its present unrest phase and in the future, which also bears broader implications for the monitoring of dormant active volcanoes in hydrothermal unrest elsewhere.

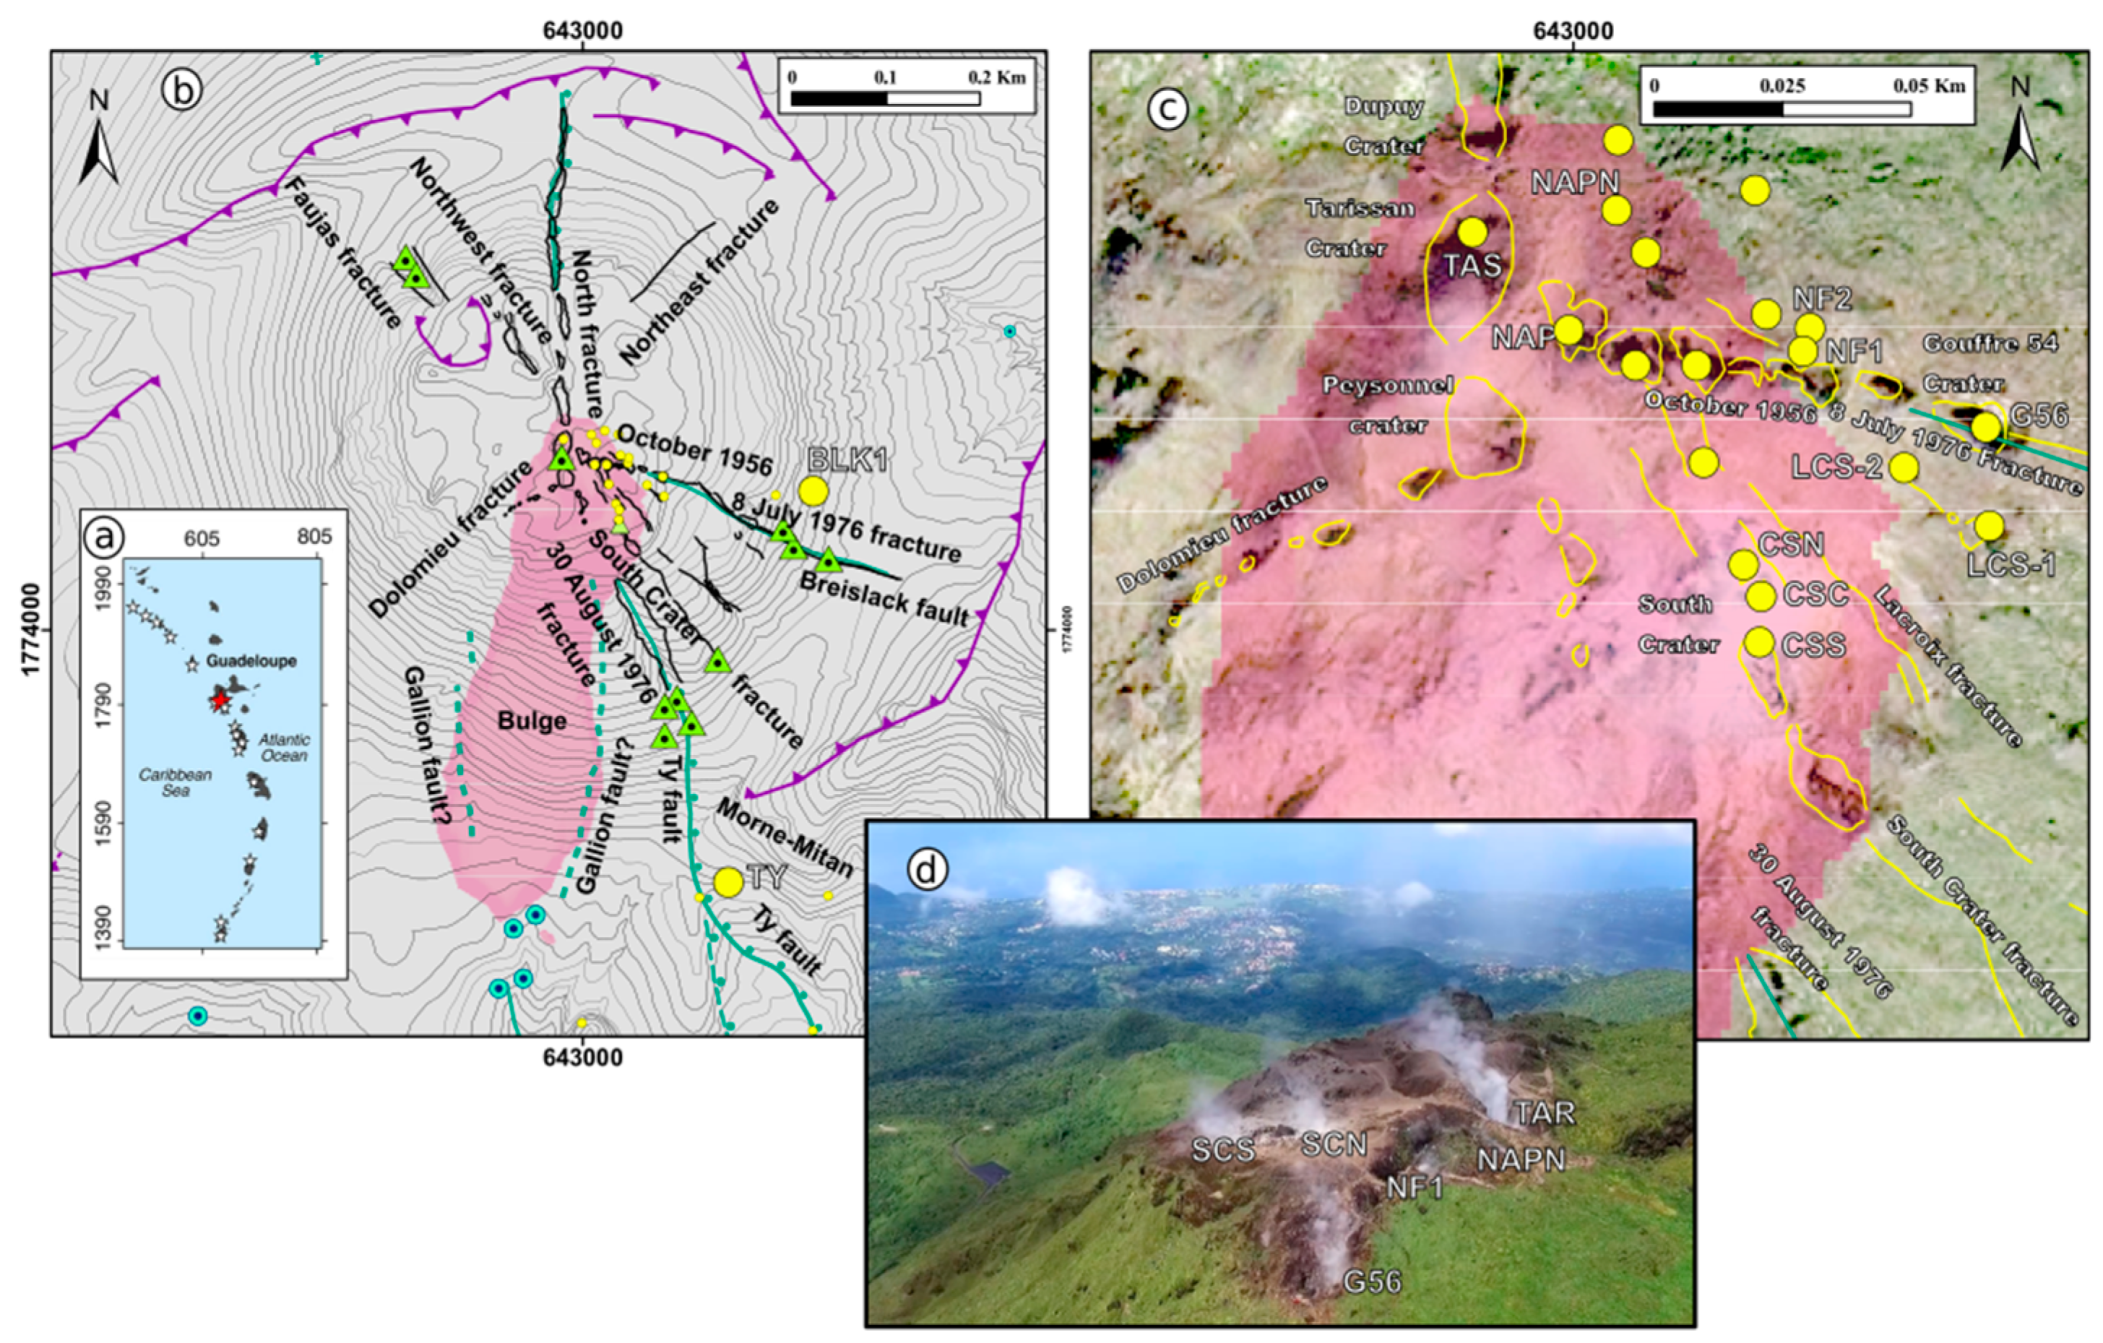
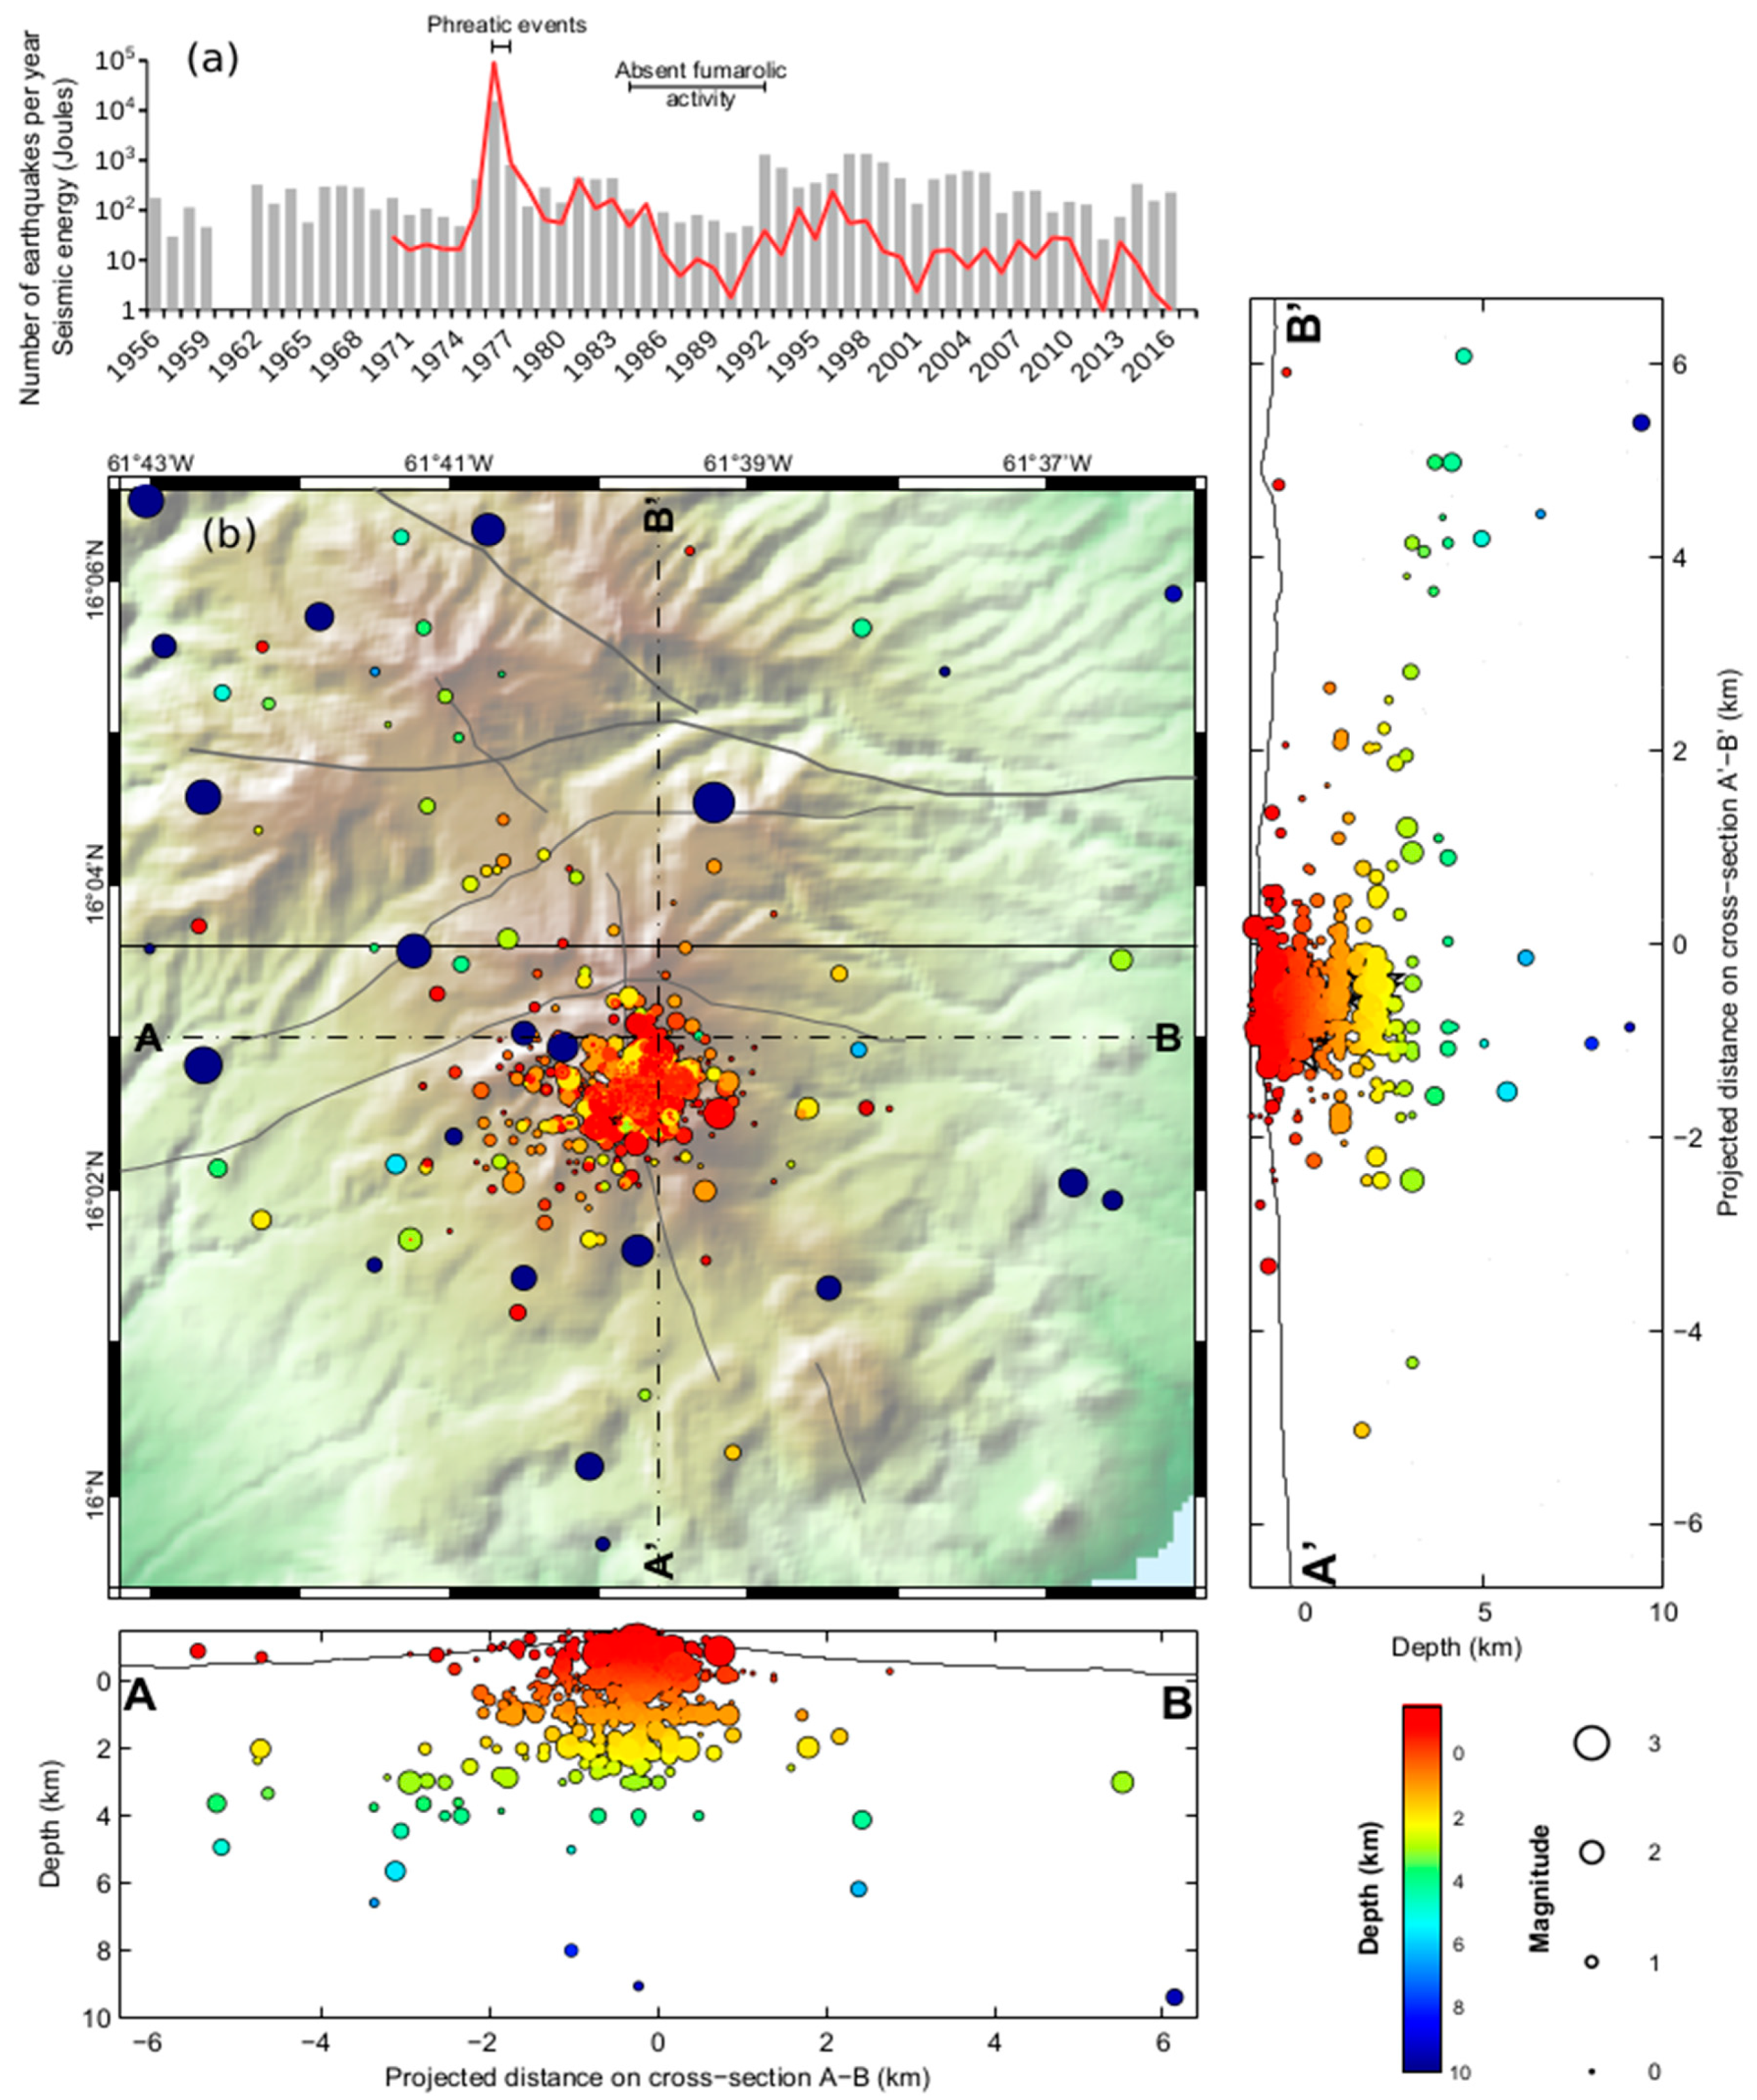
2. Volcanological Background and Recent Activity

La Soufrière of Guadeloupe is one of the most active volcanoes of the Lesser Antilles island arc (Figure 1a). It is the youngest eruptive centre of a larger composite volcano, the Grande Découverte massif, located in the southern part of Basse-Terre Island [6,31]. Its main feature is a ~0.05 km3 andesitic lava dome (1427 m a.s.l.; Figure 1b,d), cut by numerous fractures (Figure 1b,c), that was emplaced during the last major magmatic eruption in 1530 AD [32].
Since then, intense hydrothermal activity has persisted on and around this lava dome (fumaroles, solfataras, hot grounds, thermal springs), culminating in six phreatic eruptions of varying intensity in 1690, 1797–1798, 1812, 1836–1837, 1956, and 1976–1977 [6,33]. The last phreatic events in 1976–1977 were accompanied by an intense seismic crisis (Figure 2) and resulted in a four-month evacuation of 75,000 people from the surroundings [33,34]. Exegesis and re-analysis of historical chronicles have shown that the three most violent phreatic eruptions in 1797–1798, 1836–1837 and 1976–1977 generated small-volume but hazardous manifestations, such as laterally-directed explosions, cold dilute turbulent pyroclastic density currents (PDCs) with runouts ≤1.5–2 km, and rockslides and/or debris avalanches resulting from partial collapses of the dome [6,29,35].
After the 1976–1977 eruption, La Soufrière has become increasingly studied and monitored with multi-parameter networks managed by the Observatoire Volcanologique et Sismologique de Guadeloupe (OVSG-IPGP). Monitoring data are provided by continuous seismic, global navigation satellite system (GNSS), and meteorological networks, as well as periodic extensometric surveys of the evolution of the lava dome fractures [30] and routine sampling/analysis of the fumarolic gases and thermal springs (OVSG-IPGP, 1999–2017; [10,12,36]. Recorded data are processed and available online on the WebObs internal server [37,38]. Seismic and GNSS data are distributed on the public access Volobsis server of the IPGP Dater Center (http://volobsis.ipgp.fr/). Seismic data and petro-geochemical investigations indicate that the volcano is fed by an andesitic magma reservoir located at about 6–7 km depth beneath the summit [32,33,39,40,41]. According to C, He and Cl isotopic ratios of the hydrothermal fluids, persistent degassing of this magma reservoir continuously supplies fluids and heat to a shallower hydrothermal system [10,12,24,25,26,27,28,42,43].
After the 1976–1977 events, fumarolic degassing around and on top of the lava dome strongly diminished to ultimately disappear by 1984, synchronously with a gradual decline of seismic activity (Figure 2a). A period of deep rest extended up to 1992, with only minimal fumarolic activity persisting along the volcano-tectonic Ty fault at the SW base of the dome [6,36,44,45]. However, towards the end of 1991, the Tarade (TA) thermal spring that was dry since 1977 reactivated and a new thermal spring (Pas du Roy, PR) appeared at the southern base of the dome (Figure 1b). Then, in May 1992 a new phase of degassing unrest began on top of the lava dome in concomitance with a renewed increase of shallow seismicity (Figure 2). For about five years, increasing fumarolic degassing remained focused at the Cratère Sud (Figure 1b–d), but subsequently extended along the Napoleon fracture (March 1997) then at Gouffre Tarissan pit crater (late 1998). Gas emissions from both Cratère Sud and Tarissan gradually became intense enough to generate a permanent volcanic plume, visible from several kilometers distance always on clear days. Moreover, in 1998 fumarolic exhalations from both craters started to become extremely acidic (mean pH of 0.95 ± 0.64 at CSN between 1998–2001) due to their marked enrichment in chlorine. A surficial boiling acid lake (pH= −0.8 to 1.6 and T °C = 88.8 ± 8.6) formed and persisted from April 1997 to about December 2004 in Cratère Sud (see Figure S4 in Rosas-Carbajal et al. [29]), while another boiling acid lake (pH= −1.3 to 0.8 and T °C = 78.3 to 100.3) developed since late 2001 at the bottom of the 30 m wide and 80–100 m deep Gouffre Tarissan (OVSG-IPGP, 1999–2018). Up to now, this acid lake in Tarissan has remained active and been regularly sampled by OVSG [6,10,28]. Acid gas emissions from both vents over the past two decades have considerably impacted the vegetation growing on the downwind summit and W-SW flanks of the dome (Figure 1b).
Since 1998 volcanic seismicity at La Soufrière has fluctuated in terms of number of events and released energy (Figure 2a). The prevalent seismicity was characterized by numerous swarms of volcanic earthquakes of very low magnitude (dominantly Md ≤ 1), lasting over periods of a few days to a few weeks, most of which originated within 1–4 km depth right below the summit lava dome (Figure 2b). Since 1992, however, 20 felt volcanic earthquakes were recorded, among which 5 in 2013, 1 in 2014, 1 February (1st) 2018, 1 in April (16) 2018, and 2 on 27 April 2018 when the strongest (M = 4.1) seismic event occurred in 42 years [22,28]. Concurrently, the degassing unrest phase has continued to evolve, with gradual reactivation of other vents and the recent opening of new vents. While fumarolic activity remained dominantly concentrated at Cratère Sud and Gouffre Tarissan until 2007, more recently fumarolic degassing resumed or initiated at several other vents, gradually migrating from the lower eastern flanks of the volcano, along the main October 1956–8 July 1976 fracture and the Breislack fault system (Figure 1b,c), up to the summit area. In particular, fumarolic degassing progressively renewed and increased at y Gouffre-56 (G56, the site of 1956 phreatic eruption [46]), then propagated to the nearby Lacroix Supérieure fumarole (LCS- and LCS-2) in December 2011 and, in October 2013, further east in the vicinity of the Breislack crater (Figure 1b, site of the 1797, 1812 and 1836 phreatic eruptions [6]). On top of the lava dome, a new fumarole (NAPN) appeared in July 2014 north of the Napoleon fracture that was reactivated in numerous sites along its 200 m stretch. Between 8 and 10 February 2016, two new vents (NPE1 and NPE2) opened further northeast (Figure 1c). Increasing fumarolic activity in that sector of the lava dome and along the Breislack fault system over the past decade also coincides with enhanced shallow seismicity beneath that part of the volcano (Figure 2b). The Breislack fracture system was involved in all of the phreatic eruptions of La Soufrière since 1797 [6,29,35].
A regular survey of La Soufrière fumarolic gases has long been conducted at the Cratère Sud Central (CSC), the only vent accessible for gas sampling [10,12,43]. The new fumarole opened in 2014 north of Napoleon crater (NAPN; Figure 1c) has been sampled occasionally [28]. Otherwise, chemical data available for the other fumarolic vents unaccessible to gas sampling were obtained recently from in-situ MultiGAS survey (March 2006 and March 2012 campaigns [12]). In this study we report on gas compositions for all the fumarolic vents (see Figure 1c) that were active on top of the lava dome in 2016–2017, as well as gas fluxes from the three major emitting vents (Tarissan, Cratère Sud and Gouffre-56). We also report data on fumarolic degassing at the base of the lava dome, Morne Mitam site, along the Ty fault. Our chemical and flux results are then compared to previously obtained data [10,12,43]. From here in, we use the acronyms listed in the caption of Figure 1 for the fumarolic vents, whereas full names will be maintained for major structural elements such as faults, fractures and craters.

3. Methodologies for Gas Measurements and Extensometric Survey

In-situ field determination of fumarolic gas compositions at La Soufrière was performed on several occasions in 2016 (May 10–12, June 18, September 6, and December 9–10) and 2017 (March 26 and October 31) by using MultiGAS. Two types of devices were operated. The first one, built in Palermo University, consists of a Gascard IR spectrometer for CO2 determination (calibration range: 0–3000 ppmv; accuracy: ± 2%; resolution: 0.8 ppmv) and of City Technology electrochemical sensors for SO2 (sensor type 3ST/F; calibration range: 0–200 ppm, accuracy: ± 2%, resolution: 0.1 ppmv), H2S (sensor type 2E; range: 0–100 ppm, accuracy: ±5%, resolution: 0.7 ppmv) and H2 (sensor type EZT3HYT; range: 0–200 ppm, accuracy: ± 2%, resolution: 0.5 ppmv), all connected at a Campbell Scientific CR6 datalogger. The second one, built at Simon Fraser University (SFU, Canada), consists of two Alphasense non-dispersive IR (NDIR) solid-state detectors for CO2 (range: 0–5000 ppmv and 0–5%; accuracy: ± 1 and ± 1.5%; resolution: 0.1 and 1 ppm, respectively) and Alphasense electrochemical sensors for SO2 (sensor type EZT3ST/F; calibration range: 0–2000 ppm; accuracy: 1%; resolution: 0.5 ppm) and H2S (sensor type EZT3H; range: 0–2000 ppm; accuracy: 1%; resolution: 0.25 ppm). Each instrument also includes a relative humidity sensor (Galltec, range: 0–100% Rh, accuracy: ± 2%), coupled with a temperature sensor (range: −30–70 °C, resolution: 0.01 °C) and atmospheric pressure (Patm) sensor, all fixed externally, that permit to determine the concentration of water vapor (ppmv). The latter was obtained by combining the sensor readings of Rh% and Patm following the procedure described in Moussallam et al. [47]. H2O determination with these external sensors allowed us to circumvent the potential influence of steam condensation in the MultiGAS inlet tubing and, therefore, to avoid underestimating the measured water/gas ratios. Unfortunately, this setting has been used only during the May 2016 campaign when the SFU-type MultiGAS was available.
Prior to field measurements, all sensors were calibrated in laboratory using target gases of known concentration. The different MultiGAS instruments have been tested in the field by measuring the same gas (the inlets were close together), and the results show a good comparison between the measured concentrations. Time-averaged gas compositions (H2O, CO2, SO2, H2S and H2) were determined at all fumarolic vents during stationary measurements lasting a few minutes in the downwind air-diluted plumes. Post-processing of data was performed using the RatioCalc software [48]. Differences in the response time of the sensors were taken into account from lag times in correlation analysis of the various time series, and potential interference between SO2 and H2S sensors was calibrated and corrected. CO2 and H2O contents were corrected for the ambient air composition, measured in the clean atmosphere outside the volcanic plumes. Figure 3 shows an illustration of MultiGAS recordings at the three main craters.
Fumarolic gas fluxes were determined on six occasions in 2016 (March, May and December) and 2017 (March and October) at the three main degassing craters: CS, TAS and G56 (Figure 1c). As detailed below, gas fluxes were derived by scaling the integrated amount of each gas species in the air-diluted plume cross-sections to the wind speed measured during the gas survey with a hand-held anemometer. During most of our measurements, the volcanic gas plumes were flattened to the ground by relatively strong trade winds (4–16 m·s−1) and, according to both field observations and video-camera footage, had a maximum height of ca. 3 m above the ground at each of our measuring sites. The horizontal and vertical distributions of gas species in the plume cross-sections were measured during walking traverses orthogonal to the plume transport direction, a few meters downwind to the vents, with hand-held GPS in one-second track mode. One key improvement in our measurements, with respect to previous studies, has been the simultaneous use of multiple MultiGAS devices allowing to record gas concentrations in real time at different heights within the plume cross-sections. On 12 May 2016 we simultaneously operated three MultiGAS (two UniPA-type and one SFU-type) instruments whose gas inlets were fixed at 1, 2 and 3 m height above the ground along one single (4-m long) vertical pole held vertically (Figure 4a).
On 9 December 2016, we used the same configuration but with only two UniPA-type MultiGAS instruments whose inlets were positioned at ~1.7 and ~3 m heights. On 26 March 2017, multiple (2–3) plume transects at the three main vents were made using one single UniPA-type MultiGAS but sequentially switching the gas inlet position from ~0.8 to ~2.7 m height above the ground. The maximum height of ~3 m for our measurements corresponds to the observed maximum elevation of the volcanic plumes at each measuring site, recurrently grounded by strong winds, and allowed us to accurately quantify gas distributions within the entire, or almost entire, plume cross-sections.
While H2S, SO2 and most of the measured H2 are purely volcanic-hydrothermal in origin, H2O and CO2 concentrations need to be corrected for the atmospheric background in which these two species are abundant. Accordingly, each of our walking profiles (Figure 4b) was initiated in pure atmosphere, upwind of the volcanic plumes, in order to characterize and then subtract the ambient air composition from our recorded data. The concentrations of purely volcanic CO2 and H2S retrieved in each plume cross-section were interpolated with a smoothing interpolant function with an R2 >0.95. The interpolating surfaces (Figure 4c) were integrated to obtain integrated concentration amounts (ICAs, in ppm·m2) in each plume cross-section (Table 2). Our series of traverses for each vent reveal a similar CO2 and H2S distribution pattern at the different heights, with maximum concentrations at half plume height (see Figure 4b), indicating steady plume structures with maximum gas density centered at between ~1.5 and 2 m above the ground (Figure 4b). In agreement with both field visual observations and video-camera footage, volcanic gas concentrations were considered below the detection limit at above the maximum plume elevation of 3–3.5 m. Both our MultiGAS procedure and the field conditions thus provided us with a good coverage of the plume structures and gas emissions from the three main vents on top of La Soufrière lava dome.
Wind speed is one key parameter and a main source of error in quantifying volcanic gas fluxes. On La Soufrière, we repeatedly measured the wind speed, as well as atmospheric pressure, temperature and relative humidity, with a hand-held weather sensor device. The measurements were performed inside the gas plume in order to achieve a fair match between plume and wind speeds. In fact, these two velocities can significantly differ from one another if measured at different sites, contributing to high and usually unquantified errors [49]. Hence, the measured wind/plume speed was used (error 1σ) in our calculations of the volcanic gas fluxes (Table 2). Weather conditions varied rapidly during our measurements: sunny intervals alternated with episodes of fog and occasional rain, and trade winds blowing from the northeast varied in speed from moderate (3–5 m·s−1) to strong (12–18 m·s−1). Strong winds were less variable (relative standard deviation of ~30%) than moderate winds (RSD of ~60%). Despite the fact that the derived gas fluxes are affected by these changing conditions in terms of variability, our measured chemical compositions show, instead, constant values at single vents on time scales of a few days, months and even one year.
The flux of H2S and CO2 are thus obtained from the integrated column amounts (ICAs) of H2S and CO2 directly measured in each plume cross-section and then by multiplying with the average wind speed (Table 2). The fluxes of other gas species were derived by multiplying the H2S or CO2 fluxes by the average Xi/H2S or Xi/CO2 weight ratio of each gas emission (calculated from the molar ratios shown in Table 1).
We integrate here our volcanic gas observations with data from extensometric survey of the fractures of La Soufrière lava dome (Figure 1b–c) monitored since 1995 by OSVG manual recording of the width of 15 fractures performed every three months [22,30]. Each of the monitored sites is equipped with two stainless steel hooks anchored to rock on both side of the fracture. A tape-type extensometer allows operators to measure the distance in between the two hooks. The instrument consists of a steel tape, a tape tensioning apparatus and an embedded caliper. An indexing mark is used to apply tension on the tape at constant values for each measurement. The standard error ranges between 0.1 and 0.5 mm, mainly depending on contemporaneous wind conditions.

4. Results

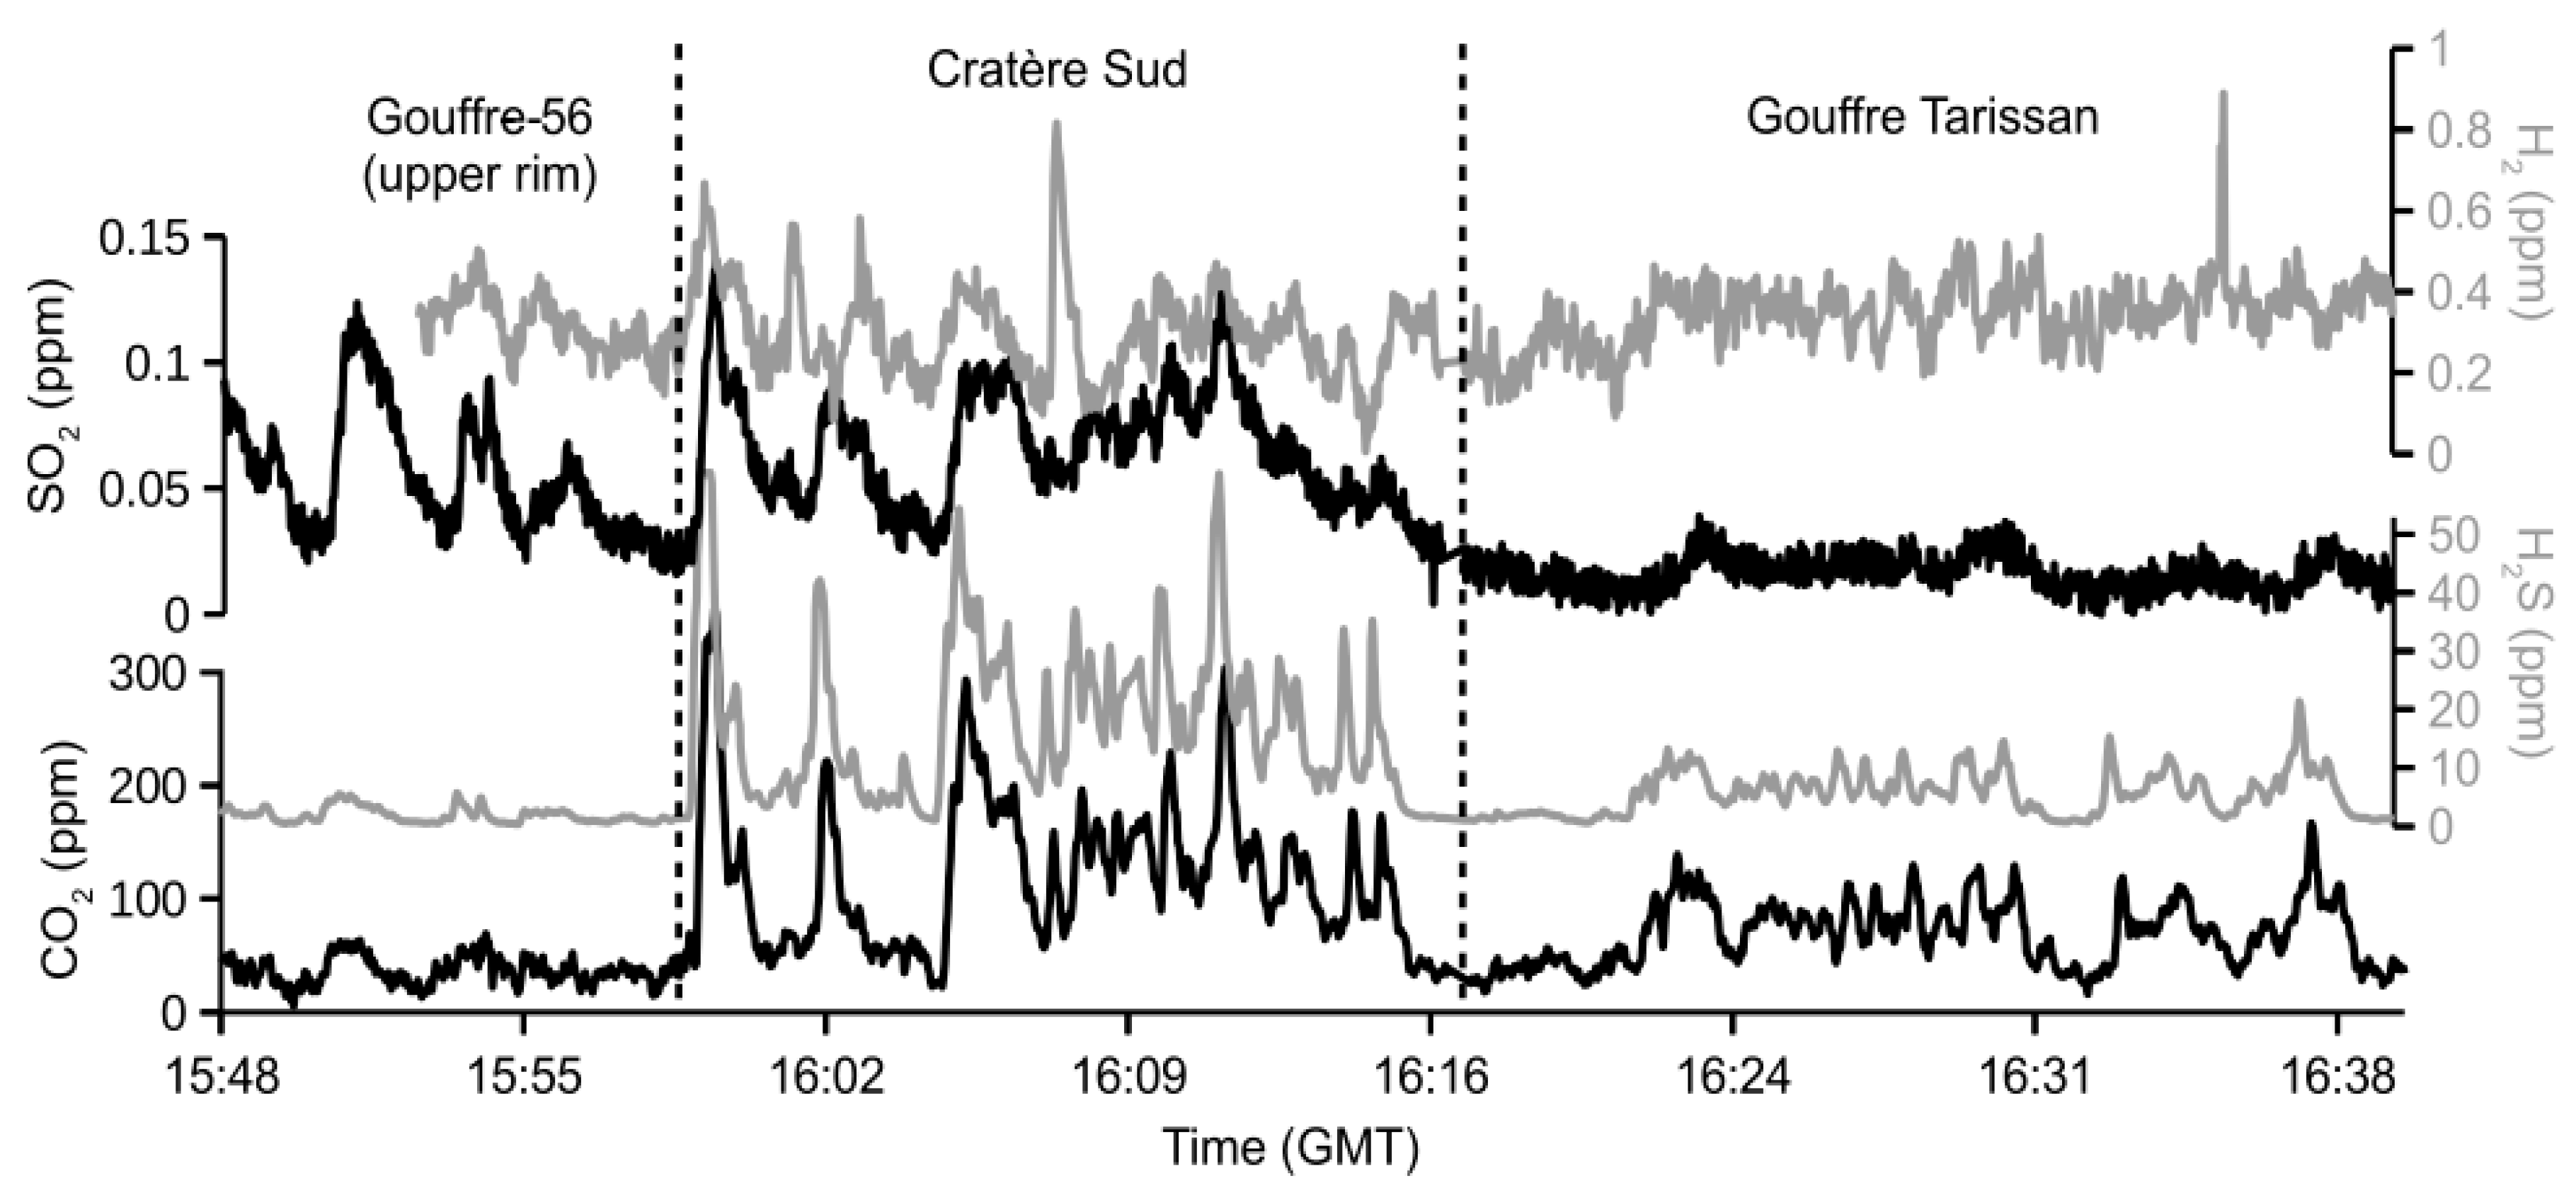
4.1. Fumarolic Gas Compositions

Table 1 reports the H2S-normalized molar ratios as well as the overall molar compositions of fumarolic gases from the different active vents of La Soufrière measured in 2016 and 2017. The bulk molar percentages for H2O, CO2, H2S, SO2 and H2 are reported only when water was successfully determined using an external Rh sensor. We observe that gas compositions vary significantly as a function of the gas exit temperature but also the spatial location of the vents. Water vapour greatly prevails (∼86–97%) in all gas mixtures emitted at above or near the water boiling temperature (96 °C) at ambient elevation (CS, NAPN), but is typically depleted in the ‘colder’ (40–60 °C) emissions (NAP1, NPE1, NPE2 and the peripheral TY and BLK1) due to shallow steam condensation in the ground. Carbon dioxide is the second most abundant component, followed by H2S. Figure 3 illustrates clear co-variations of CO2, H2S, SO2 and H2 in cross-sections of the volcanic plumes, as recorded with MultiGAS. CO2/H2S ratios display a relatively restricted range (2.9–6.5) in the hottest fluids but also in cooled emissions from Gouffre-56, except for NaPN (Figure 5b), while more variable and higher values (up to 190) in the ‘coldest’ gas emissions (NA1, NF2, BLK1 and TY). SO2/H2S ratios vary by three orders of magnitude among the different fumaroles and are generally higher in emissions from the east-southeast sector of the dome (G56, NAP1, NAPN and NPE2). Finally, both H2/H2S and H2/H2O ratios tend to be about 10 times higher in cooler than in hotter gas emissions (Table 1), supporting the idea of simultaneous fractionations due to partial water condensation and sulfur loss prior to gas exit. Figure 5 provides further insight into the compositional differences and temporal evolution of La Soufrière fumaroles in 2016 and 2017 compared to previous periods.
Figure 5a shows the fumarole compositions in an H2O-CO2-Stot ternary diagram. Displayed here are only our May 2016 gas samples in which the H2O molar proportion was accurately determined with an external Rh sensor. The data are compared with the 2012 MultiGAS dataset [12], unpublished data for Col de l’Echelle fumarolic emissions during the 1976 eruptive crisis (P. Allard, in prep.) and high-temperature (720 °C) SO2-rich gas collected in 1996 from extruding andesite in nearby Montserrat island [9]; the latter is taken as a reliable proxy for the andesitic magmatic end-member at La Soufrière. The diagram reveals a relatively restricted compositional domain for gas emissions from the major fumarolic vents (TAS, SCS and G56) in 2012–2017, at least in terms of H2O/Stot ratios. Instead, ‘colder’ gas emissions from the TY, BLK1 and NA1, as well as NPE1 and NPE2 vents, display widely different and variable H2O/Stot and CO2/Stot ratios.
Figure 5b provides further insight into the spatial and temporal variations of sulfur species in a ternary diagram CO2-SO2-H2S. From 2012 to 2016, one observes that fumarolic gases from SC and to a lesser extent NAPN and G56 display large temporal variations in SO2/H2S ratio at relatively steady CO2/H2S ratio, along a trend that extends from the SO2-rich magmatic end-member (left corner) towards strongly SO2-depleted samples with very low SO2/H2S ratio. Such a trend is best explained by variable SO2 scrubbing in the hydrothermal liquid water. Gas emissions from Tarissan are systematically impoverished in SO2 through this process. Colder gas emissions from TY, BLK1, NA1 and generally NF1 and NF2 vents are not only strongly depleted in SO2 but also variably impoverished in H2S, as shown by their plot on a second trend of increasing CO2/H2S ratios. Such a trend strongly suggests a variable but extensive loss of H2S in the volcanic ground prior to gas exit. Only fumarole NPE1 in May 2016 deviates from this trend, but we cannot exclude an influence of the measuring conditions.

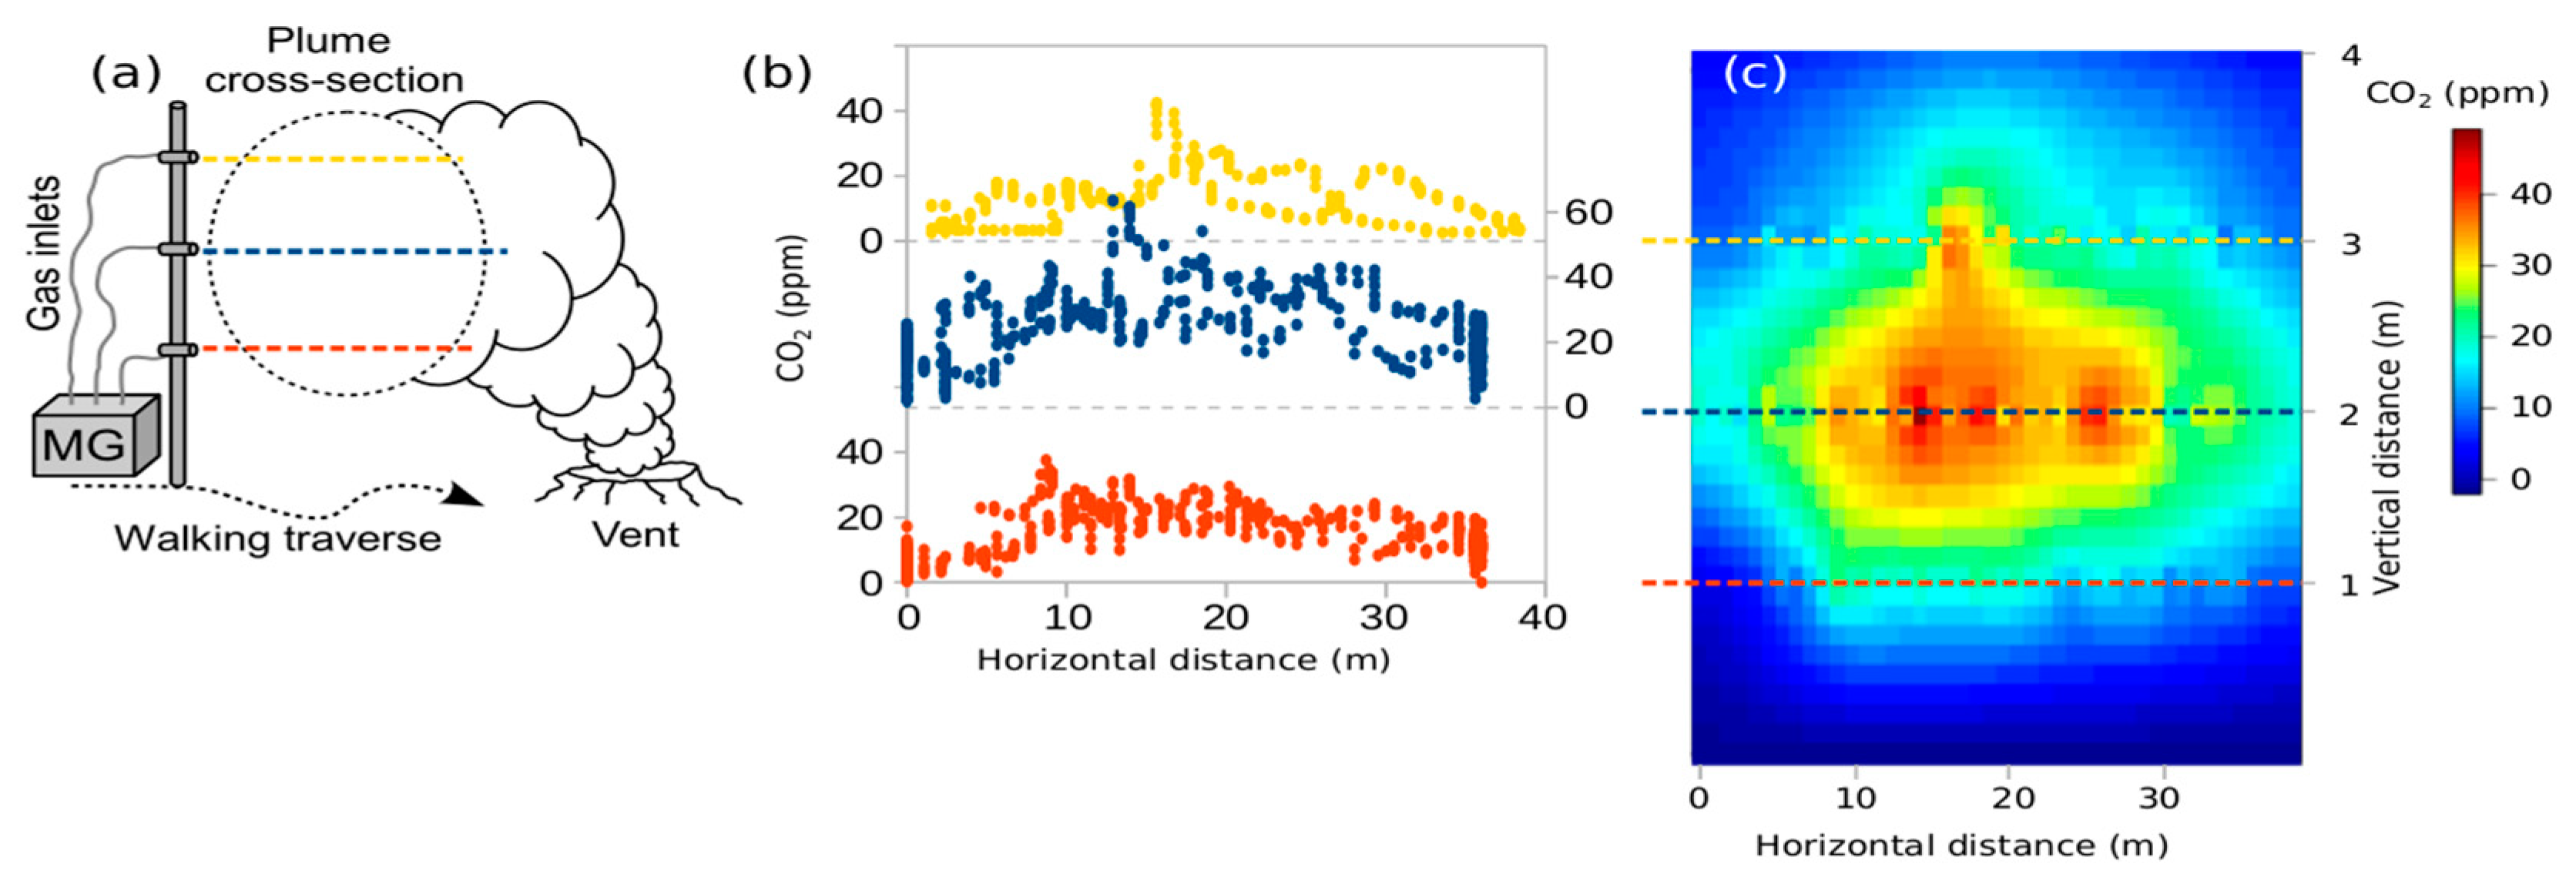
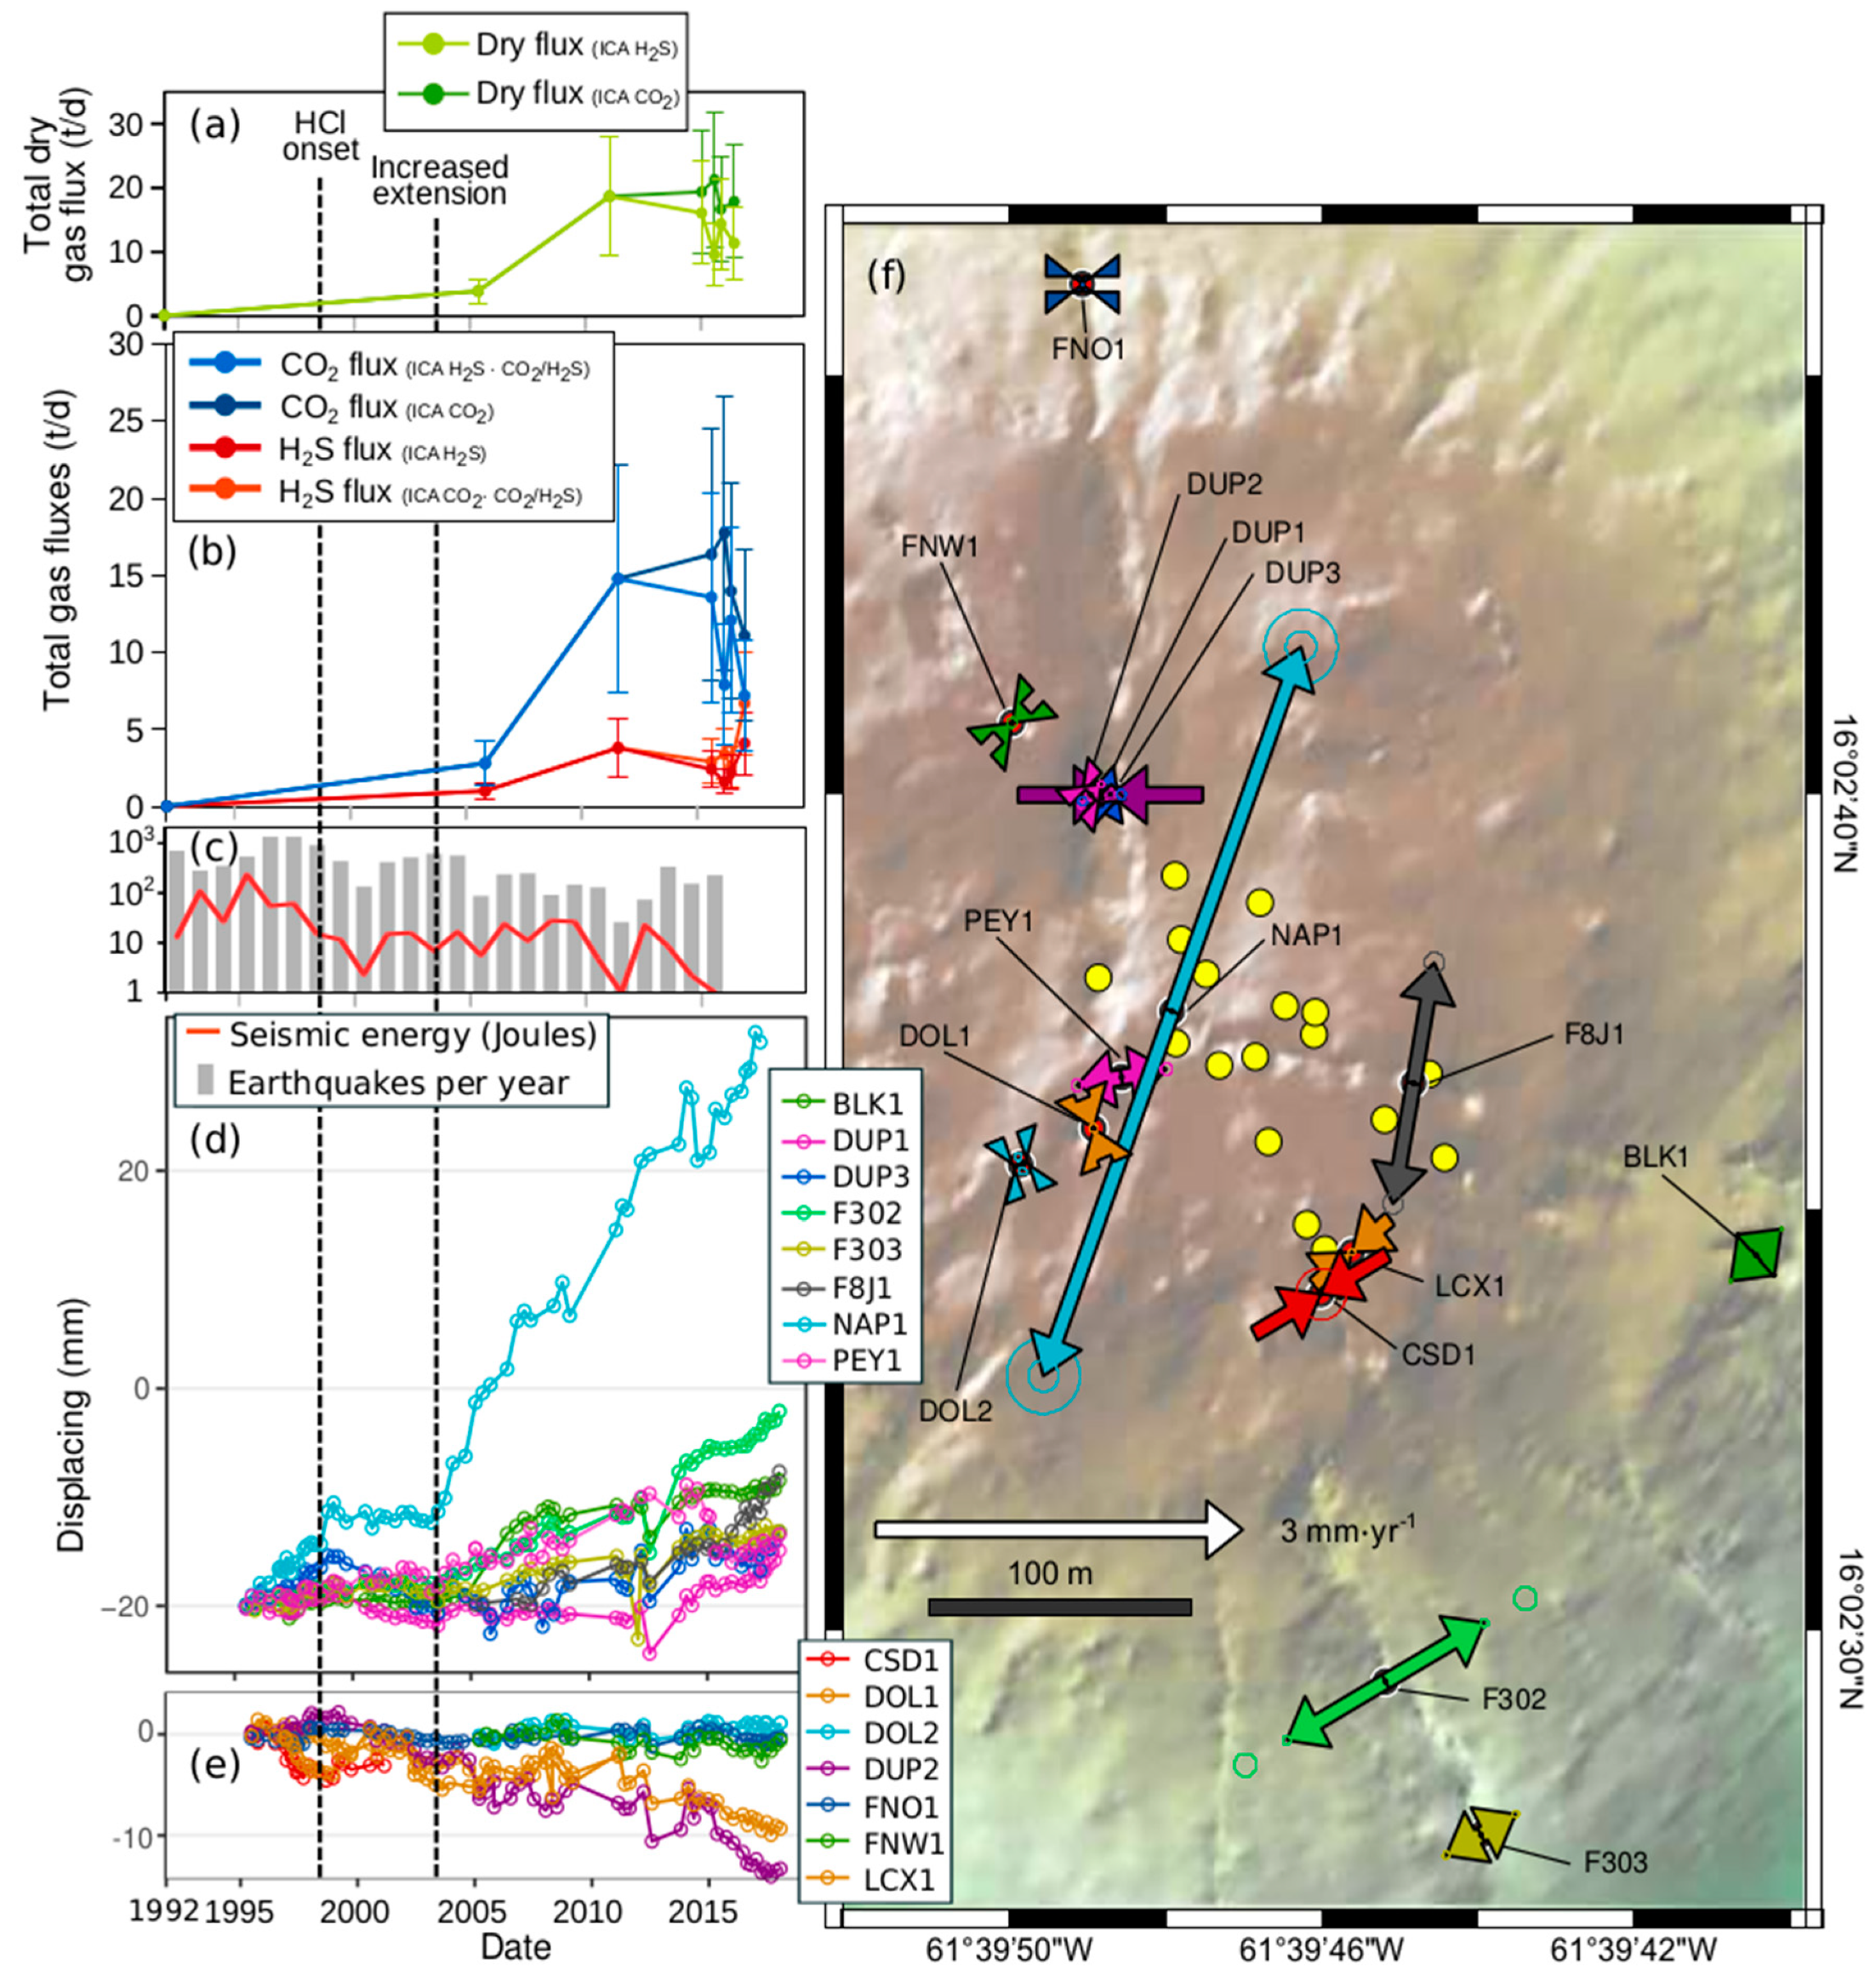
4.2. Fumarolic Gas Fluxes

CO2 and H2S concentrations typically exceed tens of ppmv in the core of the volcanic plumes and progressively decrease toward the plume margins (Figure 4b–c). Single fluxes of H2S and CO2 at each vent were determined from the respective ICAs values and the wind speed. Total gas fluxes were then computed by scaling the overall gas composition to either the H2S flux or the CO2 flux. We found that total gas fluxes derived from the H2S flux tend to be lower (by up to ~70%) than those derived from the CO2 flux. In addition to a more conservative behavior of CO2, compared to more reactive H2S, such a discrepancy most likely results from the slower response of the electrochemical H2S sensor compared to the infrared CO2 sensor [50]; while the latter is able to detect rapid concentration changes during a plume transect, the H2S sensor needs comparatively more time to reach a full read at each position and, therefore, tends to provide smoothed concentration profiles. Therefore, our flux calculations were safely based on single determinations of the CO2 flux at each vent. The H2S flux was inferred by multiplying the CO2 flux by the H2S/CO2 weight ratio.
Table 2 reports the computed CO2 and H2S gas fluxes from La Soufrière in 2016–2017 and compares them to previous data. Note that flux data in 2006 and 2012 [12] were based on the H2S flux measured with either MultiGAS (2012) or a specific H2S sensor (2006) and, therefore, represent minimum figures. Fumarolic steam, calculated for all the three vents only on May 2016 (and thus not displayed in Table 2), contributes a predominant fraction (75–203 t·d−1) of the total gas flux emitted by La Soufrière volcano over the past decade, followed by CO2 (2–18 t·d−1) and H2S (1–4 t·d−1). The greater variability of H2O fluxes, compared to other gas fluxes, simply reflects the larger uncertainty in H2O determination due to both high ambient humidity on top of La Soufrière (Rh close to 100% [12]) and occasional partial steam condensation on cold surfaces at the inlet of analytical instruments. The lack of an external water sensor in our MultiGAS setting after the May 2016 campaign prevented reliable calculation of H2O/H2S ratio in the fumarolic emissions (Table 2). SO2 and H2 gas fluxes are in the order of 10−2 and 10−4 t·d−1 and contribute negligibly to the total gas output. At the TAR crater, fumarolic degassing appears relatively steady over time. Instead, since 2012, the total gas flux from SC, the historically most active vent, tended to decrease, whereas in the same time G56 displayed a noticeable flux increase accompanying its progressive reactivation since 2007 [10]. From March 2012 to October 2017, gas fluxes from G56 have varied from below detection limit to values that are comparable to those at SC and TAR. As a whole, we find that the total gas discharge from La Soufrière measured after 2016 was approximately equivalent to that determined in March 2012 (see Section 5.3).

4.3. Patterns of Fracturing and Shallow Ground Deformation

Among the numerous fractures dissecting La Soufrière lava dome (Figure 1b–c), 12 have been monitored since 1995 by OSVG using extensometers [30]. The dataset collected until 2017 reveals that some fractures displayed systematic trends in extension over the last 20 years, whereas others displayed no extension or even a contraction. Figure 6f shows the displacement vectors computed from the extensometric data set since 2007, with particular focus on deformation that affected the fractures hosting most of the fumarolic activity. The main fractures of Napoléon (NAP1, in Figure 6), Faille du 30 Août (F303, in Figure 6), Breislack (BLK1, in Figure 6), 8 July 1976 (F8J1, in Figure 6), all show an extension pattern since 1995. For these fractures, three main temporal phases of extension can be identified (Figure 6d,e): (i) a period of moderate extension from 1995 to 1999, coinciding with the initial seismogenic and degassing phase of the ongoing unrest; (ii) a period of no extension or minor contraction between 1999 and 2004; then (iii) a new period of extension, at a much higher rate, from 2004 to 2017. Phases of increased extension were previously attributed to a pressure increase upon the solid dome rocks that host the upper hydrothermal reservoir of La Soufrière [30].
Here we find that, since 2004, the largest displacement change has affected the WNW-ESE oriented Breislack fracture (Figure 1b). The maximum opening rate averages 2.49 ± 0.18 mm·yr−1 in its upper part at the Napoleon Crater (blue arrow in Figure 6f), with a total opening of 40.54 mm over the past 10 years, and 67.25 mm since June 1995. This extensional trend along the Breislack fracture coincides with the renewal (since 2007) of fumarolic degassing along this structure cutting the lava dome, especially marked at the G56 vent. Increased extension along this fault zone propagated more recently to other summit structures such as Peyssonnel Crater and Dupuy Crater, where thermal anomalies and diffuse degassing started to become observed since 2016 (OVSG-IPGP Report). Jacob et al. [30] modelled the displacements of four of the most important fractures and suggested that the main source of displacement can be accounted by a hydrothermal reservoir of ellipsoidal shape centered within the lava dome, at ~100 m depth, undertaking pressure changes.

5. Discussion

As previously mentioned, the actual source mechanism of the current degassing unrest and associated phenomena at La Soufrière still remains unclear. Hence it remains of key interest to decipher whether the current degassing unrest and associated phenomena may result from relatively shallow processes operating in the volcanic pile and the hydrothermal system or, instead, imply a deeper source mechanism involving the magma reservoir at about 5.6–8.5 km depth (e.g., [32,40,41]) or even a shallow magmatic intrusion [10,36,51]. Below we examine these possibilities in light of our results for La Soufrière gas emissions in 2016–2017 and their relations with both hydrothermal fluid circulation and geophysical signals.

5.1. 2016–2017 Gas Fluxes in the Context of La Soufrière Degassing Unrest

The magmatic origin of CO2, S, HCl and He in La Soufrière fumarolic gases (e.g., [12] and references therein) and their increased emission from central vents of the summit lava dome since 1992 provides evidence of an enhanced release of magma-derived volatiles with respect to the 1984–1992 quiescent period (Section 2). As highlighted above and in Table 2, the first in situ measurements of fumarolic gas fluxes indicated a possible factor 3 increase in the emission rate of CO2, H2S and total dry gas from 2006 to 2012 [12], in broad agreement with an estimate based on thermal imaging [52]. If we consider gas fluxes derived from H2S ICAs, our 2016–2017 data (Table 2) reveal a smaller but continuing increase of the overall gas discharge with respect to 2006. When compared to MultiGAS-based results in 2012, our data also reveal a spatial redistribution of the fumarolic gas pathways and emission rates in the shallow part of the edifice: the total gas flux is broadly modulated by increasing degassing at G56, whose magnitude has become of same order as that from TAS and CS. Moreover, because we have no flux data for the new fumaroles (e.g., NapN and NPE2) and new steaming ground that have extensively developed in the northern sector of the dome and along the Breislack fault, it is definitely possible that the overall gas flux from La Soufrière was increased in 2016–2017 compared to 2012. This would be fully coherent with the opening of new vents and the widening of fractures in the north-east sector of the lava dome since 2004, at an extension rate greater than for the 1995–2003 period. Given that fracture opening would have increased the permeability of that part of the volcanic edifice, a higher fumarolic gas flux in 2016-2017 would imply a higher fluid pressure in the hydrothermal system. This is supported by the increase in seismic energy release in 2017 then in early 2018 [22,28] and by the continued expansion of the thermal ground anomaly and degassing at the Napoleon fumarolic field.

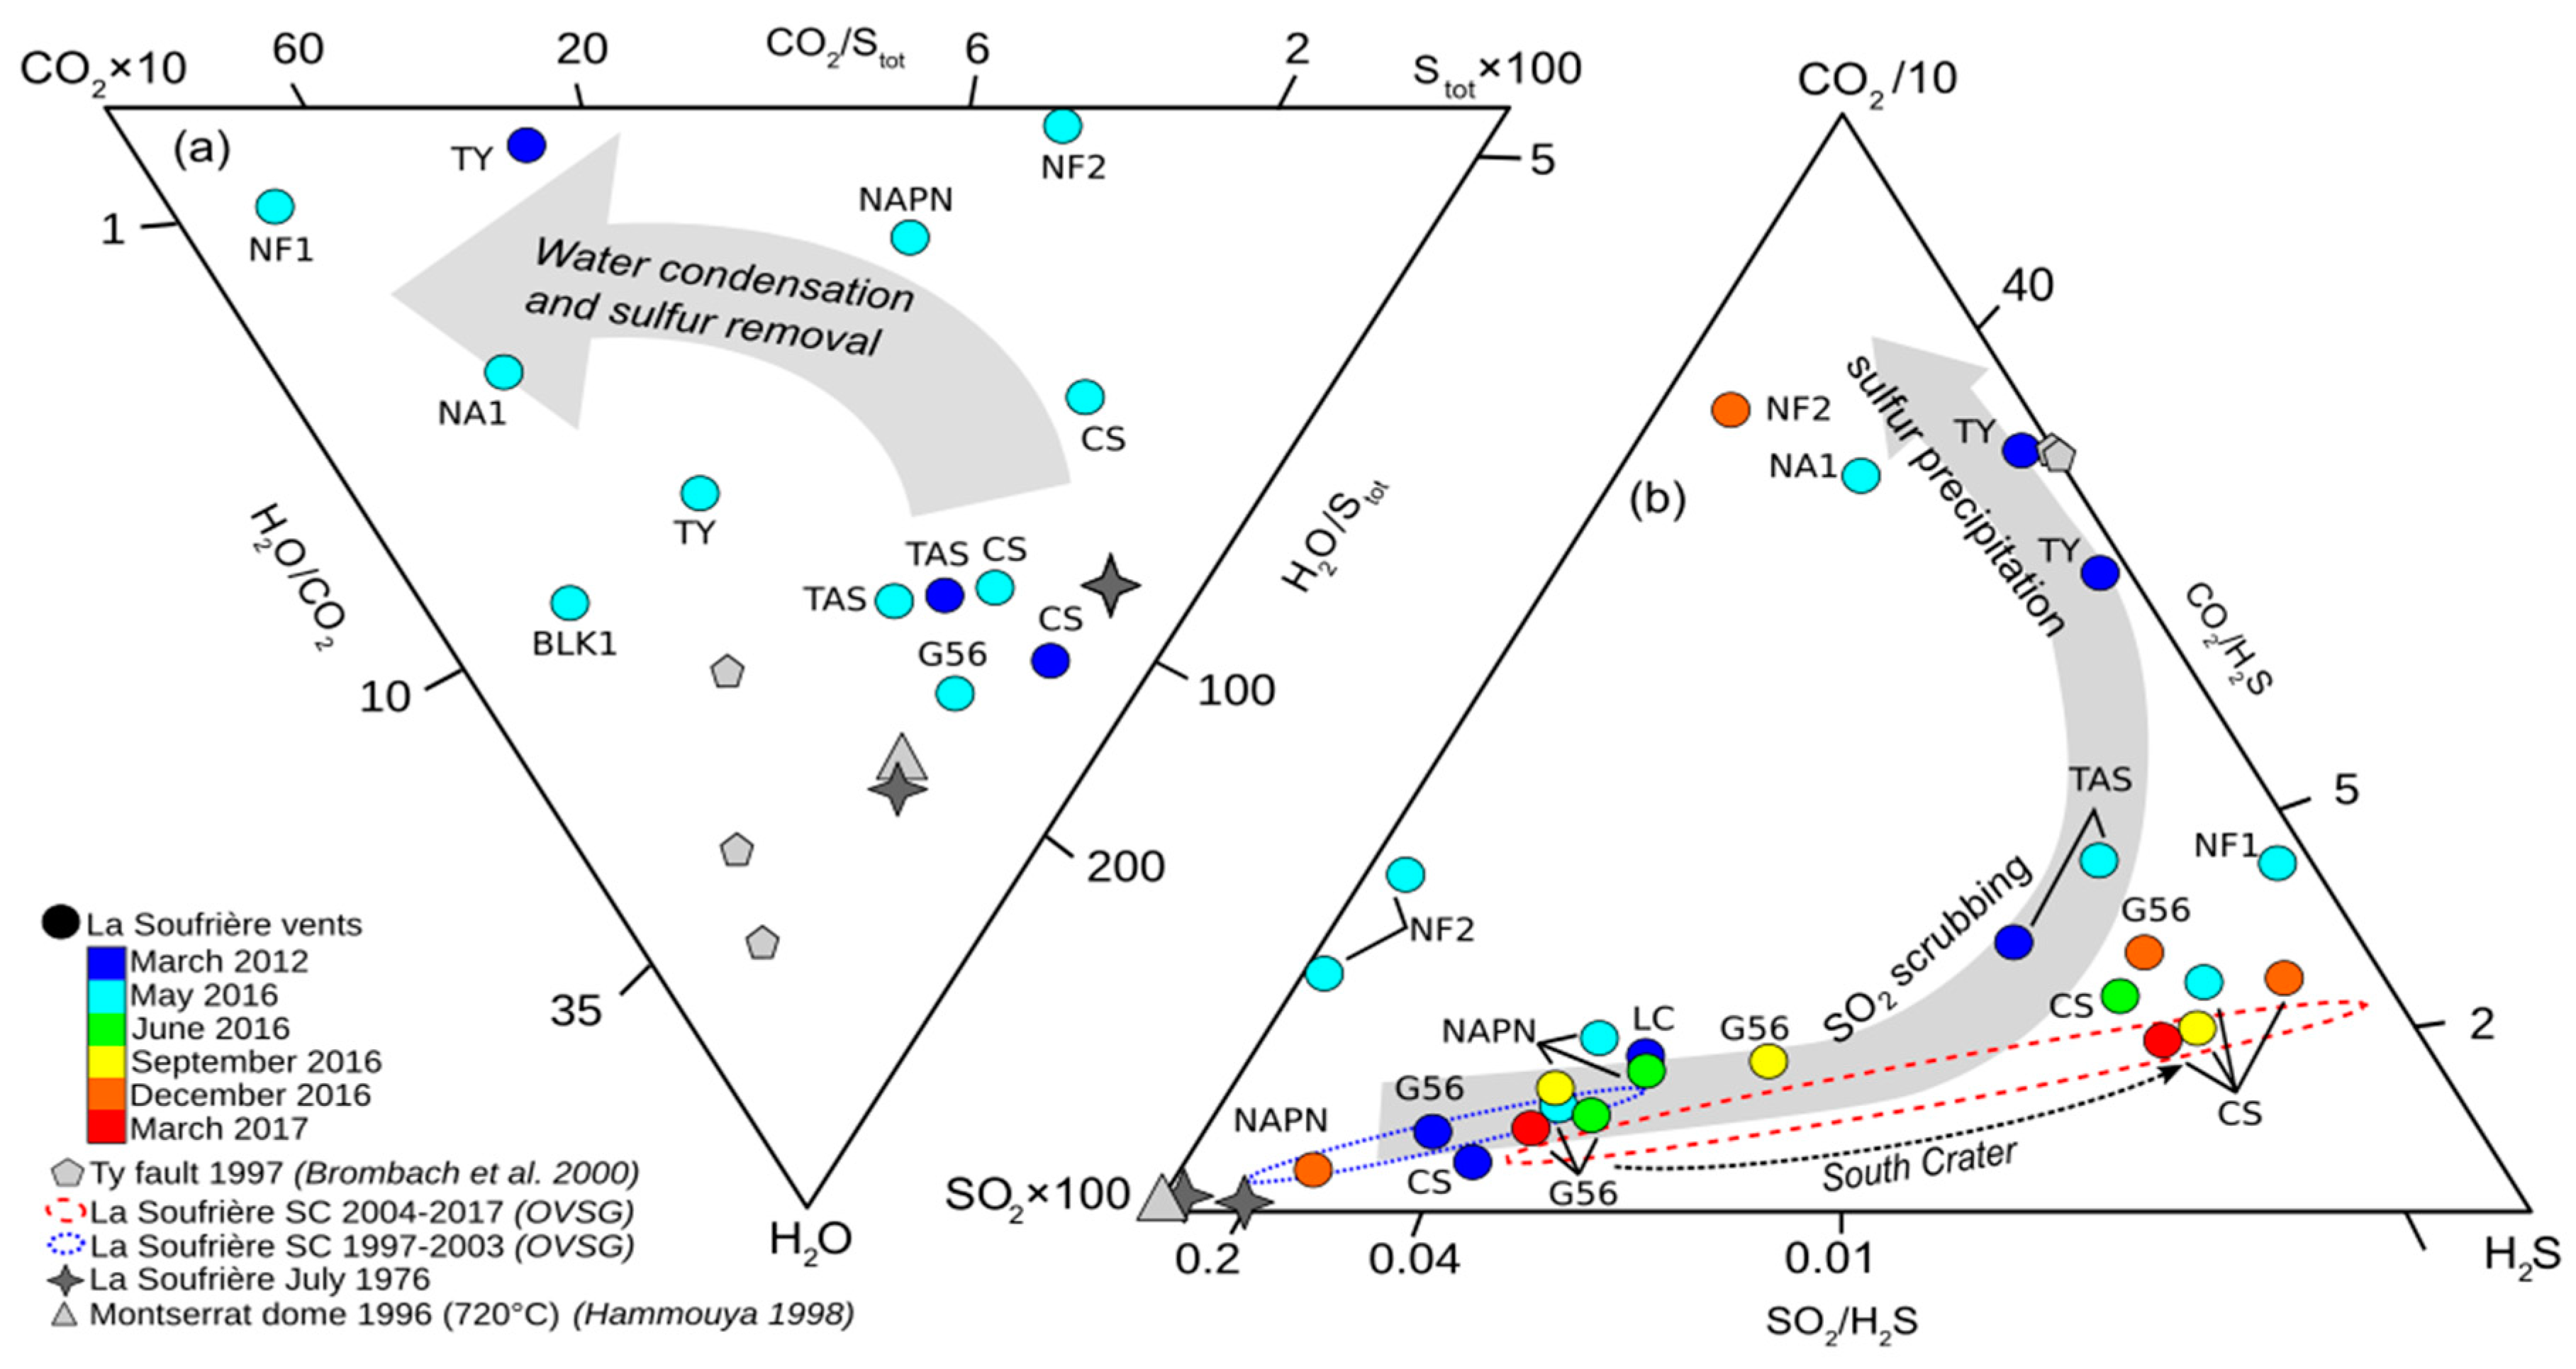
5.2. Insight from the Fumarolic Gas Compositions

As shown by the ternary plots of Figure 5, the chemical composition of La Soufrière fumarolic gases in 2016–2017 and in previous years evidences two main trends with respect to a Montserrat-type magmatic compositional end-member and La Soufrière gases during the 1976 phreatic crisis. As discussed below, these two trends can be interpreted in terms of two main processes.

5.3. SO2 Scrubbing in the Hydrothermal System

SO2 scrubbing in liquid water is a common process at volcanoes displaying hydrothermal activity (e.g., [53,54]). During gas-water interactions magma-derived SO2, which is much more soluble in liquid water than coexisting H2S and CO2, is efficiently removed from the gas phase through both hydrolysis and disproportionation reactions: 4SO2 (g) + 4H2O (aq) = H2S (aq) + 3H2SO4 (aq) and 3SO2 (g) + 2H2O (aq) = S (s,l) + 2H2SO4 (aq). SO2 scrubbing in two-phase hydrothermal systems with moderate temperature (100–300 °C), such as occurs beneath La Soufrière (e.g., [22,36,43]), thus leads to surface gas emissions essentially composed of CO2 and H2S besides water vapor. The observed variations of both CO2/STOT and SO2/H2S ratios in La Soufrière fumaroles (Figure 5a,b) with respect to the hypothetical magmatic pole (Montserrat) typically demonstrate variable but extensive scrubbing of SO2 in the liquid water phase of the hydrothermal system.
It is worth noting that the “hot” (~ 95 °C) NAPN fumarole keeps relatively high SO2 proportions (Figure 4b) while being but is clearly affected by H2S loss (Figure 4a). Around the fumarolic outlet, encrustations with multiple colored zoning can be observed, in addition to elemental sulphur. Although not analyzed yet, these encrustations are very likely determined by the precipitation of sulfide minerals, depleting the fumarolic fluid in H2S. Reed and Palandri [55] showed that dilution and cooling of a hydrothermal fluid by cold water causes precipitation of metals into sulfide minerals, following the destabilization of chloride complexes (see run 9 by these authors). We thus suggest that NAPN fumarole is thermally and chemically buffered by near-surface interaction with very shallow cold groundwater, circulating in a very limited zone in the fumarole surroundings.
We emphasize that almost all gases were measured just at the vent exit, which excludes the possibility that higher SO2/H2S ratios in the peripheral emissions could result from an enhanced air oxidation of H2S into SO2 [56]. Such a possibility might only apply to G56 and TAS emissions that arise from a quite deep open vent and lake, respectively. Otherwise, the observed spatial contrast in SO2/H2S ratios between central and peripheral summit vents on La Soufrière dome strongly suggests greater gas interaction with liquid water and, thus, enhanced SO2 scrubbing beneath the central summit vents, compared to the more peripheral vents. This chemical contrast was systematic in 2016–2017. However, we note that the extent of SO2 scrubbing can vary over time: this is shown, for instance, by the evolution of G56 emission during 2016 or by the variations at both G56 and CSN from 2012 to 2016. On a longer-term basis, Figure 5b also reveals a potential trend of increasing SO2 scrubbing over time at CSN when we compare the domains of variation (dotted areas) of fumarolic gases directly sampled at that vent in 2004–2017 with respect to 1997–2003.

5.4. Sulfur Precipitation in the Volcanic Ground

Gas emissions from the low-temperature and/or low-flux vents (TY, BLK1, and NPE2, NF1 and NA1) display a specific trend of H2S depletion with respect to the hottest fluids, reflected in their much higher CO2/H2S ratios (Table 1 and Figure 5b). The degree of H2S depletion depends on the exit gas temperature but can vary over time at a given site, as illustrated for instance by temporal CO2/H2S changes at NF2. We can discard that this pattern may result from partial H2S oxidation in air-filled fractures, forming SO2, since most of these low-T emissions are also depleted in total sulfur (higher CO2/STOT ratios; Figure 5a). Metastable precipitation of elemental sulfur within the volcanic ground through the gaseous reactions SO2 (g) + 2H2S (g) = 3S (native) + 2H2O (g) and 2H2S (g) + O2 (g) = 2S (native)+ 2H2O(g) can deplete low-T volcanic gas in both H2S and SO2, but is likely to be of secondary importance at La Soufrière given the initial large predominance of H2S over SO2 in the hottest and SO2-richest fumaroles (the least affected by SO2 scrubbing). Field observations of abundant pyrite (FeS2) in the shallow ground around the low-T vents rather suggest that H2S depletion in these low-temperature and/or low-flux emissions mainly results from superficial gas-water-rock interactions involving ferrous iron in the wet volcanic ground. Reaction 2H2S (g) + FeO (rock) + ½ O2 = FeS2 (rock) + 2H2O (g,l) (e.g., [22,53,57,58]) well illustrates the buffering effect played by pyrite and the pyroclastic rock in the hydrothermal system. The presence of sulfur deposits at CS and other hot vents (e.g., NAPN) suggest a limited but additional effect of direct sulfur precipitation through rapid H2S oxidation in air.

5.5. Compositional Gas Variations and Geophysical Signals

Since its marked reactivation at the onset of degassing unrest in 1992, volcanic seismicity at La Soufrière has remained essentially confined within a shallow depth interval (between 1 and 4 km below the summit; Figure 2b), with no peculiar temporal trend in the hypocenter distribution of seismic events. Together with a surface deformation field limited to the lava dome, as revealed by extensometric survey since 1995 (Figure 6d–f; see also ground deformation velocities determined by the Global Navigation Satellite System, GNSS, in [22]), this strongly suggests that relatively shallow processes, operating in a rather constant volume, have been responsible for both renewed seismicity and ground deformation over the past decades. Hydrothermal pressurization in this seismic volume could well account for the observed phenomena. In particular, the localized and minor deformations of the dome, with a fault opening rate of 1–2 mm·y−1, are compatible with both hydrothermal pressure increase and local gravitational basal spreading of the southern sector of the lava dome ([30] and GNSS data in [22]). Preferential extension along the Breislack fault system in the past decade does coincide with shallow seismicity concentrating beneath this eastern sector of the lava dome (Figure 2c). Note, however, that these limited phenomena do not discard the possibility of a deeper triggering mechanism of the current unrest. In particular, it is much possible that increased degassing and geophysical signals recorded at La Soufrière since 1992 have resulted from an increased gas transfer from the crustal magma reservoir at 6–7 km depth, or even a new replenishment of that reservoir. Allard et al. [12] assessed that the fumarolic gas fluxes measured in 2012 could be accounted for by the bulk degassing of about 103 m3·d−1 of parental basaltic magma feeding La Soufrière andesitic magma reservoir. Taken as representative for the degassing unrest phase from 1998 until present, such a rate would imply the cumulative degassing of ~6.5 × 10⁶ m3 of dense magma. Though an upper limit, this first-order estimation is intended to highlight that a magma intrusion of a few millions of cubic meters, sustaining the recent and current fumarolic gas fluxes, would have hardly escaped detection by the monitoring network of the OVSG-IPGP in terms of associated seismic and geodetic signals. Unless we imagine a series of small volume, sill-like intrusions emplaced at depth. Based on more recent gas data, Moretti et al. [22] estimated that a magmatic intrusion of 2.7 × 10⁶ m3 might have been responsible for the intense seismic crisis between February and late April 2018.
Above, we showed that two distinct periods can be recognized in La Soufrière degassing sequence over the past decades. We highlight here that the transition between these two periods coincides with the gradual but sustained widening of the dome fractures where new fumarolic activity has developed (NAP1, F8J1, BLK1, Figure 6d). As shown in Figure 5 and Figure 6b, our MultiGAS measurements in 2016–2017 further verify a concomitant evolution of the fumarolic gas fluxes since 2004. However, they also reveal rapid (short-term) compositional gas changes (between March 2012 and May 2016; Figure 5), as well as at newly active vents (G56, NAP1, NAPN). We argue that such rapid gas changes do not result from deeply sourced mechanism but, instead, from fractionation processes affecting the fumarolic gases during their shallow paths. In particular, as outlined above, the quite short-lived variations of CO2/H2S and SO2/H2S ratios in various fumaroles between 2012 and 2017 but also during 2016–2017 (e.g., at G56; Figure 5) strongly support the idea of a key control of gas compositions at the different vents by the degree of SO2 scrubbing in hydrothermal water and late-stage sulfur precipitation in the volcanic ground (Figure 5). Below we show how the variability in fumarolic gas compositions relates to the shallow circulation of hydrothermal fluids inside the lava dome.

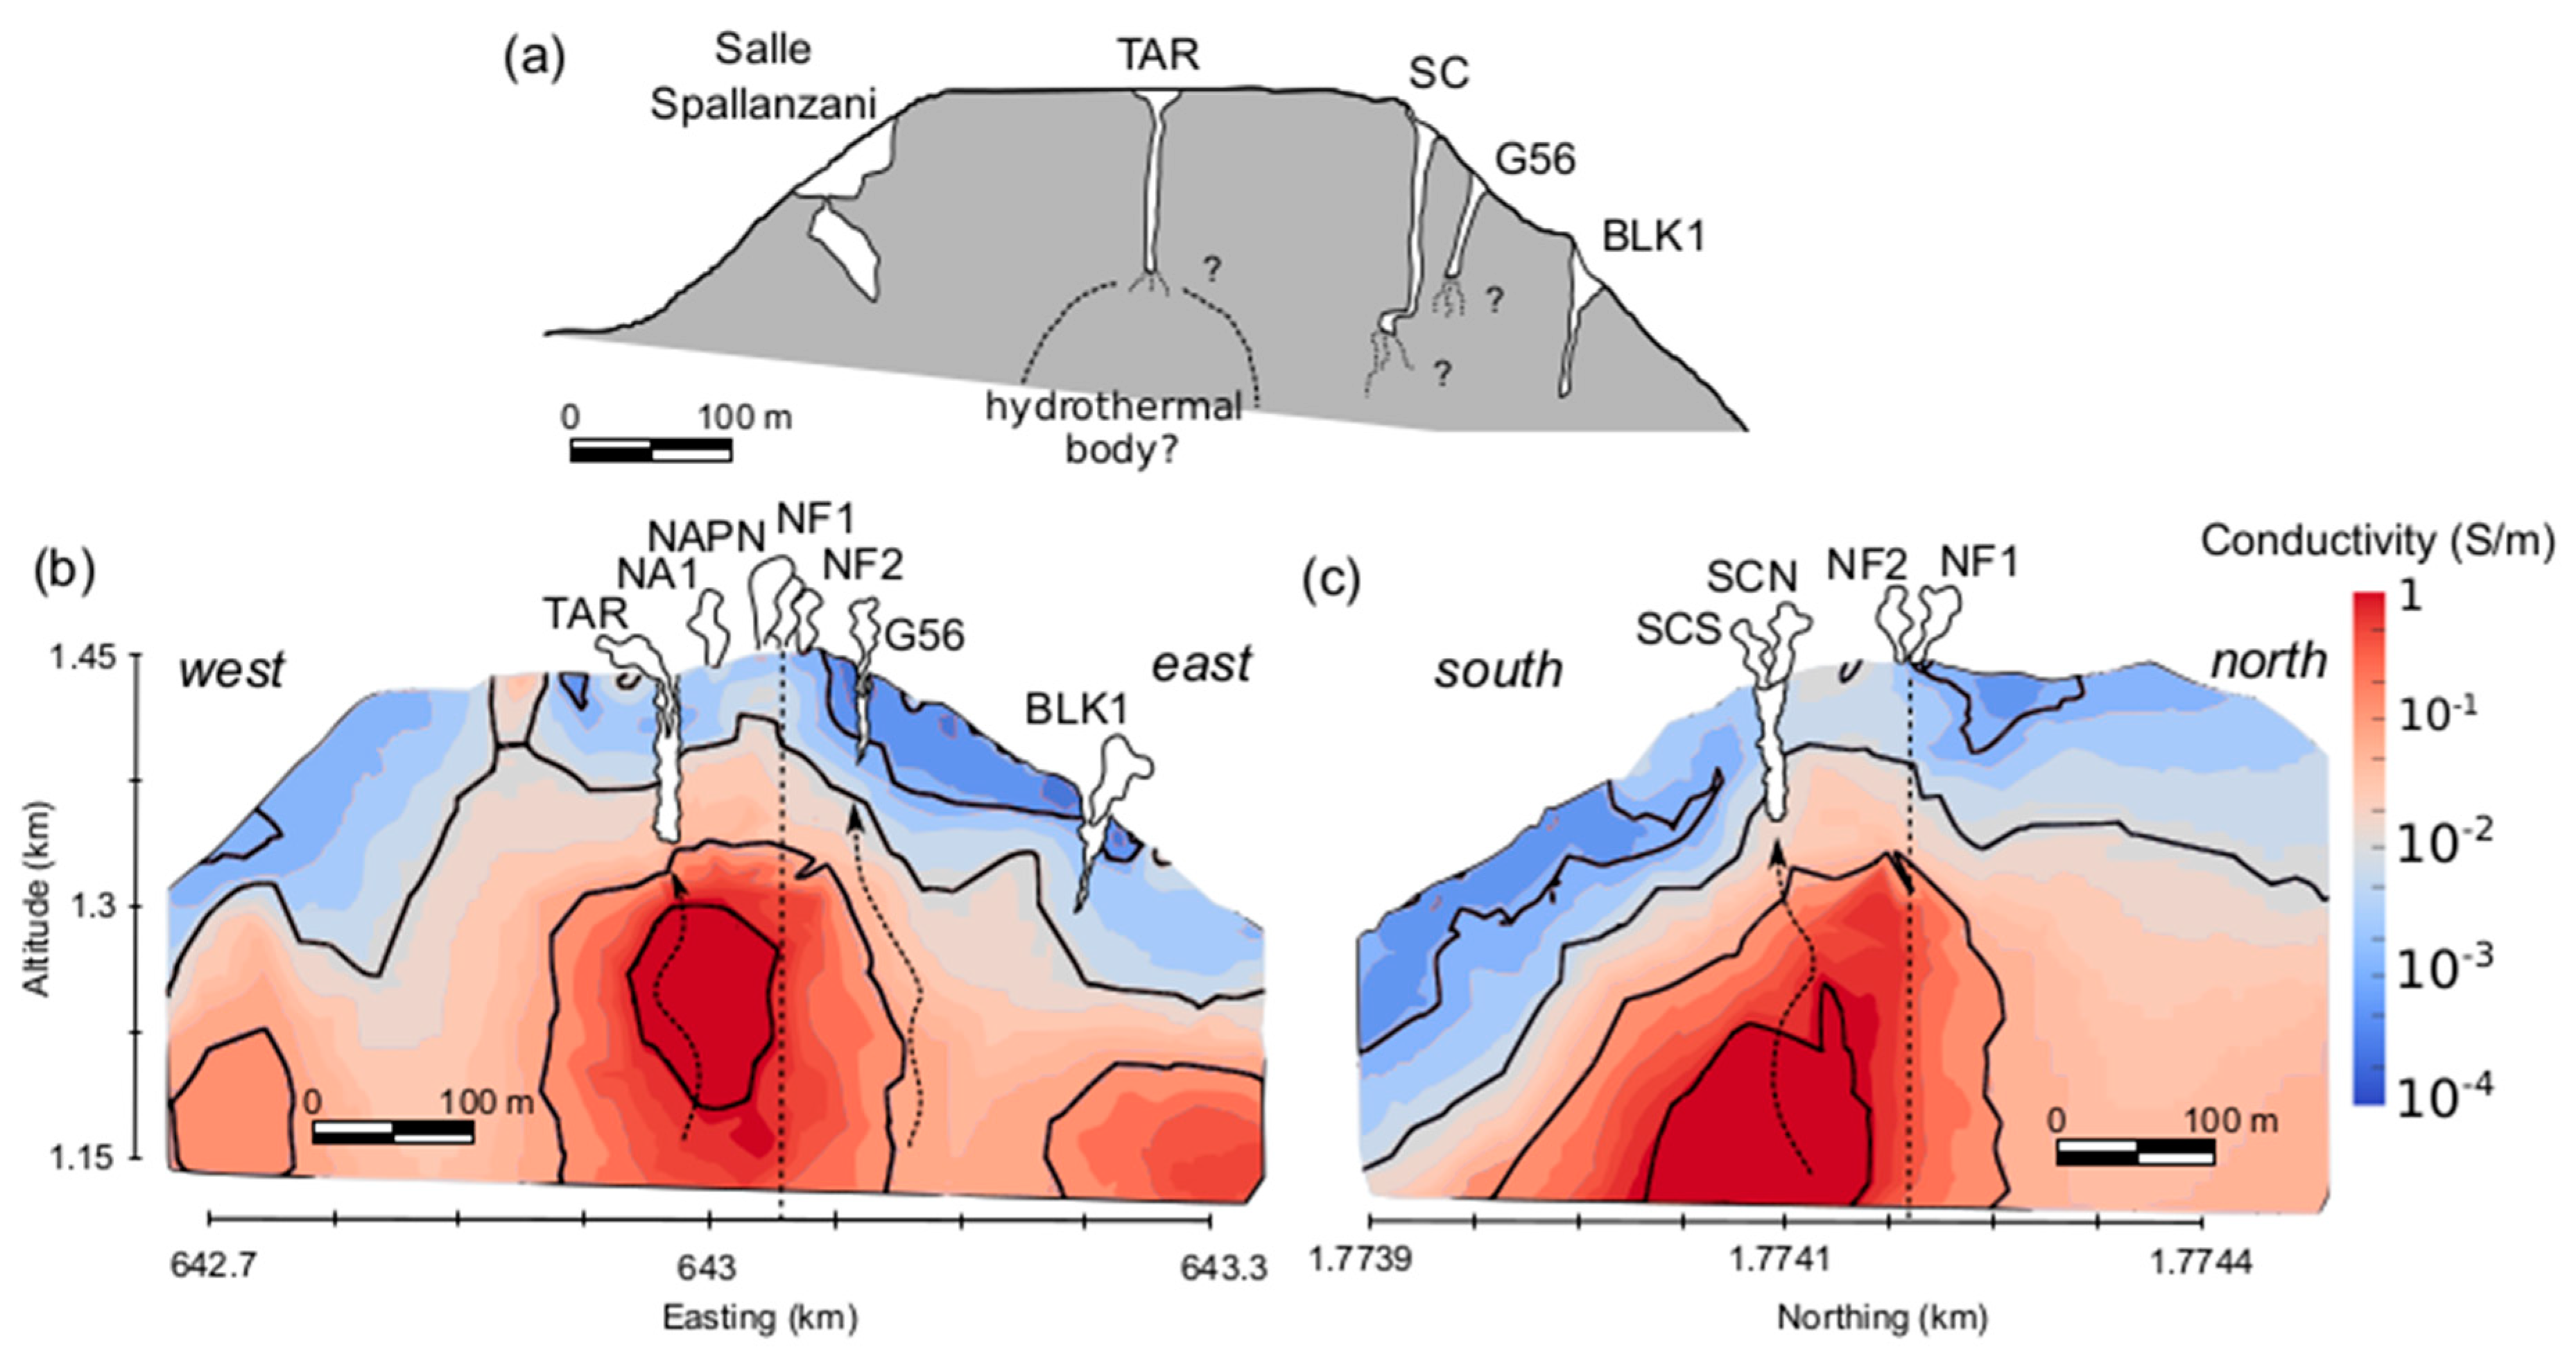
5.6. Spatial Relationships of 2016–-2017 Gas Compositions with Hydrothermal Fluid Circulation

The main fumarolic activity on La Soufrière currently extends along the upper sections of both the Breislack fault and the 30 August 1976 eruption fault (Figure 1b–c). The TAR pit crater, at the center of the dome, marks the intersection point of these two discontinuities. We present here two slices (Figure 7b,c) of the 3D electrical conductivity model obtained by Rosas-Carbajal et al. [29] for the period 2003–2011, in order to examine the relation between the pathways connecting the surface fumarolic vents to the hydrothermal reservoir and their influence upon the fumarolic gas compositions and fluxes. We have additionally superimposed the topographical survey of the cavities and pits on the summit plateau [59]; these reach depths of a few tens of meters before becoming narrow fissures or being obstructed by fallen blocks (Figure 7a). In particular, TAR crater is a 20–30 m wide and ≥100 m deep vertical pit that, since 2001, has been hosting a boiling acid pond whose level has varied between 60 and 100 m depth below the rim (average depth: 82 ± 9 m, n = 173 measurements from 26 November 2002 to 26 June 2017 [28]). In March 1993 a team of speleologists had also explored the CS pit crater [59] and found it to host an acid lake with bubbling gas at ~140 m depth (pH ~1.82, 74,060 ppm of SO42− and 79.52 ppm of Cl; OVSG, G. Hammouya, personal communication). As previously mentioned, an acid boiling pond (pH ~−0.5, see Section 1), associated with geyser-like pulsating jets of boiling water, temporarily surfaced in CS vent as well between April 1997 and December 2004 (see Figure S4 in [29]).
One first important observation from the 3D electrical tomography of La Soufrière lava dome is that the upper boundary of the conductive hydrothermal region closely corresponds to the measured depth of the boiling acid water lake persisting in TAR pit crater and temporarily observed at the bottom of CS (Figure 7b,c). This means that the upper conductive boundary tracks the upper surface of the main body of thermal liquid water, saturated in dissolved sulfate and chlorine scrubbed from the magma-derived gas upflow. The TAR acid pond has an electrical conductivity of ~25 S/m at ambient temperature. Since its actual temperature is ~90 °C, it can be expected that the liquid saturating the extremely conductive region has an electrical conductivity of at least 50 S/m (e.g., [60]). This acidic fluid has infiltrated the pore space of the hydrothermally altered and fractured host-rock of the lava dome and likely accumulated in the resulting dome’s cavities. Obviously, the potential water storage capacity of such cavities is larger at the centre of the dome than in its peripheral sectors. This inference is supported by the observations of recurrent exurgence (see Figure 1b) of hot acidic hydrothermal water, forming mud flows, during La Soufrière phreatic eruptions in 1797–1798, 1836–1837, 1956, and 1976–1977 [6,29,34].
The highly conductive body detected below the southern part of the summit extends southwards and downwards to a few hundred meters depth below the base of the dome, but also rises vertically along a structural contact to reach the surface at the level of the Galion thermal springs (Figure 1b) [29]. This is in agreement with geochemical data that suggest a direct connection between the fluids reaching the dome summit and the fluids that ultimately feed these thermal springs [10,27]. It is noteworthy that the electrical conductivity is much smaller (<0.05 S·m−1) in the upper region extending between the bottom of the central pits and the surface of the lava dome, where no stagnant liquid water occurs and where volcanic gas pathways are instead located (Figure 7). This feature, together with the high electrical conductivity values of the saturating liquid, suggests that the electrical conductivity of the host rock medium is mainly dependent on its degree of liquid saturation (e.g., [61] and references therein). This strong dependence seems to be particularly important in volcanic rocks, as shown by Ghorbani et al. (2018). The mid-range electrical conductivity values (>0.1 S·m−1) found in this region most likely correspond to partially fluid-saturated rocks that have been altered by the intense hydrothermal activity and thus contain abundant clay-rich minerals which contribute to an increased bulk electrical conductivity. On the other hand, the region of the dome where G56 is located is characterized by a rather resistive massive dome rock (<0.1 S·m−1). This indicates that host rocks in that sector are much less altered and not liquid-saturated (Figure 7b,c), as actually observed by speleologists who explored G56 [59].
Fumarolic gas from the CSC, the single vent regularly sampled and analyzed over the past 28 years, has long been considered to be the most representative of the mixed magmatic-hydrothermal end-member fluid at La Soufrière [10,12]. The boundaries of the liquid hydrothermal system, imaged through the 3D electrical tomography ([29] and our Figure 7b,c), as well as the depth of the explored pit craters in La Soufrière lava dome [59], offer new insight into the interplay between the shallow hydrothermal system and fumarolic degassing at the surface. Based on this imaging and our 2016–2017 gas results (Figure 5), here we demonstrate that fumarolic gases from both CS and TAR central pit craters strongly interact with the acid liquid water of the hydrothermal system, directly positioned at 80–100 m under these vents, and thereby undergo intense water/gas interactions. Gas scrubbing in fact accounts for their low SO2 content (dissolved as SO42− in the hydrothermal water) with respect to H2S (much less soluble in acidic boiling water). Instead, higher SO2/H2S ratios in fumarolic gas emitted from the more peripheral G56 pit (Figure 1c), located on the NE border of the liquid hydrothermal system (Figure 7b,c), point to weaker (albeit variable) SO2 scrubbing and thus more limited fractionation of sulfur species at that vent. As a matter of fact, the gas pathway beneath G56 is characterized by a weaker electrical conductivity anomaly, indicative of a small proportion of thermal liquid water in the rock column underneath. It is notable that the distinct chemical signature of fumarolic gas at that vent has persisted from 2012 through 2017, even though with temporal oscillations (Figure 5). Furthermore, our analyses of Napoleon vents (NAPN, NAP) and new peripheral fumaroles in 2016 (NPE1 and NPE2) reveal that other gas emissions markedly richer in CO2 and SO2 than CS fumarolic fluid are simultaneously active in the N-NE sector of the lava dome. Therefore, in contrast to previous exp1ectations, we argue that current gas emissions from peripheral vents on La Soufrière lava dome (G56 and other new smaller vents of the Napoleon fracture system) may be more closely representative of the unfractionated magmatic-hydrothermal gas end-member than emissions from the longer-lived, more central vents of the dome (SC and TAR). Based on that conclusion, we thus recommend that gas compositions and fluxes from peripheral vents of La Soufrière lava dome become carefully monitored in the future.

6. Conclusions

We present new results for the chemical composition and the mass flow rate of fumarolic gases emitted from different vents on top of La Soufrière volcano in 2016–2017, during an ongoing phase of degassing unrest that has developed since 1992. Our results reveal a wide range in gas compositions, reflecting the variable influence of shallow processes (SO2 scrubbing in liquid water and near-surface sulfur precipitation in the volcanic ground), that closely relates to the evolution of the fumarolic activity with respect to the underground circulation of hydrothermal fluids inside the lava dome, as imaged from a recent electrical tomography [29]. Moreover, we find that the spatio-temporal evolution in degassing activity, gas compositions and gas emission rates coherently relate to the temporal deformation pattern (fracture widening/closing) of the lava dome since the onset of the current degassing unrest. When compared to previous data, fumarolic gas fluxes determined with the highest possible accuracy in 2016–2017 verify the persistency of an elevated degassing rate through the central conduits of La Soufrière. However, they also reveal a recent spatial shift in fumarolic degassing intensity towards the eastern and northern sectors of the lava dome where SW-NE fractures linked to the Breislack fault system, as well as the south-oriented Fracture du 30 Août 1976 (Figure 1c), are progressively widening, whereas other fractures tend to close or remain stable. These coupled geochemical and geophysical observations at La Soufrière provide a new framework to better elucidate the actual significance of fumarolic gas changes during the current unrest phase and in the future. At present, the available dataset for gas emissions and geophysical signals at La Soufrière do not support the hypothesis of a shallow magma intrusion as being responsible for the current unrest. Instead, they suggest a possible increase of the magmatic gas and heat supply arising from the crustal magma reservoir emplaced at 6–7 km depth beneath the volcano. If correct, such a mechanism and its evolution over time must be carefully surveyed and quantified. The major phreatic eruptions at La Soufrière in past centuries (1797–1798, 1836–1837, 1976–1977) have often involved laterally directed explosions from pressurized regions of the shallow hydrothermal and associated hazards [6,29]. Our study illustrates the powerful potential of combining geochemical and geophysical investigations to better anticipate such events at La Soufrière, but also to interpret hydrothermal unrest at other active volcanoes in hydrothermal activity worldwide.

Author Contributions

Conceptualization, G.T., P.A., J.-C.K. and A.L.F.; Data curation, G.T., S.M., S.V., M.R.-C., S.D., F.B., J.-B.D.C., A.L.M. and M.B.; Formal analysis, G.T., S.M., S.V., M.R.-C., S.D., J.-C.K., F.B., J.-B.D.C. and A.L.M.; Funding acquisition, S.M. and J.-C.K.; Investigation, G.T., S.M., P.A., S.V., V.R., G.-T.K., T.D., J.-C.K., F.B., J.-B.D.C. and C.D.; Methodology, G.T., S.M., P.A., V.R., S.D. and J.-C.K.; Project administration, P.A., J.-C.K. and R.M.; Resources, S.M., P.A., S.D., G.-T.K., T.D., J.-C.K., F.B., A.L.M., C.D. and R.M.; Software, G.T.; Supervision, J.-C.K.; Visualization, G.T. and J.-C.K.; Writing—original draft, G.T.; Writing—review & editing, S.M., P.A., S.V., M.R.-C., J.-C.K., F.B., C.D. and R.M.

Funding

This research received no external funding.

Acknowledgments

Our study was supported by funding from a CNRS-INSU contract (Aleas-2015, S. Moune), from University of Palermo (ref. G. Tamburello) and from IPGP (equipment grant and postdoctoral contract to G. Tamburello). We thank G. Hammouya (OVSG) and O. Crispi (OVSG) for gas and acid lake sampling and measurements; D. Gibert, F. Nicollin, and participants of the ANR projects DOMOSCAN (2009-2013) and DIAPHANE (ANR-14-ce04-0001; 2014-2018) for their assistance with electrical resistivity measurements and TAR acid lake pH measurements; M. Bitetto and A. Aiuppa (University of Palermo) for their support to the development and testing of the UniPa-type MultiGAS; and Glyn Williams-Jones for help and calibration of the SFU MultiGAS. The staff of OSVG-IPGP provided us with invaluable assistance in the field, for maintenance of the stations, and with unpublished data. The Service National d’Observation en Volcanologie (SNOV) of INSU is acknowledged for recurrent funding, and the Swiss National Science Foundation and ANR Diaphane project for funding to M. Rosas-Carbajal. The authors wish to thank the three anonymous reviewers for their useful comments and suggestions upon reviewing the manuscript. Raw gas concentrations retrieved during the surveys are downloadable from the EarthChem Library (https://doi.org/10.1594/IEDA/111184).

Conflicts of Interest

The authors declare no conflict of interest.

References

  1. Symonds, R.B.; Rose, W.I.; Bluth, G.J.S.; Gerlach, T.M. Volcanic-gas studies: Methods, results and applications. In Volatiles in Magmas; Carroll, M.R., Holloway, J.R., Eds.; Mineralogical Society of America: Chantilly, VA, USA, 1994; Volume 30, pp. 1–60. [Google Scholar]
  2. De Moor, J.M.; Aiuppa, A.; Pacheco, J.; Avard, G.; Kern, C.; Liuzzo, M.; Martınez, M.; Giudice, G.; Fischer, T.P. Short-period volcanic gas precursors to phreatic eruptions: Insights from Poas Volcano, Costa Rica. Earth Planet. Sci. Lett. 2016, 442, 218–227. [Google Scholar] [CrossRef]
  3. Fischer, T.P.; Sturchio, N.C.; Stix, J.; Arehart, G.B.; Counce, D.; Williams, S.N. The chemical and isotopic composition of fumarolic gases and spring discharges from Galeras Volcano, Colombia. J. Volcanol. Geotherm. Res. 1997, 77, 229–253. [Google Scholar] [CrossRef]
  4. Maeno, F.; Nakada, S.; Oikawa, T.; Yoshimoto, M.; Komori, J.; Ishizuka, Y.; Takeshita, Y.; Shimano, T.; Kaneko, T.; Nagai, M. Reconstruction of a phreatic eruption on 27 September 2014 at Ontake volcano, central Japan, based on proximal pyroclastic density current and fallout deposits. EarthPlanets Space 2016, 68, 82. [Google Scholar] [CrossRef]
  5. Procter, J.N.; Cronin, S.J.; Zernack, A.V.; Lube, G.; Stewart, R.B.; Nemeth, K.; Keys, H. Debris flow evolution and the activation of an explosive hydrothermal, system, Te Maari, Tongariro, New Zealand. J. Volcanol. Geotherm. Res. 2014, 286, 303–316. [Google Scholar] [CrossRef]
  6. Komorowski, J.-C.; Boudon, G.; Semet, M.; Beauducel, F.; Antenor-Habazac, C.; Bazin, S.; Hammouya, G. Guadeloupe. In Volcanic Atlas of the Lesser Antilles; Lindsay, J.M., Robertson, R.E.A., Shepherd, J.B., Ali, S., Eds.; Seismic Research Unit, The University of the West Indies: Kingston, Jamaica, 2005; pp. 65–102. [Google Scholar]
  7. Giggenbach, G.F.; Sheppard, D.S. Variations in the temperature and chemistry of White Island fumarole discharges 1972–85. N. Z. Geol. Surv. Bull. 1989, 103, 119–126. [Google Scholar]
  8. Symonds, R.; Mizutani, Y.; Briggs, P. Long-term geochemical surveillance of fumaroles at Showa-Shinzan dome, Usu Volcano, Japan. J. Volcanol. Geotherm. Res. 1996, 73, 177–211. [Google Scholar] [CrossRef]
  9. Hammouya, G.; Allard, P.; Jean-Baptiste, P.; Parello, F.; Semet, M.; Young, S. Pre- and syn-eruptive geochemistry of volcanic gases from Soufriere Hills of Montserrat, West Indies. Geophys. Res. Lett. 1998, 25, 3685–3688. [Google Scholar] [CrossRef]
  10. Villemant, B.; Komorowski, J.C.; Dessert, C.; Michel, A.; Crispi, O.; Hammouya, G.; Beauducel, F.; De Chabalier, J.B. Evidence for a new shallow magma intrusion at La Soufrière of Guadeloupe (Lesser Antilles). Insights from long-term geochemical monitoring of halogen-rich hydrothermal fluids. J. Volcanol. Geotherm. Res. 2014, 285, 247–277. [Google Scholar] [CrossRef]
  11. Aiuppa, A.; Tamburello, G.; Di Napoli, R.; Cardellini, C.; Chiodini, G.; Giudice, G.; Grassa, F.; Pedone, M. First observations of the fumarolic gas output from a restless caldera: Implications for the current period of unrest (2005–2013) at Campi Flegrei. Geochem. Geophys. Geosyst. 2013, 14, 4153–4169. [Google Scholar] [CrossRef]
  12. Allard, P.; Aiuppa, A.; Beauducel, F.; Gaudin, D.; Di Napoli, R.; Calabrese, S.; Parello, F.; Crispi, O.; Hammouya, G.; Tamburello, G. Steam and gas emission rate from La Soufriere volcano, Guadeloupe (Lesser Antilles): Implications for the magmatic supply during degassing unrest. Chem. Geol. 2014, 384, 76–93. [Google Scholar] [CrossRef]
  13. Oppenheimer, C. Ultraviolet sensing of volcanic sulfur emissions. Elements 2010, 6, 87–92. [Google Scholar] [CrossRef]
  14. O’Dwyer, M.; Padgett, M.J.; McGonigle, A.J.S.; Oppenheimer, C.; Inguaggiato, S. Real time measurements of volcanic H2S/SO2 ratios by UV spectroscopy. Geophys. Res. Lett. 2003, 30. [Google Scholar] [CrossRef]
  15. Todesco, M.; Chiodini, G.; Macedonio, G. Monitoring and modelling hydrothermal fluid emission at La Solfatara (Phlegrean Fiels, Italy): An interdisciplinary approach to the study of diffuse degassing. J. Volcanol. Geotherm. Res. 2003, 125, 57–79. [Google Scholar] [CrossRef]
  16. Pedone, M.; Aiuppa, A.; Guidice, G.; Grassa, F.; Cardellini, C.; Chiodini, G.; Valenza, M. Volcanic CO2 flux measurements at Campi Flegrei by tunable diode laser absorption spectroscopy. Bull. Volcanol. 2014, 76, 812. [Google Scholar] [CrossRef]
  17. Aiuppa, A.; Fiorani, L.; Santoro, S.; Parracino, S.; Nuvoli, M.; Chiodini, G.; Minopoli, C.; Tamburello, G. New ground-based lidar enables volcanic CO2 flux measurements. Sci. Rep. 2015, 5, 13614. [Google Scholar] [CrossRef]
  18. Shinohara, H. A new technique to estimate volcanic gas composi- tion: Plume measurements with a portable multi-sensor system. J. Volcanol. Geotherm. Res. 2015, 143, 319–333. [Google Scholar] [CrossRef]
  19. Aiuppa, A.; Federico, C.; Giudice, G.; Gurrieri, S. Chemical mapping of a fumarolic field: La Fossa Crater, Vulcano Island (Aeolian Islands, Italy). Geophys. Res. Lett. 2005, 32, 1–4. [Google Scholar] [CrossRef]
  20. Aiuppa, A.; Shinohara, H.; Tamburello, G.; Giudice, G.; Liuzzo, M.; Moretti, R. Hydrogen in the gas plume of an open-vent volcano, Mount Etna, Italy. J. Geophys. Res. Solid Earth 2011, 116, 1–8. [Google Scholar] [CrossRef]
  21. Aiuppa, A.; Fischer, T.P.; Plank, T.; Robidoux, P.; Di Napoli, R. Along-arc, inter-arc and arc-to-arc variations in volcanic gas CO2/ST ratios reveal dual source of carbon in arc volcanism. Earth-Sci. Rev. 2017, 168, 24–47. [Google Scholar] [CrossRef]
  22. Moretti, R.; Komorowski, J.-C.; Ucciani, G.; Moune, S.; Jessop, D.; de Chabalier, J.-B.; Beauducel, F.; Bonifacie, M.; Burtin, A.; Vallee, M.; et al. The 2018 unrest phase at La Soufrière of Guadeloupe (French West Indies) andesitic volcano: Scrutiny of a failed but prodromal phreatic eruption. 2019; submitted. [Google Scholar]
  23. Allard, P.; Dimon, B.; Morel, P. Mise en évidence d’hélium primordial dans les émissions gazeuses de la Soufrière de Guadeloupe, Petites Antilles. In Proceedings of the 9th Réunion des Sciences de la Terre, Paris, France, 17–19 March 1982; p. 454. [Google Scholar]
  24. Ruzié, L.; Moreira, M.; Crispi, O. Noble gas isotopes in hydrothermal volcanic fluids of La Soufrière volcano, Guadeloupe, Lesser Antilles arc. Chem. Geol. 2012, 304, 158–165. [Google Scholar] [CrossRef]
  25. Ruzié, L.; Aubaud, C.; Moreira, M.; Agrinier, P.; Dessert, C.; Gréau, C.; Crispi, O. Carbon and helium isotopes in thermal springs of La Soufrière volcano (Guadeloupe, Lesser Antilles): Implications for volcanological monitoring. Chem. Geol. 2013, 359, 70–80. [Google Scholar] [CrossRef]
  26. Li, L.; Bonifacie, M.; Aubaud, C.; Crispi, O.; Dessert, C.; Agrinier, P. Chlorine isotopes of thermal springs in arc volcanoes for tracing shallow magmatic activity. Earth Planet. Sci. Lett. 2015, 413, 101–110. [Google Scholar] [CrossRef]
  27. Jean-Baptiste, P.; Allard, P.; Fourré, E.; Parello, F.; Aiuppa, A. Helium isotope systematics of volcanic gases and thermal waters of Guadeloupe Island, Lesser Antilles. J. Volcanol. Geotherm. Res. 2014, 283, 66–72. [Google Scholar] [CrossRef]
  28. OVSG-IPGP (1991–2018). Bilan Mensuel de l’activité Volcanique de la Soufrière de Guadeloupe et de la Sismicité Régionale. Monthly Public Report of Guadeloupe’s Volcanic and Seismic Activity (1999–2018). Observatoire Volcanologique et Sismologique de Guadeloupe, Institut de Physique du Globe de Paris. Available online: http://www.ipgp.fr/fr/ovsg/bulletins-mensuels-de-lovsg (accessed on 11 November 2019).
  29. Rosas-Carbajal, M.; Komorowski, J.-C.; Nicollin, F.; Gibert, D. Volcano electrical tomography unveils edifice collapse hazard linked to hydrothermal system structure and dynamics. Sci. Rep. 2016, 6, 29899. [Google Scholar] [CrossRef]
  30. Jacob, T.; Beauducel, F.; Hammouya, G.; David, J.G.; Komorowski, J.C. Ten years of extensometry at Soufrière of Guadeloupe: New constraints on the hydrothermal system. In Proceedings of the Soufriere Hills Volcano—Ten Years On international workshop, Seismic Research Unit, University of West Indies, Kingston, Jamaica, 24–30 July 2005. [Google Scholar]
  31. Boudon, G.; Semet, M.P.; Vincent, P.M. The evolution of la Grande Découverte (La Soufrière) volcano, Guadeloupe, F.W.I. In Volcano Hazards: Assessment and Monitoring; Latter, J., Ed.; Springer: Berlin, Germany, 1989; pp. 86–109. [Google Scholar]
  32. Boudon, G.; Komorowski, J.-C.; Villemant, B.; Semet, M.P. A new scenario for the last magmatic eruption of La Soufrière of Guadeloupe (Lesser Antilles) in 1530 A.D: Evidence from stratigraphy radiocarbon dating and magmatic evolution of erupted products. J. Volcanol. Geotherm. Res. 2008, 178, 474–490. [Google Scholar] [CrossRef]
  33. Feuillard, M.; Allègre, C.J.; Brandeis, G.; Gaulon, R.; Le Mouel, J.L.; Mercier, J.C.; Pozzi, J.P.; Semet, M.P. The 1975–1977 crisis of la Soufrière de Guadeloupe (F.W.I): A still-born magmatic eruption. J. Volcanol. Geotherm. Res. 1983, 16, 317–334. [Google Scholar] [CrossRef]
  34. Le Guern, F.; Bernard, A.; Chevrier, R.M. Soufriere of Guadeloupe 1976–1977 eruption: Mass and energy transfer and volcanic health hazards. Bull. Volcanol. 1980, 43, 578–592. [Google Scholar] [CrossRef]
  35. Komorowski, J.-C.; Peruzzetto, M.; Rosas-Carbajal, M.; Le Friant, A.; Mangeney, A.; Legendre, Y. New insights on flank-collapse and directed explosions hazards from hydrothermal éruptions at La Soufrière de Guadeloupe (Lesser Antilles). In Proceedings of the IAVCEI General Assembly, Portland, OR, USA, 14–18 August 2017. [Google Scholar]
  36. Villemant, B.; Hammouya, G.; Michel, A.; Semet, M.P.; Komorowski, J.C.; Boudon, G.; Cheminée, J.L. The memory of volcanic waters: Shallow magma degassing revealed by halogen monitoring in thermal springs of La Soufrière volcano (Guadeloupe, Lesser Antilles). Earth Planet. Sci. Lett. 2005, 237, 710–728. [Google Scholar] [CrossRef]
  37. Beauducel, F. Operational monitoring of French volcanoes: Recent advances in Guadeloupe. Géosciences 2006, 2, 64–68. [Google Scholar]
  38. Beauducel, F.; Bosson, A.; Randriamora, F.; Anténor-Habazac, C.; Lemarchand, A.; J-MSaurel, A.; Nercessian, A.; Bouin, M.-P.; de Chabalier, J.-B.; Clouard, V. Recent advances in the Lesser Antilles observatories—Part 2—WEBOBS: An integrated web-based system for monitoring and networks management. In Proceedings of the European Geosciences Union General Assembly, Vienna, Austria, 2–7 May 2010. [Google Scholar]
  39. Hirn, A.; Michel, B. Evidence of migration of main shocks during major seismovolcanic crises of la Soufrière (Guadeloupe, Lesser Antilles) in 1976. J. Volcanol. Geotherm. Res. 1979, 6, 295–304. [Google Scholar] [CrossRef]
  40. Poussineau, S. Dynamique des Magmas Andésitiques: Approche Expérimentale et Pétrostructurale, Application à la Soufrière de Guadeloupe et à la Montagne Pelée. Ph.D. Thesis, Université d’Orléans, Orléans France, 2005. [Google Scholar]
  41. Pichavant, M.; Poussineau, S.; Lesne, P.; Solaro, C.; Bourdier, J.L. Experimental Parametrization of Magma Mixing: Application to the ad 1530 Eruption of La Soufrière, Guadeloupe (Lesser Antilles). J. Petrol. 2018, 59, 257–282. [Google Scholar] [CrossRef]
  42. Bernard, M.L.; Molinié, J.; Petit, R.H.; Beauducel, F.; Hammouya, G.; Marion, G. Remote and in situ plume measurements of acid gas release from La Soufrière volcano, Guadeloupe. J. Volcanol. Geotherm. Res. 2006, 150, 395–409. [Google Scholar] [CrossRef]
  43. Brombach, T.; Marini, L.; Hunziker, J.C. Geochemistry of the thermal springs and fumaroles of Basse-Terre Island, Guadeloupe, Lesser Antilles. Bull. Volcanol. 2000, 61, 477–490. [Google Scholar] [CrossRef]
  44. Zlotnicki, J.; Feuillard, M.; Hammouya, G. Water circulations on La Soufrière volcano inferred by self-potential surveys (Guadeloupe, Lesser Antilles). Renew of volcanic activity? J. Geomagn. Geoelectr. 1994, 46–49, 797–813. [Google Scholar] [CrossRef]
  45. Allard, P.; Hammouya, G.; Parello, F. Diffuse magmatic soil degassing at Soufrière of Guadeloupe, Antilles. C. R. Acad. Sci. Paris Earth Planet. Sci. 1998, 327, 315–318. [Google Scholar]
  46. Jolivet, J. La crise volcanique de 1956 à la Soufrière de la Guadeloupe. Ann. Geophys. 1958, 14, 305. [Google Scholar] [CrossRef] [Green Version]
  47. Moussallam, Y.; Peters, N.; Masias, P.; Apaza, F.; Barnie, T.; Ian Schipper, C.; Curtis, A.; Tamburello, G.; Aiuppa, A.; Bani, P.; et al. Magmatic gas percolation through the old lava dome of El Misti volcano. Bull. Volcanol. 2017, 79, 46. [Google Scholar] [CrossRef]
  48. Tamburello, G. Ratiocalc: Software for processing data from multicomponent volcanic gas analyzers. Comput. Geosci. 2015, 82, 63–67. [Google Scholar] [CrossRef] [Green Version]
  49. McGonigle, A.J.S.; Inguaggiato, S.; Aiuppa, A.; Hayes, A.R.; Oppenheimer, C. Accurate measurement of volcanic SO2 flux: Determination of plume transport speed and integrated SO2 concentration with a single device. Geochem. Geophys. Geosyst. 2005, 6, Q02003. [Google Scholar] [CrossRef]
  50. Roberts, T.J.; Braban, C.F.; Oppenheimer, C.; Martin, R.S.; Freshwater, R.A.; Dawson, D.H.; Griffiths, P.T.; Cox, R.A.; Saffell, J.R.; Jones, R.L. Electrochemical sensing of volcanic gases. Chem. Geol. 2012, 332, 74–91. [Google Scholar] [CrossRef]
  51. Boichu, M.; Villemant, B.; Boudon, G. Degassing at La Soufrière de Guadeloupe volcano (Lesser Antilles) since the last eruptive crisis in 1975–77: Result of a shallow magma intrusion? J. Volcanol. Geotherm. Res. 2011, 203, 102–112. [Google Scholar] [CrossRef] [Green Version]
  52. Gaudin, D.; Beauducel, F.; Coutant, O.; Delacourt, C.; Richon, P.; de Chabalier, J.-B.; Hammouya, G. Mass and heat flux balance of La Soufrière volcano (Guadeloupe) from aerial infrared thermal imaging. J. Volcanol. Geotherm. Res. 2016, 320, 107–116. [Google Scholar] [CrossRef]
  53. Giggenbach, W.F. Redox processes governing the chemistry of fumarolic gas discharges from White Island, New Zeland. Appl. Geochem. 1987, 2, 143–161. [Google Scholar] [CrossRef]
  54. Symonds, R.B.; Gerlach, T.M.; Reed, M.H. Magmatic gas scrubbing: Implications for volcano monitoring. J. Volcanol. Geotherm. Res. 2001, 108, 303–341. [Google Scholar] [CrossRef]
  55. Reed, M.H.; Palandri, J. Sulfide mineral precipitation from hydrothermal fluids. Rev. Mineral. Geochem. 2006, 61, 609–631. [Google Scholar] [CrossRef]
  56. Venturi, S.; Tassi, F.; Cabassi, J.; Vaselli, O.; Minardi, I.; Neri, S.; Caponi, C.; Capasso, G.; Di Martino, R.M.; Ricci, A.; et al. A multi-instrumental geochemical approach to assess the environmental impact of CO2-rich gas emissions in a densely populated area: The case of Cava dei Selci (Latium, Italy). Appl. Geochem. 2019, 101, 109–126. [Google Scholar] [CrossRef]
  57. Moretti, R.; Arienzo, I.; Civetta, L.; Orsi, G.; Papale, P. Multiple magma degassing sources at an explosive volcano. Earth Planet. Sci. Lett. 2013, 367, 95–104. [Google Scholar] [CrossRef]
  58. Moretti, R.; De Natale, G.; Troise, C. A geochemical and geophysical reappraisal to the significance of the recent unrest at Campi Flegrei caldera (Southern Italy). Geochem. Geophys. Geosyst. 2017, 18, 1244–1269. [Google Scholar] [CrossRef]
  59. Kuster, D.; Silve, V. Guadeloupe-Canyons, Gouffres, Découverte; Editions GAP: Rhone-Alpes, France, 1997. [Google Scholar]
  60. Sen, P.N.; Goode, P.A. Influence of temperature on electrical conductivity on shaly sands. Geophysics 1992, 57, 89–96. [Google Scholar] [CrossRef]
  61. Revil, A.; Finizola, A.; Piscitelli, S.; Rizzo, E.; Ricci, T.; Crespy, A.; Angeletti, B.; Balasco, M.; Cabusson Barde, S.; Bennati, L.; et al. Inner structure of La Fossa di Vulcano (Vulcano Island, southern Tyrrhenian Sea, Italy) revealed by high-resolution electric resistivity tomography coupled with self-potential, temperature, and CO2 diffuse degassing measurements. J. Geophys. Res. Solid Earth 2008, 113, 1–21. [Google Scholar] [CrossRef] [Green Version]
Figure 1. (a) Map of the Lesser Antilles volcanic arc; (b) main structures and manifestations of the hydrothermal system at La Soufrière volcano showing the locations of thermal springs (blue circles), sites of exurgence of pressurized hydrothermal fluid (green triangles) during 1797–98, 1836 and 1976–77 phreatic eruptions [6,29], the main faults (blue-green), historical eruptive fractures and craters (black) and collapse structures (purple triangle on trace), the region of highest electrical conductivity (>1 S/m, light purple area) determined by Rosas-Carbajal et al. [29], active fumaroles (small and big yellow circles), 10 m DEM from GeoEye image, Latitude Geosystems; (c) 1 m resolution orthophoto (GeoEye) of the lava dome showing the main active fumaroles of the summit area (yellow circles) TAS: Tarissan crater; NAPN: Napoléon Nord; NAP: Napoléon 1 NPE1: Napoleon Est 1; NPE2: Napoléon Est 2; CS: Cratère Sud, which is divided into northern (CSN), central (CSC) and southern (CSS) vents; G56: Gouffre-56; LCS: Lacroix Supérieur, that is divided into LCS-1 and LCS-2; BLK1: Breislack fumarole; TY: Morne-Mitan fumarole along the Ty fault; (d) aerial photo of La Soufrière lava dome (October 2016) showing vegetation impacted by prolonged H2S- and HCl-rich acid gas emissions, photo taken by A. Anglade, OVSG-IPGP, with a drone from OBSERA and with permission by the Parc National de Guadeloupe).
Geosciences 09 00480 g001
Figure 2. (a) Number of earthquakes per year (grey bars) and associated released seismic energy (red line). (b) Spatial distribution, magnitude (circles size) and depth (false color scale) of 1799 seismic events recorded in 2007–2017 with longitudinal and latitudinal projections of their hypocenters (OVSG-IPGP, 1999–2018).
Geosciences 09 00480 g002
Figure 3. Example of MultiGAS recording of CO2, SO2, H2S and H2 co-variations in gas emissions from Gouffre-56 (G56), Cratère Sud (CS) and Gouffre Tarissan (TAS) fumaroles during walking profiles across the plumes in May 2016.
Geosciences 09 00480 g003
Figure 4. (a) MultiGAS setting for measuring gas concentrations between 1 to 3 m above the ground along a traverse perpendicular to the plume’s main axis and resulting (b) CO2 concentration profiles crossing G56 volcanic plume acquired on 10 May 2016. (c) Calculated fitting surface interpolating CO2 concentrations.
Geosciences 09 00480 g004
Figure 5. Gas compositions and trends in ternary diagrams (a) H2O-CO2-Stot and (b) CO2-SO2-H2S. Coloured circles represent MultiGAS-derived molar ratios of La Soufrière fumaroles in the period 2012–2017. Grey triangle: Montserrat-type magmatic end-member. Grey crosses: La Soufrère fumarolic gases during the 1976 eruptive crisis (see text). Dashed blue and red lines delineate the compositional ranges of CS fumarole obtained from direct sampling during the period 1997–2003 and 2004–2017, respectively.
Geosciences 09 00480 g005
Figure 6. Compared temporal variations of fumarolic gas fluxes, seismicity and dome’s fault extensometry at La Soufrière between 1992 and 2017. (a) Total dry gas flux and (b) and H2S and CO2 fluxes calculated from both H2S and CO2 ICAs (for 2006 and 2012 we used only H2S ICA-derived values). (c) Seismicity and (d,e) extent of opening or closing of fractures cross-cutting La soufrière summit dome revealed by extrensometric survey. (f) Vectors and amplitudes of fracture width variations and location of active fumaroles (yellow circles) shown in Figure 1. BLK1: Gouffre Breislack, DOL1: Fracture Dolomieu Est, DOL2: Fracture Dolomieu Ouest, DUP1: Gouffre Dupuy Ouest, DUP2: Gouffre Dupuy Est, F302: Faille du Nord-Ouest, F303: Faille 30 Août Bas, F8J1: Faille 8 Juillet 1976, FNO1: Fente du Nord, FNW1: Faille du Nord-Ouest, LCX1: Fracture Lacroix, NAP1: Cratère Napoléon, PEY1: Gouffre Peyssonnel ([28,30], and this work).
Geosciences 09 00480 g006
Figure 7. (a) Northwest-southeast cross-section of the La Soufrière lava dome with geometries of the main vents and cavities (from [59]). (b) West-East and (c) South-North slices of measured electrical conductivity with main isoconductivity contours shown for 1, 0.1, 0.001, and 0.001 S·m−1 from deep red to blue, respectively, as well as superimposed vents geometries of TAR, G56, BLK1 and CSS. Arrows with dashed lines represent hypothetical rising gas paths crossing the >0.1 S·m−1 hydrothermal water body and reaching TAR and CSS fumarolic vents. Instead, gases emitted from G56 and rising along the Breislack fault structure apparently bypass the main hydrothermal body (modified from [29]).
Geosciences 09 00480 g007
Table 1. Molar gas ratios in fumarolic emissions from La Soufrière volcano measured with MultiGAS in 2016-2017. Coordinates and gas temperature ranges are given for each fumarole. Overall molar compositions are reported only when H2O was determined.
Vent
Latitude
Longitude
Temperature
Time (GMT)H2O/H2SCO2/H2SSO2/H2SH2/H2SH2/H2OH2O%CO2%H2S%SO2%Stot%H2%
Gouffre 56
−61.66238
16.04347
nd
10/05/16 15:201574.73.8 × 10−20.042.4 × 10−496.42.90.60.020.60.02
10/05/16 15:151573.72.6 × 10−20.031.7 × 10−497.12.30.60.020.60.02
12/05/16 15:29nd4.54.0 × 10−20.04ndndndndndndnd
12/05/16 16:04nd3.9nd0.03ndndndndndndnd
12/05/16 15:301613.62.0 × 10−20.031.7 × 10−497.22.20.60.00.60.02
18/06/16 17:22nd3.82.0 × 10−20.03ndndndndndndnd
06/09/16 16:45nd3.71.3 × 10−20.7ndndndndndndnd
09/12/16 18:36nd3.92.8 × 10−30.04ndndndndndndnd
24/03/17 19:32nd3.22.7 × 10−2ndndndndndndndnd
31/10/17 16:15nd1.3ndndndndndndndndnd
South Crater N
−61.66286
16.04305
93.8–100.4 °C
10/05/16 16:001064.12.1 × 10−30.014.7 × 10−595.43.70.90.0020.90.004
10/05/16 16:051063.48.1 × 10−40.021.9 × 10−496.03.10.90.0010.90.02
12/05/16 16:201063.93.4 × 10−30.0121.1 × 10−495.63.50.90.0030.90.01
12/05/16 16:421063.23.4 × 10−30.0121.1 × 10−496.12.90.90.0030.90.01
18/06/16 16:22nd3.73.0 × 10−3ndndndndndndndnd
06/09/16 16:45nd2.9ndndndndndndndndnd
09/12/16 19:30nd3.11.0 × 10−30.012ndndndndndndnd
24/03/17 20:00nd2.91.5 × 10−3ndndndndndndndnd
31/10/17 19:25nd0.9ndndndndndndndndnd
South Crater S
−61.66281
16.04286
12/05/16 16:58473.29.8 × 10−30.0071.6 × 10−491.76.32.00.0192.00.01
12/05/16 16:30473.39.8·10−30.0071.6·10−491.66.41.90.0192.00.01
06/09/16 16:58nd2.92.0·10−3ndndndnd0.00.000ndnd
09/12/16 19:38nd4.0nd0.07ndndndndndndnd
24/03/17 20:16nd2.91.5·10−3ndndndndndndndnd
Tarissan
−61.66361
16.04373
10/05/16 16:25706.52.3·10−30.011.4·10−490.38.41.30.0031.30.013
10/05/16 18:252105.83.3·10−30.014.8·10−596.82.70.50.0020.50.005
10/05/16 16:261775.6ndndndndndndndndnd
10/05/16 18:301305.0ndndndndndndndndnd
12/05/16 17:31nd5.82.0 × 10−3ndndndndndndndnd
12/05/16 17:342185.5ndndndndndndndndnd
09/12/16 20:03nd4.7ndndndndndndndndnd
24/03/17 20:30nd5.6ndndndndndndndndnd
31/10/17 20:20nd2.4ndndndndndndndndnd
Napoleon
16.04369
−61.66327
40–60 °C
10/05/16 18:0215737.88.6 × 10−30.042.6 × 10−480.219.30.50.0040.50.021
Napoleon N
16.04389
−61.66316
93.5–95.5 °C
10/05/16 17:28236.32.5 × 10−20.031.3 × 10−375.820.83.30.13.40.1
18/06/16 17:44nd4.32.0 × 10−2ndndndndndndndnd
06/09/16 16:58nd4.52.8 × 10−2ndndndndndndndnd
10/12/16 20:02nd4.09.5 × 10−2ndndndndndndndnd
NF1
−61.662671
16.043580
40–60 °C
10/05/16 17:4435.68.3 × 10−40.025.4 × 10−333.656.210.10.00810.10.2
10/05/16 17:375.14.1nd0.023.1 × 10−349.840.39.8nd9.80.2
10/12/16 20:25nd4.8ndndndndndndndndnd
NF2
−61.662626
16.043659
40–60 °C
10/05/16 17:37175192.46.7 × 10−10.251.4 × 10−347.452.10.30.20.50.1
10/05/16 17:43175123.72.6 × 10−10.179.7 × 10−458.341.20.30.10.40.1
10/12/16 20:15nd1233.3 × 10−2ndndndndndndndnd
Breislack
−61.66111
16.04330
40–60°C
10/05/16 14:2545843.8nd0.224.7 × 10−491.18.70.2nd0.20.04
Ty fault
−61.66188
16.03871
40–60 °C
12/05/16 20:2214710.75.0 × 10−40.463.1 × 10−392.46.70.63 × 10−40.60.3
12/05/16 20:2714723.75.0 × 10−40.302.0 × 10−385.513.80.63 × 10−40.60.2
12/05/16 20:3114710.75.0 × 10−40.433.0 × 10−392.46.70.63 × 10−40.60.3
nd: not determined.
Table 2. CO2 and H2S gas fluxes at La Soufrière in 2016–2017 computed from both CO2 and H2S ICAs and CO2/H2S average molar ratios (see Section 4.1). Dry gas flux is calculated as the sum of CO2 and H2S. The sensor heights above the ground during MultiGAS traverses and the wind speed used for gas flux calculation are indicated.
DateSensors Heights (m)ICA H2S (ppm·m−2)ICA CO2 (ppm·m−2)Molar CO2/H2SPlume Speed (m·s−1)H2S Flux (ton·d−1)CO2 Flux (ton·d−1)H2S Flux (ton·d−1)CO2 Flux (ton·d−1)Dry Flux (ton·d−1)Dry Flux (ton·d−1)
South Crater (SCN+SCC+SCS) daily
average
ICA H2SICA H2S CO2/H2SICA CO2 CO2/H2SICA CO2ICA H2SICA CO2
27/03/2006
Allard et al. 2014
nd2610nd2.23.6 ± 1.81 ± 0.52.8 ± 1.4ndnd3.8 ± 1.9nd
07/03/2012
Allard et al. 2014
nd3940nd2.57 ± 2.12.8 ± 0.89 ± 2.7ndnd11.8 ± 3.6nd
10−12/05/20161, 2, 3144757983.56 ± 2.41 ± 0.44.7 ± 1.91.2 ± 0.55.4 ± 2.25.8 ± 2.46.6 ± 2.7
09/12/20161.7, 3104768613.64.4 ± 2.80.6 ± 0.42.6 ± 1.71 ± 0.74.7 ± 33.1 ± 25.7 ± 3.7
24/03/20170.8, 2.7200081392.95.4 ± 2.81.3 ± 0.74.9 ± 2.61.8 ± 16.8 ± 3.66.2 ± 3.38.6 ± 4.6
31/10/20170.8, 1.8474977740.93.3 ± 1.51.9 ± 0.92.2 ± 13.5 ± 1.64 ± 1.94.1 ± 1.97.5 ± 3.5
Gouffre56
10−12/05/20161, 2, 347029304.18.2 ± 2.90.5 ± 0.22.4 ± 0.90.7 ± 0.33.7 ± 1.32.9 ± 14.4 ± 1.6
09/12/20161.7, 330034163.914.1 ± 3.70.5 ± 0.22.6 ± 0.71.5 ± 0.47.5 ± 23.1 ± 0.99 ± 2.4
24/03/20170.8, 2.766033003.26.6 ± 2.60.5 ± 0.22.2 ± 0.90.8 ± 0.43.4 ± 1.32.7 ± 14.2 ± 1.7
31/10/20170.8, 1.8320770151.33.2 ± 1.41.2 ± 0.62 ± 0.92 ± 0.93.4 ± 1.53.3 ± 1.55.5 ± 2.5
Tarissan
07/03/2012
Allard et al. 2014
nd1360nd4.57.0 ± 2.11 ± 0.35.8 ± 1.8ndnd6.8 ± 2nd
10–12/05/20161, 2, 382051605.69.1 ± 2.80.9 ± 0.36.5 ± 21 ± 0.37.3 ± 2.37.4 ± 2.38.3 ± 2.6
09/12/20161.7, 376173364.74.9 ± 30.5 ± 0.32.7 ± 1.70.9 ± 0.65.6 ± 3.53.2 ± 26.5 ± 4
24/03/20170.8, 2.780660005.64.1 ± 2.60.4 ± 0.32.9 ± 1.90.5 ± 0.33.8 ± 2.53.3 ± 24.3 ± 2.8
31/10/20170.8, 1.8246873812.43.2 ± 2.21±0.73±21.2±0.93.7±2.63.9±2.74.9±3.4
Total
27/03/2006
Allard et al. 2014
7997nd 1 ± 0.52.8 ± 1.4ndnd3.8 ± 1.9nd
07/03/2012
Allard et al. 2014
7796nd 3.8 ± 1.214.8 ± 4.5ndnd18.6 ± 5.8nd
10–12/05/2016 4702930 2.4 ± 0.913.6 ± 4.82.9 ± 1.116.4 ± 5.716.1 ± 5.719.3 ± 6.75
09/12/2016 416713731 1.6±0.97.9±43.4±1.617.8±8.49.4±4.821.2±10
24/03/2017 21805160 2.2 ± 1.210 ± 5.53.2 ± 1.714 ± 7.312.2 ± 6.717.2 ± 9
31/10/2017 403520717 4.1 ± 2.17.2 ± 46.7 ± 3.311.1 ± 5.911.3 ± 617.9 ± 9.2

