Comparison of Different Measurement Techniques as Methodology for Surveying and Monitoring Stainless Steel Chimneys


Faculty of Civil and Environmental Engineering, Gdansk University of Technology, 80-233 Gdańsk, Poland
*
Author to whom correspondence should be addressed.
Geosciences 2019, 9(10), 429; https://doi.org/10.3390/geosciences9100429
Submission received: 25 September 2019
/
Accepted: 29 September 2019
/
Published: 2 October 2019
(This article belongs to the Special Issue Geodesy and Geomatics Engineering)
Abstract
:The measurement of a chimney axis is an engineering geodesy task. These measurements allow to assess the technical condition of chimneys and are usually carried out for reinforced concrete chimneys. When measuring high chimneys, the main problem may be the need to go a long distance to take a measurement. The surface of the chimney can also be problematic because it can absorb so much light from the range finder that total station reflectorless measurement or laser scanning will not be possible or will be affected by significant error. Chimneys made of stainless steel are also used today. They are not as high as reinforced concrete chimneys, but measuring them using reflectorless total stations or laser scanning can also be problematic. Problems arise from the reflective surface of these chimneys. The article presents a comparison of measurement results of a stainless steel chimney fragment obtained from total station measurement and laser scanning. Similarities and differences in the obtained axis of this chimney fragment are presented.
1. Introduction
In construction, periodic measurements of verticality of high chimney axes/tilt from vertical, measurements of planarity of cladding, panels, facade glazing, and structural deformations are very important [1]. In engineering and shipbuilding industries, it is often necessary to check dimensions and position of inaccessible devices or components without dismantling them and thus measurements are made under unusual conditions. Example of such measurements can be control and inventory shape measurements of various machines, installations, pipelines [2], pipes, chimneys, and plating of vessels [3]. Traditional and modern measuring instruments and devices are used for mentioned measurements works [4].
Chimney verticality measurements in static conditions are made using total stations, total stations with a built-in camera [5], and laser scanning [6]. In the case of dynamic displacement measurements, measurements with GPS receivers are used [7,8]. Accuracy of measurements made with total stations and laser scanners depend on surface type of the measured object (absorption capacity for laser beam from rangefinder and surface roughness). Research on the influence of surface type on measurements made by total stations and laser scanners and possibilities of their application are carried out, for example, by authors of [9,10,11,12,13,14,15,16]. One of the most difficult surface types to measure are reflective surfaces. This is because most of the laser beam is reflected from the surface, not scattered. As there are elements with a highly reflective surface, whose geometry must be controlled, several solutions have been created that enable their measurement [17,18,19]. An example of elements whose geometry must be controlled are mirrors of solar concentrators [20,21].
This article presents the use of a total station and a laser scanner to measure or control (from the available side) axis fragment of an operated chimney made of stainless steel. Results of measurements were presented and compared. Conclusions about the usefulness of two methods used to examine the verticality of stainless steel chimney’s axis fragment were formulated.
2. Location, Chimney Description, and Measurement Methods
The measured combustion chimney is located at research hall’s outer wall at Gdansk University of Technology. Chimney stiffening is a steel grate construction. Surface (background) directly behind the chimney is a large glazed area in the hall wall. Near the chimney, along wall of the hall, there is a built-in trim over a length of several meters and a width of over 1.0 m (Figure 1a).
To perform control tests of verticality of chimney’s fragment axis and compare results, two independent measuring technologies were used:
- measurements with Leica TS02 total station (angle measurement accuracy (standard deviation Hz, V, based on ISO 17123-3) 7″, distance measurement accuracy (standard deviation, based on ISO 17123-4): to a point on the foil 5 mm + 2 ppm, reflectorless measurement 2 mm + 2 ppm) [22] and
- measurements with Leica C10 laser scanner (accuracy of point location mapping over a distance of 1–50 m at a level of 6 mm) [23].
Before measurements, environment and spatial conditions at the chimney’s location were examined. Then, a spatial measuring matrix was designed and established in the local coordinate system x, y, z (Figure 1b). The location of measuring stations was chosen.
The measuring matrix points were established on grey metal cladding panels of the hall wall (points P1 and P2) and grating around the chimney (points P3 to P9). An additional parameter was the chimney’s circumference measured with measuring tape (L = 3020 mm) and radius calculated on its basis (R = 481 mm).
On the chimney mantle, four measuring levels with a height of 10 mm each were established. The lowest level was assumed at the height of 0.90 m above the surface at base of chimney and was treated as conventional ordinate 0.00 m (level L0). The other three levels were at heights 1.43 m (level L1), 1.75 m (level L2), and 2.08 m (level L3) relative to the chimney’s base level. Measuring levels were marked as green lines and named L0 to L3 as shown in Figure 1b.
Basic tests of verticality of the chimney’s fragment axis were started by measuring with a laser scanner from two stations, which lasted a total of about 20 min. The scanner stations were located 10 m from the chimney. Then, measurements were made with a total station from two stations 20 m away from chimney. The measurements at each station lasted about 10 min. Firstly, reflectorless measurements of established measurement levels were made. After completing reflectorless measurements, five reflective foils were placed on each established measurement levels. The foil’s location, if possible, was also measured from two stations.
3. Results
Laser scanner measurements gave a point cloud that should correspond to chimney surface. From the total station measurements, points were obtained that were to correspond to the chimney surface at established measurement levels (reflectorless measurements) and position of reflective geodetic foils attached to the chimney surface. To develop measurement results, OriginPro trial version software [24] and CloudCompare software [25] were used (for data obtained from a laser scanner). In the case of laser scanner measurement results, it was assumed that analysis will take points from +/− 0.5 cm range from established measurement levels.
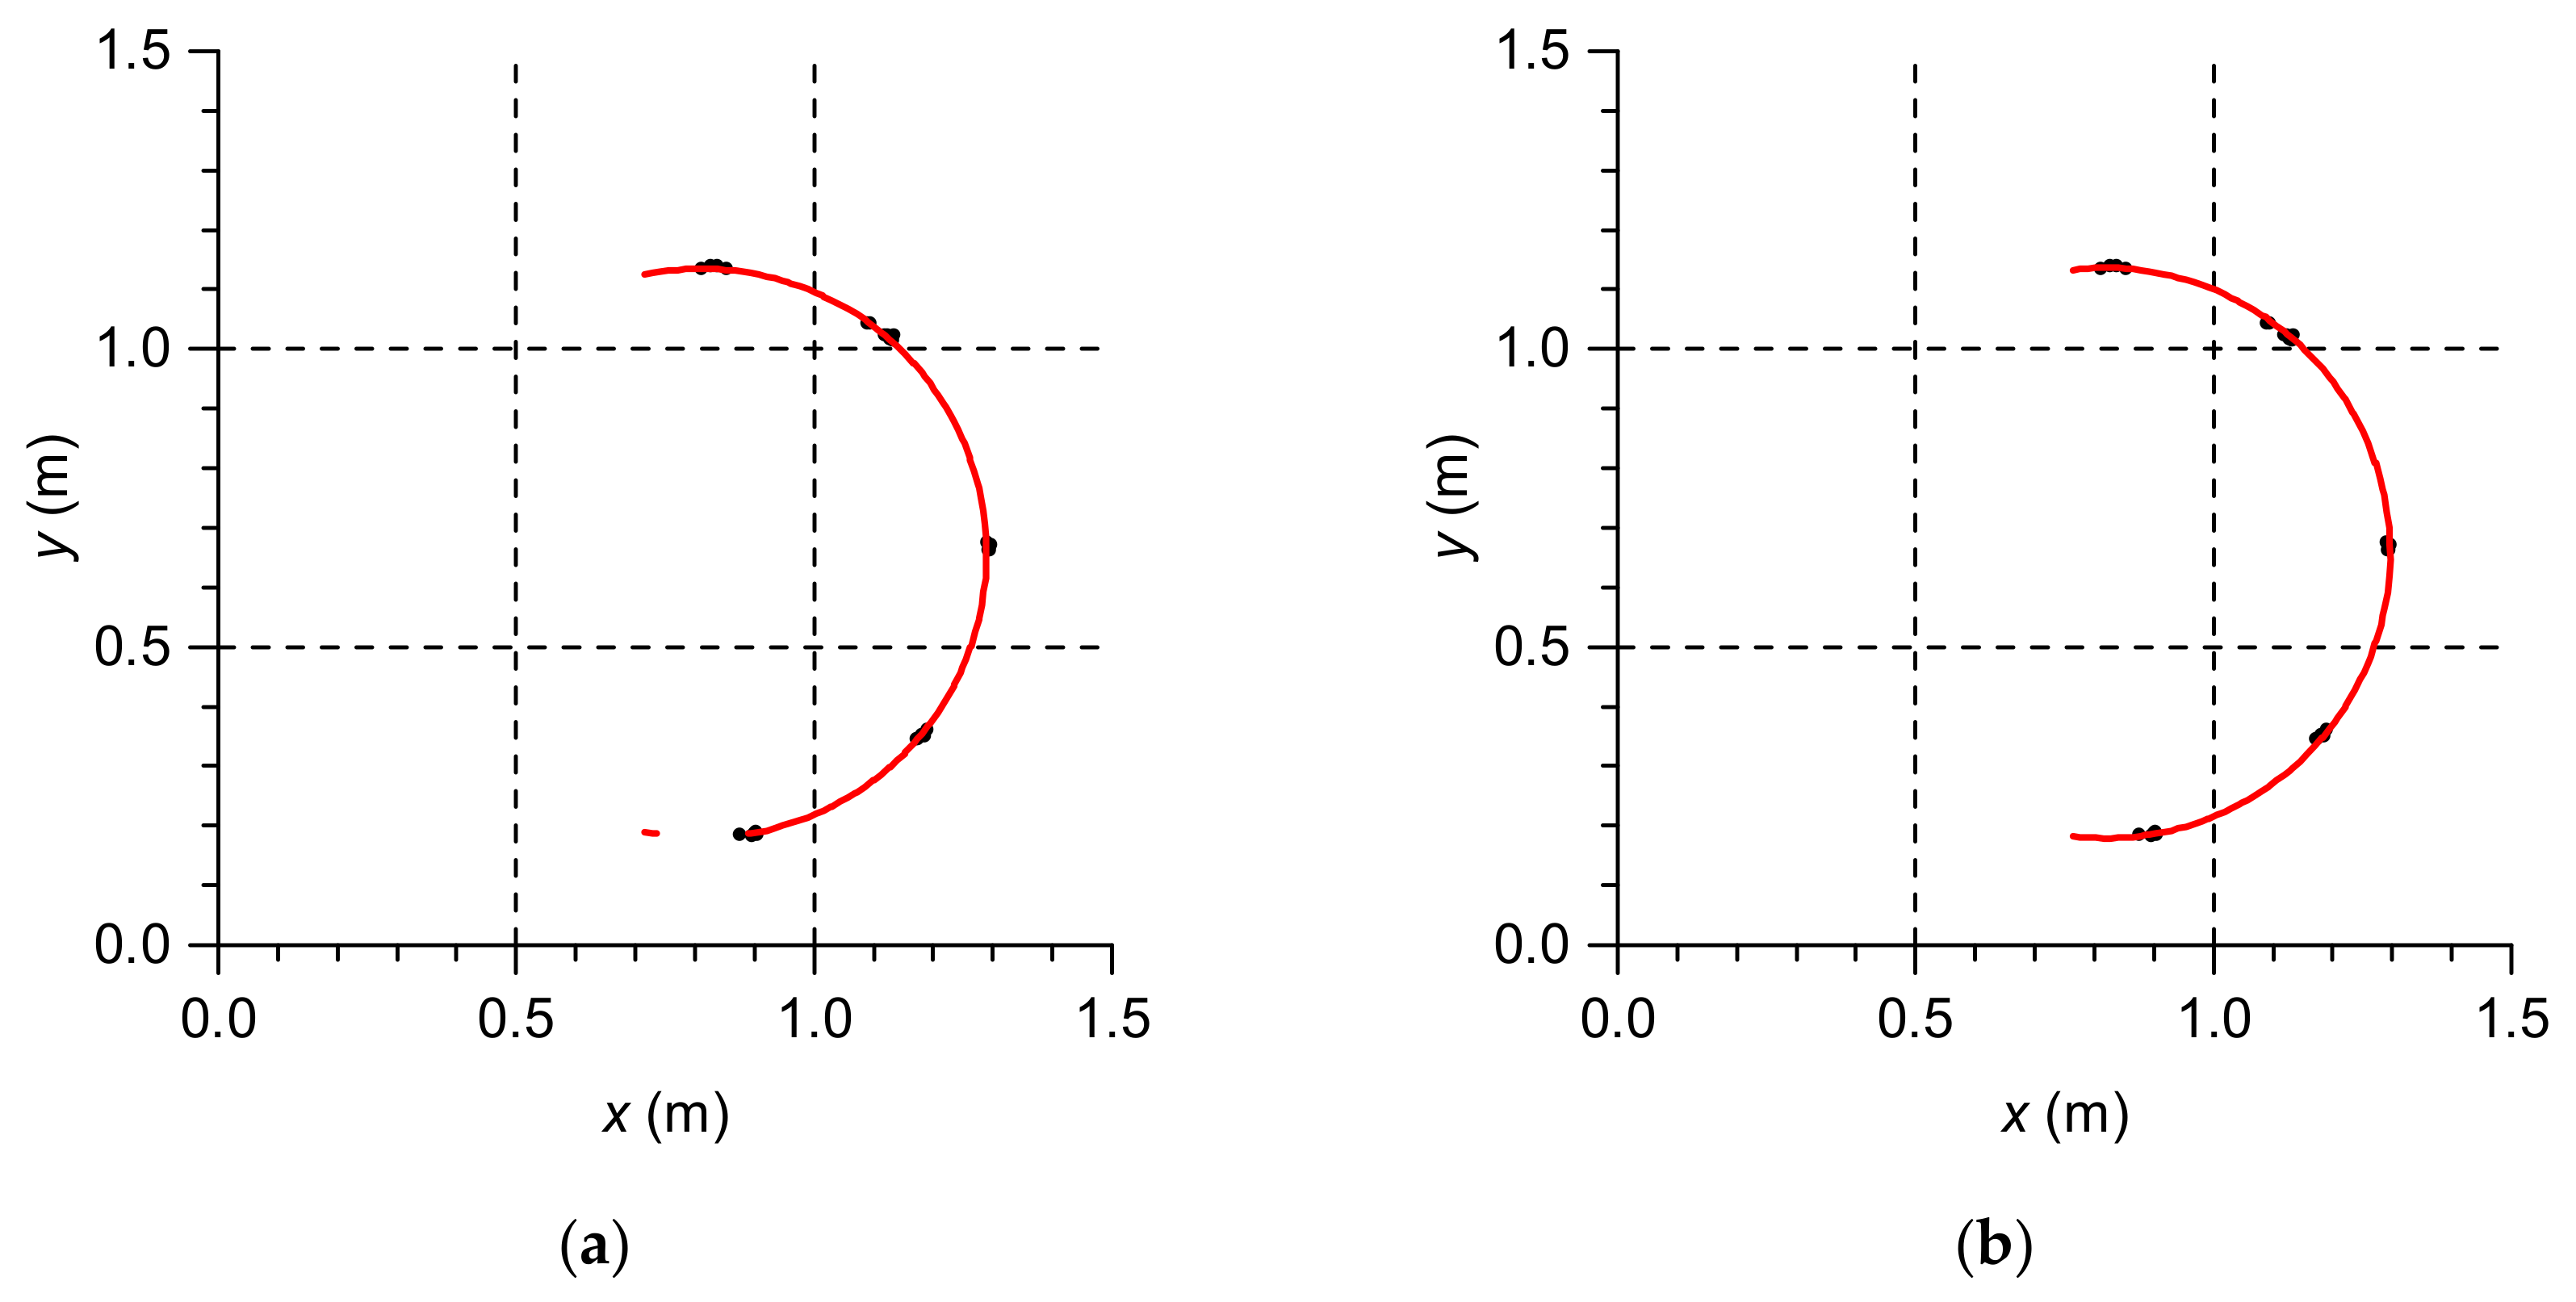
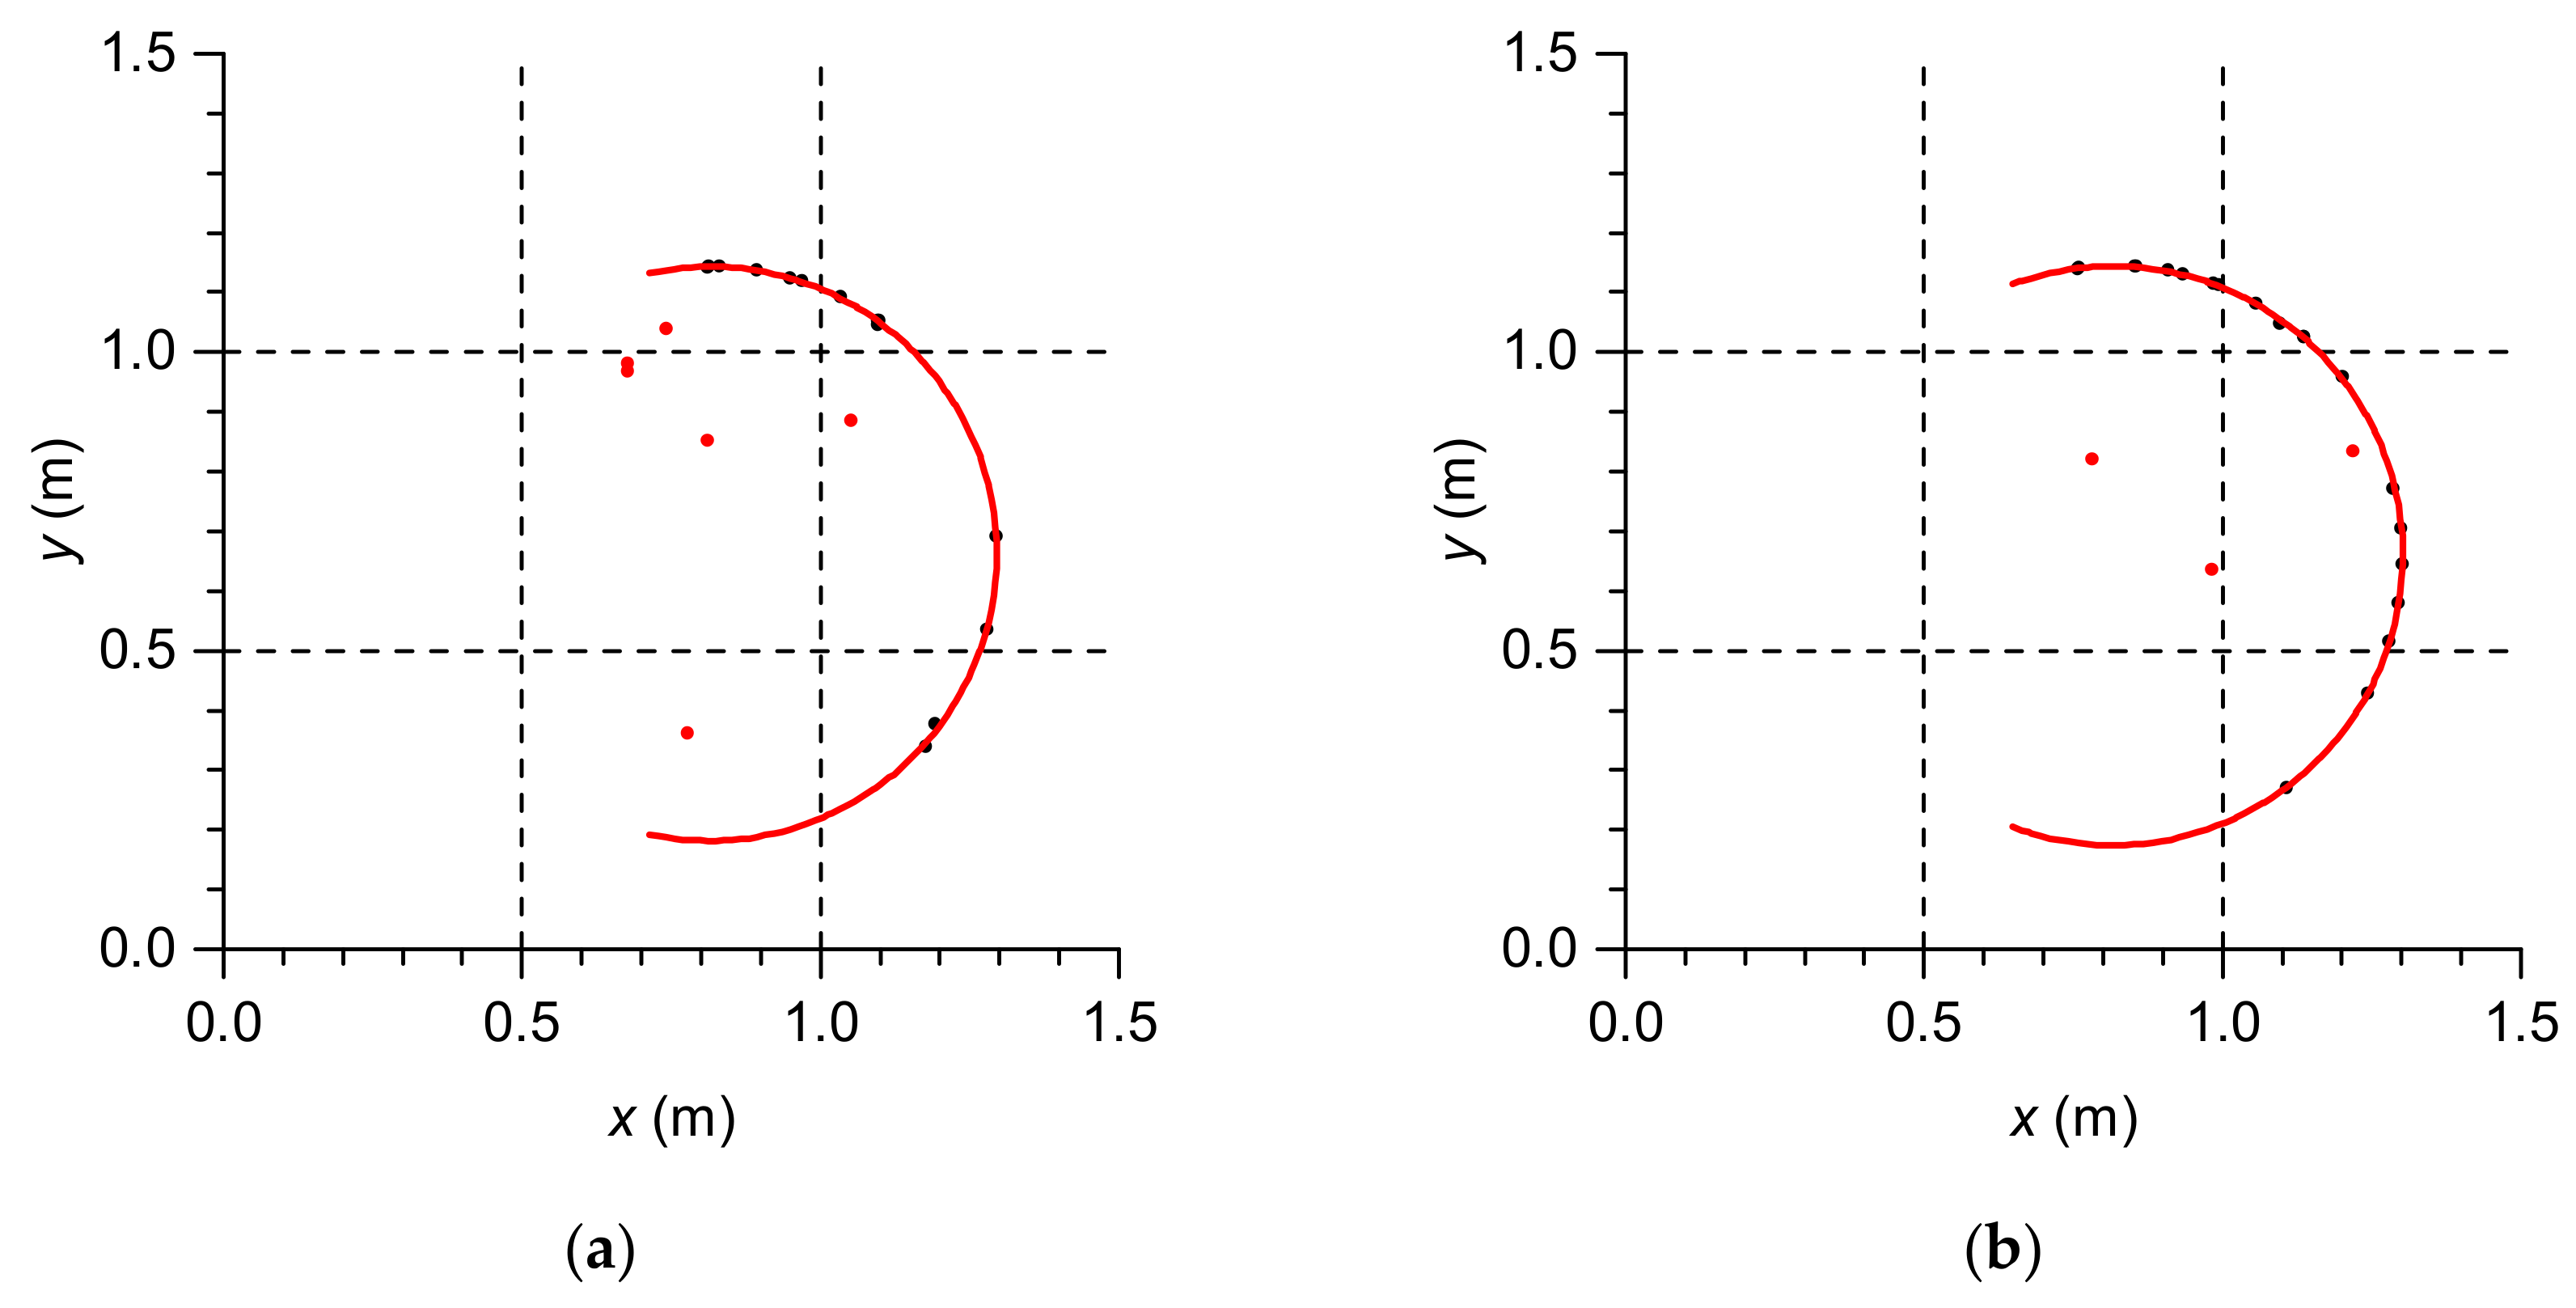
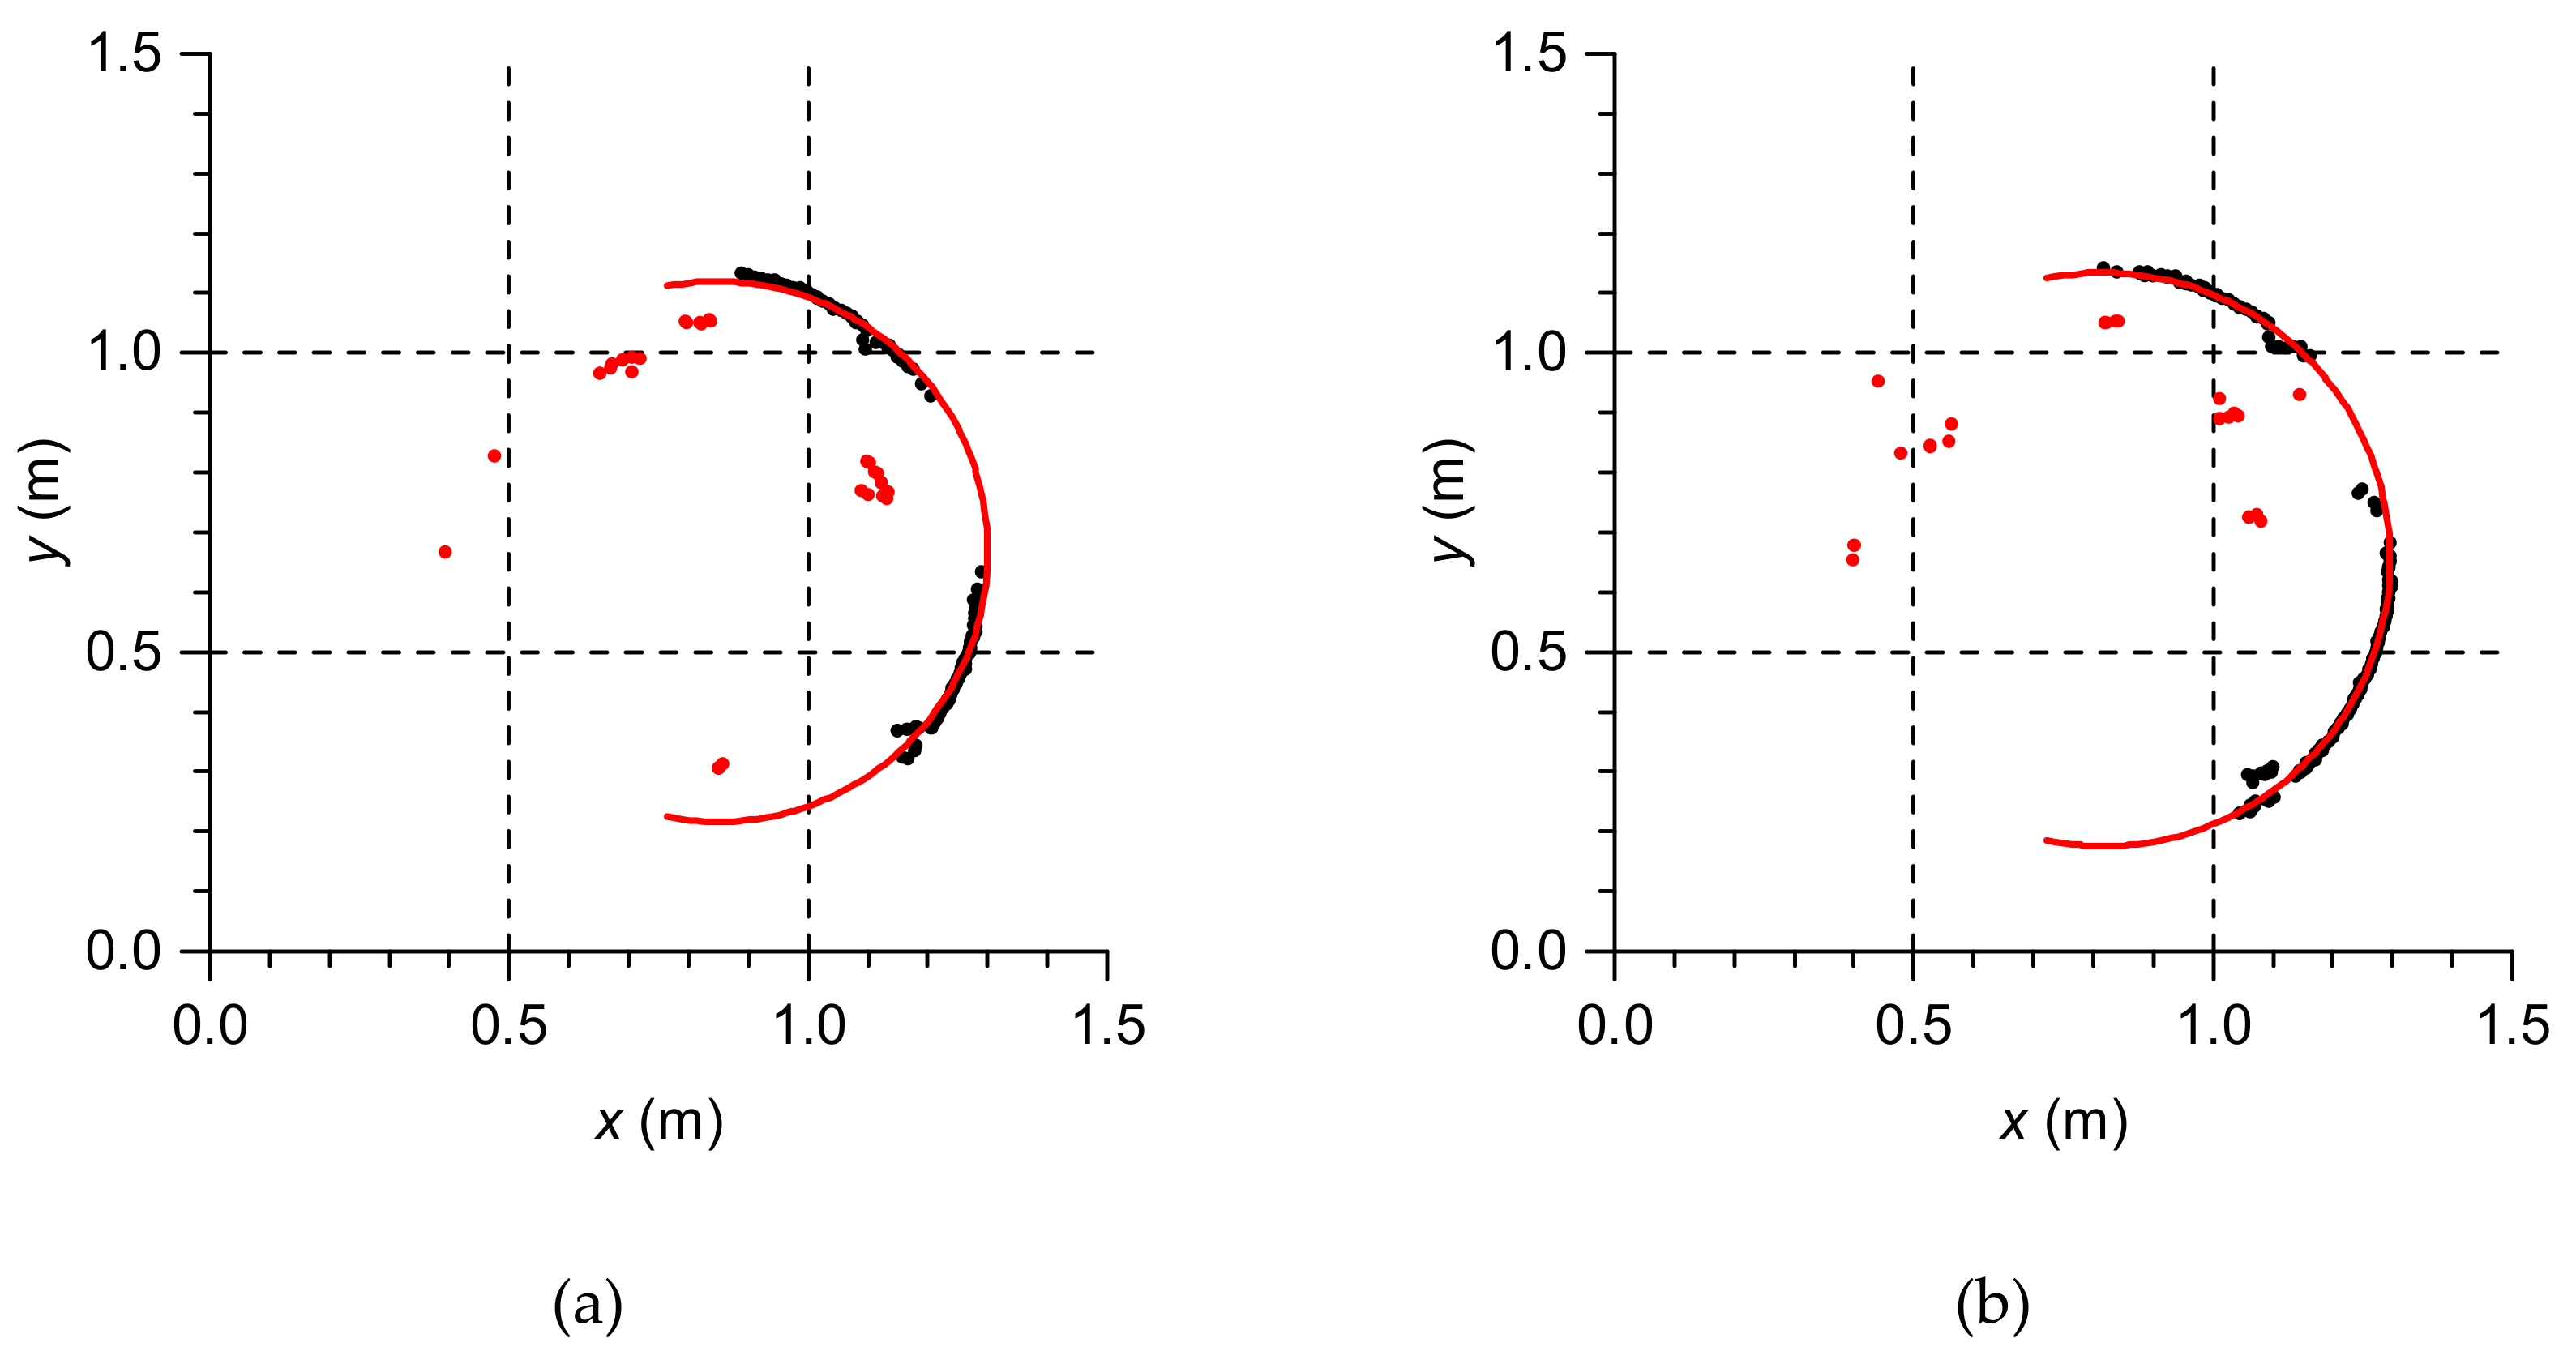
Each obtained data set at individual measurement levels was approximated by circles, obtaining x, y coordinates of the chimney cross-section center and its radius R at a given measurement level. Circle approximation was done in two stages. The first stage was approximating all measured points on a given measurement level with a circle. Then, the deviations of points from the obtained circle were analyzed. Points in which the distance to received circle were farther than doubled measurement accuracy were removed. The new sets of points were approximated by circles again. Measuring points used for circle approximation (black), unused measuring points (red), and circles which approximate measuring points after filtration (red) are shown in graphs in in Figure 2, Figure 3 and Figure 4.
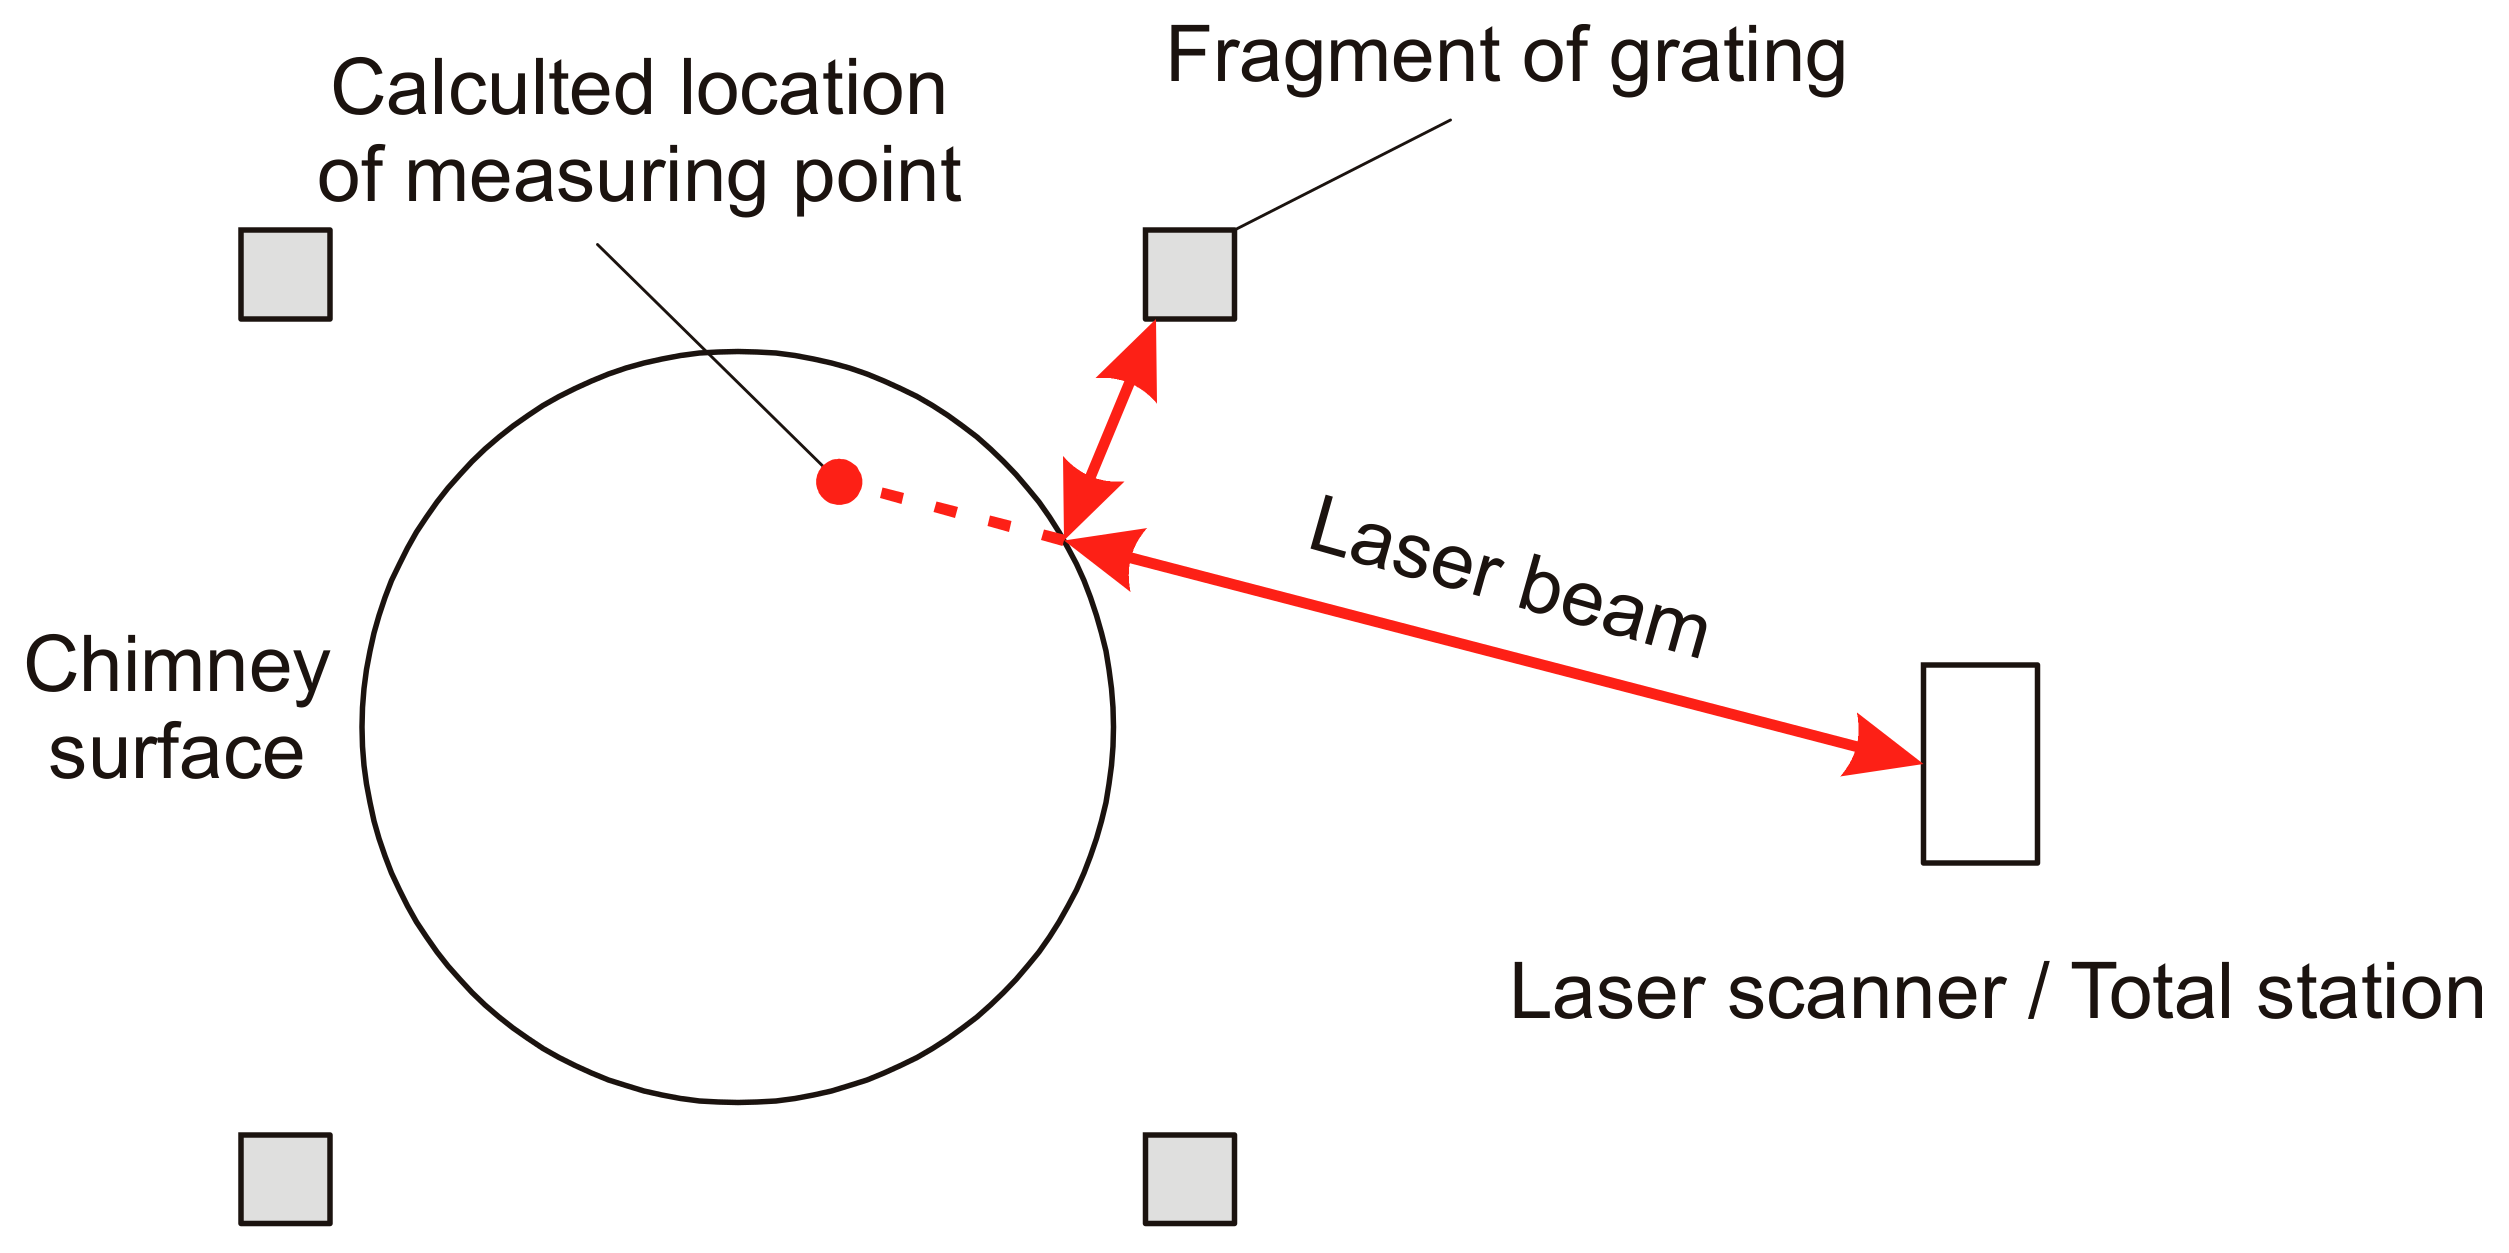
Points “inside the chimney” visible in Figure 4 and Figure 5 are points whose location was calculated by scanner/total station software based on incorrect distance measurement (overestimated) by rangefinder. In the case of incorrect measuring points, the course of laser beam was as follows (Figure 5):
- the laser beam emitted by rangefinder, after hitting the reflective surface of the chimney, reflects from the chimney’s surface line from the mirror and hits the surface of the grate element located near the chimney,
- the laser beam reflected from the grate element reflects from the surface of the chimney and returns to the laser rangefinder.
In Figure 5 red solid lines with arrows represent real direction of laser beam. The red dotted line represents the extended direction of laser beam before being reflected from the chimney surface.
Total stations and laser scanners (TLS) use polar coordinates (distance and two angles) to calculate the position of a point in a rectangular x, y, z coordinate system. Distance measurement is performed by a laser rangefinder. Overestimated distance used in point coordinate calculations mean that they seem to be located “inside” the chimney.
As was mentioned before, based of circumference measurement, radius of chimney R was calculated. Based on Equation (1), standard uncertainty of radius u(R) = 0.40 cm was calculated. Expanded uncertainty of radius U(R) = 0.80 cm was calculated for a confidence level of about 95%. Standard uncertainty of chimney circumference was estimated based on uncertainty consequently from the measuring tape (rectangle distribution shape for 1 cm scale at tape gives uncertainty equal 0.29 cm [26]) and imperfections during measurements (not equal stretch of tape, not horizontal placement of tape) and was estimated as u(L) = 1 cm.
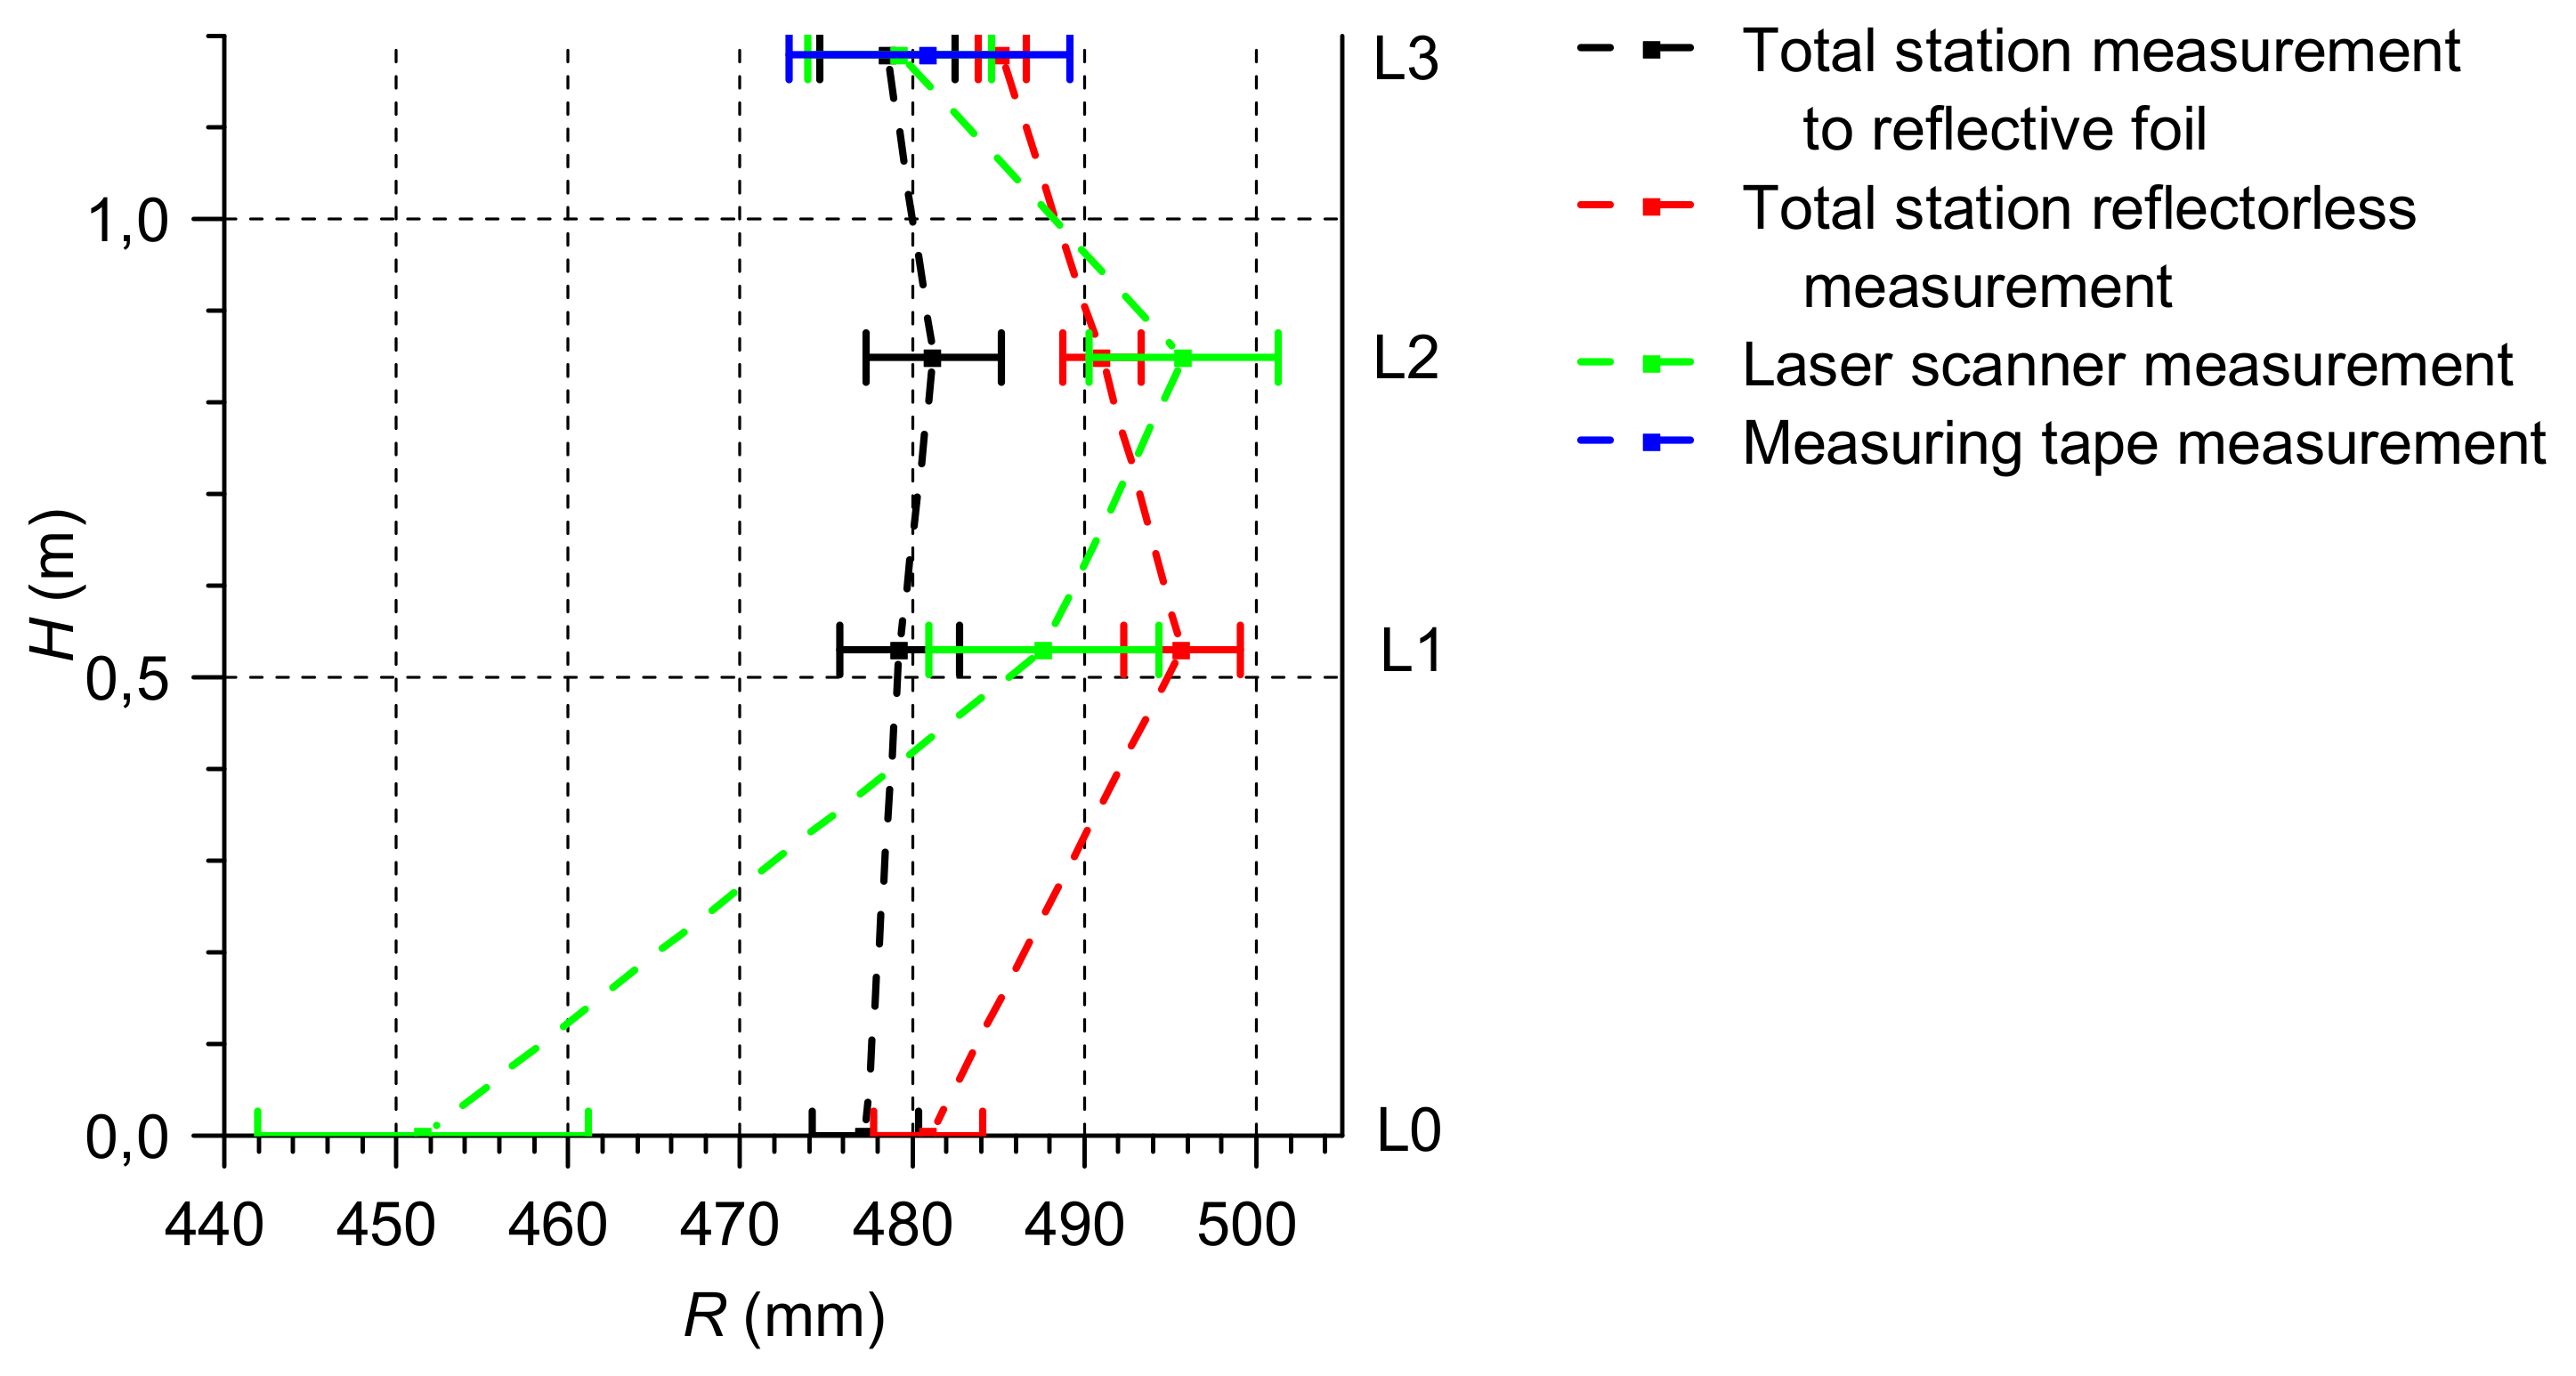
Received radius R of circles and their expanded uncertainty U(R) for considered measurement levels are presented in Table 1. The data contained in Table 1 are presented in Figure 6.
Based on x, y coordinates, deviation of cross-sectional centers at i-th measurement levels from a vertical line passing through center of the lowest measured cross-section was calculated using equation:
where: xi—x coordinate of circle center at i-th measurement level, yi—y coordinate of circle center at i-th measurement level, x0—x coordinate of circle center at the lowest measurement level, y0—y coordinate of circle center at the lowest measurement level.
Standard uncertainty of deviation of cross-sectional center from vertical line u(ri) was calculated as combined standard uncertainty (Equation (3)) [26]. Substituting into Equation (3) ri as f, calculating partial derivatives from ri (Equation (2)) we obtained Equation (4) for calculating standard uncertainty of deviation of cross-sectional centre from vertical line u(ri).
where: Δx—component of deviation of cross-section center from vertical line relative to x axis for i-th measurement level, Δy—component of deviation of cross-section center from vertical line relative to y axis for i-th measurement level, ri—deviation of cross-section center vertical line at i-th measurement level, u(xi)—standard uncertainty of determining x coordinate of circle center at i-th measurement level, u(yi)—standard uncertainty of determining y coordinate of circle center at i-th measurement level, u(x0)—standard uncertainty of determining x coordinate of circle center at the lowest measurement level, u(y0)—standard uncertainty of determining y coordinate of circle center at the lowest measurement level.
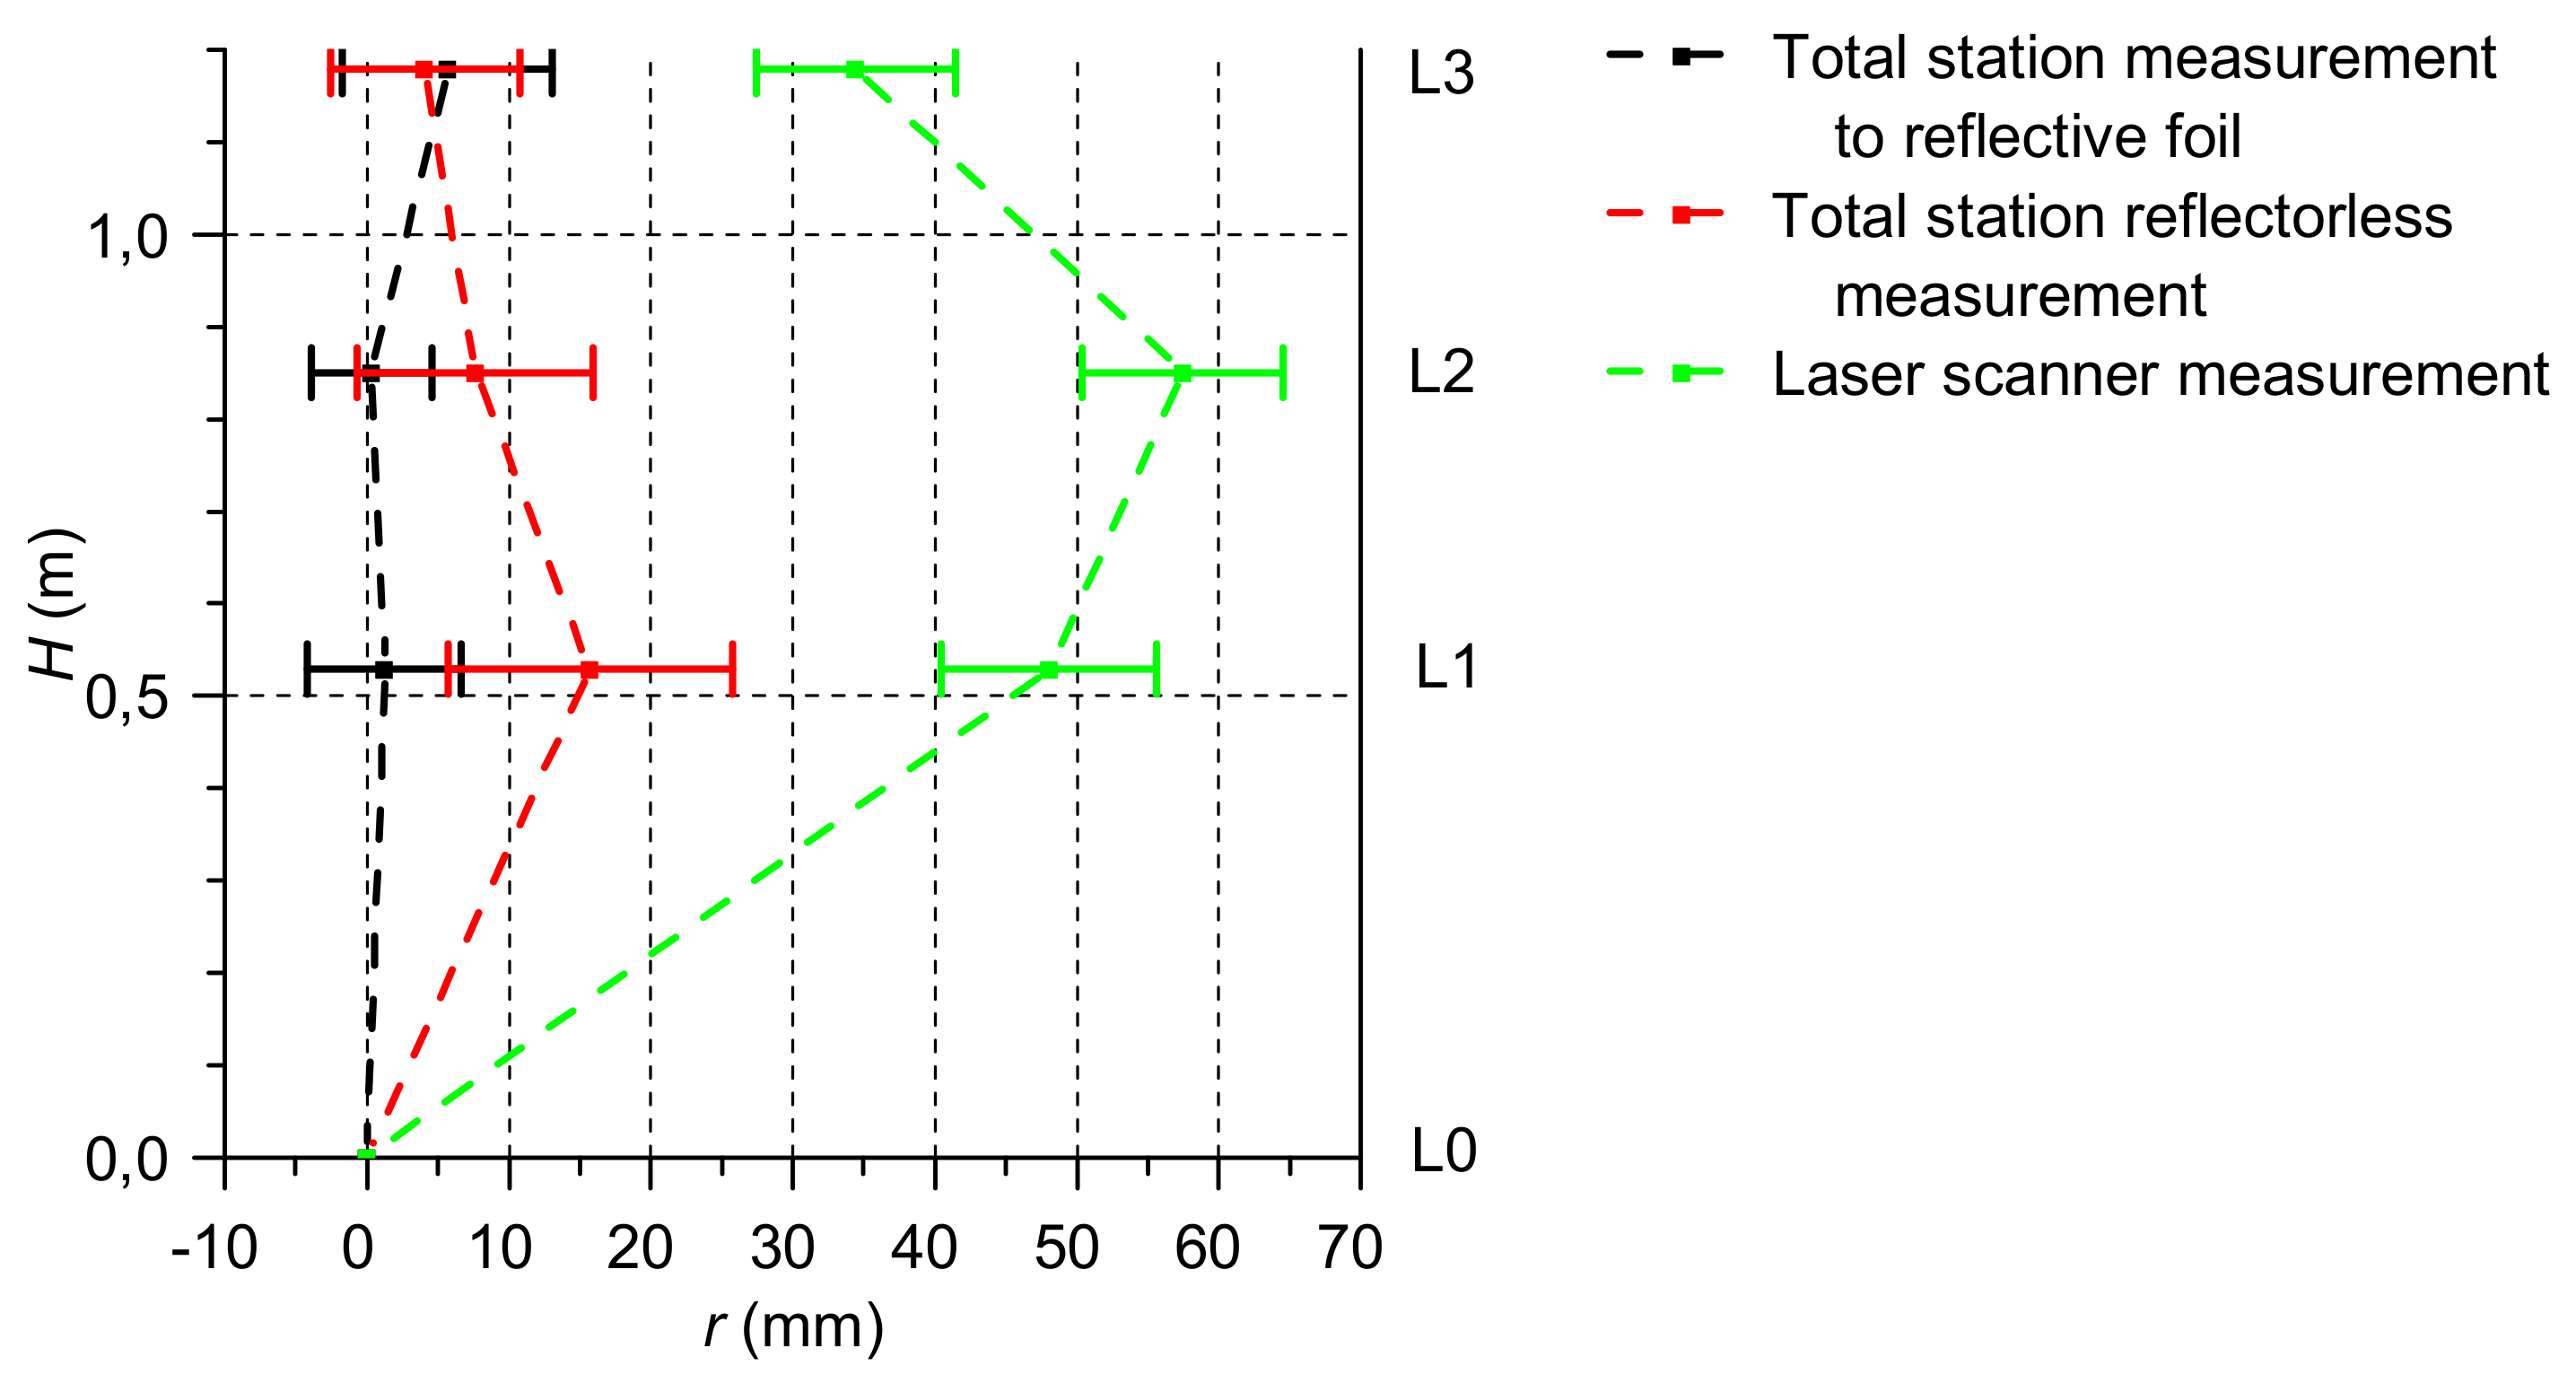
Deviation of cross-section center from a vertical line passing through the lowest measured cross-section r and their expanded uncertainties U(r) are presented in Table 2. Expanded uncertainties U(r) were calculated for a confidence level of about 95%. Data contained in Table 2 are presented in Figure 7.
To compare the cross-section radius for individual measurement levels obtained from measurements by various methods, a statistical test was used:
where: R1, R2—section radius obtained from two mutually compared measuring methods for a given measuring level, u(R1), u(R2)—standard uncertainties of cross-section radius obtained from two mutually compared measurement methods for a given measurement level.
As null hypothesis, the hypothesis about equality of cross-sectional’s radius obtained from measurements with two considered methods was adopted. The tape measure was a reference measurement. Despite the fact that measuring tape measurement had high measurement uncertainty, it was treated as a reference because of the lack of surface influence on circumference measurement by this method.
To compare deviation of cross-sectional center from the vertical line for individual measurement levels obtained from measurements by various methods, a statistical test was used:
where: r1, r2—deviations of cross-sectional center from the vertical line obtained from two mutually compared measuring methods for a given measuring level, u(r1), u(r2)—standard uncertainties of deviations of cross-sectional center from the vertical line obtained from two mutually compared measurement methods for a given measurement level.
The null hypothesis was the hypothesis about equality of deviation of cross-sectional center obtained from measurements with two considered methods. The reference measurement was total station’s measurement to reflective foils.
The first considered statistical test was a comparison of cross-section radius R obtained from total station reflectorless measurements and obtained from the measuring tape. The hypothesis about equality of obtained cross-section radius, at an established significance level, was rejected for a cross-section at 0.53 m and 0.85 m high.
The second considered statistical test was a comparison of cross-section radius R obtained from total station measurement to reflective foil and obtained from measuring tape. The hypothesis about equality of obtained cross-section radius, at an established significance level, was not rejected for all considered cross-sections.
The third considered statistical test was a comparison of cross-section radius R obtained from laser scanner measurements and obtained from measuring tape. The hypothesis about equality of obtained cross-section radius, at an established significance level, was not rejected only for a cross-section at a height of 1.18 m.
The fourth considered statistical test was a comparison of deviation of cross-sectional centers from vertical line r obtained from total station reflectorless measurements and measurement to reflective foils. The hypothesis about equality of obtained deviation of cross-section centers, at an established significance level, was rejected only for a cross-section at a height of 0.53 m.
The fifth and last considered statistical test was a comparison of deviation of cross-sectional centers from the vertical line r obtained from laser scanner measurements and total station measurement to reflective foils. The hypothesis about equality of obtained deviation of cross-section centers, at an established significance level, was rejected for any measurement level.
4. Conclusions
As expected, total station measurement to reflective foils were not a problem (Figure 2). The only difficulty was partly limited visibility of some measuring points caused by presence of steel grating stabilizing the chimney. For all measurement levels, the radius of chimney R was equal to the radius calculated based on measuring tape. If possible, measurements to reflectors mounted to chimney reflective surface should be performed.
Based on the measurements carried out, it can be seen that the process of measuring with a laser scanner and reflectorless measurements by total station were disturbed by the highly reflective steel surface of the chimney. This is noticeable in the distribution of measuring points (Figure 3 and Figure 4). Points located “inside” the chimney arose as a result of distance measurement to a grating surface located near the chimney. Thanks to filtration of measurement data, points which were clearly different from the approximated circle, were rejected.
In the case of a reflectorless total station measurements, a small number of points enabled quick identification of incorrectly measured points. For most of measurement levels, deviation of cross-sectional centers was equal to deviation calculated based on results of total station measurements to reflective foil. Despite filtering measurement results, cross-sectional radius R agreed with reference measurement only for half of the measurement levels. This measurement method should be used with caution if used for chimneys with reflective surfaces.
Results obtained from laser scanner measurements was the worst compared to other used methods. Deviations of cross-sectional centers were not similar to reference deviation. Only one cross-section had a similar radius R to the reference value. Laser scanner measurements should be avoided for stainless steel chimneys, especially if there are additional objects near chimneys.
Troubles with calculation of deviation r and radius R, based on laser scanner measurements, were caused by many points that were incorrectly measured due to the reflective surface and grating close to chimney. Performed filtration was not able to reject all incorrect points. Probably, filtration based on knowledge of position of objects near the chimney, approximate position of chimney’s surface, laser scanner station, and knowledge of incidence angle of a laser beam for which measurement to a reflective surface will not be possible. In this way, it will be possible to reproduce the directions and angles of the laser beam, which will likely measure objects other than the chimney surface. This technic will be similar to ray-tracing commonly used in computer graphics. This algorithm will be checked in future by authors of this article.
Author Contributions
Conceptualization, K.D.; Investigation, K.D.; Methodology, K.D.; Writing—review and editing, Z.K.
Funding
This research received no external funding.
Conflicts of Interest
The authors declare no conflict of interest.
References
- Włodarczyk, W. About some problems in designing of steel chimneys (O niektórych problemach projektowania kominów stalowych). Inżynieria i budownictwo 2004, 11, 591–596. (In Polish) [Google Scholar]
- Patil, A.K.; Holi, P.; Lee, S.K.; Chai, Y.H. An adaptive approach for the reconstruction and modeling of as-built 3D pipelines from point clouds. Autom. Constr. 2017, 75, 65–78. [Google Scholar] [CrossRef]
- Koelman, H.J. Application of a photogrammetry-based system to measure and re-engineer ship hulls and ship parts: An industrial practices-based report. Comput. Des. 2010, 42, 731–743. [Google Scholar] [CrossRef]
- Gawałkiewicz, R.; Skulich, M.; Szafarczyk, A. The application of modern surveying technologies in the process of the verticality control of slim objects, focus on an industrial chimney (Wykorzystanie nowoczesnych technologii geodezyjnych w procesie kontroli pionowości obiektów wysmukłych na przykładzie kominów przemysłowych). Geomatyka i inżynieria 2011, 2, 5–23. (In Polish) [Google Scholar]
- Zheng, S.; Ma, D.; Zhang, Z.; Hu, H.; Gui, L. A novel measurement method based on silhouette for chimney quasi-static deformation monitoring. Measurement 2012, 45, 226–234. [Google Scholar] [CrossRef]
- Kregar, K.; Ambrožič, T.; Kogoj, D.; Vezočnik, R.; Marjetič, A. Determining the inclination of tall chimneys using the TPS and TLS approach. Measurement 2015, 75, 354–363. [Google Scholar] [CrossRef]
- Breuer, P.; Chmielewski, T.; Górski, P.; Konopka, E. Application of GPS technology to measurements of displacements of high-rise structures due to weak winds. J. Wind. Eng. Ind. Aerodyn. 2002, 90, 223–230. [Google Scholar] [CrossRef]
- Górski, P. Investigation of dynamic characteristics of tall industrial chimney based on GPS measurements using Random Decrement Method. Eng. Struct. 2005, 83, 30–49. [Google Scholar] [CrossRef]
- Godin, G.; Beraldin, J.A.; Rioux, M.; Levoy, M.; Cournoyer, L. An Assessment of Laser Range Measurement of Marble Surfaces. In Proceedings of the 5th Conference on Optical 3-D Measurement Techniques, Vienna, Austria, 1–4 October 2001. [Google Scholar]
- Soudarissanane, S.; Lindenbergh, R.; Menenti, M.; Teunissen, P. Scanning geometry: Influencing factor on the quality of terrestrial laser scanning points. ISPRS J. Photogramm. Remote Sens. 2011, 66, 389–399. [Google Scholar] [CrossRef]
- Daliga, K.; Kurałowicz, Z. Examination method of the effect of the incidence angle of laser beam on distance measurement accuracy to surfaces with different colour and roughness. Boletim de Ciências Geodésicas 2016, 22, 420–436. [Google Scholar] [CrossRef]
- Tan, K.; Zhang, W.; Shen, F.; Cheng, X. Investigation of TLS intensity data and distance measurement errors from target specular freflections. Remote. Sens. 2018, 10, 1077. [Google Scholar] [CrossRef]
- Tang, P.; Akinci, B.; Huber, D. Quantification of edge loss of laser scanned data at spatial discontinuities. Autom. Constr. 2009, 18, 1070–1083. [Google Scholar] [CrossRef]
- Argüelles-Fraga, R.; Ordóñez, C.; García-Cortés, S.; Roca-Pardiñas, J. Measurement planning for circular cross-section tunnels using terrestrial laser scanning. Autom. Constr. 2013, 31, 1–9. [Google Scholar] [CrossRef]
- Suchocki, C.; Katzer, J. An example of harnessing Terrestrial Laser Scanner for remote sensing of saturation of chosen building materials. Constr. Build. Mater. 2016, 122, 400–405. [Google Scholar] [CrossRef]
- Prokop, A. Assessing the applicability of terrestrial laser scanning for spatial snow depth measurements. Cold Reg. Sci. Technol. 2008, 54, 155–163. [Google Scholar] [CrossRef]
- Pingel, U.; Dümmler, M.; Klaphecke, J. Method and apparatus for measuring the profile of reflective surfaces. U.S. Patent No. 6,392,754 B1, 21 May 2002. [Google Scholar]
- Wienand, S.; Rudert, A. Method and system for measuring the shape of a reflective surface. U.S. Patent No. 8,064,069 B2, 22 November 2011. [Google Scholar]
- Potapenko, S. Shape measurement of specular reflective surface. U.S. Patent No. 8.441.532 B2, 14 May 2013. [Google Scholar]
- Xiao, J.; Wei, X.; Lu, Z.; Yu, W.; Wu, H. A review of available methods for surface shape measurement of solar concentrator in solar thermal power applications. Renew. Sustain. Energy Rev. 2012, 16, 2539–2544. [Google Scholar] [CrossRef]
- Arancibia-Bulnes, C.A.; Peña-Cruz, M.I.; Mutuberría, A.; Díaz-Uribe, R.; Sánchez-González, M. A survey of methods for the evaluation of reflective solar concentrator optics. Renew. Sustain. Energy Rev. 2017, 69, 673–684. [Google Scholar] [CrossRef]
- Leica FlexLine TS02/TS06/TS09 User Manual; Leica Geosystems: St. Gallen, Switzerland, 2008.
- Leica ScanStation C10/C5 User Manual; Leica Geosystems: St. Gallen, Switzerland, 2011.
- OriginLab. Available online: www.originlab.com. (accessed on 20 August 2019).
- CloudCompare Version 2.6.1. Available online: https://www.danielgm.net/cc/. (accessed on 20 August 2019).
- Evaluation of Measurement Data—Guide to the Expression of Uncertainty in Measurement, Corrected Version 2010; JCGM. Available online: http://www.bipm.org/en/publications/guides/gum.html (accessed on 20 August 2019).
Figure 1.
(a) View of the steel chimney; (b) points arrangement of spatial measuring matrix around measured chimney.
Figure 1.
(a) View of the steel chimney; (b) points arrangement of spatial measuring matrix around measured chimney.

Figure 2.
Graph of measuring points obtained from total station measurements to reflective foils at measurement level (a) 0.00 m and (b) 1.18 m.
Figure 2.
Graph of measuring points obtained from total station measurements to reflective foils at measurement level (a) 0.00 m and (b) 1.18 m.

Figure 3.
Graphs of measuring points obtained from total station reflectorless (RL) measurement at measurement level (a) 0.00 m and (b) 1.18 m.
Figure 3.
Graphs of measuring points obtained from total station reflectorless (RL) measurement at measurement level (a) 0.00 m and (b) 1.18 m.

Figure 4.
Graphs of measuring points obtained from laser scanning at measurement level (a) 0.00 m and (b) 1.18 m.
Figure 4.
Graphs of measuring points obtained from laser scanning at measurement level (a) 0.00 m and (b) 1.18 m.

Figure 5.
Phenomenon diagram of measuring point appearing “inside” the chimney.

Figure 6.
Radius R at the considered chimney’s measurement levels.

Figure 7.
Deviation of cross-sectional centers from vertical line at considered measurement levels.


Table 1.
Radius of circles R and expanded uncertainty of radius U(R) obtained for considered measurement levels.
Table 1.
Radius of circles R and expanded uncertainty of radius U(R) obtained for considered measurement levels.
| H (m) | Total Station Measurement to Reflective Foils | Total Station Reflectorless Measurement | Laser Scanner Measurement | Measuring Tape Measurement | ||||
|---|---|---|---|---|---|---|---|---|
| R (mm) | U(R) (mm) | R (mm) | U(R) (mm) | R (mm) | U(R) (mm) | R (mm) | U(R) (mm) | |
| 0.00 | 477.3 | 3.1 | 480.9 | 3.2 | 451.6 | 9.6 | - | - |
| 0.53 | 479.3 | 3.4 | 495.7 | 3.4 | 487.7 | 6.7 | - | - |
| 0.85 | 481.3 | 3.9 | 491.0 | 2.3 | 495.8 | 5.5 | - | - |
| 1.18 | 478.6 | 3.9 | 485.2 | 1.4 | 479.3 | 5.3 | 480.6 | 8.0 |
Table 2.
Deviation of cross-section centers from a vertical line r and its expanded uncertainty U(r) for considered measurement levels.
Table 2.
Deviation of cross-section centers from a vertical line r and its expanded uncertainty U(r) for considered measurement levels.
| H (m) | Total Station Measurement to Reflective Foils | Total Station Reflectorless Measurement | Laser Scanner Measurement | |||
|---|---|---|---|---|---|---|
| r (mm) | U(r) (mm) | r (mm) | U(r) (mm) | r (mm) | U(r) (mm) | |
| 0.53 | 1.3 | 5.4 | 15.7 | 10.0 | 48.1 | 7.6 |
| 0.85 | 0.3 | 4.2 | 7.6 | 8.3 | 57.4 | 7.1 |
| 1.18 | 5.7 | 7.4 | 4.1 | 6.7 | 34.4 | 7.0 |
© 2019 by the authors. Licensee MDPI, Basel, Switzerland. This article is an open access article distributed under the terms and conditions of the Creative Commons Attribution (CC BY) license (http://creativecommons.org/licenses/by/4.0/).
Share and Cite
MDPI and ACS Style
Daliga, K.; Kurałowicz, Z. Comparison of Different Measurement Techniques as Methodology for Surveying and Monitoring Stainless Steel Chimneys. Geosciences 2019, 9, 429. https://doi.org/10.3390/geosciences9100429
AMA Style
Daliga K, Kurałowicz Z. Comparison of Different Measurement Techniques as Methodology for Surveying and Monitoring Stainless Steel Chimneys. Geosciences. 2019; 9(10):429. https://doi.org/10.3390/geosciences9100429
Chicago/Turabian StyleDaliga, Karol, and Zygmunt Kurałowicz. 2019. "Comparison of Different Measurement Techniques as Methodology for Surveying and Monitoring Stainless Steel Chimneys" Geosciences 9, no. 10: 429. https://doi.org/10.3390/geosciences9100429
Note that from the first issue of 2016, this journal uses article numbers instead of page numbers. See further details here.