When Proterozoic Crusts Became Thick: New Insights from Magma Petrology
by
 , , ,
, , ,
Jérôme Ganne
1,*, 
Xiaojun Feng
2,
Helen McFarlane
3,
Mélina Macouin
1,
Sonia Rousse
1,
Seta Naba
4,
Abraham Traoré
4 and
Florent Hodel
1 1
Geosciences Environnement Toulouse UMR 5563 & UR 234 IRD, Université Paul Sabatier, Avenue Edouard Belin 14, 31400 Toulouse, France
2
School of Safety Engineering, China University of Mining and Technology, Xuzhou 221116, Jiangsu, China
3
School of Earth, Atmosphere and Environment, Monash University, Clayton, VIC 3800, Australia
4
Laboratoire de Géologie, Université de Ouagadougou, Ouagadougou BP 1973, Burkina Faso
*
Author to whom correspondence should be addressed.
Geosciences 2018, 8(12), 428; https://doi.org/10.3390/geosciences8120428
Submission received: 8 October 2018
/
Revised: 5 November 2018
/
Accepted: 19 November 2018
/
Published: 22 November 2018
(This article belongs to the Section Geochemistry)
Abstract
:The Earth’s continental crust represents the outermost envelope of the solid Earth, controlling exchanges within the geosphere and reflecting geodynamics processes. One of the fundamental issues of Earth Science aims to determine crustal thickness in past geodynamic environments in order to discuss the evolution of certain geodynamic processes through time. Despite presenting a continuing challenge, the evolution of crustal thickness during the last 3 billion years can be investigated using indirect clues yielded by the chemical signature of mafic magmas and associated ferromagnesian minerals (pyroxene, amphibole). Here, we present a new statistical assessment of a global database of magmatic and mineral chemical information. Analysis reveals the increasing occurrence of high-temperature pyroxenes and amphiboles growing in Ca-rich, Fe-poor magma since ~1 Ga, which contrasts with lower temperature conditions of minerals crystallization throughout the Meso- and Palaeoproterozoic times. This is interpreted to reflect temporal changes in the control of Earth’s crust on mantle-derived magma composition, related to changes in lithospheric thickness and mantle secular cooling. We propose that thick existing crust is associated with deeper, hotter magmatic reservoirs, potentially elucidating the mineral chemistry and the contrasting iron content between primary and derivative mafic magmas. Based on both the chemical and mineral information of mafic magma, an integrated approach provides qualitative estimates of past crustal thickness and associated magmatic systems. Our findings indicate that the Proterozoic was characterized by thicker crustal sections (>40–50 km) relative to the Phanerozoic and Archean (<35 km). This period of crustal thickening appears at the confluence of major changes on Earth, marked by the onset of mantle cooling and Plate Tectonics and the assembly of Columbia, the first supercontinent.
1. Introduction
The continental crust provides a window into past geodynamic processes. However, its thickness in the Archean and Proterozoic times remains an unresolved issue. On this knowledge hinges key parameters for geodynamics models aimed at testing secular changes in tectonics processes and continental crust formation ([1,2] among many others). For some authors, secular change in crustal thickness followed the progressive cooling of the mantle since 2.5 Gyrs [3,4]. The thickest crusts are therefore expected in the Archean compared to the Proterozoic times, acknowledging that the melting of hotter mantle should result in thickest crustal sections of mafic composition. For others, the secular cooling of the mantle predated change in crustal thickness, acknowledging that hotter thermal gradients in the Archean crusts should limit their thickening ([5,6] and Ref. therein). It was also argued that crustal thickening in a lithospheric section can be modulated by the presence of water and increasing differentiation of the continental crust toward felsic composition in the Precambrian, triggered by the advent of plate tectonic processes, should result in progressively thicker sections with time [7].
Unfortunately, such controversy surrounding evolutionary models of the continental crust has not been resolved by geophysical investigations on the Moho. In the most recent compilation of seismic images, the global average crust is apparently thickest in Proterozoic provinces relative to Archean ones [8,9]. These comparisons, however, face a number of uncertainties related to the interpretation of seismic reflectors and their apparent arbitrary selection within individual provinces [10]. In short, it would mask a more heterogeneous Moho whose depth doesn’t necessarily follow a secular evolution. Different lines of evidence also suggest that the architecture of the crust has often been modified by multiple tectono-metamorphic and magmatic events and that, potentially, the present-day interpretation of the associated Moho depth doesn’t accurately reflect the original crustal thickness [11,12].
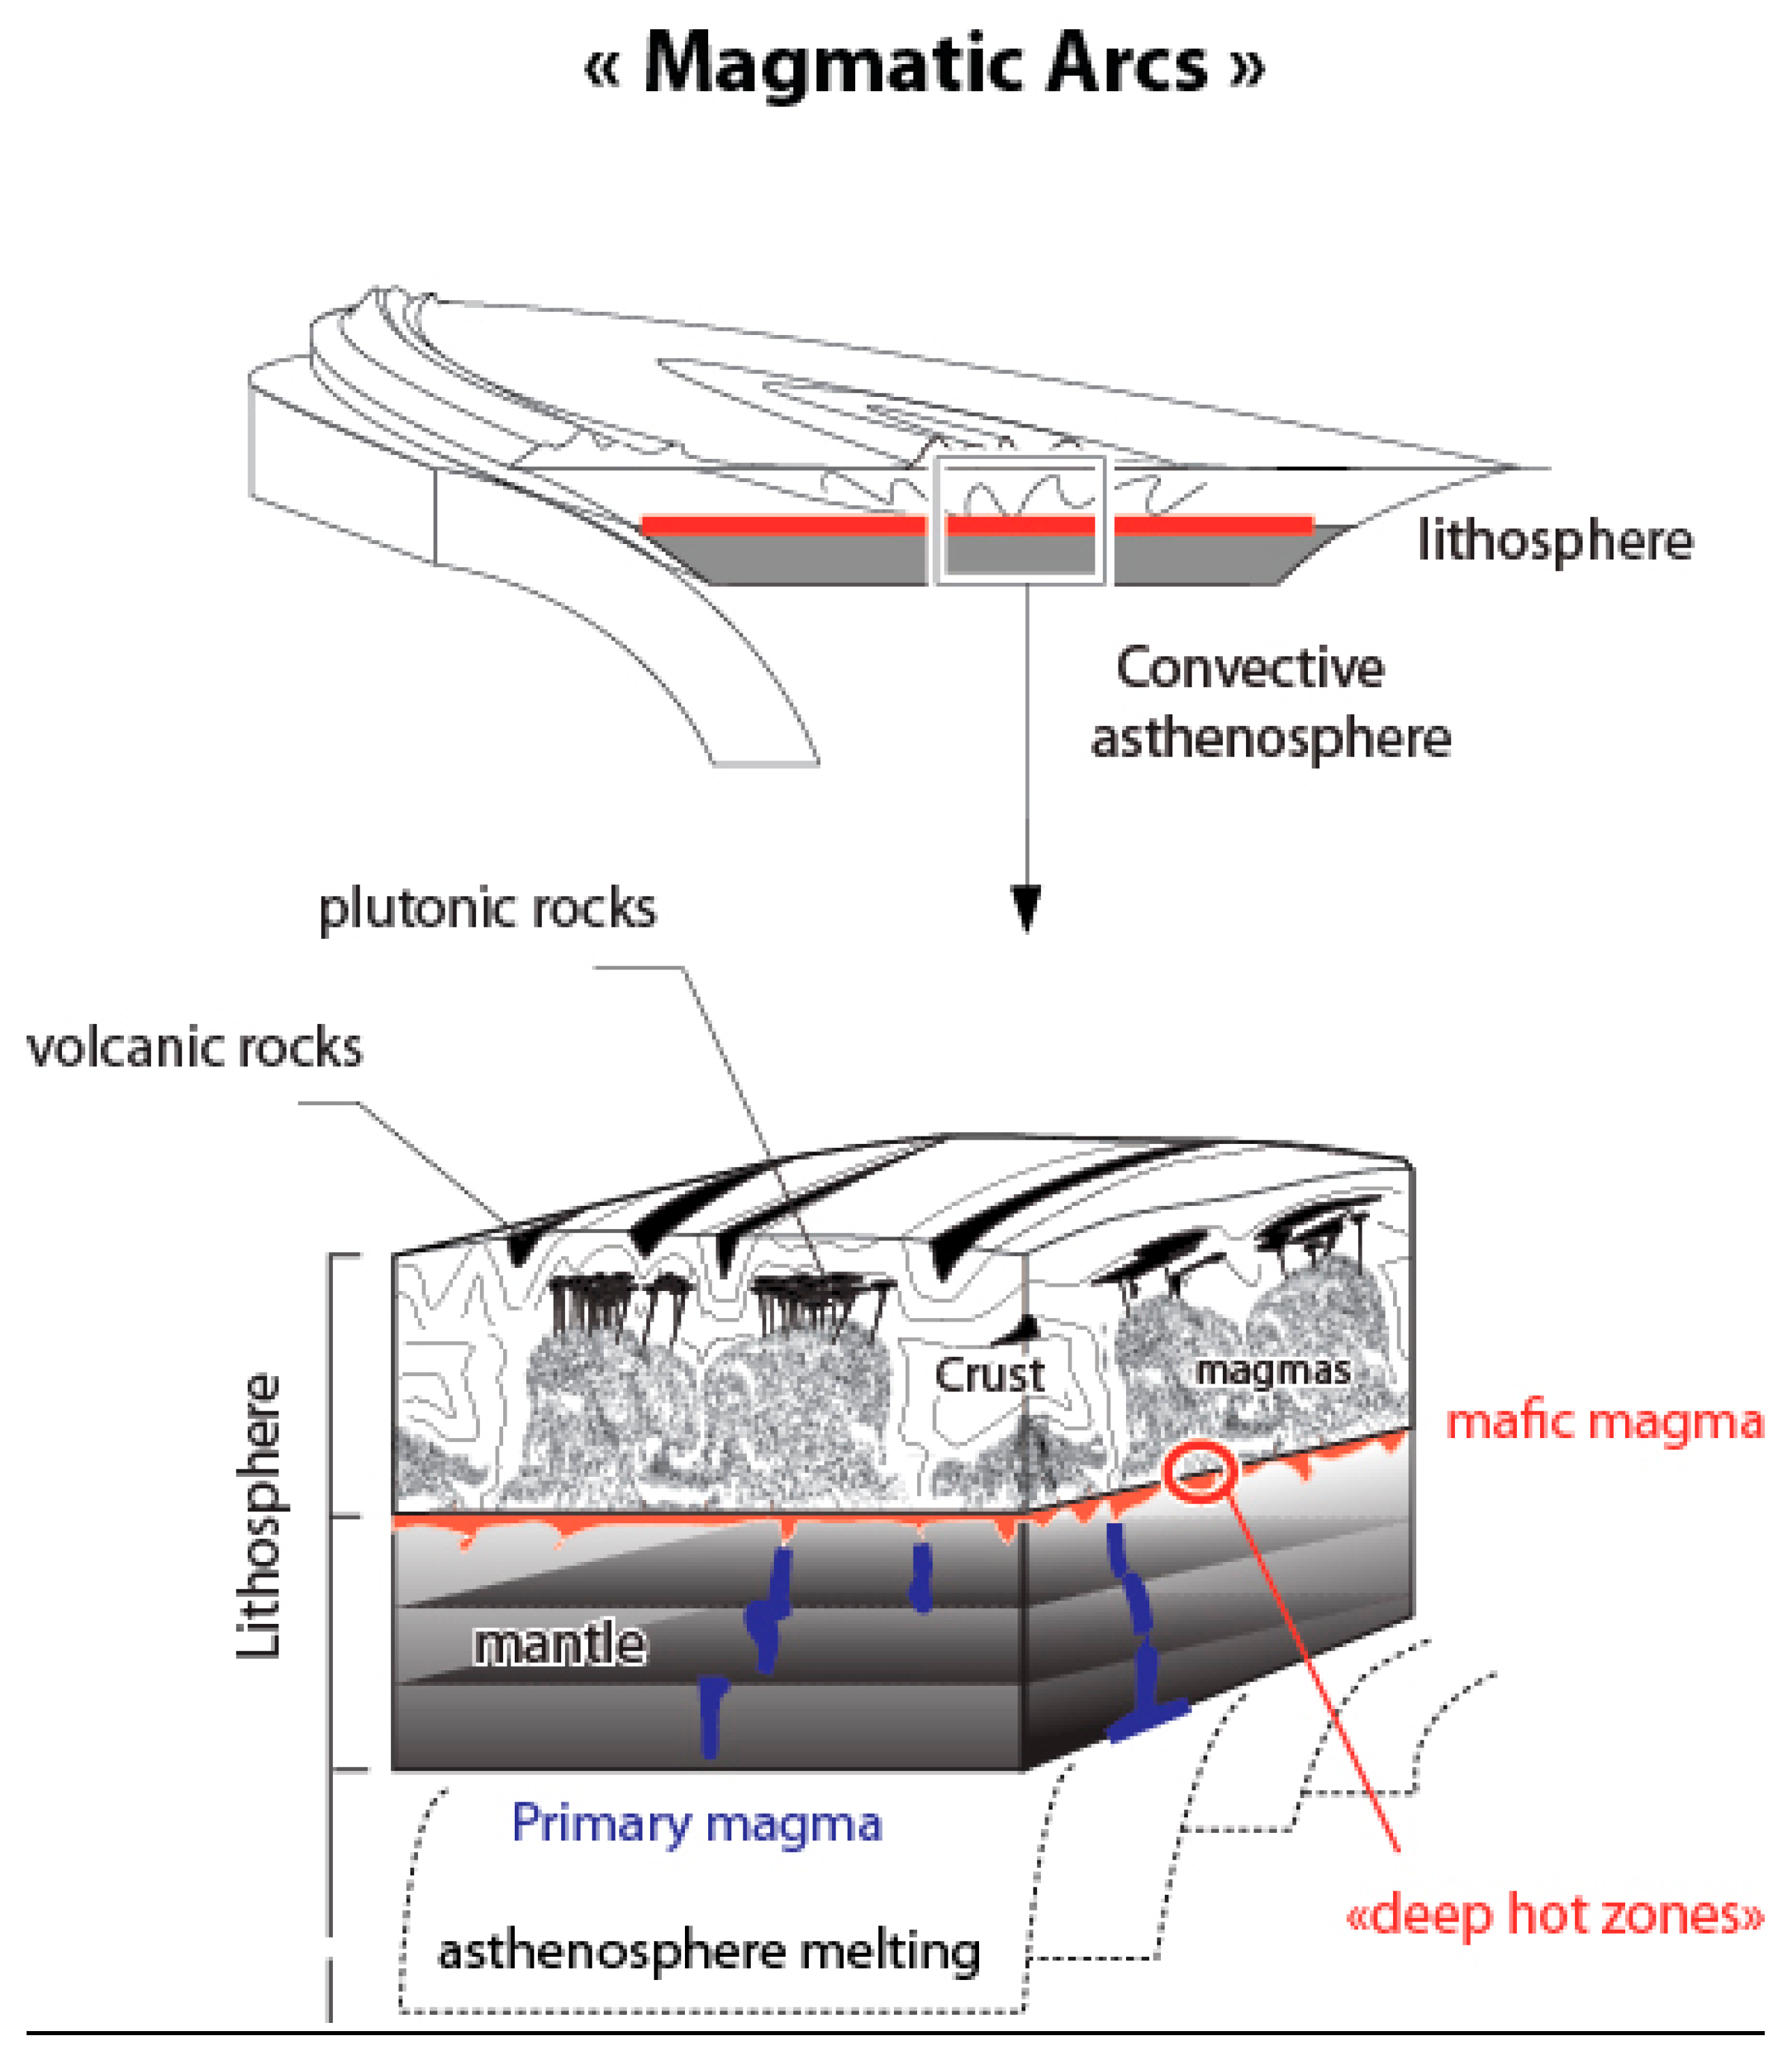
Despite these limitations, a number of geochemical indices are proposed as proxies which record changes in crustal thickness and may be investigated using data mining techniques on large geochemical databases [13,14,15,16,17,18]. Such proxies are based on different correlations established between the composition of young lava formed in arc-settings and the thickness of the crust through which lava were likely to evolve. However, the significance of these correlations has been recently questioned [19]. It was suggested they mostly reflect temperature changes and the degree of melting in the sub-arc mantle [20] rather than differentiation in the arc lithosphere (including crust) ([21,22,23,24] among many others). Furthermore, it was suggested that changes in lithosphere thickness could only be a consequence of the evolution of mantle temperature modulated by plate dynamics [25]. It was stressed that high-pressure fractionation at the bottom of the crust, within deep hot zones (Figure 1), was unlikely to explain the global systematics of mafic magma composition. This conclusion deeply challenges the idea that estimates of past crustal thickness can be obtained simply from magma chemistry because temperature in the mantle is a difficult parameter to constrain in both modern and past geodynamic environments [26,27,28].
Another problem surrounding these proxies concerns the use of modern calibration for chemistry versus crustal thickness relative to older lava, given potential differences in primary magma composition and crustal differentiation. It may be also argued that lava considered for proxies have been sampled in young arc settings and it is not yet clear how far these proxies can be applied to unknown tectonic settings in the past. The last and most fundamental problem is that none of these proxies have hitherto been tested against both the mineral and chemical records of magma that, together, integrate much of the high-frequency variations and complex details that can exist within magmatic systems. Such a test is possible through the examination of crystallization conditions of magmatic minerals, like amphiboles and pyroxenes, which can provide petrological and temperature constraints to understand the potential control of crustal thickening on magma evolution [29].
In this paper, we propose an investigation of paired chemical and mineral information of mafic rocks to extract qualitative estimates of the crustal thickness of past magmatic systems. In order to assess the sensitivity of different mineral, chemical and thermal parameters to crustal thickness, we first present a multidimensional database of chemical and mineral information of young (<ca. 10 Ma) igneous rocks (lava), sampled in continental settings. The empirical correlations are then tested against the independently constrained estimates of crustal thickness for the global magmatic record [18]. In a broader geodynamic context, this new integrated approach sheds light on the growth of thick (>40–50 km) continental crusts in the Proterozoic times, likely forming in lithospheric sections thicker than today, and their subsequent destruction in the Phanerozoic. Finally, we show that the chemical record of primary magmas and their derivative melts (i.e., mafic magmas) can be used as a marker of magmatic differentiation throughout the lithosphere; and that changes in the differentiation of these magmas over time reflect the influence of long-term geodynamic drivers such as mantle secular cooling and the evolution of plate tectonic regime [27,30].
2. Material and Methods
2.1. Database & Statistical Analysis
Data from the GEOROC database were compiled with published and unpublished data. Results for global mean geochemical and T & P values with time are reported with associated 1-standard-error uncertainties of the mean at different intervals. These means were generated by Monte Carlo analysis, using the standard bootstrap resampling approach detailed in a previous paper [31].
Because contrasting trends can reflect different tectono-magmatic systems, we have organized our data into three groups according to the inferred tectonic environment proposed by the authors of data referenced in GEOROC. These three groups are (1) continental margins, (2) intra-continental settings (CFBs, LIPs, rift-related magmatism and intraplate volcanism, including syn- to post-orogenic magmatism) and (3) oceanic domains. Lavas sampled in the actual oceanic domains have been discarded from our correlations, largely comprising MORBs or OIBs younger than 200 Ma. In the rest of the discussion, only magma (lava) sampled in arc or continental domains will be considered. Such magmas are grouped into the term “continental s.l.”, without further distinction (Figure 2). We acknowledge that major element contents of primary magmas are affected by melting conditions in the mantle and that hydrous lava from arcs may be not securely compared directly to intercontinental basalts. However, there are also some benefits in performing our calculations on a complete dataset of lava, even though they were sampled in different continental s.l. settings, to obtain qualitative or semi-quantitative information. We think the benefits of this approach exceed the intrinsic risk to which we are exposed in discarding or selecting inappropriate arc-type basalts in the Precambrian record, accounting for supposed discriminant ratio in trace elements [32]. There is also some evidence that both hydrous & anhydrous melting processes occur below continents and arcs, which are likely to generate variations in our range of mafic magma composition at any one time but will not affect the temporal trends of chemical values reported in Figure 3. Basically, if melting conditions in the Precambrian have been over- or underestimated, it is also the case for the Phanerozoic ones.
Overall, the robustness of our statistical approach is strengthened by the limited number of temporal gaps in the database. The most inherent risk of sampling bias concerns the >ca. 3 Gyrs period for which the “Komatiite” singularity has distorted the discussion of Archaean crust formation, resulting in an elevated proportion of ultramafic rock samples compared to their relative distribution within Archaean greenstone belts (<10 to 30% of the volcanic mafic record; [33,34]). For this reason, we limited our investigation to the last 3 Gyrs of the Earth.
2.2. Composition of Primary Magmas
Retrieving the composition of primary magmas is not an easy task. It relies heavily on the geochemical record of carefully selected igneous lava that might have formed by melting ambient mantle (fertile peridotite) and subsequently underwent limited differentiation (fractional crystallization) before magma emplacement in the crust. Inferences, though limited, already provide fundamental information about the evolution of the thickness of oceanic crust or the thermal state of the upper mantle as a function of time [26]. Only lavas ranging in SiO2 composition from 43 to 51 wt% (~22,000 samples) have been considered in the calculation of primary magma composition. Such a pre-selection of data into different major element ranges will be discussed later in the paper (see Section 4.2). It is classically used for distinguishing between mantle melting and subsequent evolution and fractionation processes in the lithosphere or continental crust [35]. Conversely, no pre-selection of data into different trace element ranges was applied, in order to minimize the chance of introducing any unintentional selection bias.
Primary magma (lava) compositions were obtained for our filtered database using the PRIMELT3 MEGA software [36]. PRIMELT is a very selective method for large data populations (successful solutions of calculations <1–3%; [28]), which is used to identify mafic magma derived from primary magma composition, having undergone only olivine fractionation. In most cases, there is no successful solution for the calculation of mafic magma derived from a source other than peridotites, like metasomatized mantle or pyroxenite, nor for primary magma that have experienced fractionation of minerals other than olivine, such as plagioclase or clinopyroxene or that have been enriched with these elements (magma replenishment).
The software is calibrated by anhydrous melting experiments on fertile peridotite, and its application to lavas assumes a similar fertile and dry peridotite source. Uncertainties in fertile peridotite composition do not propagate to significant errors in mantle potential temperatures (Tps) [37]. Conversely, melting of wet peridotite is likely to propagate to erroneously high MgO. We excluded all samples that have undergone clinopyroxene and/or plagioclase fractionation as indicated by depletion of CaO (Ca) and Al2O3 (Al) or enrichment in FeOt (Fe) (total iron reported as a single oxide). Such discrepancies can be highlighted in a simple graph [28] by plotting the chemistry of sample against its “liquid line of descent” (i.e., L.L.D.). In the end, our calculation solutions have been filtered according to a graphic procedure [37], leading to reduced uncertainties that may arise from pyroxenite source lithology, source volatile content from metasomatized peridotite, and cpx fractionation. The remaining samples were assumed to have been affected only by variable amounts of olivine addition and subtraction.
2.3. Thermometers for Magmatic Systems
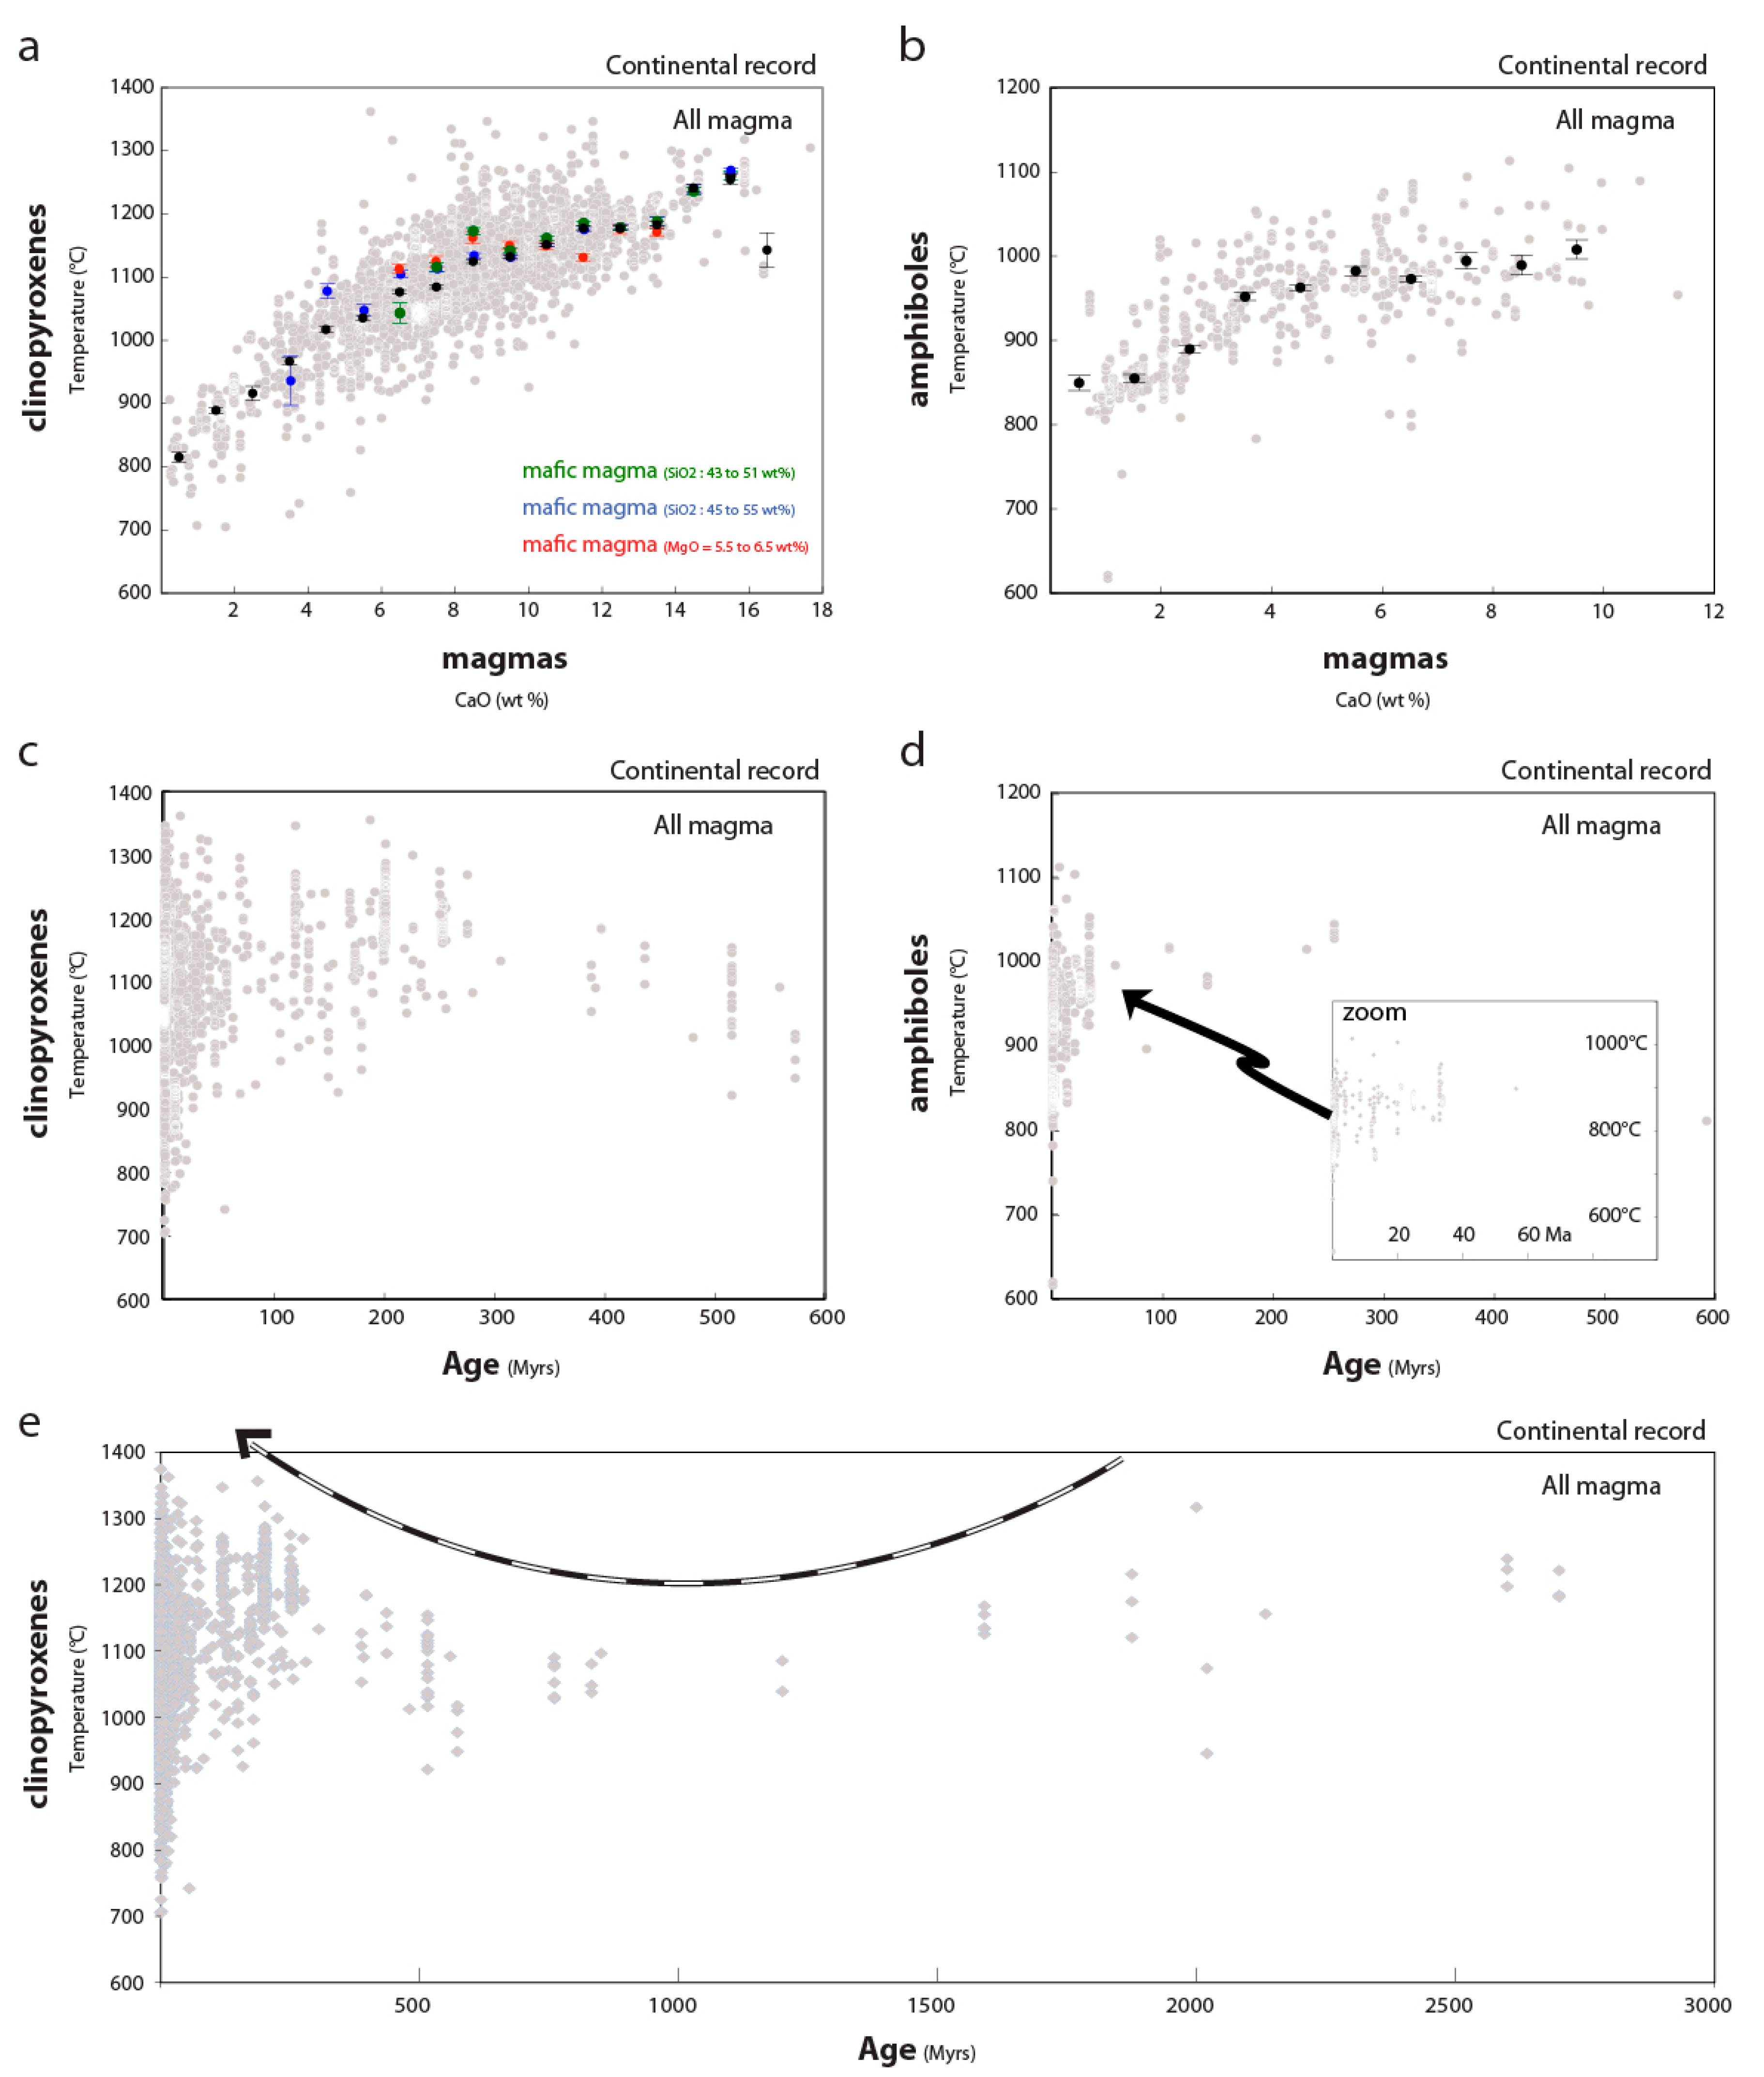
A large set of temperature (T) values is included in our database [31]. These values were calculated using different equations proposed in different excel files (available at http://www.fresnostate.edu/csm/ees/faculty-staff/putirka.html#downloads), the accuracy and range of applicability of which is discussed in Putirka [38]. Keeping in mind that T estimates for samples with significant volatile contents, typical of arc-setting magma, are less accurate, the reported standard error of the estimate (SEE) for hydrous samples is larger. For instance, the SEE for the clinopyroxene calibration of Putirka (Equation (32a)) [38] increases from ±58 °C for anhydrous samples using to ±87 °C for hydrous samples. Clinopyroxene-liquid calculations reported in Figure 4a,c use Equation (33) calibrated against experiments at temperatures less than 2400 °C to produce a SEE of ±45 °C. Clinoamphibole-liquid calculations reported in Figure 4d,b use Equation (4a) [38] calibrated against experiments at temperature less than 1200 °C to produce a SEE of ±23 °C.
3. Results
3.1. Composition of Magma and Minerals through Geological Times
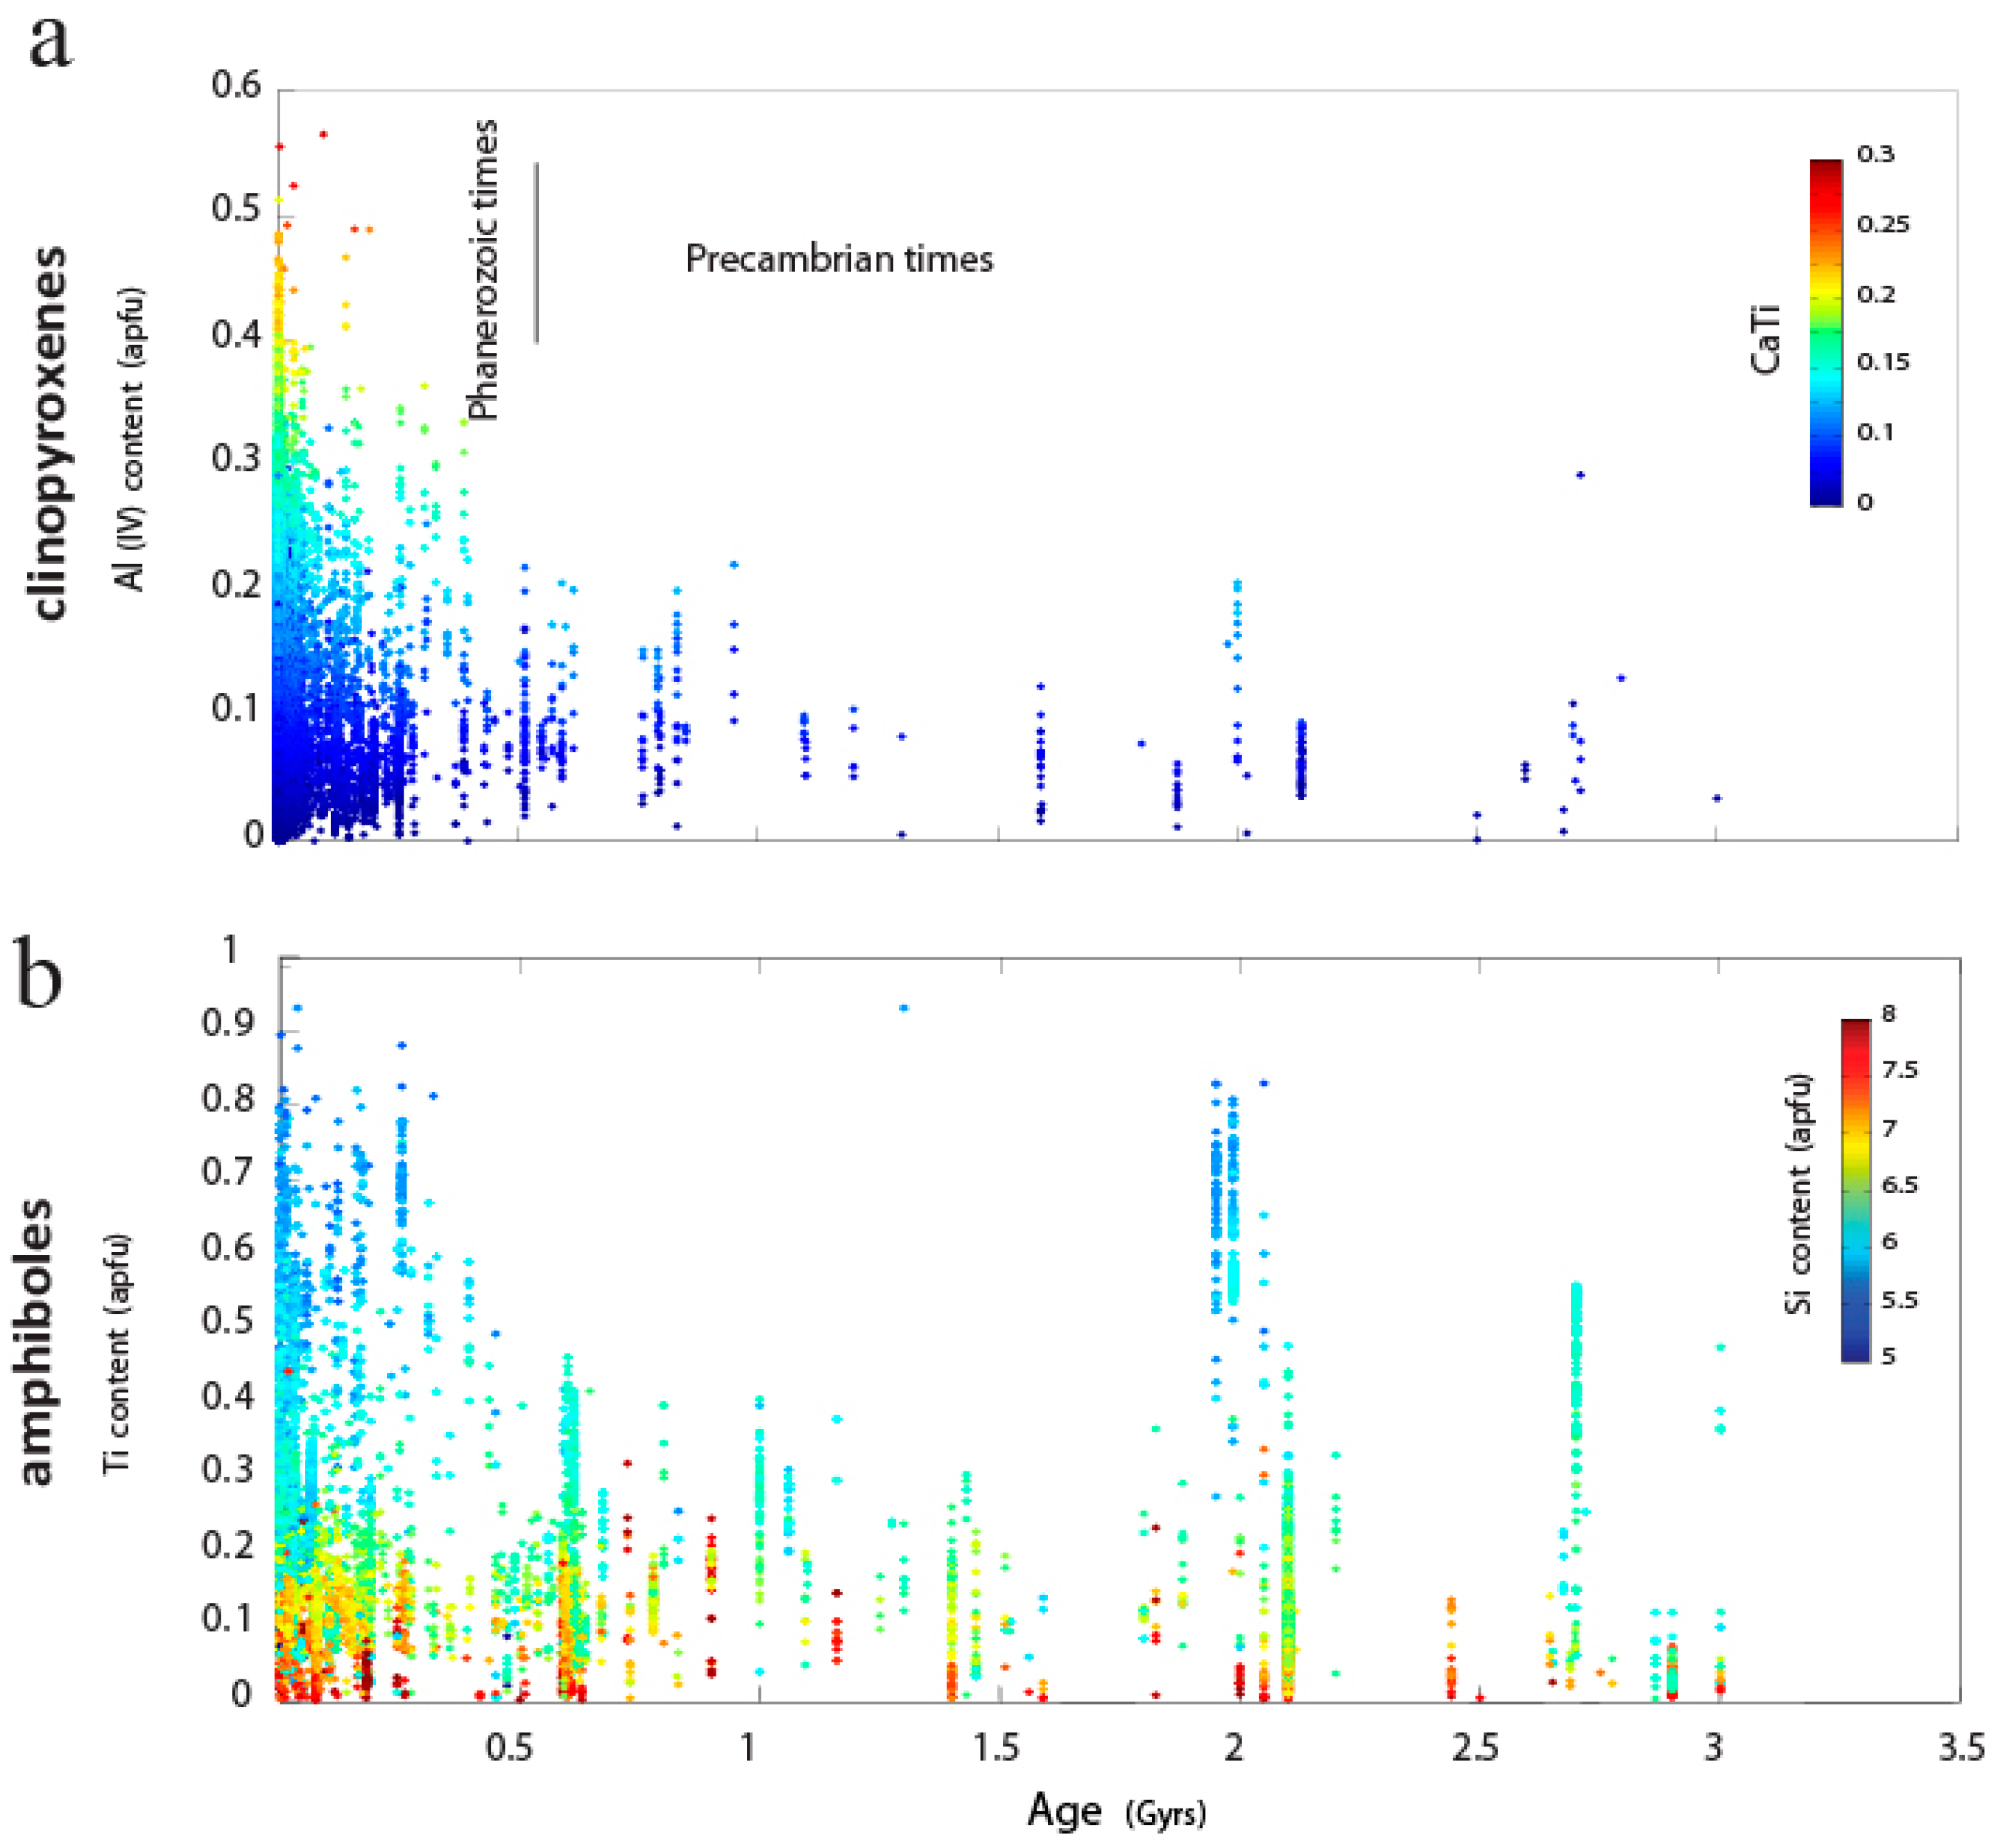
Statistical approaches were first applied to the large multidimensional clinoamphibole (amph) and clinopyroxene (cpx) database. Elaborative diagrams of the results are provided in Figure 3 and Figure 4c,d. They detail the chemical changes, linked to T stability ranges, of magmatic amph and cpx through geological times. The database demonstrates a progressive increase of Ti and Al content in the crystalline structures of magmatic amph and cpx during the Phanerozoic (Figure 3). The inversion of these chemical evolution trends to T crystallization conditions [38] reveals an increasing occurrence of high-T magmatic amph and cpx (Figure 4e) since ~0.6 Gyr, which contrasts with more monotonous crystallization conditions throughout the Precambrian.
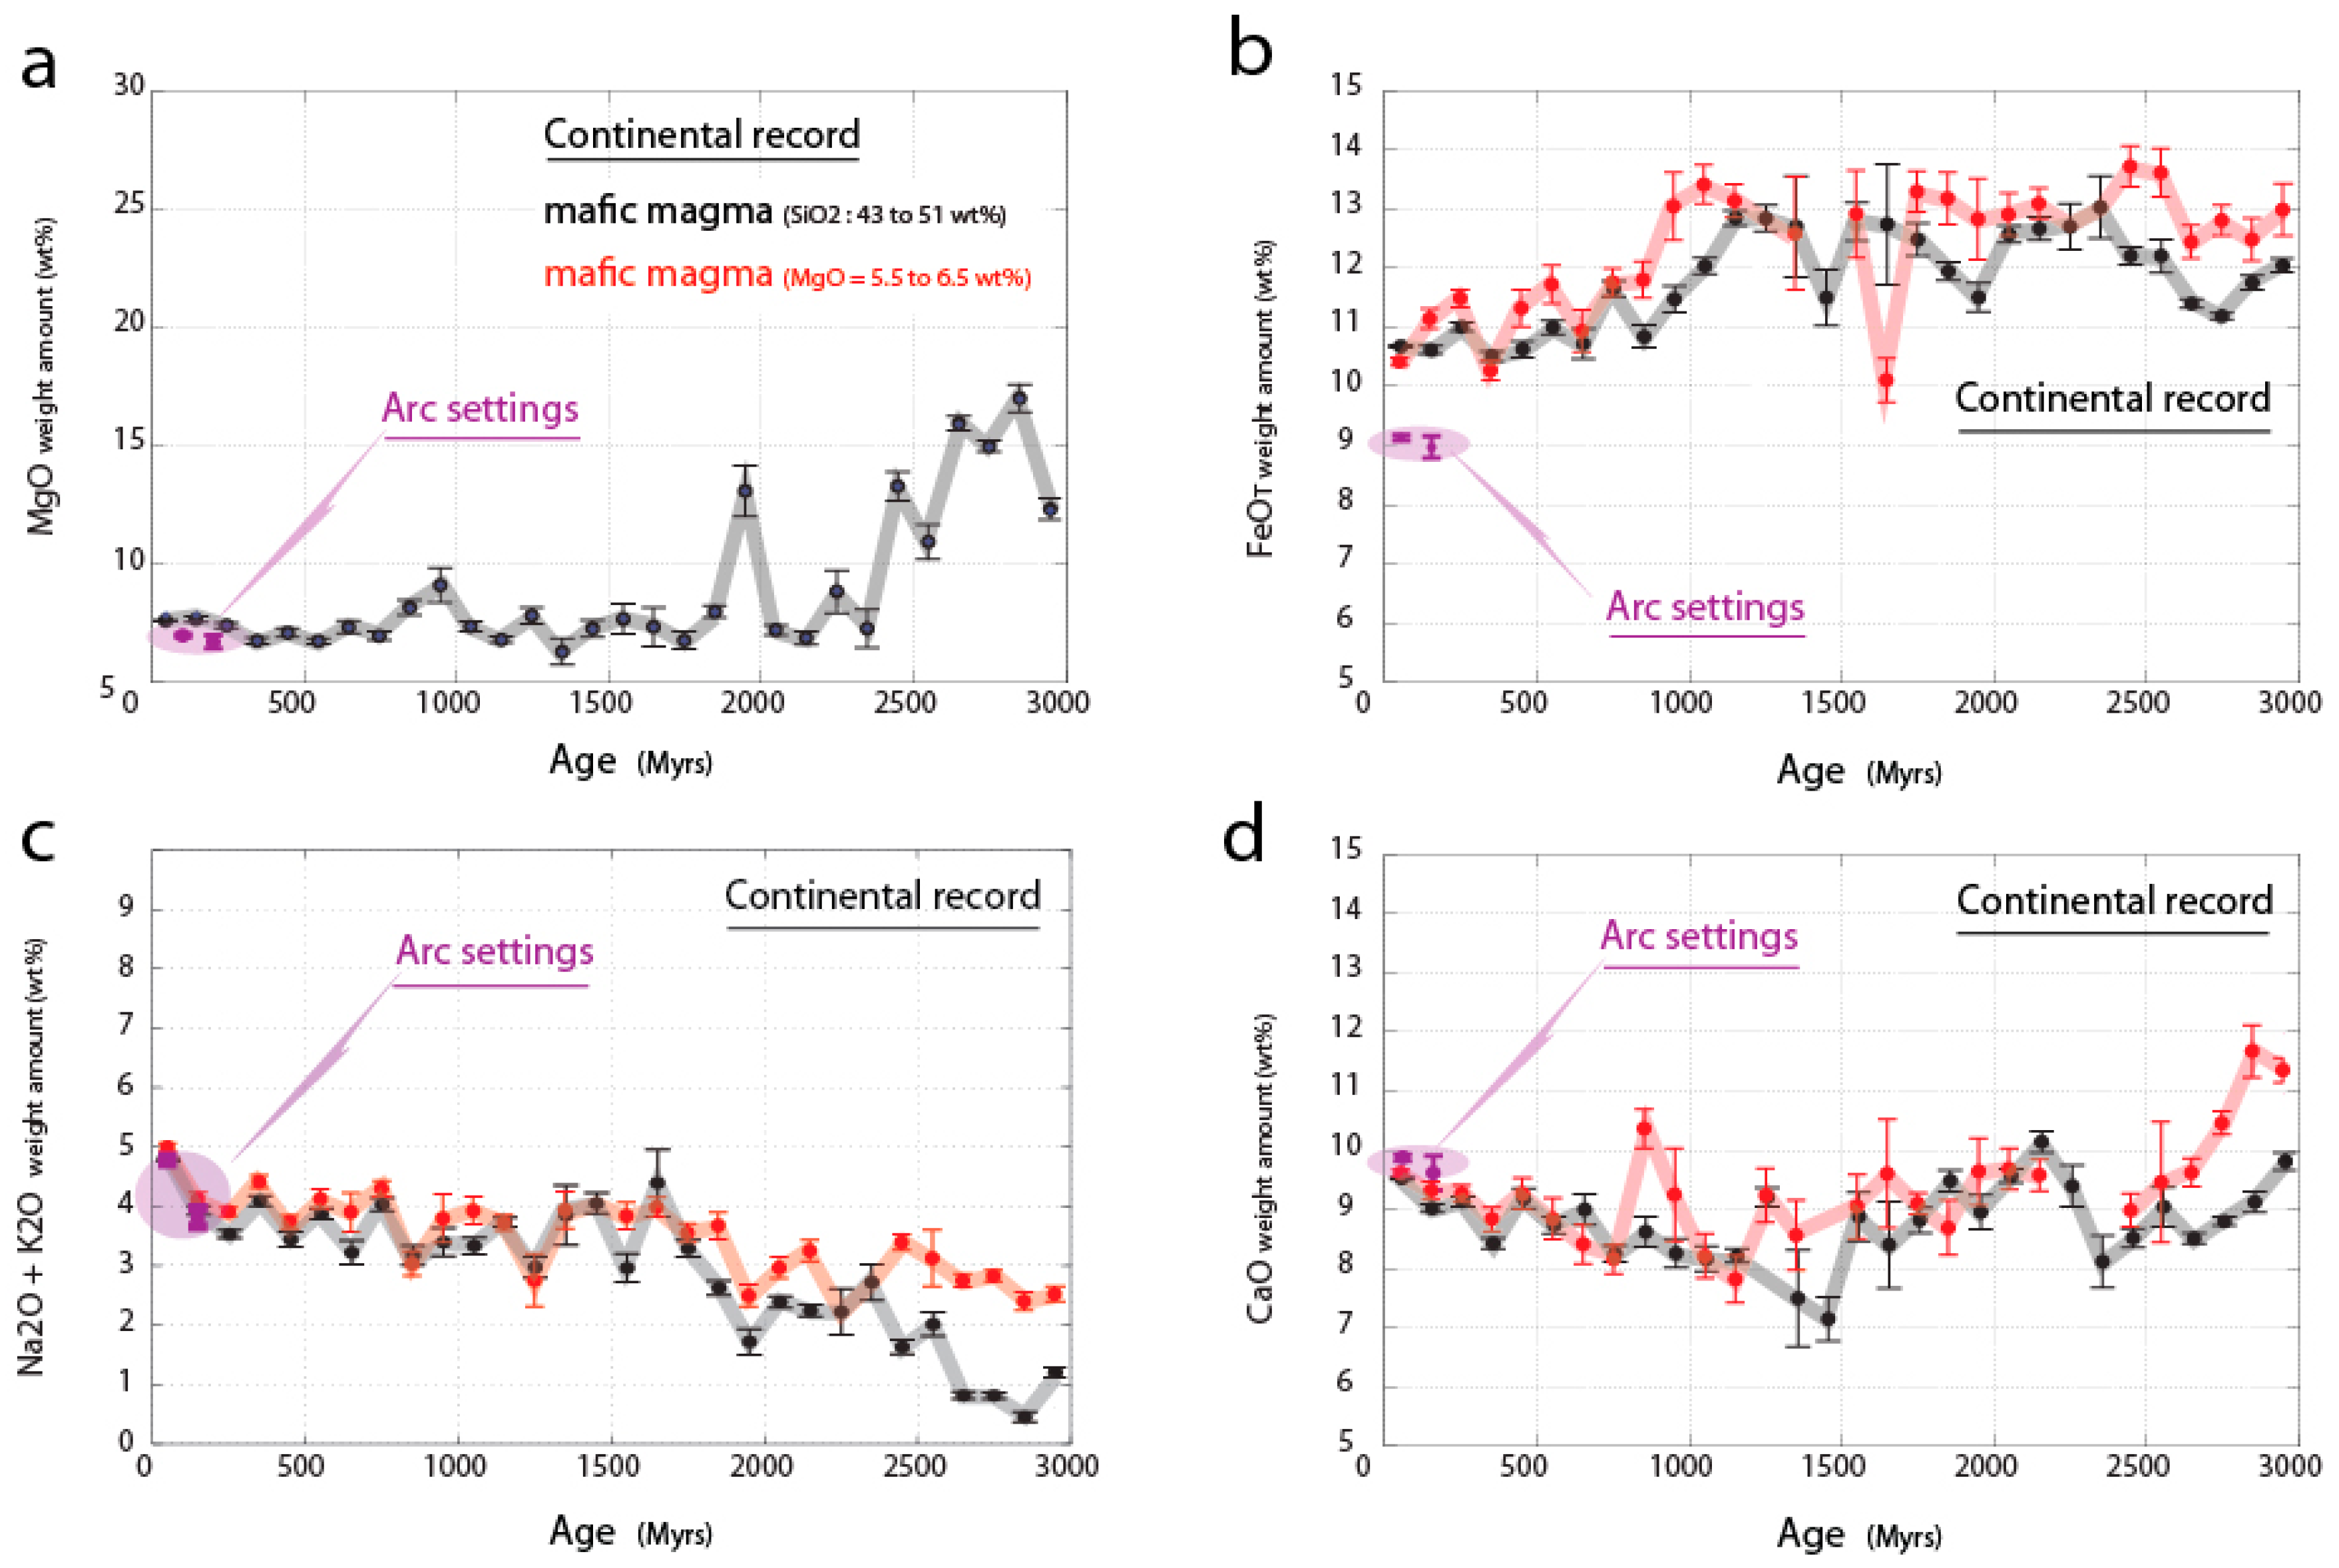
Figure 5 and Figure 6 display the chemical changes of mafic lavas (e.g., ~19,000 samples ranging in SiO2 (Si) composition from 43 to 51 wt%) and primary magmas (103 samples; data available in [28]) throughout geological time. The database demonstrates elevated MgO (Mg) values of mafic magmas in the Archaean, then a marked decrease after ca. 2.5 Gyrs (Figure 5a), consistent with the findings of [35]. This chemical evolution is accompanied by a progressive increase of the Fe content at the end of the Archaean (Figure 5b). Despite an irregular evolution throughout the Palaeo- and Mesoproterozoic times, the Fe content of mafic magma reached its maximum at the beginning of the Neoproterozoic, then decreased in the last billion years. A stabilization of Fe, at around 10–11 wt%, is observed in the Phanerozoic times (<ca. 600 Myrs). Notably, a progressive increase of alkali contents (Na + K) is observed throughout the course of the last 2.5 Gyrs (Figure 5c).
At the end of the Archean, we observe a slight increase in the Mg content of primary magmas (red points in Figure 6a), corrected from olivine fractionation (Mg decrease), followed by a decrease in Proterozoic times. This chemical evolution has been matched with the global record of mafic magmas (black points). The greatest divergence in Fe and Ca content between mafic and primary magmas occurs at the end of the Archaean, reaching its maximum in the Palaeo- and Mesoproterozoic times then progressively decreasing after ca. ~1 Gyr (Figure 6b,d).
3.2. Composition of Magma and Minerals as a Proxy for Crustal Thickness
Figure 7a shows that crustal thickness exerts a first-order control on the composition of young Cenozoic magmas, which become less calcic with increasing crustal thickness. This was achieved through the compilation of a comprehensive database for the geochemistry of geologically young magma for which the crustal thickness is known [9]. For each data point, we plotted the corresponding crustal thickness hosting the magma, thus allowing us to explore relationships between the chemical and mineral signature of magma and crustal thickness. We minimized errors induced by a possible thickening of crust subsequent to magma emplacement by discarding data older than ca. 10 Ma.
Figure 7b shows that the Ca content of young mafic magma (e.g., Si43–51: samples ranging in SiO2 composition from 43 to 51 wt%) strongly decreases with increasing crustal thickness, evolving from Ca values of <12 to 8 wt% for crustal thickness ranging from 10 to 45 km. Beyond this threshold of 45 km, less confidence can be given to these values because they are not supported by high-density data. The chemical trend in Ca for mafic magma, selected with a different range of composition (Si45–55 or Mg06), does not fundamentally differ. Moreover, two major elemental concentrations can be used conjointly as crustal thickness proxies and yield consistent results when larger global and regional datasets are averaged out. Accordingly, Figure 7b shows that mafic magmas become more potassic and sodic and comparatively less calcic with increasing crustal thickness.
In extension of that conclusion, Figure 4a,b presents correlations between the chemical composition of mafic magmas in the continental record and the associated composition Ca content of magmatic ferromagnesian minerals. The data provide evidence for a marked decrease in cpx and amph Mg content for decreasing bulk rock Ca content.
3.3. Composition of Magma through Geodynamic Environments
The chemical changes of magmatic samples from an oceanic spreading context (e.g., mid-ocean ridges) or in highly productive mantle upwelling context within oceans (e.g., some hotspots like Hawaii, La Réunion, Iceland, etc) are displayed in Figure 8d (green dots), with respect to those sampled in continental s.l. settings (Figure 8a; red dots). A significant increase of the alkali (e.g., Na + K) content of magma with increasing differentiation (e.g., Si increase) is observed in the oceanic record. Conversely, only a slight increase in the alkali content in magma is observed when the crustal thickness in the continental setting increases. Figure 8b,c yield correlations between the gradual increase or decrease of alkali magma occurrences in the continental record and the crustal thickness at the site of eruption (black dots). Bootstrapping of the total-alkali content reveals a negative correlation between Na + K and Si in the less evolved (basaltic) composition of magmas (Si45–52 wt%). The negative correlation is related to a more important increase of Si with respect to Na and K in thin crust, that persists over a large range of mafic magma compositions: Si43–51, Si45–55 or Mg06, Figure 9) but correlation becomes weaker with increasing crustal thickness. For comparison, the average trend of basaltic magma (black dots) emplaced in the continental crust has been reported on the diagrams (Figure 8b,c). It reveals a convergence of trends (black versus red dots) with increasing crustal thickness. These findings are consistent with those reported by Farmer & Lee [39], showing that the most silicic magmas (>70 wt.% SiO2) are paradoxically found in thin crust settings like the South Chile-Patagonia magmatic systems (Figure 10), where average compositions are low in silica (basaltic).
3.4. Probing Crust in the Past through Magma Evolution
To track changes in crustal thickness through time, we used a new empirical proxy established between Ca content and crustal thickness for mafic rocks from modern magmatic systems (<ca. 10 Myr) that do not include oceanic-like magmatic settings such as mid-oceanic ridges (Figure 11). This proxy is built on Mg values at around 7 to 8 wt% and it cannot account—in theory—for large dispersions in Mg. Accordingly, magmatic rocks older than 2.2 Gyrs have not been considered in our analysis because Mg content increases from 8 to 15 wt% between 2.2 and 3 Ga (Figure 5a). Using this approach, we document the progressive build-up of thick (>50 km) juvenile crust in the Proterozoic and its destruction in the Phanerozoic times (Figure 12a). The elevated Ca content in mafic magmas shows that the juvenile crust was still rather thin at the beginning of the Palaeoproterozoic (<35 km). About 2 billion years ago, the Ca content of magma decreased, indicating that the newly formed crust became thicker. Thickening of the juvenile crust increased until the end of the Mesoproterozoic (>40–50 km). Subsequent to this, at ca. 1 Ga, the Ca content of magma increased, indicating that the newly formed crust became thinner (<35 km).
4. Discussion
The first aim of this discussion is to demonstrate, with petrological and modeling arguments, that high-pressure fractionation of minerals in mafic magma has a geological reality and can significantly deplete a mafic magma in calcium. Such control of the crust (or lithosphere) on the primary magma differentiation toward mafic magma composition is the theoretical justification of all proxies for probing crustal thickness in the past, including our new proxy.
The second aim is to show that remarkable correlations previously observed between chemistry of mafic magma and crustal thickness [19,20,25] are consistently demonstrated for an even wider range of magma composition. We also discuss the relevance of using mafic magma from different geodynamic settings, acknowledging that fluid-induced or fluid-absent melting can profoundly impact the primary composition of mafic magma and their subsequent chemical evolution through calc-alkaline or tholeiitic differentiation in the lithosphere, respectively.
Finally, we question how temperature changes in the mantle through time can impact these correlations and magmatic differentiation (calc-alkaline versus tholeiitic), acknowledging that hotter temperatures propagate to primary magmas with more elevated magnesium and calcium composition, and comparatively lower iron contents. This point is important as, over the last 600 Ma, mantle heating below Pangea interacted with a broader secular cooling of the Earth mantle [31].
4.1. Chemical Differentiation of Primary Magma Controlled by Temperature
A key point for our new proxy is to demonstrate whether or not the variation in Ca and Fe contents of mafic magma is the result of increased cpx fractionation during differentiation of primary magma. Figure 11 reveals that prior to cpx fractionation, olivine fractionation will result in an increase of Ca and a decrease of Fe in the melt [37]. In Figure 6a, the Mg content of primary magma is positioned at around 15 wt%, in the range of composition where only olivine fractionation is expected (Section A of the LLD in Figure 11). It means that early crystallization of olivine likely contributed to Ca increase and Fe decrease in primary melt, until a point on their LLD (8 wt% in MgO) where cpx starts to crystallize with plagioclase (Section B, Figure 11), stopping the Ca enrichment in primary magma and inverting their positive Ca/Fe evolution. Ca and Fe content in mafic magma thus reflects this two-step but opposite evolution.
Distinguishing which of the two steps (Section A or B) dominantly contributed to the Ca and Fe content of mafic magma in Figure 6b,c requires us to know the proportion of cpx in the fractionating assemblage, which is currently impossible. A more simplistic approach in assessing the effective contribution of cpx fractionation in the differentiation of primary magma, is to consider their compositions in Ca, which broadly do not change with time (~10 wt% in Figure 6d). If early fractionation of olivine has been involved (section A of the LLD) (Figure 11), increasing the Ca content of primary magma, it cannot explain by itself the final composition in Ca of mafic magma which now plots below 5–10% (Section B of the LLD) (Figure 11). We, therefore, conclude that cpx fractionation is a necessary step to explain the difference in Ca between mafic and primary magma.
4.2. Chemical Differentiation of Primary Magma Controlled by Pressure and Temperature
Another key point for our new proxy is to demonstrate whether the chemical differentiation of primary magmas is the result of crustal or lithospheric processes. Accordingly, chemical variations in mafic magmas could only demonstrate the extent of cpx fractionation in the primary melt with decreasing temperature and have no relationship to the pressure of crystal fractionation in the crustal or lithospheric section.
Testing this hypothesis would require the comparison of the composition of primary magma produced at different depths but similar temperatures. A normalized range of temperatures for mafic magma is thus necessary. It can be constrained by their Mg content that linearly increases with increasing temperature of melting in the mantle [37]. The Mg06 was proposed by Plank & Langmuir [20] as a reference value because, within such range of composition (5.5–6.5 wt% in MgO), primary magma will experience limited cpx or plagioclase fractionation along their LLD (Section B in Figure 11). Using this value, some remarkable correlations have been established between the composition of mafic magma and the thickness of the crust hosting the lava. Notably, it was shown that Ca content negatively correlates with the increase of alkali elements in magma (Na and K) and the crustal thickness.
Such evolution was likely controlled by the rate of melting (F) in the sub-lithospheric mantle [19]. It is known that low melting rates promote concentration of alkali elements in primary magma. Furthermore, F proportionally decreases with the depth of melting in the sub-lithospheric mantle. The logical conclusion is that increasing the depth of initial melting of the mantle at constant temperature will lead to more alkali magmatic signature. It was thus proposed that the alkali magma signature in arc setting was the hallmark of thick lithosphere hosting a thick crustal section and that lithosphere and crustal thicken together, controlled by tectonic processes operating at plate boundaries [25].
An important aspect of the authors’ demonstration is that mafic magma forming in arc setting cannot derive from a single (unique) parental magma (primary magma) but rather reflect different sources and degrees of melting in the ambient mantle, as controlled by plate dynamics. It was also stressed that mafic magmas acquire their main chemical characteristic early in the chain of igneous processes, at the time of mantle melting. Subsequent differentiation in the lithospheric or crustal section is unlikely to modify such peculiarity and will only strengthen it, as demonstrated by their alkalinity in the TAS diagram (Figure 9).
Turner & Langmuir [25] build their demonstration on the fact that little evidence exists for high-pressure fractionation of magmatic minerals within deep hot zones [23]. Global systematics of magma chemistry would better suggest the evolution of mafic magma is controlled by the fractionation of olivine, not pyroxene at pressures up to 12 Kb [22]. However, taken at face value, the LLD of individual arc magma selected by authors (Figure 9 in [19]) could also mimic the experimental fractionation trend of Nandedkar et al. [43] obtained at middle-pressure (7 Kb) conditions reflecting intra-crustal differentiation.
Accordingly, there is growing evidence that magma storage and evolution can proceed at different levels in the crust within mush columns [44]. In a mush context, the middle crust likely constitutes an important zone of transfer and mingling for magma, marking a physical threshold between mafic and felsic reservoirs present in the lower and upper crust, respectively. A marked decrease of Fe in magma at the middle-crust boundary was recently highlighted by Ganne et al. [45], which can potentially be explained by the crystallization of pyroxene or amphibole trapping Fe. Likewise, different lines of evidence exist in the literature that indicate that pyroxene can crystallize in the crust or down to the sub-Moho lithospheric section of arcs (Figure 1 in Putrika [46]) and oceans (Figure 4 in Herzberg [47]).
The question is whether the pressure of mineral fractionation in the lithosphere is a sufficiently reproducible function of lithospheric thickness—at some definable set of parameters—to provide insights into the latter?
4.3. Chemical Differentiation of Primary Magma Controlled by Geodynamic Settings?
Figure 4, Figure 5 and Figure 7 show that comparable trends for elements and similar correlations with the crustal thickness can be observed when considering (1) different categories of mafic magma (Si43–51; Si45–55 or Mg06) and (2) different geodynamic settings (e.g., continental record s.l. versus arc settings). The only exception concerns the Fe content of mafic magma which is lower in arc settings compared to the undifferentiated continental record (Figure 5b). Such a discrepancy brings us to discuss the relevance of using mafic magma formed in different continental settings (s.l.) as proposed in Figure 5, acknowledging that fluid-induced or fluid-absent melting can profoundly impact the primary composition of mafic magma and its subsequent chemical evolution through calc-alkaline or tholeiitic differentiation, respectively. This is an important point as a tholeiitic evolution will increase the Fe content of magma, especially in the range of mafic magma composition (Mg06) for which previous correlations have been established between crustal thickness and magma chemistry [20].
Considering these correlations, sodium content (wt%) linearly increases with the decreases of calcium (R2 = 0.77) and the thickening of the crust (R2 = 0.74) whereas a weak correlation (R2 = 0.51) is observed between iron (Fe06) and sodium (Na06). A loss of correlation between iron and sodium is at odds with petrological experiments predicting that iron, calcium and magnesium proportionally decrease with decreasing melting conditions in the mantle, accompanied by a gradual increase in alkali elements in the primary magma. A possible explanation is that iron content in primary magma reflects the heterogeneous composition and redox conditions of the mantle source, not only the temperature or pressure at which the mantle crossed its solidus. However, we suppose that a heterogeneous mantle source should propagate to less clear correlations in the global systematics, which is obviously not the case. The discrepancy between experimental results and global analysis of data instead suggests that mafic magmas are not directly connected to primary magma composition along an LDD controlled by olivine fractionation. Rather, it is likely that the mafic magma underwent chemical differentiation, altering the Fe content.
We suggest that iron fluctuations in the mafic magma record reflect a duality between two types of primary magma evolution, that is a tholeiitic differentiation proceeding in thin arc sections and a calc-alkaline one occurring in thick sections [14,15]. The dependence on fluid-induced melting is likely of second order. This hypothesis differs from previous conclusions [19,25], which argue that high-pressure fractionation within deep hot zones exists but was unlikely to explain the global chemical characteristics of young arc-derived mafic magma.
4.4. Chemical Differentiation of Primary Magma in the Past
Finally, we assess the impact of mantle temperature changes through time on these correlations, acknowledging that hotter temperatures produce primary magmas with elevated Mg and Ca composition, and lower Fe contents. This point is important as, over the last 600 Myrs, mantle heating below supercontinents has interacted with a broader secular cooling of the Earth’s mantle [28,48].
The Phanerozoic chemical evolution of mafic magma reveals a peak in temperature (T) recorded by cpx at around ~300 Myrs (Figure 4). This appears to be consistent with the presence of Ca-rich and comparatively less alkaline mafic magma at that time (Figure 7c). On either side of the T peak, there is an increase in the alkalinity of mafic magmas, which indicates a drop in magma temperature likely related to lower ambient mantle temperatures (Tps) below continents [31]. However, there are some deviations on the temporal trends, suggesting that changes in Tps through times cannot fully explain the change in Ca and Fe for mafic magmas. A lithospheric (pressure-related) control on primary magma differentiation is logically expected. We suggest that both the temperature of melting in the mantle and the pressure of mineral fractionation in the lithosphere control the chemical characteristics of mafic magma and that the thicker the lithospheric (and crustal) section in the past, the more pressure-dependent (first order control) the evolution of primary magma toward mafic composition. The dependence on Tps is likely a second order control.
The sub-lithospheric mantle below active arcs appears rather thin compared to cratonic regions and, along the Circum-Pacific Orogenic Belts (CPOB), it does not exceed 100 km in thickness on average [49], excluding localized sections of very thin lithosphere that have experienced delamination [50]. Lithospheric thickness is primarily controlled by temperature in the ambient mantle and elevated Tps below arcs often result in thin lithospheric sections [51]. This results in limited fractionation of minerals in a primary magma within thin lithospheric sections relative to thick lithospheric sections formed in association with cooler mantle temperatures. A hotter mantle in the past would, therefore, likely result in a thinner sub-arc lithosphere, limited mineral fractionation and Ca depletion in mafic magma. However, this is not what we observe in Figure 6. Ca depletion for mafic magmas reaches a maximum in the Mesoproterozoic when the ambient mantle is hotter, suggesting a parameter other than Tps controlled the sub-arc lithospheric thickness in the past.
Isotopic signatures of Phanerozoic lavas formed in arc settings reveal that the lithosphere below the CPOB has been fully reworked and rejuvenated by abundant magma production [52,53]. Subduction-related magmatism operated continuously since >550 Myrs on the external margins of Pangea (e.g., external accretionary orogens) whereas internal orogens (e.g., Variscan, Alpine-Himalayan, etc.), occurring in the core of Pangea, are predominantly characterized by collisional orogenesis and minor episodic subduction. These major differences resulted in the production of lower volumes of magma and limited transfer of material from the mantle to the lithosphere within slightly thicker lithospheric sections (100–150 km) relative to thinner lithosphere underlying the external orogens (<100 km) [54].
Given the lack of clear evidence of correlations between lithospheric thickness and magma composition, we can only speculate that crust thickened or thinned with the lithosphere. As discussed in this paper, however, thickened lithosphere is a prerequisite for models of deep fractionation, as well as models relying upon different degrees of mantle melting are modulated by lithospheric thickness [19,20,25].
A test site was proposed by Turner et al. [25] for mafic magma emplaced in individual stratovolcanoes along the western coast of South America. It confirms that Ca correlates negatively with crustal thickness and similar results can be obtained using a different set of data from our database. Igneous samples considered in Figure 10 crop out along the western margin of North and South America, covering the compositional range of basalts to rhyolites (40–75 wt% SiO2). As illustrated by Figure 7a, the Ca content of magma increases with decreasing crustal thickness although there is no clear evidence of lithospheric increase along the strike of the belt [49,55].
How can we explain such an apparent difference between crust and lithosphere thickening along the strike of the belts? First, the determination of the lithosphere-asthenosphere boundary (LAB) below arcs and continents is surrounded by some uncertainties [56], blurring correlations of magma composition with LAB, at the difference with Moho probed at the kilometer scale [9]. Secondly, it may be argued that changes in lithospheric thickness due to tectonic and magma processes occur more rapidly (or preferentially operated) in the crustal section than in the lithospheric mantle. Finally, it is possible that that the crust and lithospheric mantle do not thicken proportionally. If this is the case, effective changes in crustal thickness would be modulated by limited change of the mantellic section of lithosphere. Accordingly, Lee et al. [57] demonstrated that mountain elevation directly correlates with the Moho depth, indicating that high elevations are isostatically compensated by crustal thickness, with second order mantle contributions.
The corollary of our conceptual petrogenetic model (aimed at explaining what is behind our new proxy) is that the thicker the existing crust and lithosphere, the deeper the potential reservoirs (e.g., “deep hot zones”, Figure 1) and the higher the difference in iron and calcium between primary and derived mafic magmas. The causes and consequences of such a deep fractionation of magma in Proterozoic crusts can be now addressed.
4.5. Geodynamic Perspectives
Our new proxy using Ca content (wt%) in mafic lava (Figure 12a) suggests that the Archaean crust (<35 km) thickened during the Proterozoic (>50 km) and thinned in the Phanerozoic, which is consistent with results of Dhuime et al. [18]. If correct, this change in global crustal thickness likely resulted from the interplay of several factors evolving throughout time and space, such as the secular cooling of mantle and its continental crust, as well as changes in geodynamic processes with the development of the plate tectonic regime we know today [30,42,58,59,60]. Such interplay potentially resulted in the formation of the first supercontinent (Columbia) on Earth, toward ca. 1.8 Gyrs (Figure 12c).
Geological and palaeomagnetic evidence reveals that the supercontinent, Columbia, was formed and stabilized between 1.8 and 1.3 Gyrs, undergoing limited reworking during its transformation to Rodinia between 1.1 and 0.9 Gyrs [61]. Ernst [62] proposed that Columbia represents a period of “lid tectonics,” with active subduction-related accretionary orogens focused along its margins during the Earth’s middle age [63,64]. We suggest that the prolonged existence (~1 Gyrs) of Columbia either contributed to or was the product of thick crustal sections within the supercontinent. One of the characteristic features of the Proterozoic magmatic record is the temporally limited appearance of massif-type anorthosites, largely between 1.8 and 1.0 Gyrs (Figure 12b), coincident with the existence of Columbia. The genesis of anorthosite magmas is attributed the deep-seated emplacement and partial crystallization of Fe-rich basalts, with the accumulation of buoyant plagioclase mush in magma chambers at pressures of (11–13 kbar), whereby gravitational instabilities drive the subsequent diapiric emplacement of the low density, plagioclase-rich mush at mid-crustal levels [41,65,66,67,68,69]. We propose that the lower crust accumulation of Fe-rich magma was facilitated by thickened crustal sections during the Proterozoic, potentially explaining the temporal distribution of anorthosite massifs in Earth’s history [63]. The reasons why continental crusts thinned in the Phanerozoic, closing the anorthosite factory, remain a challenge for future research. We posit that parts of the solution lie in the increasing reworking of the lithospheric mantle at active plate margin during supercontinent drifts ([70] and Ref. therein) as subduction zones became more prominent and Plate Tectonics more efficient.
Author Contributions
J.G. conceived the study and wrote the paper. X.F. contributed to the database building. All authors contributed to the interpretation of results.
Funding
The project was supported by the IRD and CNRS-INSU research funds.
Acknowledgments
Two anonymous reviewers are warmly thanked for their stimulating reviews and for the wonderfully spirited exchange of ideas surrounding data interpretation. Comments by Suzanne Kay, Jean Bédard and an anonymous reviewer on an early draft of this paper are gratefully acknowledged. They are thanked for providing helpful comments and suggestions.
Conflicts of Interest
The authors declare no competing financial interests.
References
- Korenaga, J. Archean geodynamics and the thermal evolution of Earth. In Archean Geodynamics and Environments; Benn, K., Mareschal, J.-C., Condie, K., Eds.; American Geophysical Union: Washington, DC, USA, 2006; Volume 164, pp. 7–32. [Google Scholar]
- Johnson, T.E.; Brown, M.; Kaus, B.J.P.; Van Tongeren, J.A. Delamination and recycling of Archaean crust caused by gravitational instabilities. Nat. Geosci. 2014, 7, 47–52. [Google Scholar] [CrossRef]
- Taylor, S.R.; McLennan, S.M. The Continental Crust: Its Composition and Evolution; Blackwell Scientific Publications: Oxford, UK, 1985; 312p. [Google Scholar]
- Herzberg, C.; Rudnick, R. Formation of cratonic mantle: An integrated thermal and petrological model. Lithos 2012, 4, 14–19. [Google Scholar]
- Rey, P.F.; Houseman, G. Lithospheric scale gravitational flow: The impact of body forces on orogenic processes from Archaean to Phanerozoic. Geol. Soc. Lond. Spec. Publ. 2006, 253, 153–167. [Google Scholar] [CrossRef]
- Chardon, D.; Gapais, D.; Cagnard, F. Flow of ultra-hot orogens: A view from the Precambrian, clues for the Phanerozoic. Tectonophysics 2009, 477, 105–118. [Google Scholar] [CrossRef]
- Tang, M.; Chen, K.; Rudnick, R.L. Archean upper crust transition from mafic to felsic marks the onset of plate tectonics. Science 2016, 351, 372–375. [Google Scholar] [CrossRef] [PubMed]
- Durrheim, R.J.; Mooney, W.D. Archean and Proterozoic crustal evolution: Evidence from crustal seismology. Geology 1991, 19, 606–609. [Google Scholar] [CrossRef]
- Mooney, W.D.; Laske, G.; Masters, T.G. CRUST 5.1: A global crustal model at 5° × 5°. J. Geophys. Res. 1998, 103, 727–747. [Google Scholar] [CrossRef] [Green Version]
- Wever, T. Comment and reply on “Archean and Proterozoic crustal evolution: Evidence from crustal seismology”. Geology 1992, 20, 664–665. [Google Scholar] [CrossRef]
- Cook, F.A.; Erdmer, P. A 1800 km crossection of the lithosphere through the northwestern North American plate: Lessons from 4.0 billion years of Earth history. Can. J. Earth Sci. 2005, 42, 1295–1311. [Google Scholar] [CrossRef]
- Stankiewicz, J.; de Wit, M. 3.5 billion years of reshaped Moho, southern Africa. Tectonophysics 2013, 609, 675–689. [Google Scholar] [CrossRef]
- Mantle, G.W.; Collins, W.J. Quantifying crustal thickness variations in evolving orogens: Correlation between arc basalt composition and Moho depth. Geology 2008, 38, 87–90. [Google Scholar] [CrossRef]
- Zellmer, G. Some first-order observations on magma transfer from mantle wedge to upper crust at volcanic arcs. Geol. Soc. Lond. Spec. Publ. 2008, 304, 15–31. [Google Scholar] [CrossRef]
- Chiaradia, M. Copper enrichment in arc magmas controlled by overriding plate thickness. Nat. Geosci. 2014, 7, 43–46. [Google Scholar] [CrossRef]
- Chapman, J.; Ducea, N.; DeCelles, P.G.; Profeta, L. Tracking changes in crustal thickness during orogenic evolution with Sr/Y: An example from the North American Cordillera. Geology 2015, 43, 919–922. [Google Scholar] [CrossRef]
- Profeta, L.; Ducea, M.N.; Chapman, J.B.; Paterson, S.R.; Gonzales, S.M.H.; Kirsch, M.; Petrescu, L.; DeCelles, P.G. Quantifying crustal thickness over time in magmatic arcs. Sci. Rep. 2015, 5. [Google Scholar] [CrossRef] [PubMed]
- Dhuime, B.; Wuestefeld, A.; Hawkesworth, C.J. Emergence of modern continental crust about 3 billion years ago. Nat. Geosci. 2015, 8, 552–555. [Google Scholar] [CrossRef]
- Turner, S.J.; Langmuir, C.H. The global chemical systematics of arc front stratovolcanoes: Evaluating the role of crustal processes. Earth Planet. Sci. Lett. 2015, 422, 182–193. [Google Scholar] [CrossRef]
- Plank, T.; Langmuir, C.H. An evaluation of the global variations in the major element chemistry of arc basalts. Earth Planet. Sci. Lett. 1988, 90, 349–370. [Google Scholar] [CrossRef]
- Hildreth, W.; Moorbath, S. Crustal contributions to arc magmatism in the Andes of Central Chile. Contrib. Mineral. Petrol. 1988, 98, 455–489. [Google Scholar] [CrossRef]
- Müntener, O.; Kelemen, P.B.; Grove, T.L. The role of H2O during crystalliza-tion of primitive arc magmas under uppermost mantle conditions and genesis of igneous pyroxenites: An experimental study. Contrib. Mineral. Petrol. 2001, 141, 643–658. [Google Scholar] [CrossRef]
- Annen, C.; Blundy, J.; Sparks, R. The Genesis of Intermediate and Silicic Magmas in Deep Crustal Hot Zones. J. Petrol. 2006, 47, 505–539. [Google Scholar] [CrossRef]
- Lee, C.-T.; Bachmann, O. How important is the role of crystal fractionation in making intermediate magmas? Insights from Zr and P systematics. Earth Planet. Sci. Lett. 2014, 393, 266–274. [Google Scholar] [CrossRef]
- Turner, S.J.; Langmuir, C.H.; Katz, R.F.; Dungan, M.A.; Escrig, S. Parental arc magma compositions dominantly controlled by mantle-wedge thermal structure. Nat. Geosci. 2016, 9, 772–776. [Google Scholar] [CrossRef]
- Herzberg, C.; Condie, K.; Korenaga, J. Thermal history of the Earth and its petrological expression. Earth Planet. Sci. Lett. 2010, 292, 79–88. [Google Scholar] [CrossRef]
- Condie, K.C.; Aster, R.C.; van Hunen, J. A great thermal divergence in the mantle beginning 2.5 Ga. geochemical constraints from greenstones basalt. Geosci. Front. 2016, 7, 543–553. [Google Scholar] [CrossRef] [Green Version]
- Ganne, J.; Feng, X. Primary magmas and mantle temperatures through time. Geochem. Geophys. Geosyst. 2017. [Google Scholar] [CrossRef]
- Ganne, J.; Feng, X.; Rey, P.; de Andrade, V. Statistical Petrology Reveals a Link Between Supercontinents Cycle and Mantle Global Climate. Am. Mineral. 2017, 101, 2768–2773. [Google Scholar] [CrossRef]
- Palin, R.M.; Dyck, B. Metamorphic consequences of secular changes in oceanic crust composition and implications for uniformitarianism in the geological record. Geosci. Front. 2018, 9, 1009–1019. [Google Scholar] [CrossRef]
- Ganne, J.; Schellart, W.; Rosenbaum, G.; Feng, X.; de Andrade, V. Probing crustal thickness evolution and geodynamic processes in the past from magma records: An integrated approach. GSA Spec. Pap. 2016. [Google Scholar] [CrossRef]
- Li, C.; Arndt, N.T.; Tang, Q.; Ripley, E.M. Trace element indiscrimination diagrams. Lithos 2015, 232, 76–83. [Google Scholar] [CrossRef]
- De Wit, M.J.; Ashwal, L.D. Greenstone Belts; Oxford University Press: Oxford, UK; Clarendon, TX, USA, 1997; 809p. [Google Scholar]
- Ernst, R.E. Large Igneous Provinces; Cambridge University Press: Cambridge, UK, 2014; 653p. [Google Scholar]
- Keller, C.B.; Schoene, B. Statistical geochemistry reveals disruption in secular lithospheric evolution about 2.5 Gyr ago. Nature 2012, 485, 490–493. [Google Scholar] [CrossRef] [PubMed]
- Herzberg, C.; Asimow, P.D. PRIMELT3 MEGA.XLSM software for primary magma calculation: Peridotite primary magma MgO contents from the liquidus to the solidus. Geochem. Geophys. Geosyst. 2015, 16, 563–578. [Google Scholar] [CrossRef] [Green Version]
- Herzberg, C.; Asimow, P.D. Petrology of some oceanic island basalts: PRIMELT2. XLS software for primary magma calculation. Geochem. Geophys. Geosyst. 2008, 9. [Google Scholar] [CrossRef]
- Putirka, K.D. Thermometers and barometers for volcanic systems. Rev. Mineral. Geochem. 2008, 69, 61–120. [Google Scholar] [CrossRef]
- Farmer, M.J.; Lee, C.-T.A. Effects of crustal thickness on magmatic differentiation in subduction zone volcanism: A global study. Earth Planet. Sci. Lett. 2017, 470, 96–107. [Google Scholar] [CrossRef]
- Gale, A.; Dalton, C.A.; Langmuir, C.H.; Su, Y.; Schilling, J.-G. The mean composition of ocean ridge basalts. Geochem. Geophys. Geosyst. 2013, 14, 489–518. [Google Scholar] [CrossRef] [Green Version]
- Ashwal, L.D. Anorthosites Minerals and Rocks; Springer: Berlin, Germany, 1996; p. 422. [Google Scholar]
- Brown, M.D. Characteristic thermal regimes of plate tectonics and their metamorphic imprint throughout Earth history: When did Earth first adopt a plate tectonics mode of behavior? In When Did Plate Tectonics Begin on Planet Earth? Condie, K.C., Pease, V., Eds.; GSA Special Issue; Geological Society of America: Boulder, CO, USA, 2008; Volume 440, pp. 97–128. [Google Scholar]
- Nandedkar, R.H.; Ulmer, P.; Müntener, O. Fractional crystallization of primi-tive, hydrous arc magmas: An experimental study at 0.7GPa. Contrib. Mineral. Petrol. 2014, 167, 1–27. [Google Scholar] [CrossRef]
- Cashman, K.V.; Sparks, S.J.; Blundy, J.D. Vertically extensive and unstable system: A unified view of igneous processes. Science 2017, 355, 6331. [Google Scholar] [CrossRef] [PubMed]
- Ganne, J.; Bachmann, O.; Feng, X. Deep into magma plumbing systems: Interrogating the crystal cargo of volcanic deposits. Geology 2018. [Google Scholar] [CrossRef]
- Putirka, K.D. Down the Crater: Where Magmas are Stored and Why They Erupt. Elements 2017, 13, 11–16. [Google Scholar] [CrossRef]
- Herzberg, C. Partial Crystallization of Mid-Ocean Ridge Basalts in the Crust and Mantle. J. Petrol. 2004, 12, 2389–2405. [Google Scholar] [CrossRef]
- Ganne, J.; Feng, X. Magmatism: A crustal and geodynamic perspective. J. Struct. Geol. 2018. [Google Scholar] [CrossRef]
- Priestley, K.; McKenzie, D. The relationship between shear wave velocity, temperature, attenuation and viscosity in the shallow part of the mantle. Earth Planet. Sci. Lett. 2013, 381, 78–91. [Google Scholar] [CrossRef]
- DeCelles, P.G.; Ducea, M.; Kapp, P.; Zandt, G. Cyclicity in Cordilleran orogenic systems. Nat. Geosci. 2009, 2, 251–257. [Google Scholar] [CrossRef]
- Jaupart, C.; Mareschal, J.-C. 6.05 Heat Flow and Thermal Structure of the Lithosphere. Treatise Geophys. 2014, 6, 217–253. [Google Scholar] [CrossRef]
- Collins, W.J.; Belousova, A.E.; Kemp, A.I.S.; Murphy, J.B. Two contrasting Phanerozoic orogenic systems revealed by hafnium isotope data. Nat. Geosci. 2011, 4, 333–336. [Google Scholar] [CrossRef]
- Putirka, K.; Jean, M.; Sharma, R.; Torrez, G.; Carlson, C. Cenozoic volcanism in the Sierra Nevada, and a new model for lithosphere degradation. Geosphere 2012, 8, 265–291. [Google Scholar] [CrossRef]
- McKenzie, D.; Daly, M.C.; Priestley, K. The lithospheric structure of Pangea. Geology 2015, 4, 783–786. [Google Scholar] [CrossRef]
- Tassara, A.; Echaurren, A. Anatomy of the Andean subduction zone: Three-dimensional density model upgraded and compared against global-scale models. Geophys. J. Int. 2012, 189, 161–168. [Google Scholar] [CrossRef]
- Artemieva, I.M.; Mooney, W.D. Thermal thickness and evolution of Precambrian lithosphere: A global study. J. Geophys. Res. 2001, 106, 16387–16414. [Google Scholar] [CrossRef] [Green Version]
- Lee, C.-T.A.; Thurner, S.; Paterson, S.; Cao, W. The rise and fall of continental arcs: Interplays between magmatism, uplift, weathering, and climate. Earth Planet. Sci. Lett. 2015, 425, 105–119. [Google Scholar] [CrossRef] [Green Version]
- Condie, K.C.; Kröner, A. When did plate tectonics begin? Evidence from the geologic record. In When Did Plate Tectonics Begin on Planet Earth? Condie, K.C., Pease, V., Eds.; GSA Special Issue; Geological Society of America: Boulder, CO, USA, 2008; Volume 440, pp. 281–294. [Google Scholar]
- Ganne, J.; De Andrade, V.; Weinberg, R.F.; Vidal, O.; Dubacq, B.; Kagambega, N.; Naba, S.; Baratoux, L.; Jessell, M.; Allibon, J. Modern-style plate subduction preserved in the Palaeoproterozoic West African Craton. Nat. Geosci. 2012, 5, 60–65. [Google Scholar] [CrossRef]
- Laurent, O.; Martin, H.; Moyen, J.F.; Doucelance, R. The diversity and evolution of late-Archean granitoids: Evidence for the onset of “modern-style” plate tectonics between 3.0 and 2.5 Ga. Lithos 2014, 205, 208–235. [Google Scholar] [CrossRef]
- Roberts, N.M.W. The boring billion?—Lid tectonics, continental growth and environmental change associated with the Columbia supercontinent. Geosci. Front. 2013, 4, 681–691. [Google Scholar] [CrossRef] [Green Version]
- Ernst, W.G. Archean plate tectonics, rise of Proterozoic supercontinentality and onset of regional, episodic stagnant-lid behavior. Gondwana Res. 2009, 15, 243–253. [Google Scholar] [CrossRef]
- Cawood, P.A.; Hawkesworth, C.J. Earth’s middle age. Geology 2014, 42, 503–506. [Google Scholar] [CrossRef] [Green Version]
- Cawood, A.P.; Kröner, A.; Pisarevky, S. Precambrian plate tectonics: Criteria and evidence. GSA Today 2006, 16, 4–11. [Google Scholar] [CrossRef]
- Emslie, R.F. Proterozoic anorthosite massifs. In The Deep Proterozoic Crust in the North Atlantic Provinces NATO ASI C158; Tobi, A.C., Touret, J.L., Eds.; Kluwer Academic: Dordrecht, The Netherlands, 1985; pp. 39–60. [Google Scholar]
- Longhi, J.; Fram, M.S.; Auwera, J.V.; Montieth, J.N. Pressure effects, kinetics, and rheology of anorthositic and related magmas. Am. Mineral. 1993, 78, 1016–1030. [Google Scholar]
- Longhi, J.; Vander Auwera, J.; Fram, M.S.; Duchesne, J.C. Some phase equilibrium constraints on the origin of Proterozoic (Massif) anorthosites and related rocks. J. Petrol. 1999, 40, 339–362. [Google Scholar] [CrossRef]
- Duchesne, J.C.; Liégeois, J.P.; Auwera, J.V.; Longhi, J. The crustal tongue melting model and the origin of massive anorthosites. Terra Nova 1999, 11, 100–105. [Google Scholar] [CrossRef]
- Namur, O.; Charlier, B.; Pirard, C.; Hermann, J.; Liégeois, J.P.; Vander Auwera, J. Anorthosite formation by plagioclase flotation in ferrobasalt and implications for the lunar crust. Geochim. Cosmochim. Acta 2011, 75, 4998–5018. [Google Scholar] [CrossRef]
- Tappe, S.; Smart, K.; Torsvik, T.; Massuyeau, M.; de Wit, M. Geodynamics of kimberlites on a cooling Earth: Clues to plate tectonic evolution and deep volatile cycles. Earth Planet. Sci. Lett. 2018, 484, 1–14. [Google Scholar] [CrossRef]
Figure 1.
Schematic 3-D model of active margin hosting a “deep hot zone” that formed along the crust-mantle boundary.
Figure 1.
Schematic 3-D model of active margin hosting a “deep hot zone” that formed along the crust-mantle boundary.

Figure 2.
Distribution of Proterozoic (a) and Phanerozoic (b) magmatism on the Earth’s continental surface. The figure shows that Phanerozoic magmatism mostly occurs in lithosphere rimming Archaean and Proterozoic cratons and a concentric distribution of Proterozoic magma is also observed at the boundaries of Archaean nuclei, suggesting that most Precambrian lava considered in this study took place in arc settings.

Figure 3.
(a) Chemical evolution of clinopyroxene (Al4+ a.p.f.u. and CaTi end member component) according to their age (16,683 analyses). The data illustrates an increase in high-Ti and high-Al clinopyroxene occurrence in magmatic systems, from ca. 1 Gyr to present day, following a ~1 Gyr period dominated by low-Ti and low-Al clinopyroxenes. (b) Chemical evolution of amphibole (Ti and Si a.p.f.u.) according to their age (11,218 analyses). The data illustrates an increase in high-Ti and low-Si amphibole occurrence in magmatic systems, from ca. 1 Gyr to present day, following a ~1 Gyr period dominated by low-Ti and high-Si amphiboles.

Figure 4.
(a,b) Statistical assessment on the temperature conditions of amphibole (amph) and clinopyroxene (cpx) crystallization in magma (lava, continental s.l. record), using the min-Liq method [38], plotted against the composition of young Cenozoic magma (ca. 10–0 Myrs) hosting these minerals. Black and colored dots correspond to the bootstrapped values (1000 draws, threshold value of 3, uncertainty bars corresponding to ±1 σ standard deviation, chemical step of 1 unit). The black dots concern all magma in equilibrium with amph and cpx whereas the colored ones correspond to mafic magma, selected by ranges of composition in Si or Mg. It confirms that a positive correlation exists between Ca content of magma and temperature of crystallization for amph and cpx. Whatever the range of composition considered for mafic magma (Si43–51; Si45–55 or Mg06), the slope of correlation appear broadly similar. (c,d) T conditions of cpx and amph crystallization using the min-Liq method [38], plotted against the age of magma. The data illustrates an increase in low-T (T < 1000 °C) cpx and amph occurrence from ca. 0.3 Gyrs to present day [31], following a ~300 Myrs period dominated by the apparent absence of high-T cpx. Though, a temporal bias could exist in the Paleozoic times. Accordingly, an intriguing lack of mineral analysis is clearly observed in the Precambrian record (e), hampering the use of magmatic thermometers [38] to investigate the thermal evolution of mafic to felsic magma.

Figure 5.
(a–d) Range of compositions (FeOT, CaO, Na2O + K2O and MgO wt%) for mafic magmas (43 < SiO2 < 51 wt%) sampled around the world (>22,000 samples of lava, continental s.l. record) and statistical assessment of the averaged-values evolution through time (black drawbars; uncertainty bars correspond to ±1 σ standard deviation for age step of 100 Myrs). Whatever the range of composition considered for mafic magma (Si43–51 or Mg06), the temporal trends appear broadly similar. (b) A divergence in FeOT (wt%) between mafic magmas (43 < SiO2 < 51 wt%) sampled in recent (<200 Ma) arc-settings (GEOROC information) and the global systematics for continental s.l. mafic magma is observed. Such discrepancy is consistent with a more marked calc-alkaline evolution for mafic magma in arc setting, involving Fe depletion through mineral fractionation in the lithospheric section.

Figure 6.
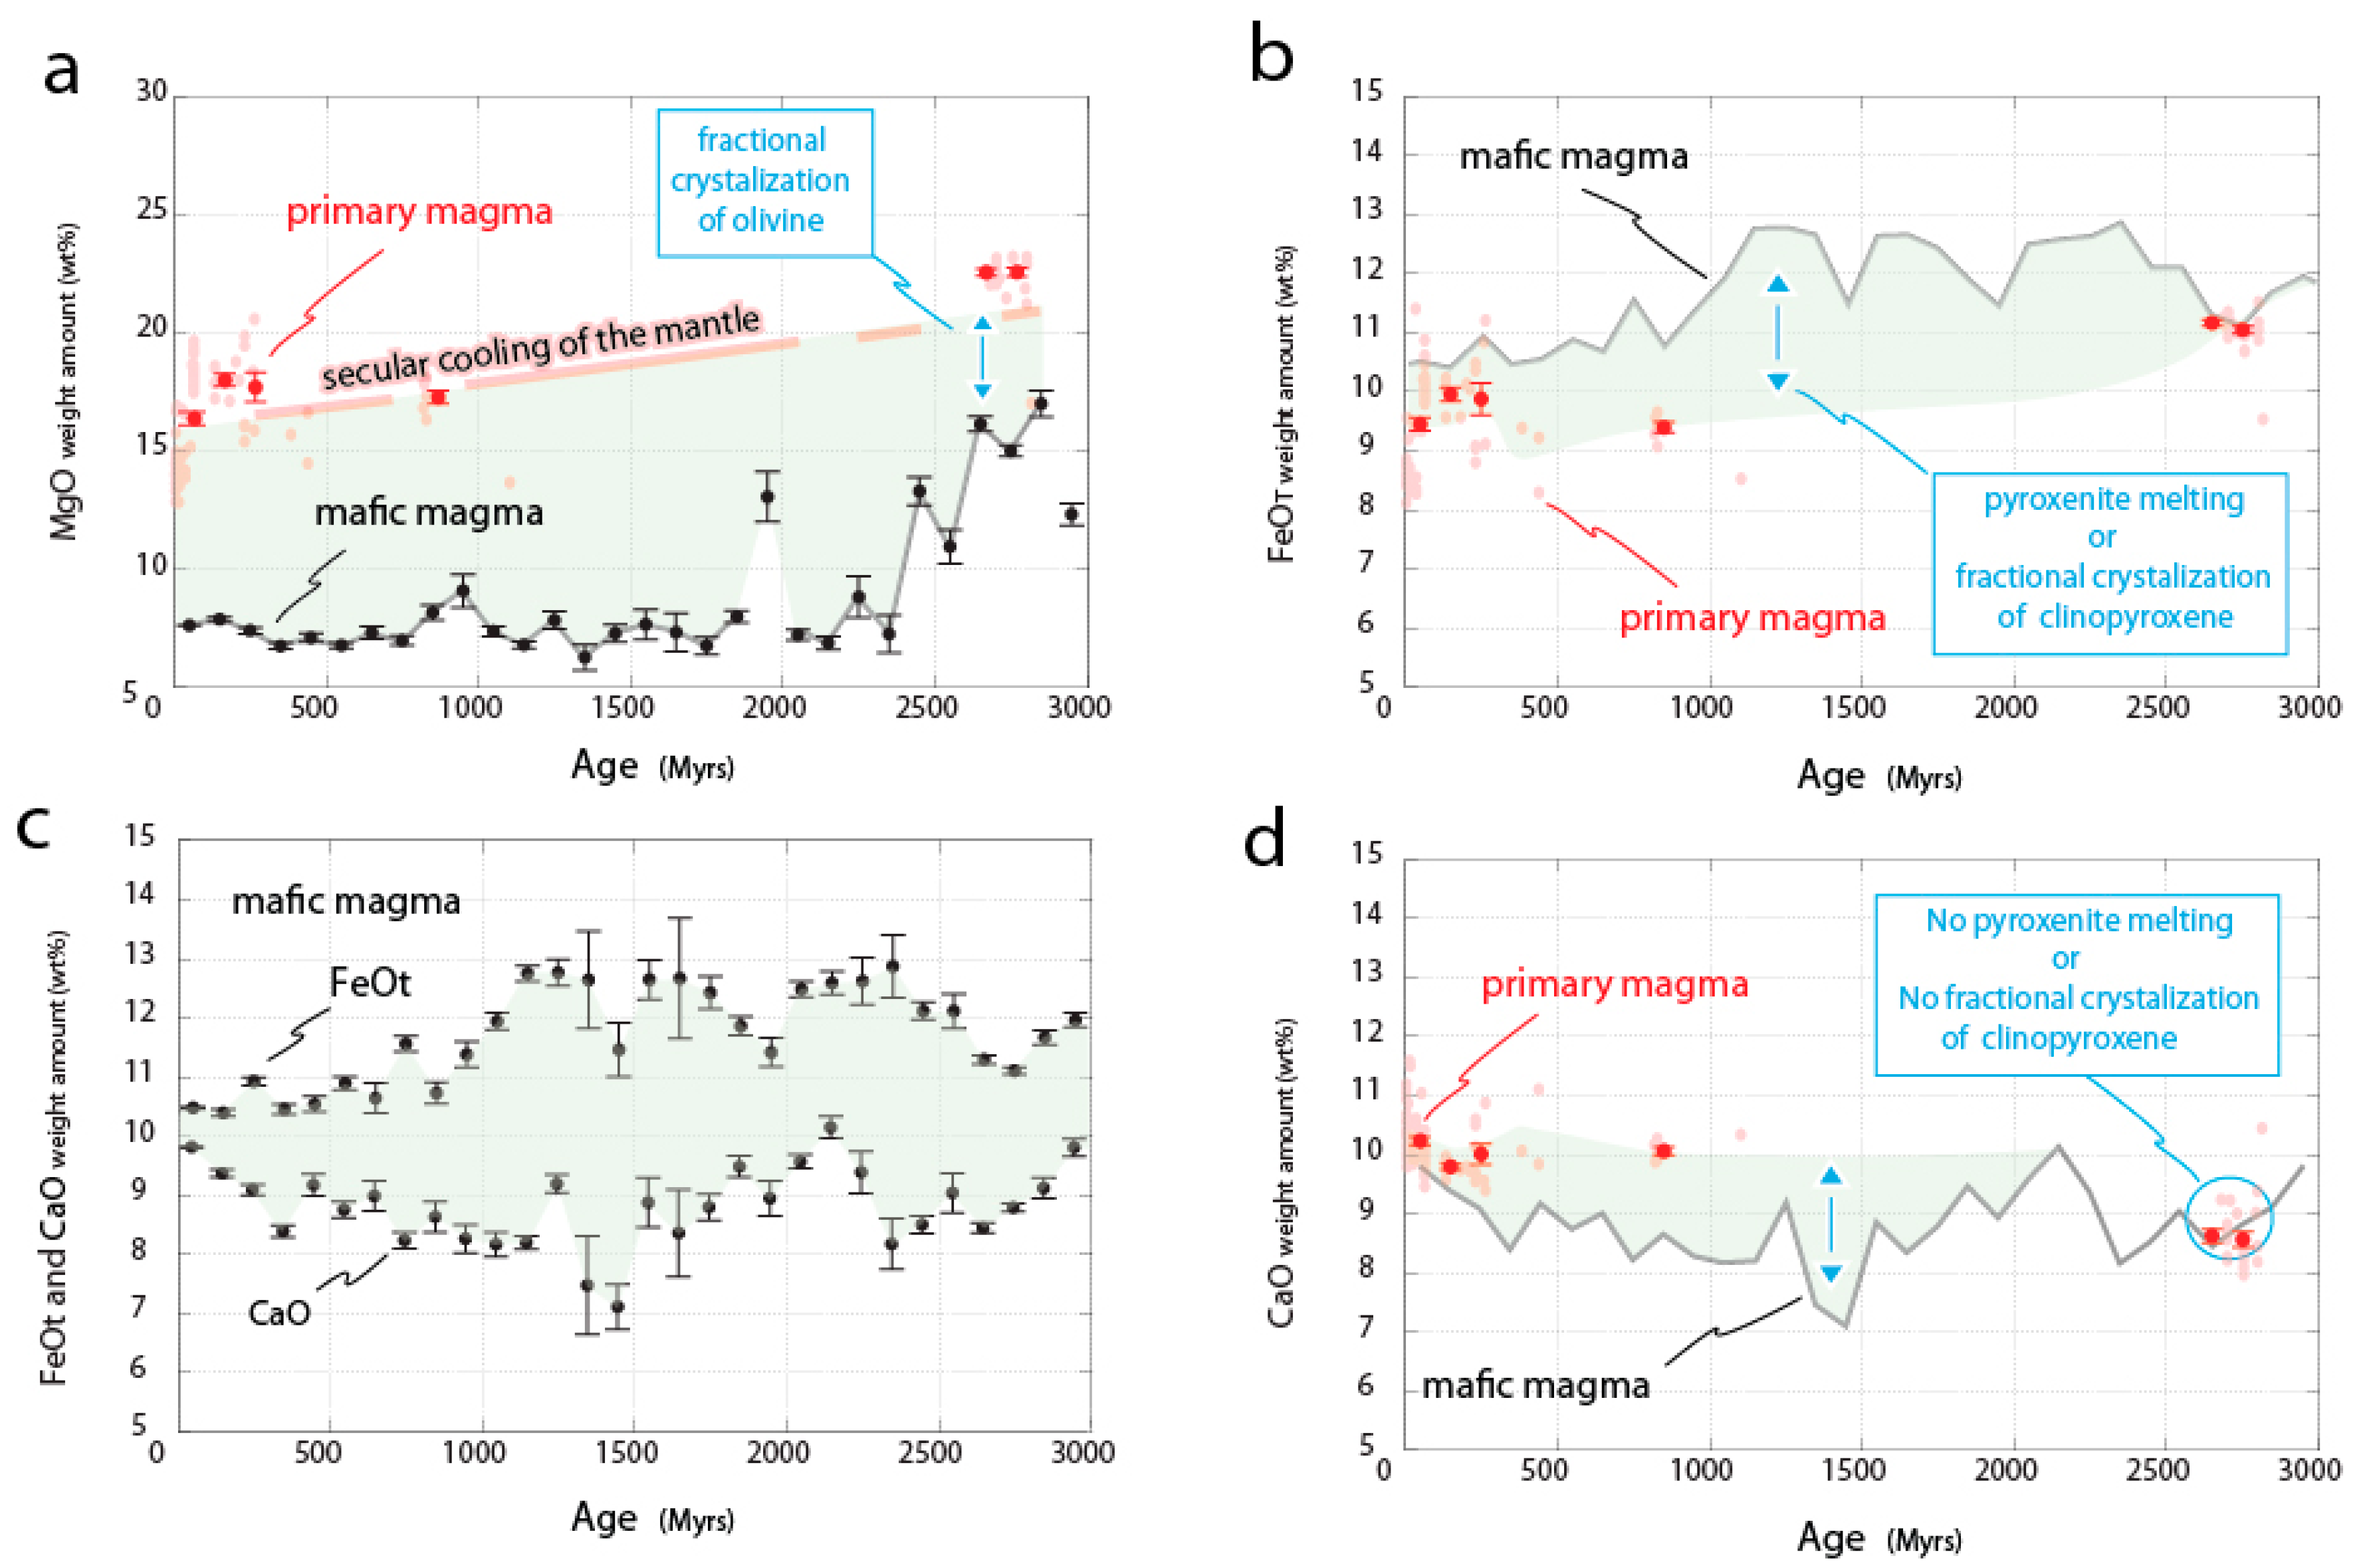
Chemical signature of mafic and primary magma throughout geological time. (a,c) Range of composition (FeOT, CaO and MgO wt%) for mafic magmas (43 < SiO2 < 51 wt%) sampled around the world (>22,000 samples) and statistical assessment of the averaged-values evolution through time (black drawbars; uncertainty bars correspond to ±1 σ standard deviation for age step of 100 Myrs). Averaged composition of primary magmas (103 samples, light red dots) (i) calculated with PRIMELT3 MEGA software [36], (ii) using reduced (Fe2O3/TiO2 = 0.5) conditions in the source and (iii) filtered for MgO > 10% [28], was reported on the graphs (red points). A decrease in FeOT, CaO and MgO wt% of the primary magmas is observed since the end of the Archaean (~2.5 Gyrs). (b,d) The divergence in MgO (wt%) between mafic and primary magmas can be explained by a fractionation of olivine (red arrows) ; the divergence in FeOT and CaO (wt%) requires either a subtraction (black arrows) of clinopyroxene from the primary melt or a melting of residual material (pyroxenite) in the lithosphere.
Figure 6.
Chemical signature of mafic and primary magma throughout geological time. (a,c) Range of composition (FeOT, CaO and MgO wt%) for mafic magmas (43 < SiO2 < 51 wt%) sampled around the world (>22,000 samples) and statistical assessment of the averaged-values evolution through time (black drawbars; uncertainty bars correspond to ±1 σ standard deviation for age step of 100 Myrs). Averaged composition of primary magmas (103 samples, light red dots) (i) calculated with PRIMELT3 MEGA software [36], (ii) using reduced (Fe2O3/TiO2 = 0.5) conditions in the source and (iii) filtered for MgO > 10% [28], was reported on the graphs (red points). A decrease in FeOT, CaO and MgO wt% of the primary magmas is observed since the end of the Archaean (~2.5 Gyrs). (b,d) The divergence in MgO (wt%) between mafic and primary magmas can be explained by a fractionation of olivine (red arrows) ; the divergence in FeOT and CaO (wt%) requires either a subtraction (black arrows) of clinopyroxene from the primary melt or a melting of residual material (pyroxenite) in the lithosphere.

Figure 7.
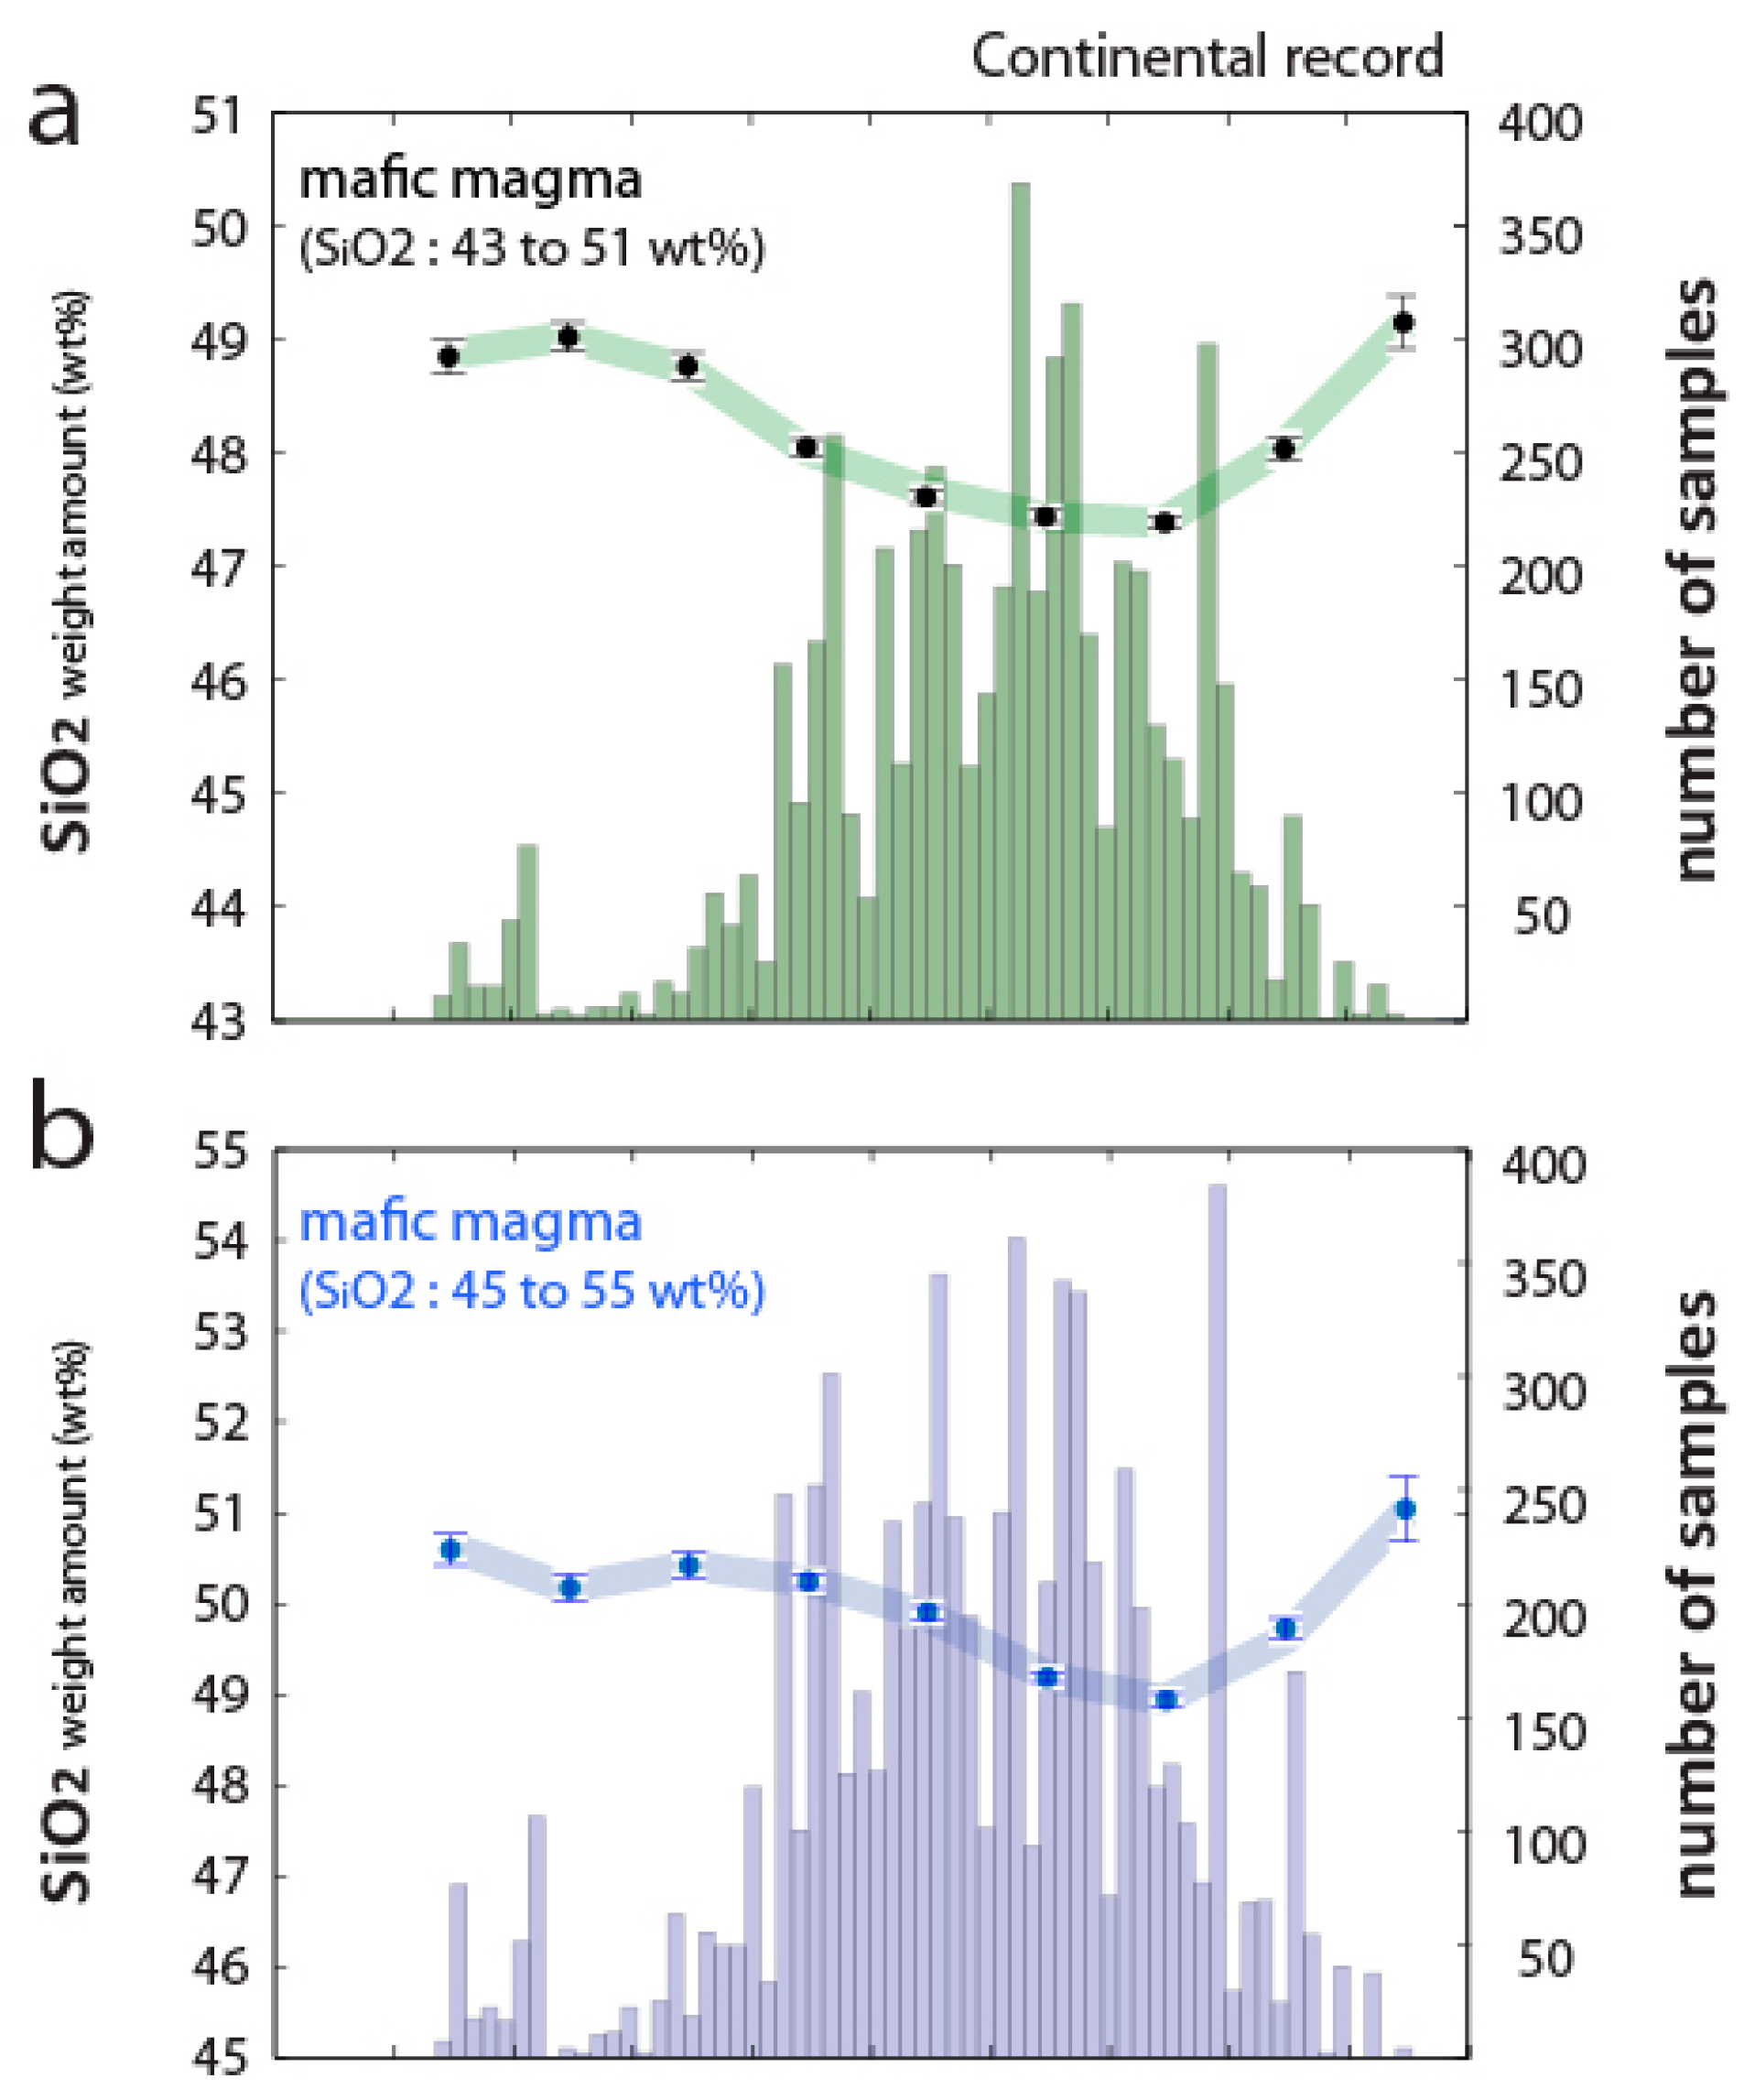
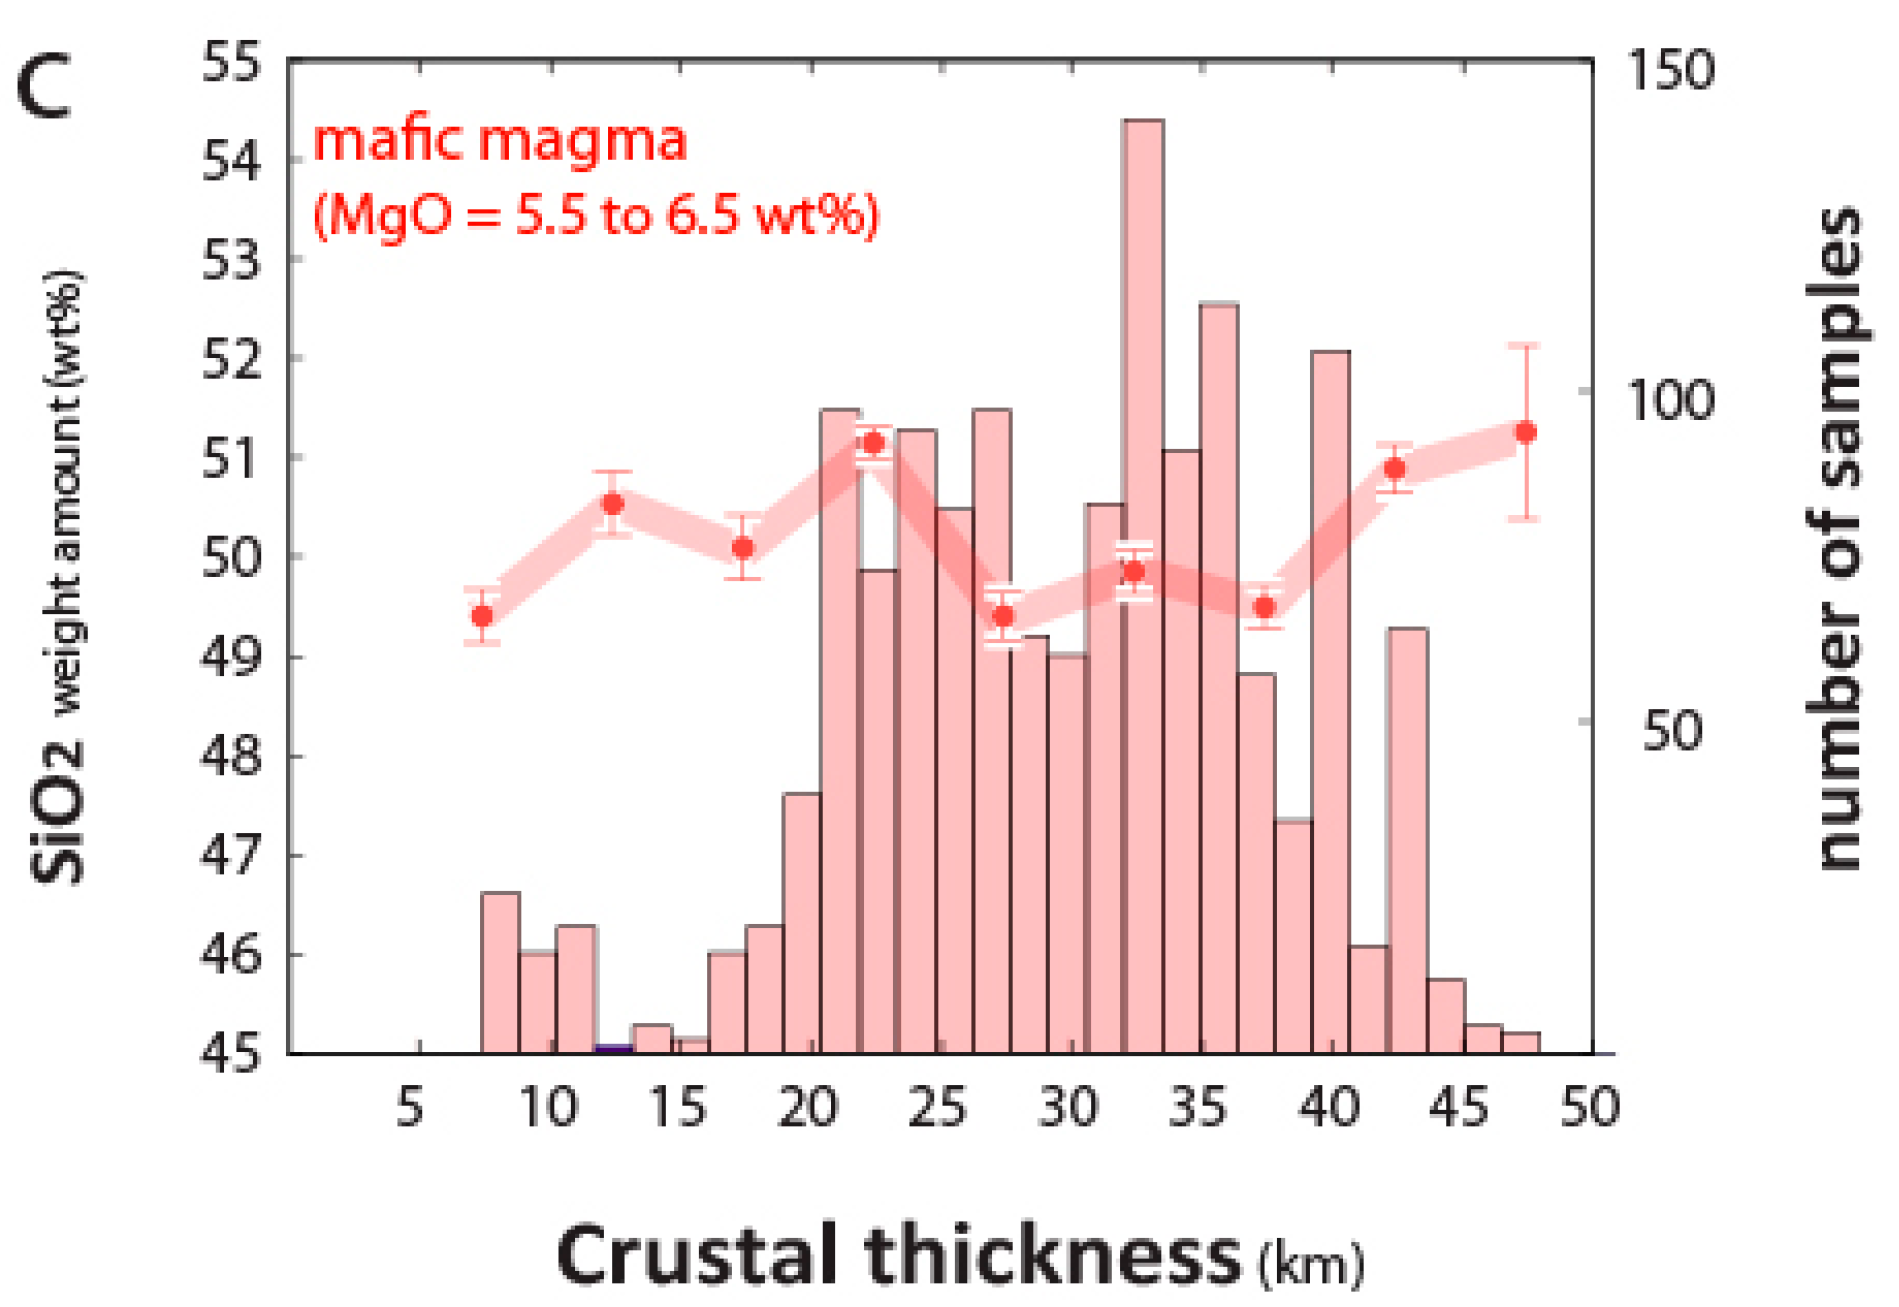
(a) Chemical composition of magmas plotted against crustal thickness [9] where young Cenozoic magmas (ca 10–0 Ma) were emplaced (lava, continental s.l. record). The Ca content of magma decreases with increasing alkali content (Na + K) and crustal thickness. Ca-rich magmas dominantly developed in the thinnest crustal sections (<25 km), marked by a strong anti-correlation between Ca and the alkali elements (Na + K). A less marked anti-correlation is observed in the thickest crustal sections (>25 Km). Beyond 45 km, less confidence can be given to the bootstrapped values, due to the lack of data in the geological record. (b) Whatever the range of composition considered for mafic magma (Si43–51; Si45–55 or Mg06), the slope of correlation (black dotted line) between crustal thickness and Ca in mafic magma appear broadly similar. R2 corresponds to the coefficient of determination associated with the line. (c) Statistical assessment of the evolution of mafic magmas (43 < SiO2 < 51 wt%) in FeOT, CaO and Na2O + K2O wt% through time (black drawbars; uncertainty bars correspond to ±1 σ standard deviation for age step of 50 Myrs). It confirms the anti-correlation between Ca (grey curve) and alkali-elements (orange curve) in magma and, to some extent with the iron (Fe) content (mauve curve).
Figure 7.
(a) Chemical composition of magmas plotted against crustal thickness [9] where young Cenozoic magmas (ca 10–0 Ma) were emplaced (lava, continental s.l. record). The Ca content of magma decreases with increasing alkali content (Na + K) and crustal thickness. Ca-rich magmas dominantly developed in the thinnest crustal sections (<25 km), marked by a strong anti-correlation between Ca and the alkali elements (Na + K). A less marked anti-correlation is observed in the thickest crustal sections (>25 Km). Beyond 45 km, less confidence can be given to the bootstrapped values, due to the lack of data in the geological record. (b) Whatever the range of composition considered for mafic magma (Si43–51; Si45–55 or Mg06), the slope of correlation (black dotted line) between crustal thickness and Ca in mafic magma appear broadly similar. R2 corresponds to the coefficient of determination associated with the line. (c) Statistical assessment of the evolution of mafic magmas (43 < SiO2 < 51 wt%) in FeOT, CaO and Na2O + K2O wt% through time (black drawbars; uncertainty bars correspond to ±1 σ standard deviation for age step of 50 Myrs). It confirms the anti-correlation between Ca (grey curve) and alkali-elements (orange curve) in magma and, to some extent with the iron (Fe) content (mauve curve).

Figure 8.
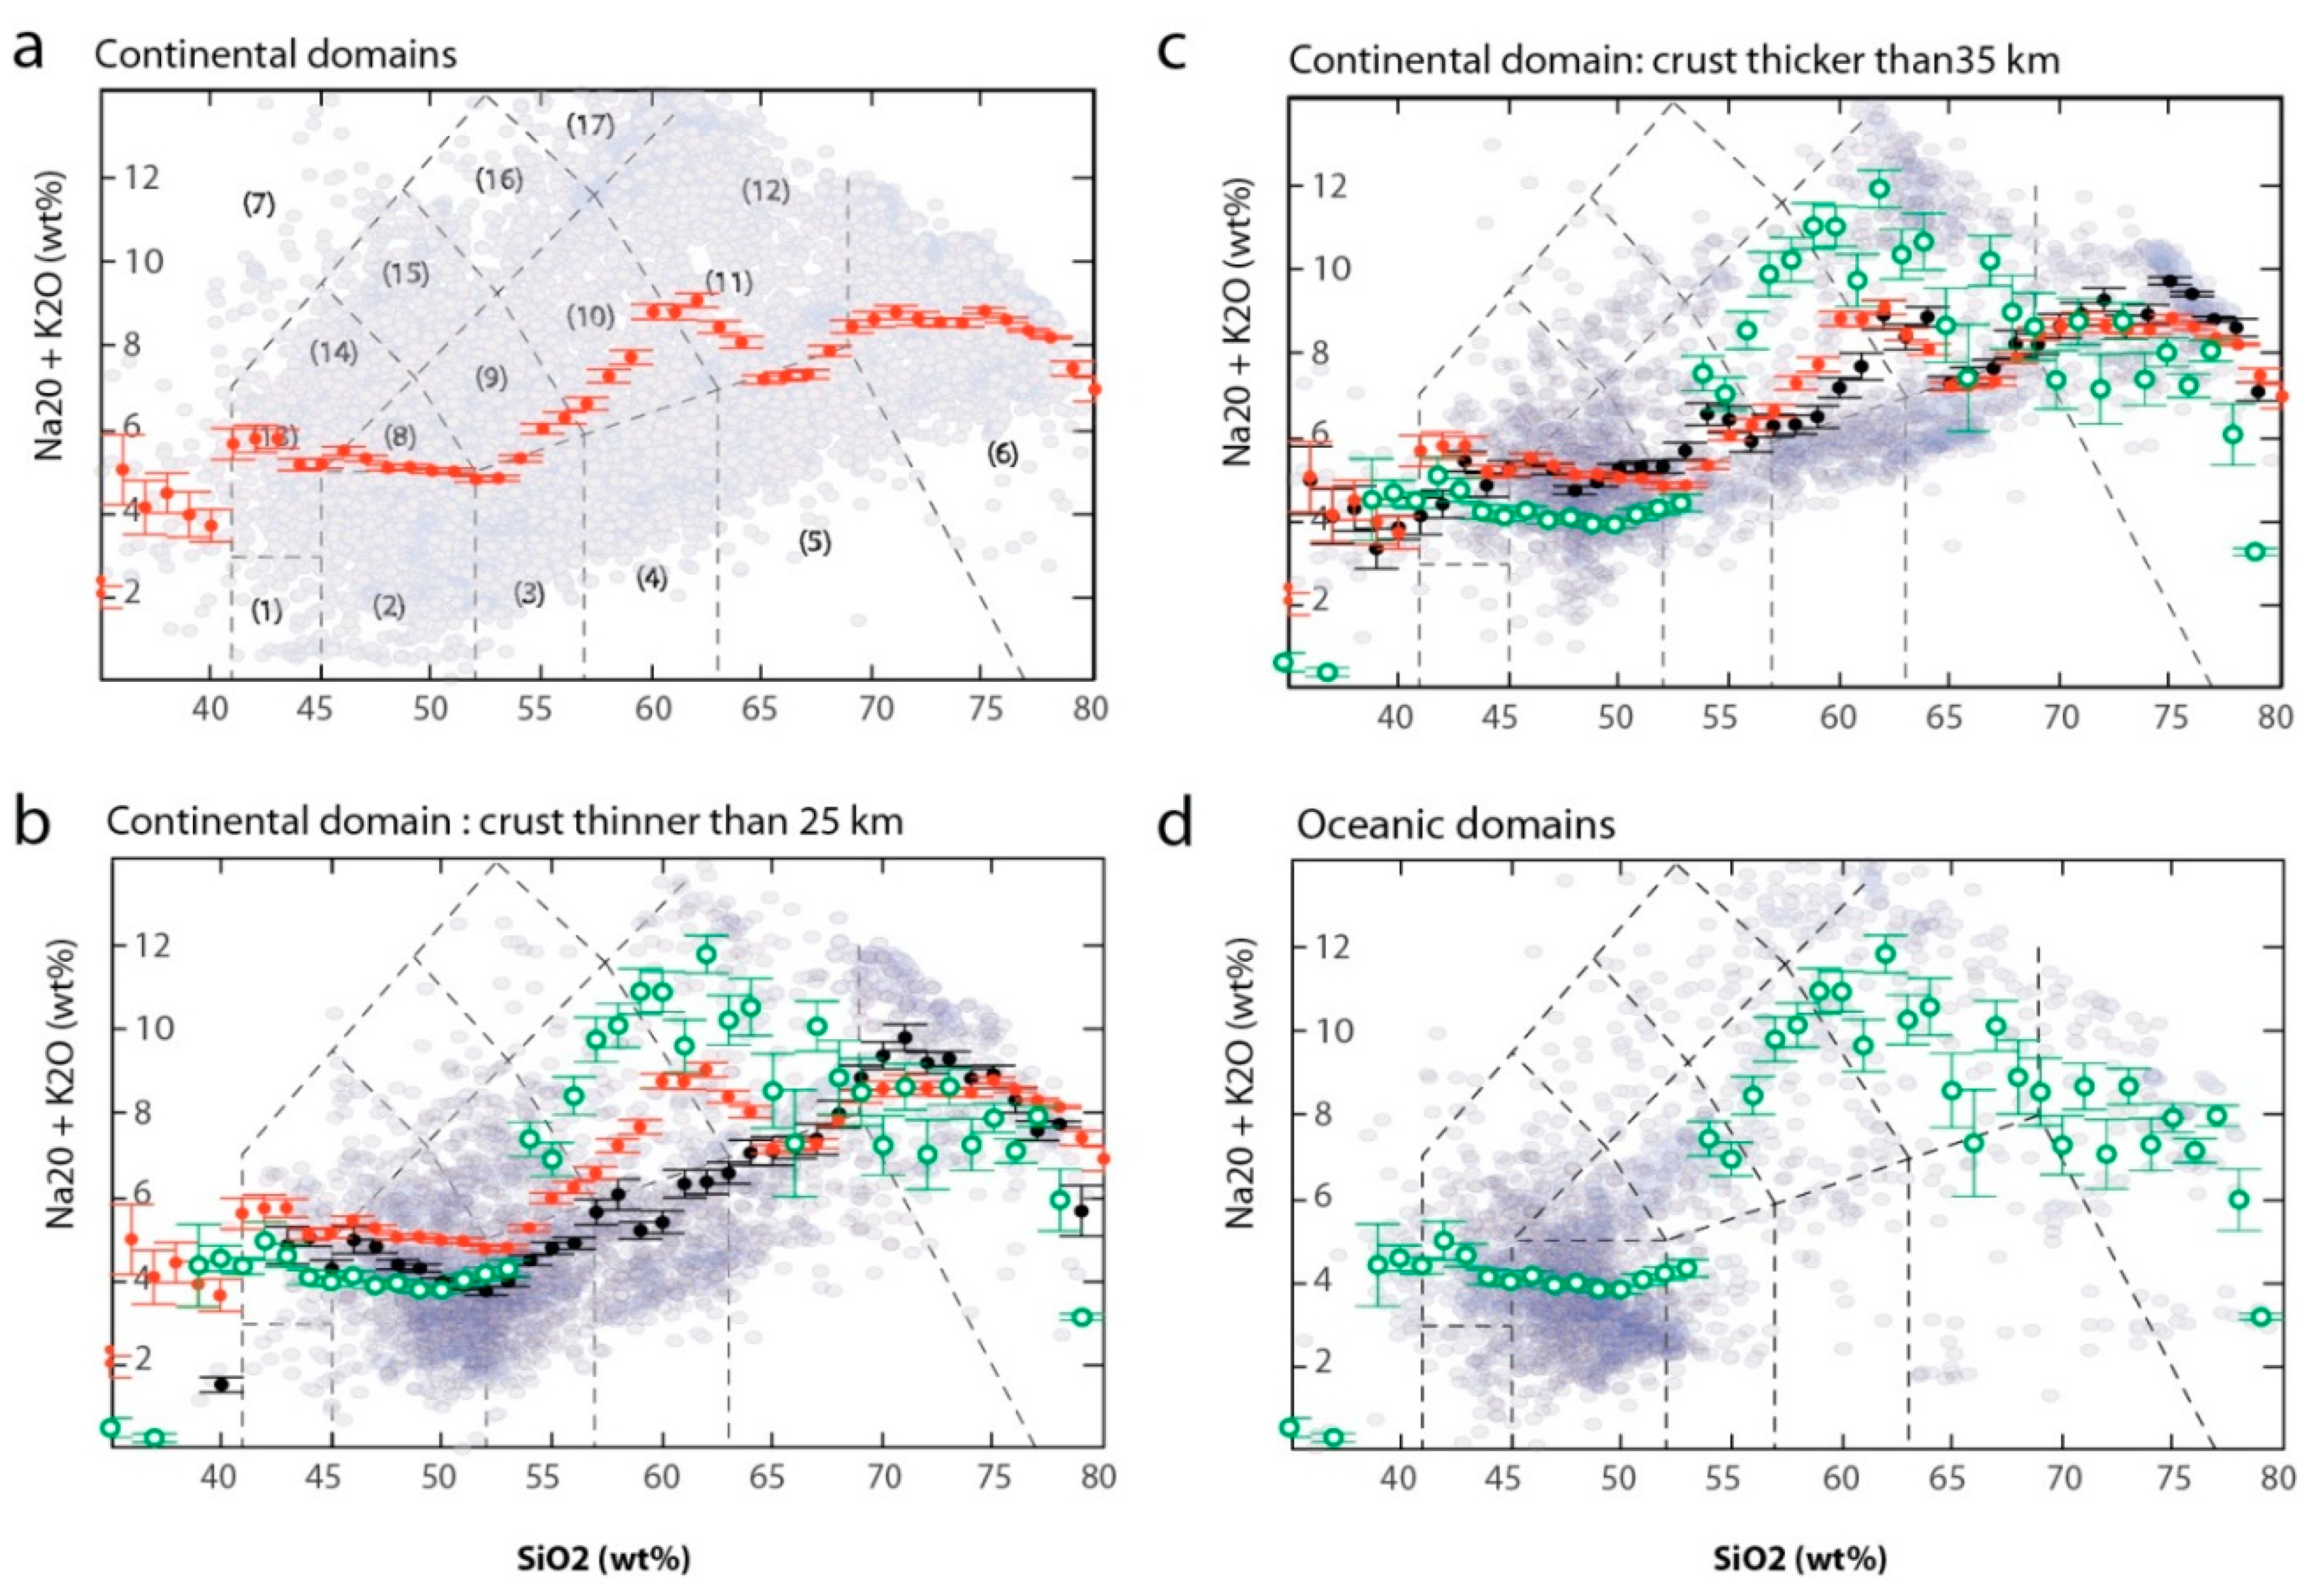
(a,d) Correlation between the gradual occurrence or decrease (statistical assessment) of alkali magmas in the oceanic (green dots) and continental s.l. (red dots) records. The alkalinity of magma (grey points) is given by the relative proportion of Na2O + K2O mass percent (wt%) of rocks throughout their SiO2 evolution (total-alkali content versus silica diagram: TAS diagram). Bootstrapping of the total-alkali content reveals a positive correlation between [Na2O + K2O] and SiO2 in the more evolved composition of magmas (SiO2 > 50 wt%). (b,c) The black dots yield correlations between the gradual increase or decrease of alkali magmas occurrences in the continental record s.l. and the crustal thickness at the site of eruption. Bootstrapping of the total-alkali content reveals a negative correlation between [Na2O + K2O] and SiO2 in the less evolved (basaltic) composition of magmas (SiO2 45–52 wt%).
Figure 8.
(a,d) Correlation between the gradual occurrence or decrease (statistical assessment) of alkali magmas in the oceanic (green dots) and continental s.l. (red dots) records. The alkalinity of magma (grey points) is given by the relative proportion of Na2O + K2O mass percent (wt%) of rocks throughout their SiO2 evolution (total-alkali content versus silica diagram: TAS diagram). Bootstrapping of the total-alkali content reveals a positive correlation between [Na2O + K2O] and SiO2 in the more evolved composition of magmas (SiO2 > 50 wt%). (b,c) The black dots yield correlations between the gradual increase or decrease of alkali magmas occurrences in the continental record s.l. and the crustal thickness at the site of eruption. Bootstrapping of the total-alkali content reveals a negative correlation between [Na2O + K2O] and SiO2 in the less evolved (basaltic) composition of magmas (SiO2 45–52 wt%).

Figure 9.
(a–c) Correlation between the gradual occurrence or decrease (statistical assessment) of Si in mafic magmas (lava from the continental s.l. record) and the crustal thickness where magma have been emplaced. Whatever the range of composition considered for mafic magma (Si43–51; Si45–55), the slope of correlation appears broadly similar, except for the Mg06 mafic record that show a more scattering evolution. The number of samples considered is given by the colored histograms.


Figure 10.
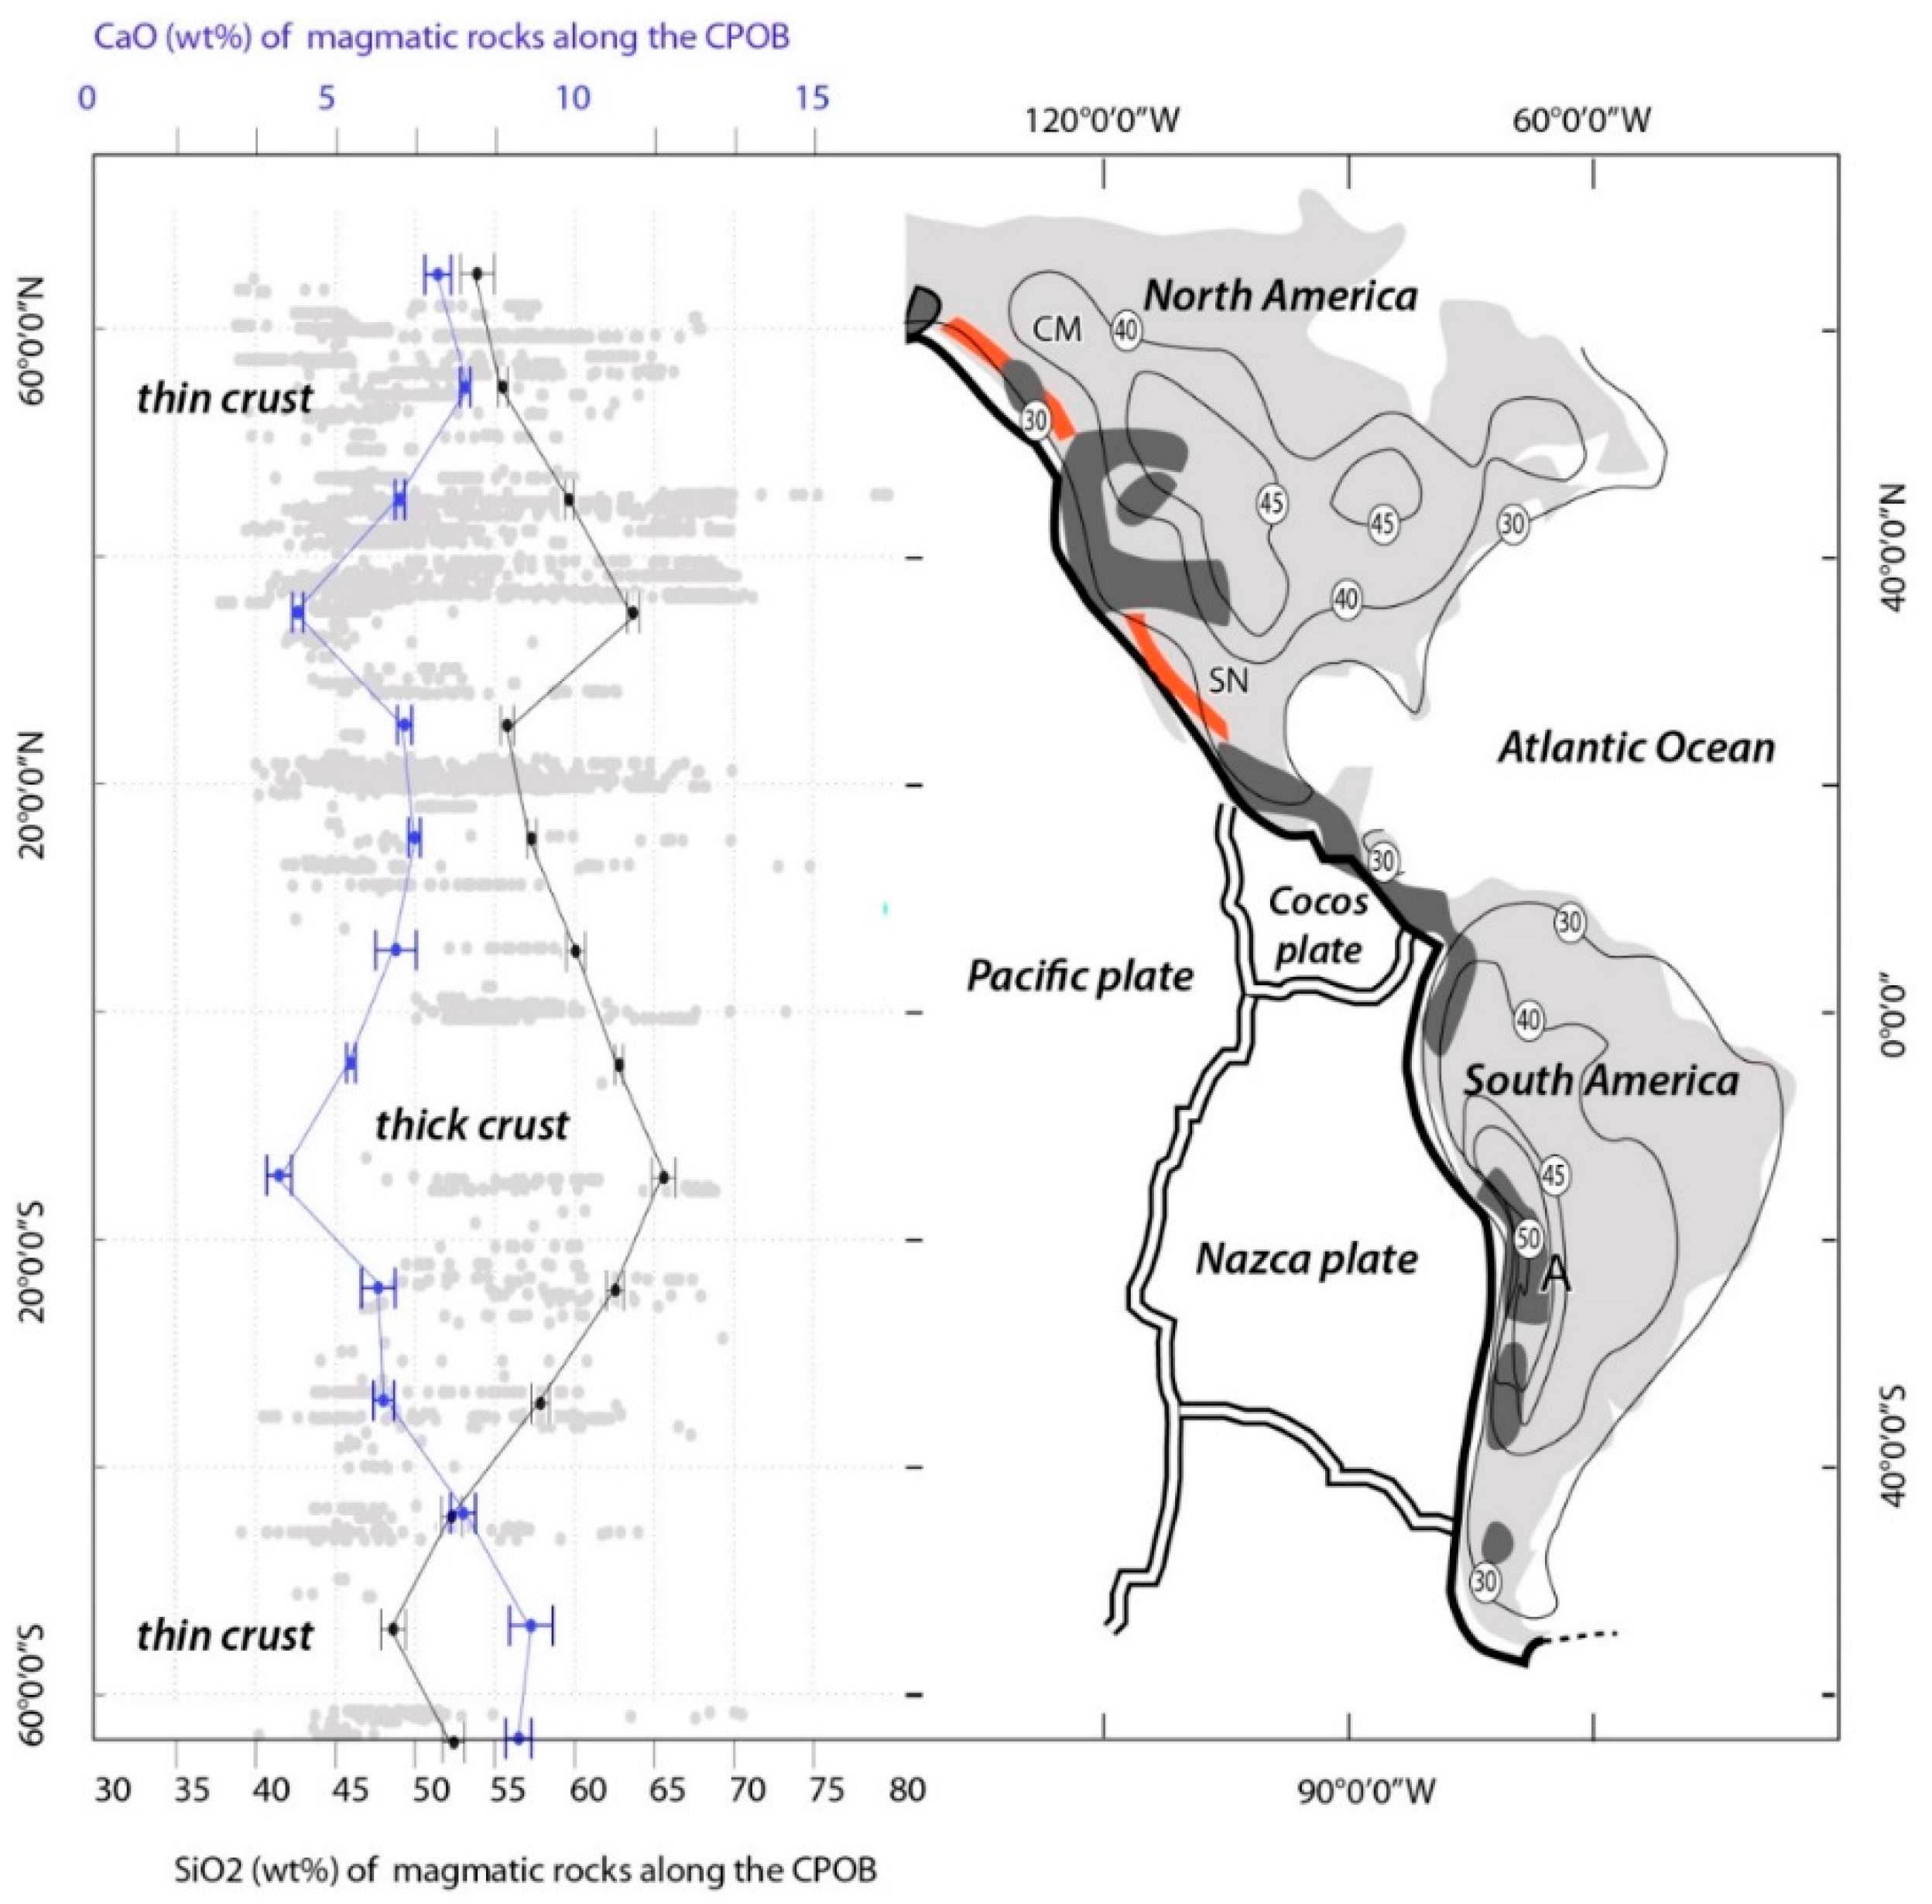
Chemical record (SiO2 and CaO wt %) of magmatic rocks plotted against the geographic position of Cenozoic-aged samples (ca. 10–0 Ma) along the eastern parts of the circum-pacific orogenic belts (>6850 analyses). Mafic rocks (SiO2-poor and CaO-rich) are less abundant in Peru-North Chile magmatic systems, which were developed on a thick continental crust (60 km in the Altiplano area: A) and more abundant along the Northern American Cordilleras (Coast Mountains: CM; Sierra Nevada: SN) and South Chile-Patagonia magmatic systems where the continental crust is thinnest (<30 km). Four isodepth contours (30, 40, 45 and 50 km) are shown on the map based on the global crustal model (2 × 2 degrees) CRUST 2.0 [9].
Figure 10.
Chemical record (SiO2 and CaO wt %) of magmatic rocks plotted against the geographic position of Cenozoic-aged samples (ca. 10–0 Ma) along the eastern parts of the circum-pacific orogenic belts (>6850 analyses). Mafic rocks (SiO2-poor and CaO-rich) are less abundant in Peru-North Chile magmatic systems, which were developed on a thick continental crust (60 km in the Altiplano area: A) and more abundant along the Northern American Cordilleras (Coast Mountains: CM; Sierra Nevada: SN) and South Chile-Patagonia magmatic systems where the continental crust is thinnest (<30 km). Four isodepth contours (30, 40, 45 and 50 km) are shown on the map based on the global crustal model (2 × 2 degrees) CRUST 2.0 [9].

Figure 11.
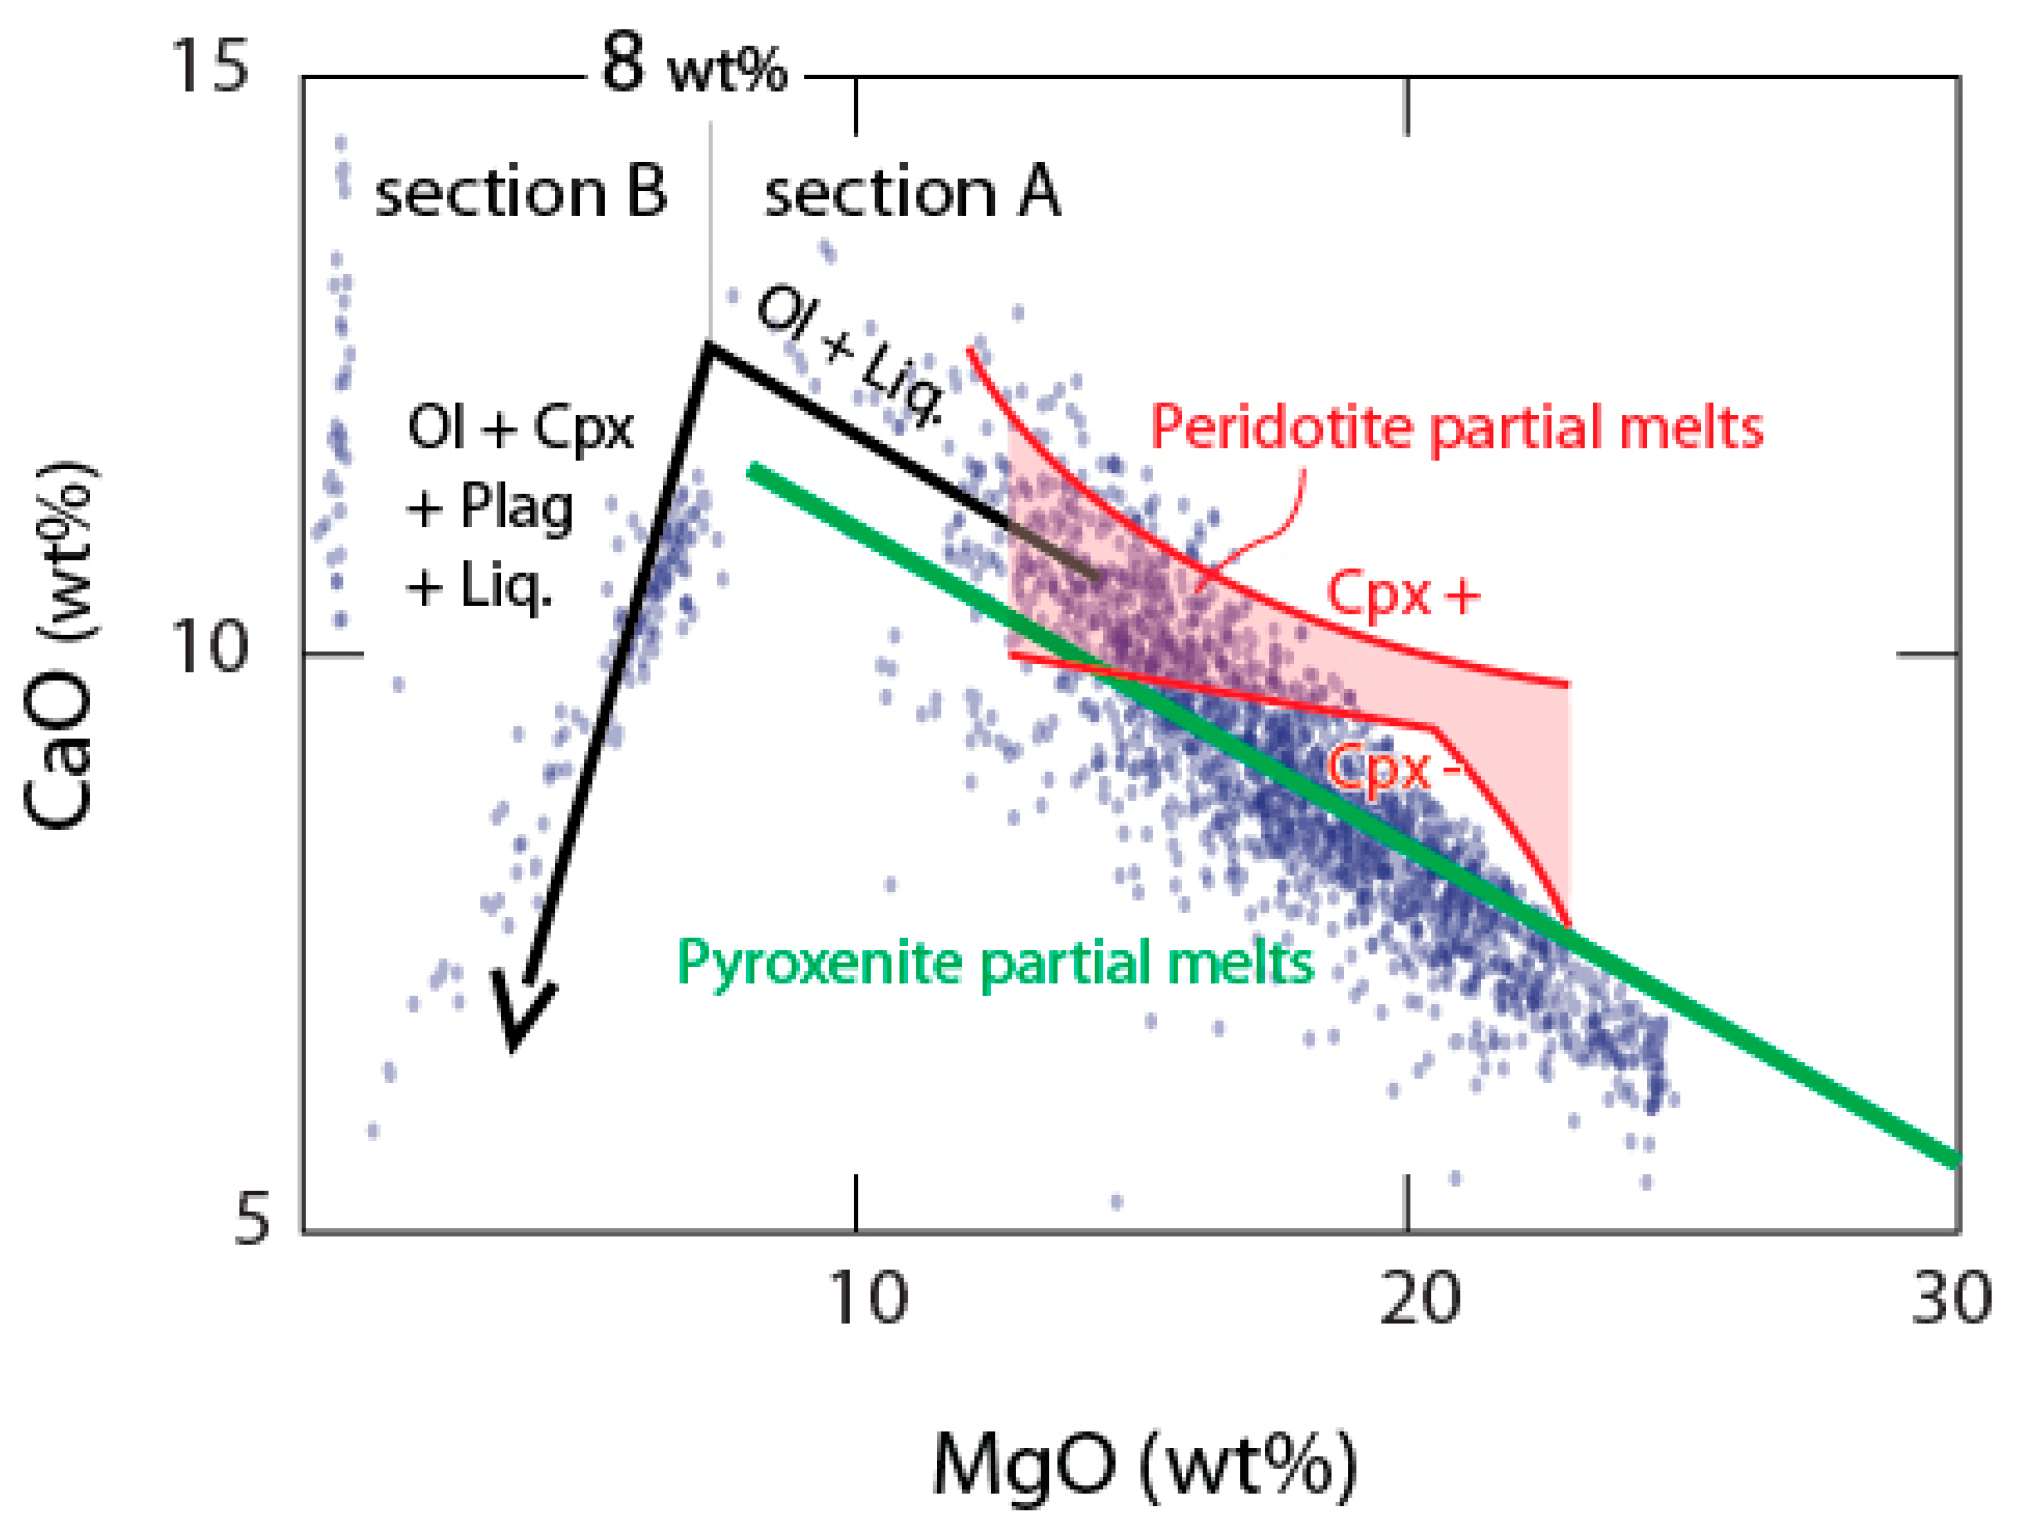
CaO and MgO contents of primary magmas (2260 samples) calculated with PRIMELT3 MEGA software [36] using MORB compositions (from [40]) and reduced condition in the source (Fe2+/∑Fe = 0.9). Successful and unsuccessful solutions of calculation have been reported on the graph. Red lines are described by Equations (9)–(11) in [37]. They define upper and lower CaO filters of primary magmas of fertile peridotite produced by accumulated fractional melting. Primary magma with CaO contents lower than those defined by the green line are potential pyroxenite partial melts; they can also be peridotite partial melts that had clinopyroxene (cpx) removed. Black broken arrow is the typical liquid line of descent for primary magmas that crystallize gabbro in the crust; the drop in CaO often occurs at MgO < 7–10%. However, cpx can also crystallize in the mantle and affect magmas with MgO > 10%.
Figure 11.
CaO and MgO contents of primary magmas (2260 samples) calculated with PRIMELT3 MEGA software [36] using MORB compositions (from [40]) and reduced condition in the source (Fe2+/∑Fe = 0.9). Successful and unsuccessful solutions of calculation have been reported on the graph. Red lines are described by Equations (9)–(11) in [37]. They define upper and lower CaO filters of primary magmas of fertile peridotite produced by accumulated fractional melting. Primary magma with CaO contents lower than those defined by the green line are potential pyroxenite partial melts; they can also be peridotite partial melts that had clinopyroxene (cpx) removed. Black broken arrow is the typical liquid line of descent for primary magmas that crystallize gabbro in the crust; the drop in CaO often occurs at MgO < 7–10%. However, cpx can also crystallize in the mantle and affect magmas with MgO > 10%.

Figure 12.
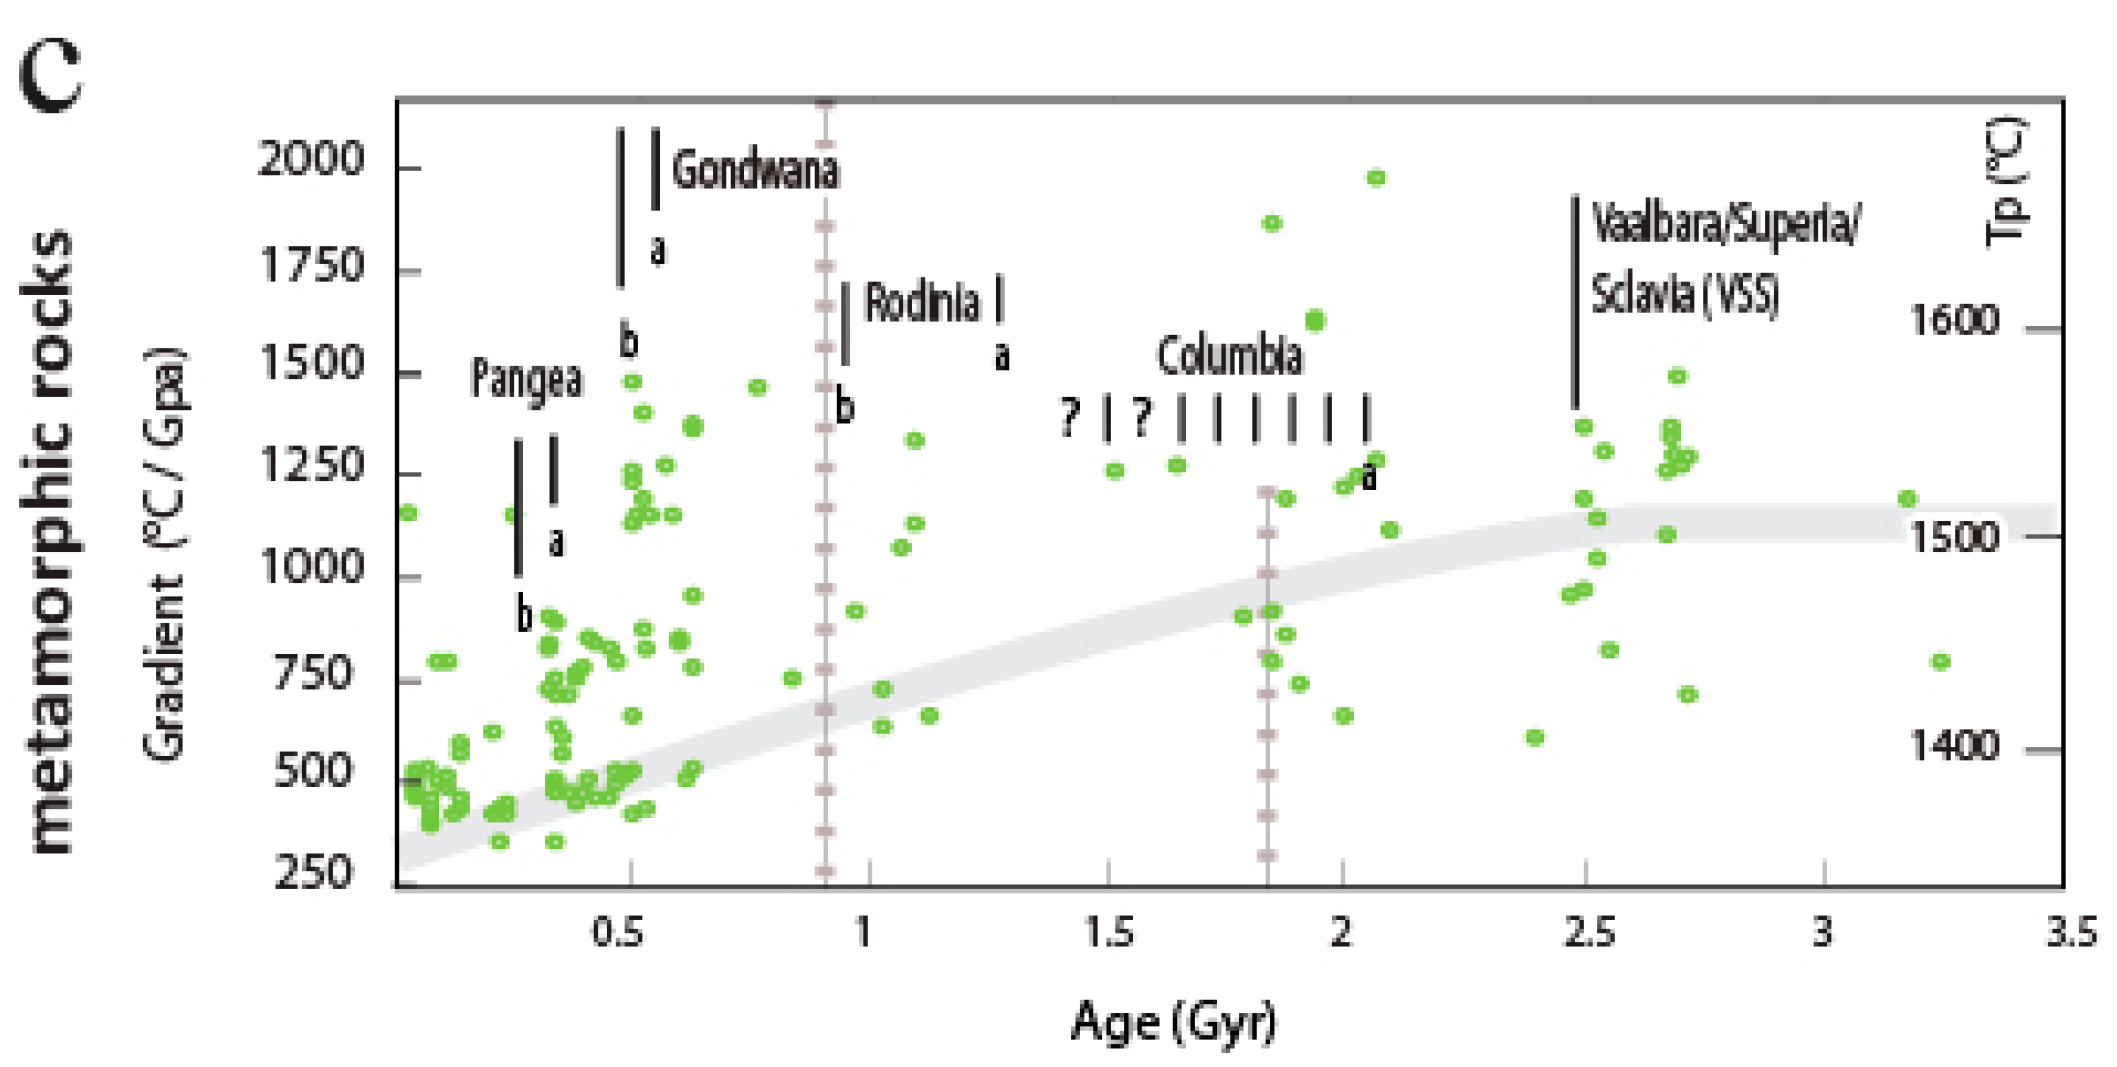
(a) Variation in the thickness of juvenile continental crust through time (light red dots), calculated from the relationships in Figure 7b (mafic magma proxy). A polynomial curve (N = 6) fitting the crustal thickness values (step of 100 Myrs) was reported on the graphs. R2 corresponds to the coefficient of determination associated with the polynomial curve. The thickest sections of crust are mostly observed in the Proterozoic times (>40–50 km). (b) Comparison with crustal thickness estimates using a different proxy (Rb/Sr, [18]). Data distribution of anorthosites forming after Fe-rich magma [41] is given by the histogram (light blue columns). (c) Thermal evolution curve (grey) for ambient mantle (Tp) [28]. Green circles superimposed on the graph correspond to the plot of thermal gradients versus age for the three main types of extreme metamorphic belts [42]. They define a trend towards colder gradients in the Phanerozoic. A similar fanning arrays of Phanerozoic magmatic amphiboles and pyroxenes, following the Rodinia supercontinent breaking up and encompassing the Pangea cycle (a: assembly; b: breakup), is observed in Figure 3.
Figure 12.
(a) Variation in the thickness of juvenile continental crust through time (light red dots), calculated from the relationships in Figure 7b (mafic magma proxy). A polynomial curve (N = 6) fitting the crustal thickness values (step of 100 Myrs) was reported on the graphs. R2 corresponds to the coefficient of determination associated with the polynomial curve. The thickest sections of crust are mostly observed in the Proterozoic times (>40–50 km). (b) Comparison with crustal thickness estimates using a different proxy (Rb/Sr, [18]). Data distribution of anorthosites forming after Fe-rich magma [41] is given by the histogram (light blue columns). (c) Thermal evolution curve (grey) for ambient mantle (Tp) [28]. Green circles superimposed on the graph correspond to the plot of thermal gradients versus age for the three main types of extreme metamorphic belts [42]. They define a trend towards colder gradients in the Phanerozoic. A similar fanning arrays of Phanerozoic magmatic amphiboles and pyroxenes, following the Rodinia supercontinent breaking up and encompassing the Pangea cycle (a: assembly; b: breakup), is observed in Figure 3.


© 2018 by the authors. Licensee MDPI, Basel, Switzerland. This article is an open access article distributed under the terms and conditions of the Creative Commons Attribution (CC BY) license (http://creativecommons.org/licenses/by/4.0/).
Share and Cite
MDPI and ACS Style
Ganne, J.; Feng, X.; McFarlane, H.; Macouin, M.; Rousse, S.; Naba, S.; Traoré, A.; Hodel, F. When Proterozoic Crusts Became Thick: New Insights from Magma Petrology. Geosciences 2018, 8, 428. https://doi.org/10.3390/geosciences8120428
AMA Style
Ganne J, Feng X, McFarlane H, Macouin M, Rousse S, Naba S, Traoré A, Hodel F. When Proterozoic Crusts Became Thick: New Insights from Magma Petrology. Geosciences. 2018; 8(12):428. https://doi.org/10.3390/geosciences8120428
Chicago/Turabian StyleGanne, Jérôme, Xiaojun Feng, Helen McFarlane, Mélina Macouin, Sonia Rousse, Seta Naba, Abraham Traoré, and Florent Hodel. 2018. "When Proterozoic Crusts Became Thick: New Insights from Magma Petrology" Geosciences 8, no. 12: 428. https://doi.org/10.3390/geosciences8120428
Note that from the first issue of 2016, this journal uses article numbers instead of page numbers. See further details here.