1. Introduction
The human presence along the coast is a well-known and increasingly extensively studied phenomenon [
1]. This situation has led to a continual increase in anthropogenic pressures on the coastal zone [
2], with the consequent deterioration of environmental conditions. As a result, coastal areas under these pressures are usually more vulnerable to naturally-occurring phenomena [
3,
4,
5]. To assess the condition of these areas and their vulnerability, the existence of detailed coastal information is needed. Unfortunately, coastal areas usually lack sufficient detailed information about the marine environment and the coast to support appropriate approaches.
A common issue along the shorelines is beach erosion or retreat, which is understood to be the capacity of a given coastal area to lose more sediment than it gains, which is closely linked to the concept of coastal sediment balance [
6,
7]. Particularly, beach erosion is the loss of sediment budgets, owing either to lower sediment inputs, higher outputs, or changes in their transit (longitudinal or transversal) [
8]. Those sediments can be transported and redistributed alongshore by coastal currents or transported offshore by transversal currents [
9]. The reduction in sediment volume is a three-dimensional process that can lead to shoreline recession [
10].
The most effective calculation for sediment loss on a beach is one that permits three-dimensional (3D) analysis [
11,
12]. However, due to the lack of resources allowing 3D measurement (volume), two-dimensional (surface area), and linear-distance calculations (length) have been historically the most used. In the literature, different techniques and data have been used to estimate coastal sediment loss such as historical maps [
13,
14,
15,
16], topographical surveys [
17,
18,
19] and remote sensing [
20,
21,
22,
23]. However, although these studies enable retrospective analysis, they lack the spatial continuity and accuracy that certain coastal studies may require.
Photogrammetric flights have traditionally provided data that combine the requirements for reliable and retrospective studies [
8]. These flights provide an extensive source of information that has been widely used for environmental mapping and geospatial analysis. However, the characteristics and surface area of the study site may make polynomial corrections with control points unfeasible because they are local transformations for each photogram [
24,
25,
26,
27]. Furthermore, there are also geometric problems stemming from the conical perspective of aerial photographs. Considering the importance of geometric precision in shoreline digitization, the method most used is orthophotography. This product combines the visual quality of aerial photography with the geometric precision of projection onto a flat surface, considerably reducing possible errors caused by the displacement of stereoscopic images [
28,
29].
The aim of this paper was to develop a methodology for improving the analysis, interpretation, and geo-visualisation of shoreline erosion rates with application to the Andalusian coast in Southern Spain. To that end, an approach for the production, management, and dissemination of beach erosion data for the Andalusian coast was developed. This approach was based on three steps: (1) the design of a data model that allows the integration of geometric (shoreline digitization for rates calculation) and thematic information (geomorphologic and anthropogenic data) for subsequent interpretation and analysis; (2) the integration of all the information into a PostgreSQL-PostGIS relational spatial database (EnterpriseDB, Bedford, MA, USA); and (3) the generation of an Open Geospatial Consortium (OGC) interoperable services and a web-based viewer.
This paper contributes to the scientific literature in several ways. Firstly, the photo-interpretation and digitization of the proxies was performed by one single photo-interpreter for all the beaches on the Andalusian coast (almost 620 km) at a very detailed scale of 1:2500. This avoids the use of different results for the analysis and the subjective criteria of other authors and research works. Secondly, in comparison with other published works based exclusively on shoreline changes, this methodology improves the analysis and interpretation of the erosion rates in coastal areas by linking erosion rates with geomorphological and thematic information. The integration of all this information provides context for interpreting the estimated erosion rates, and for undertaking more complex spatial analysis, such as investigating the behaviour of beaches linked to foredunes [
30], or to assess the effect of coastal infrastructures on erosion rates. Thirdly, previous erosion rate estimations in Andalusia analysed specific sectors of this coast [
10,
31,
32]. The investigation undertaken here estimates detailed erosion rates for the entire Andalusian coast (every 50 m) for different time periods ranging from 1956 to 2011. This information enables, for the first time, comparisons between different sectors in the Andalusian coast including the Atlantic and Mediterranean facade. Lastly, this methodology is proven to be a valid and appropriate tool for the design of a web-based viewer, this being the best platform to represent the erosion rates obtained every 50 m of shore for a vast area such as the entire Andalusian coast, given the considerably amount of shoreline involved at ca. 917 km. This is particularly useful for integrated coastal zone management schemes, enabling quick and easy access to this valuable information. To this end, a web-based viewer was designed and developed to provide open access to all information and results. This valuable information is useful for managers, researchers, and the general public.
2. Study Area
Obtaining detailed information about coastal areas is fundamental for Spain, where beaches comprise the main resource of the current tourism system, generating 11% of the nation’s gross domestic product (GDP), despite representing only 0.001% of the national territory [
33]. This is particularly important in Andalusia, as the impact of tourism on the regional economy is greater than in other regions, accounting for 13% of the regional GDP [
34]. Thus, adverse natural events affecting beaches and/or tourist facilities, apart from its environmental impact, may negatively impact the regional economy. The Andalusian coast is an explicit example of such pressure stemming from the development of tourism [
35], whereby uncontrolled urban growth throughout the second half of the 20th century caused major problems for territorial planning and coastal occupation.
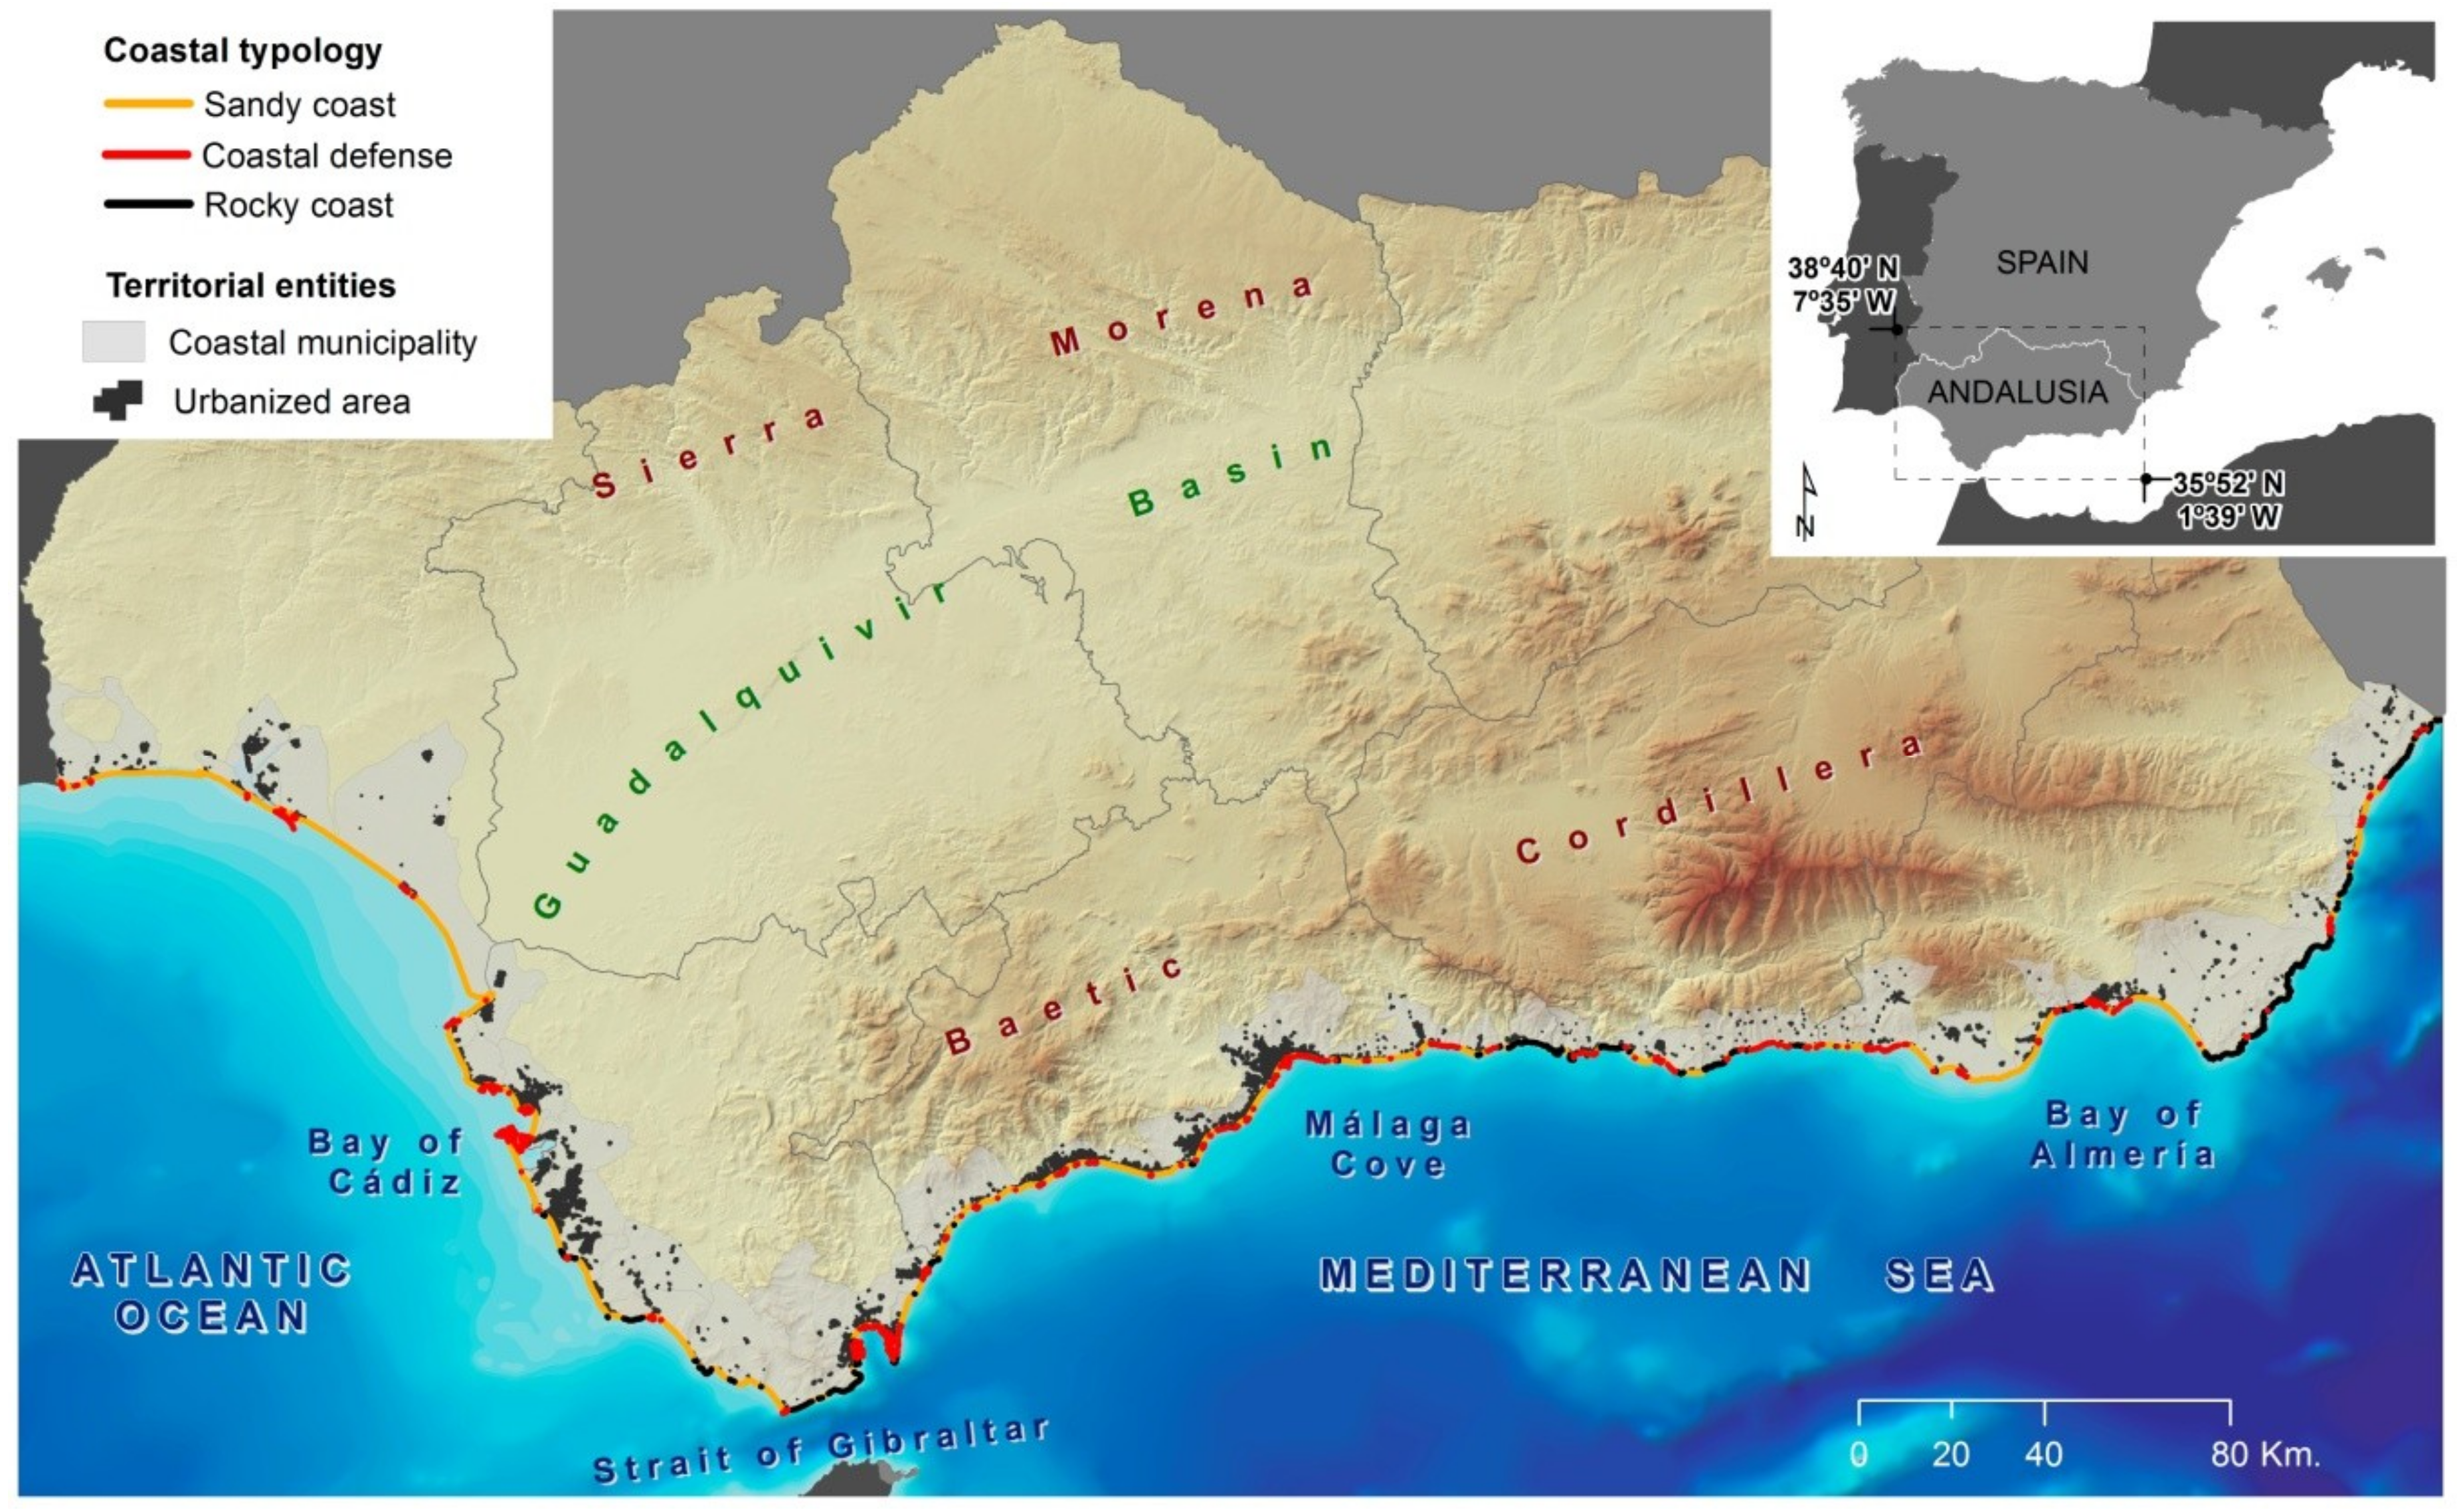
Andalusia has an exposed coastal front (ECF) of 917 km, which is divided into two clearly distinct regions (
Figure 1). The Atlantic coast, approximately 300 km long, is characterised by a mesotidal coast with long-fetch waves. The depression (Guadalquivir Basin) generated in the NE-SW direction between the hercynian reliefs of the north (Sierra Morena) and the alpine reliefs of the south (Baetic Cordillera) generated a smooth morphology with a gently sloping relief and a wide coastal platform, where accumulation processes of both fluvial and marine origin prevail. The result is a coastal fringe with a predominance of coastal spits, barrier islands, estuaries, and marshes. The Mediterranean coast (just over 600 km long) is characterised by a microtidal coast with short-fetch waves. The closeness of the Baetic Cordillera has generated an abrupt and steeply sloped relief with a narrow coastal platform. The result is a coastal fringe with a predominance of cliff sectors and pocket beaches, as well as deltas and lagoons generated by torrential fluvial contributions. The study area for this work focuses on all beaches in the Andalusian coast (Southern Spain), accounting for nearly 70% of the ECF (~620 km long).
3. Materials and Methods
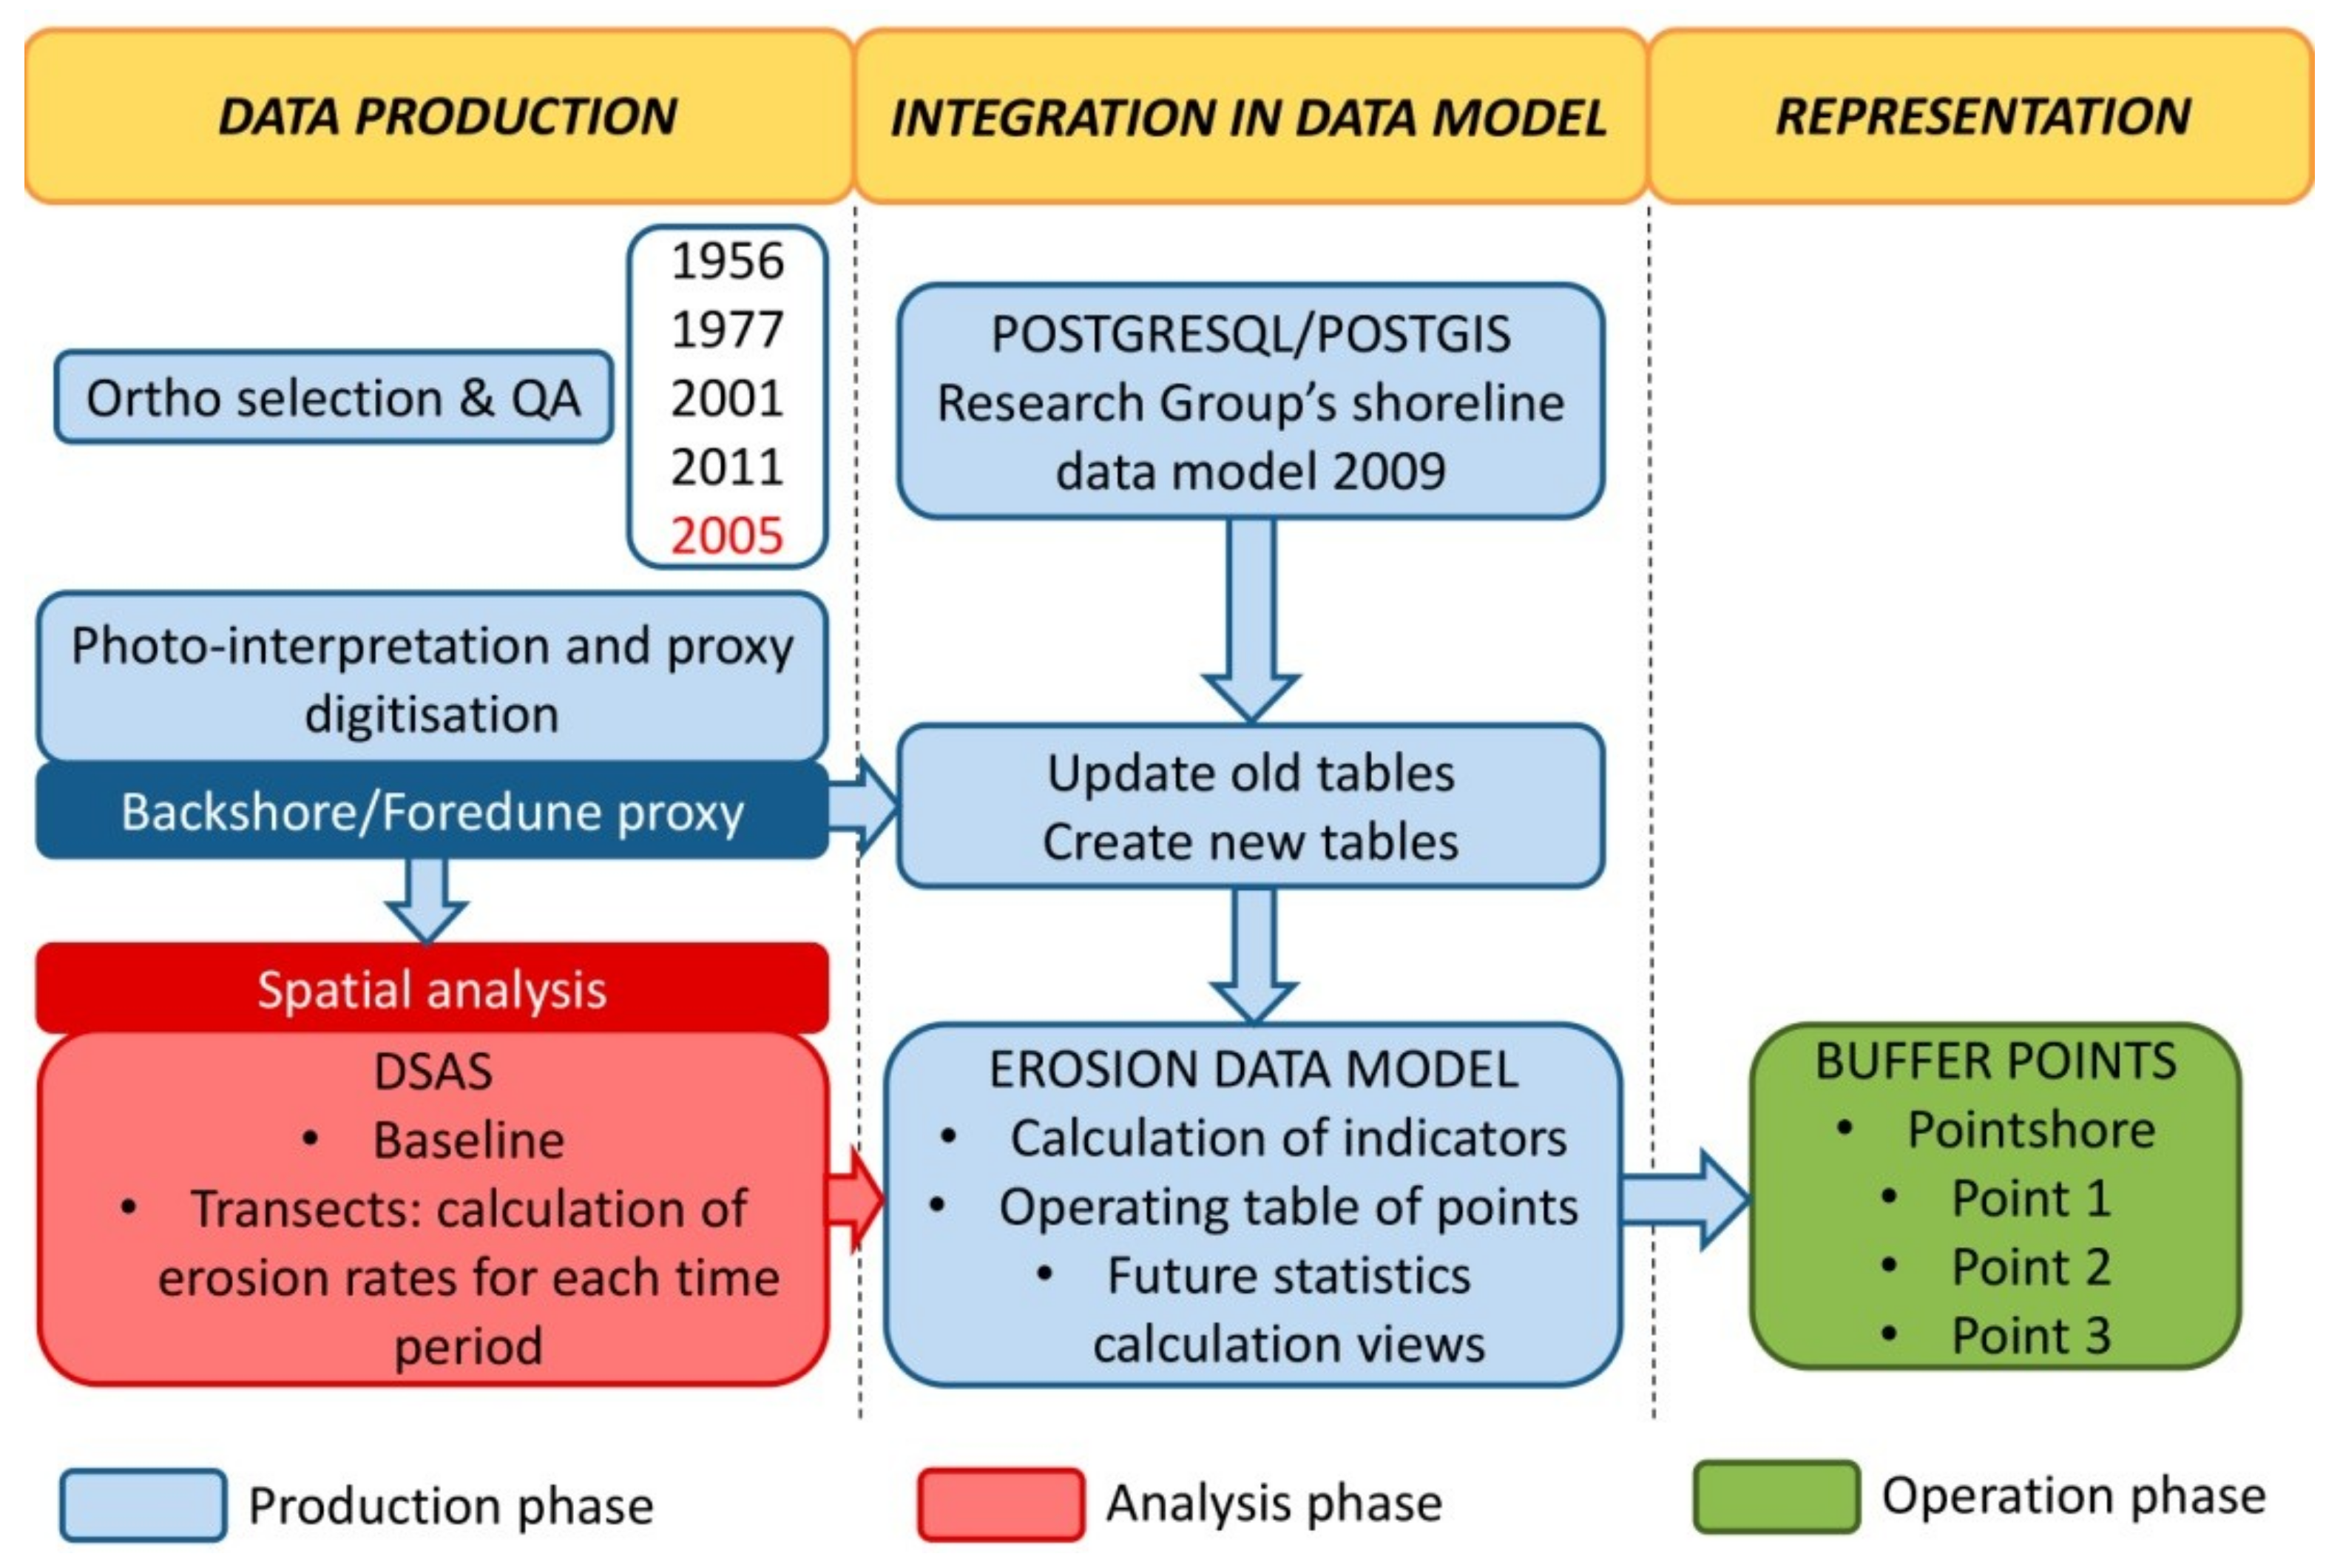
The methodology was based on three distinct phases (
Figure 2): (1) Production phase, in which the data sources (orthophotos) and the analysis periods were chosen, the data model designed and implemented, and the photo-interpretation and digitization of shorelines undertaken; (2) analysis phase, in which the erosion rates for the chosen periods associated with them were calculated; and (3) operation phase, in which all information derived from the analysis phase was linked to transects perpendicular to the shoreline. Later, the results are represented using points. Each of the phases are described in depth in the following sections.
3.1. Production Phase
3.1.1. Data Source
Four orthophotos were used: two historical ones, corresponding to flights from the years 1956–1957 and 1977–1983, and two recent ones, corresponding to flights from the years 2001–2003 and 2010–2011 (
Table 1). For cliff sectors without associated beaches, digitized to assign geometric continuity to the shorelines, Quickbird-Ikonos satellite ortho-imaging was additionally used, because the orbital height eliminates distortion errors inherent to photogrammetric flights at lower levels.
The selection of study dates was performed in accordance with the availability of official data sources within the studied time period (1956–2011) and a series of strategic sub-periods, with the aim being to detect trend changes in coastal evolution. Those sub-periods corresponded to the intervals 1956–1977, 1977–2001, 1977–2011, and 2001-2011, which enabled the identification of the main urban occupation processes and the application of sector-related coastal legislation, and their direct relationship with the respective shoreline change. Owing to the flight dates, the time interval of 1977–2011 was chosen as the reference period, since it is the broadest time interval whose data sources guarantee reliable spatial resolution.
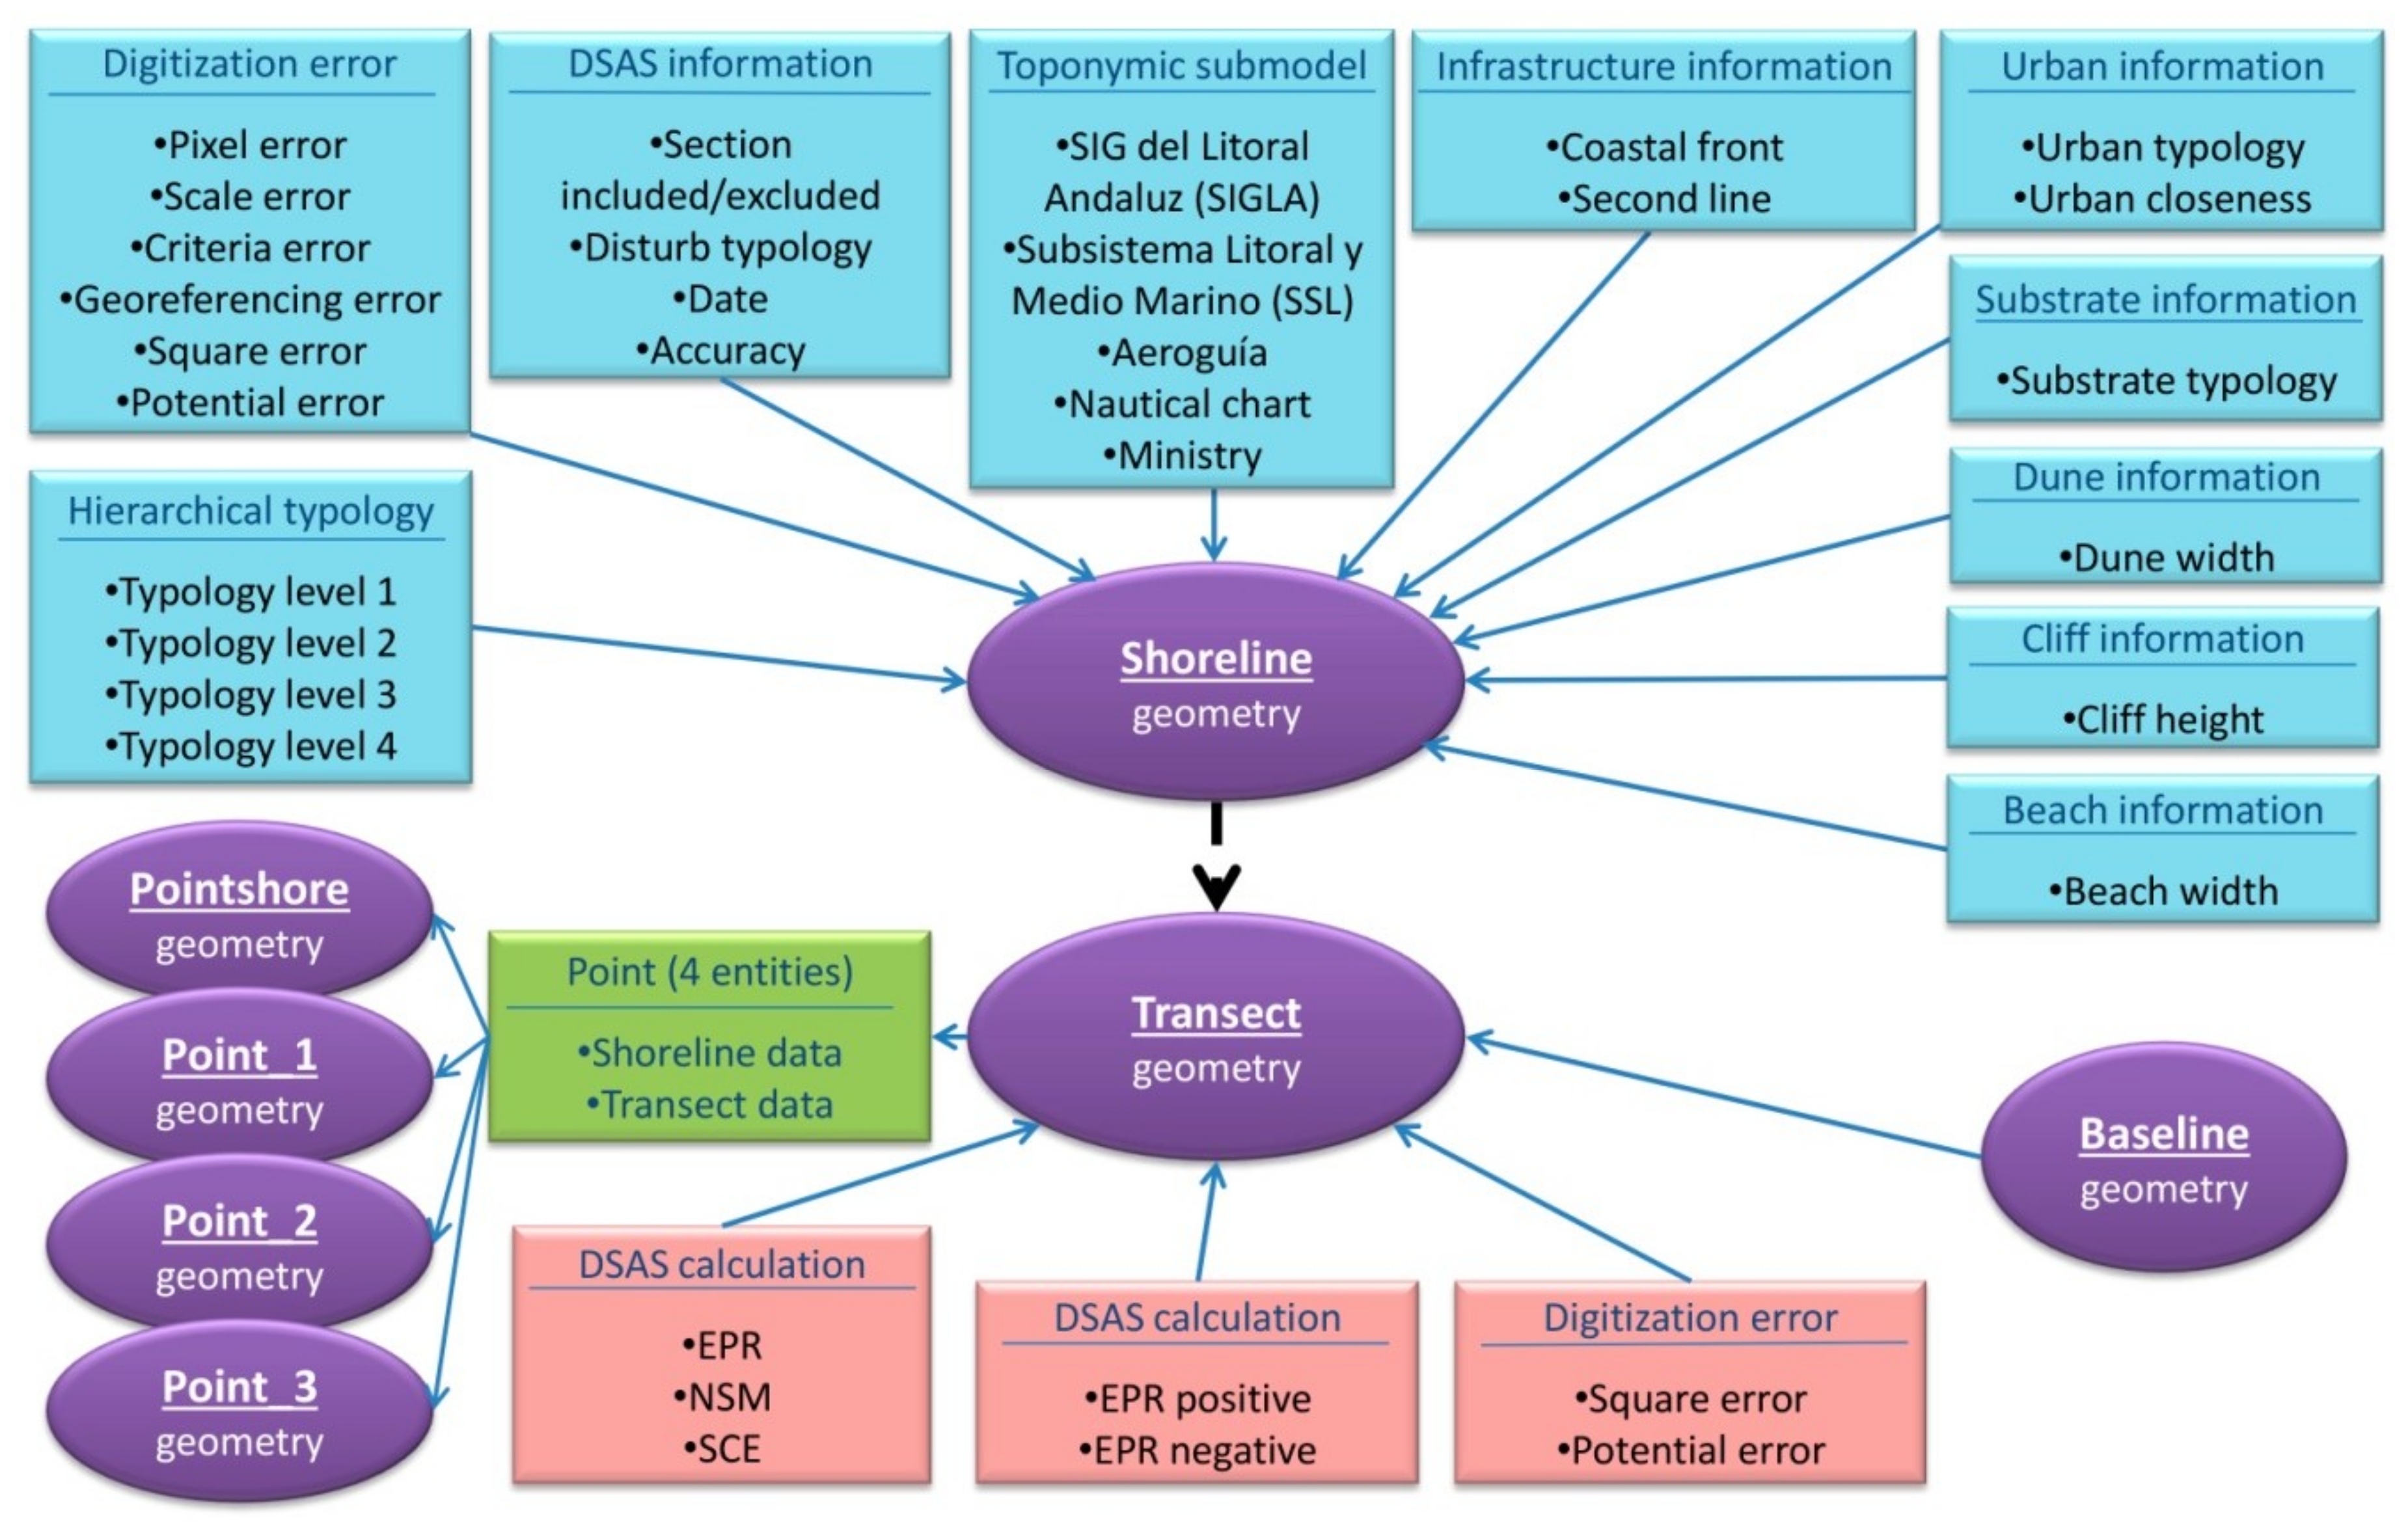
3.1.2. Design and Implementation of the Erosion Data Model
The erosion rate data were placed in a PostgreSQL/PostGIS database management system designed for erosion data exploitation. The data model was based on two geometric entities as shown in
Figure 3: shoreline and transects.
The shoreline table is composed of several shorelines; for each analysed year one shoreline was digitized. Each shoreline is composed of topologically independent segments, which are associated with thematic and geomorphological information generated during the digitizing process. All the data necessary for estimating erosion rates (such as date, accuracy, sections included/excluded, and type of disturb) were linked to each shoreline segment. Examples of the thematic and geomorphological information gathered during that process are: a hierarchical typological characterisation of each shoreline segment [
36], describing the existing geomorphology; and information related to the presence of dunes, cliffs, infrastructures, and urban areas. In addition, information of a different nature was also added. For example, each shoreline segment was linked to the toponymy and the error assessment generated during the digitization process.
The transect table also incorporates all transects generated by the Digital Shoreline Analysis System (DSAS) tool (US Geological Survey, Reston, VA, USA) [
37], which is explained in detail in the following sections. Each transect was assigned a unique correlative number, enabling relating the estimated erosion rates for each period to each one. Here, the potential and square errors calculated for each period were also added. Furthermore, to optimise the cartographic representation, the calculated rates were divided into different fields according to their sign (positive or negative). All information was transferred to four point entities parallel to the shoreline for the respective mapping. Finally, the data obtained from the process of data collection and rate calculation were integrated in the data intersecting the generated transects and shorelines (
Figure 3).
Once all the geometric and alphanumeric information was integrated into the data model and included in an open-code PostgreSQL/PostGIS database management system, it became possible to structure all shore-related information concerning the Andalusian coast and update it. Also, new information can easily be included and future erosion rates can be calculated and integrated.
3.1.3. Photo-Interpretation and Shoreline Digitization
Digitization was carried out in a database environment using proprietary ArcGIS 10.3 software (ESRI, Redlands, CA, USA) at a detailed scale of 1:2500 for the entire study area. The coordinates reference system used is the European Terrestrial Reference System 1989 (ETRS89), projected in Universal Transverse Mercator (UTM) for the 30° N zone, in accordance with current legislation [
38].
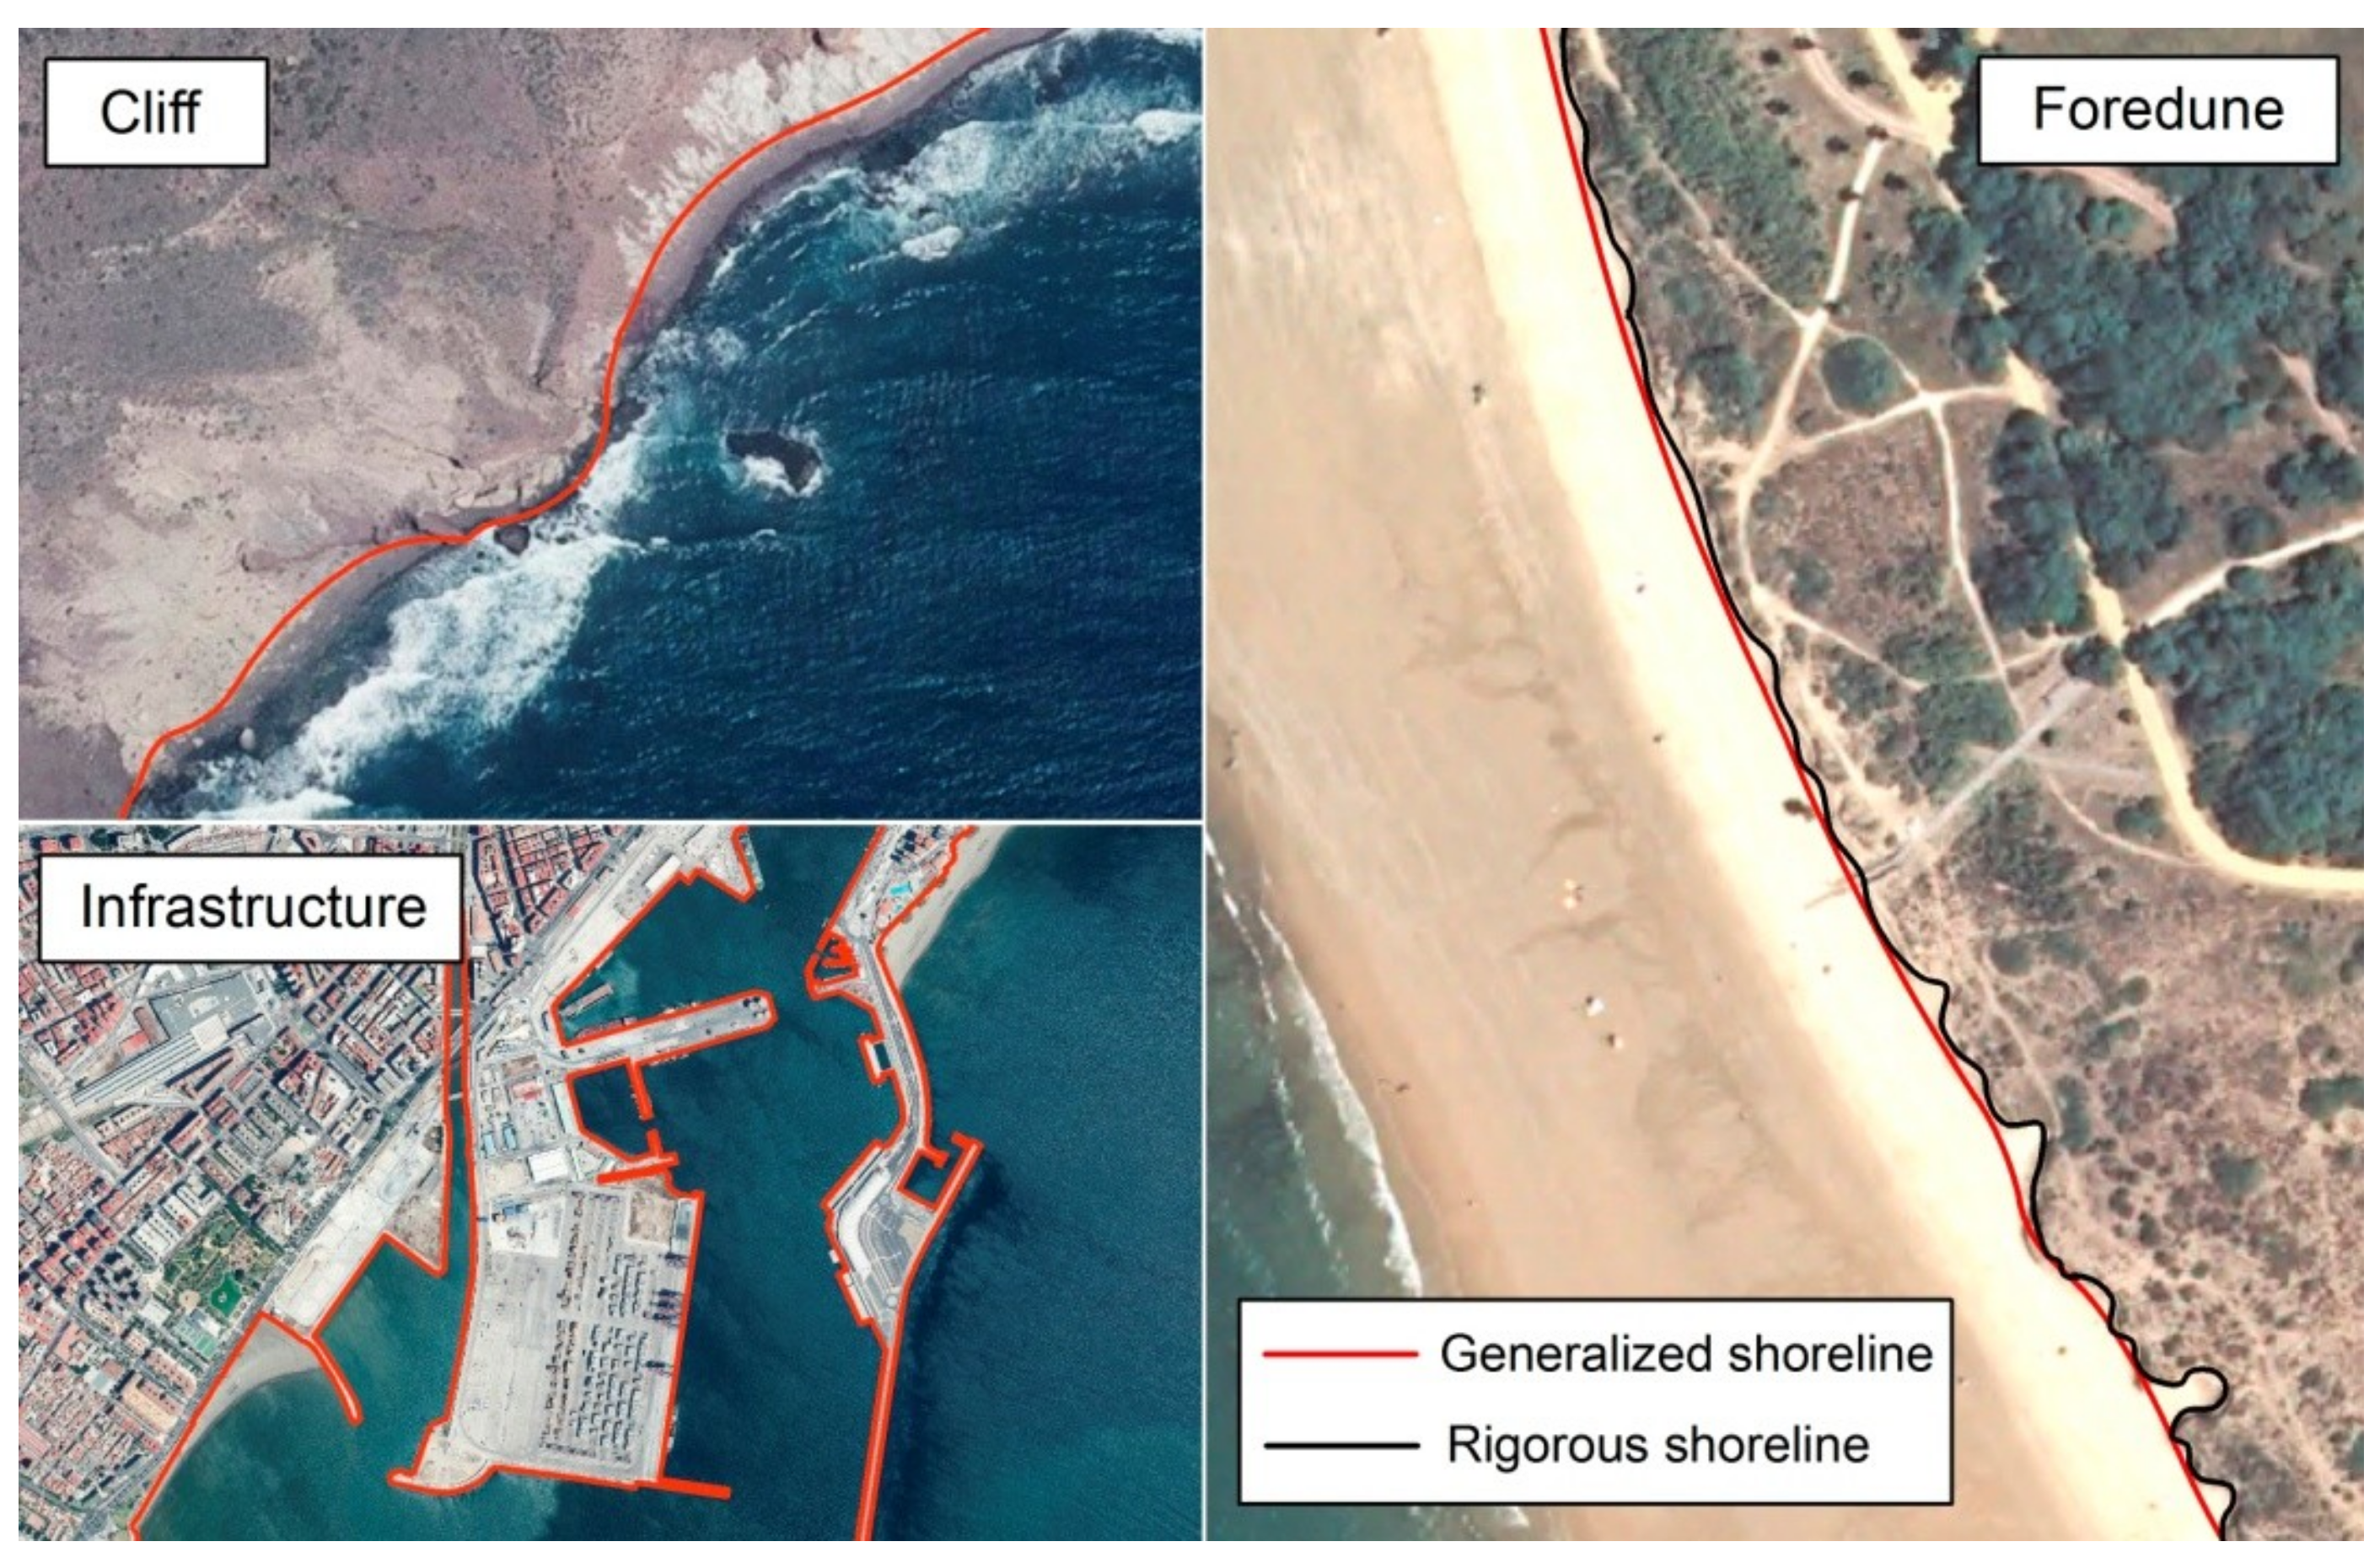
The availability of exclusively two-dimensional data sources (orthophotos) means that feature-based proxies (as they are usually referred to in the scientific literature) must be used, given the impossibility of using altimetry (datum-based proxy). In this case, and given the large variety of existing proxies (e.g., cliff base, foredune, infrastructure, run-up limit, instantaneous waterline, and mean high water—MHW), data were gathered by means of direct digitization of one of the shoreline proxies most used in the existing bibliography [
10,
39]: backshore/foredune contact. This indicator marks the zone of contact between the upper part of the beach and the foredune, cliff base, or limit with any existing infrastructure, which implies the maximum theoretical run-up during high-energy wave events. The large recurrence period for such events makes this indicator one of the most stable for long- and medium-term studies because the shoreline oscillation corresponds to a gradual and linear retreat. A generalised digitization technique was therefore used, excluding abrupt entries linked to anthropogenic processes or extreme wave conditions that detract from the reliability of the long-term results and their possible future projection (
Figure 4). The second most-used proxy is the high water level (HWL), which is found in the active zone of the emergent beach. This proxy is only recommended for use in short-term studies, and thus is not suitable for the aim of this paper.
3.2. Analysis Phase
3.2.1. Calculation of Erosion Rates for the Different Study Periods
Erosion rates were calculated by using proprietary ArcGIS 10.3 software as well as the DSAS tool. For that purpose, the tool requires generation of an onshore baseline parallel to the shoreline, which serves as the starting point for all transects that perpendicularly intersect the shorelines, using an equidistant spatial sampling of 50 m. The result was the creation of 15,069 transects for the entire study area, of which 30% were manually modified to ensure that they were orthogonal with respect to the shoreline.
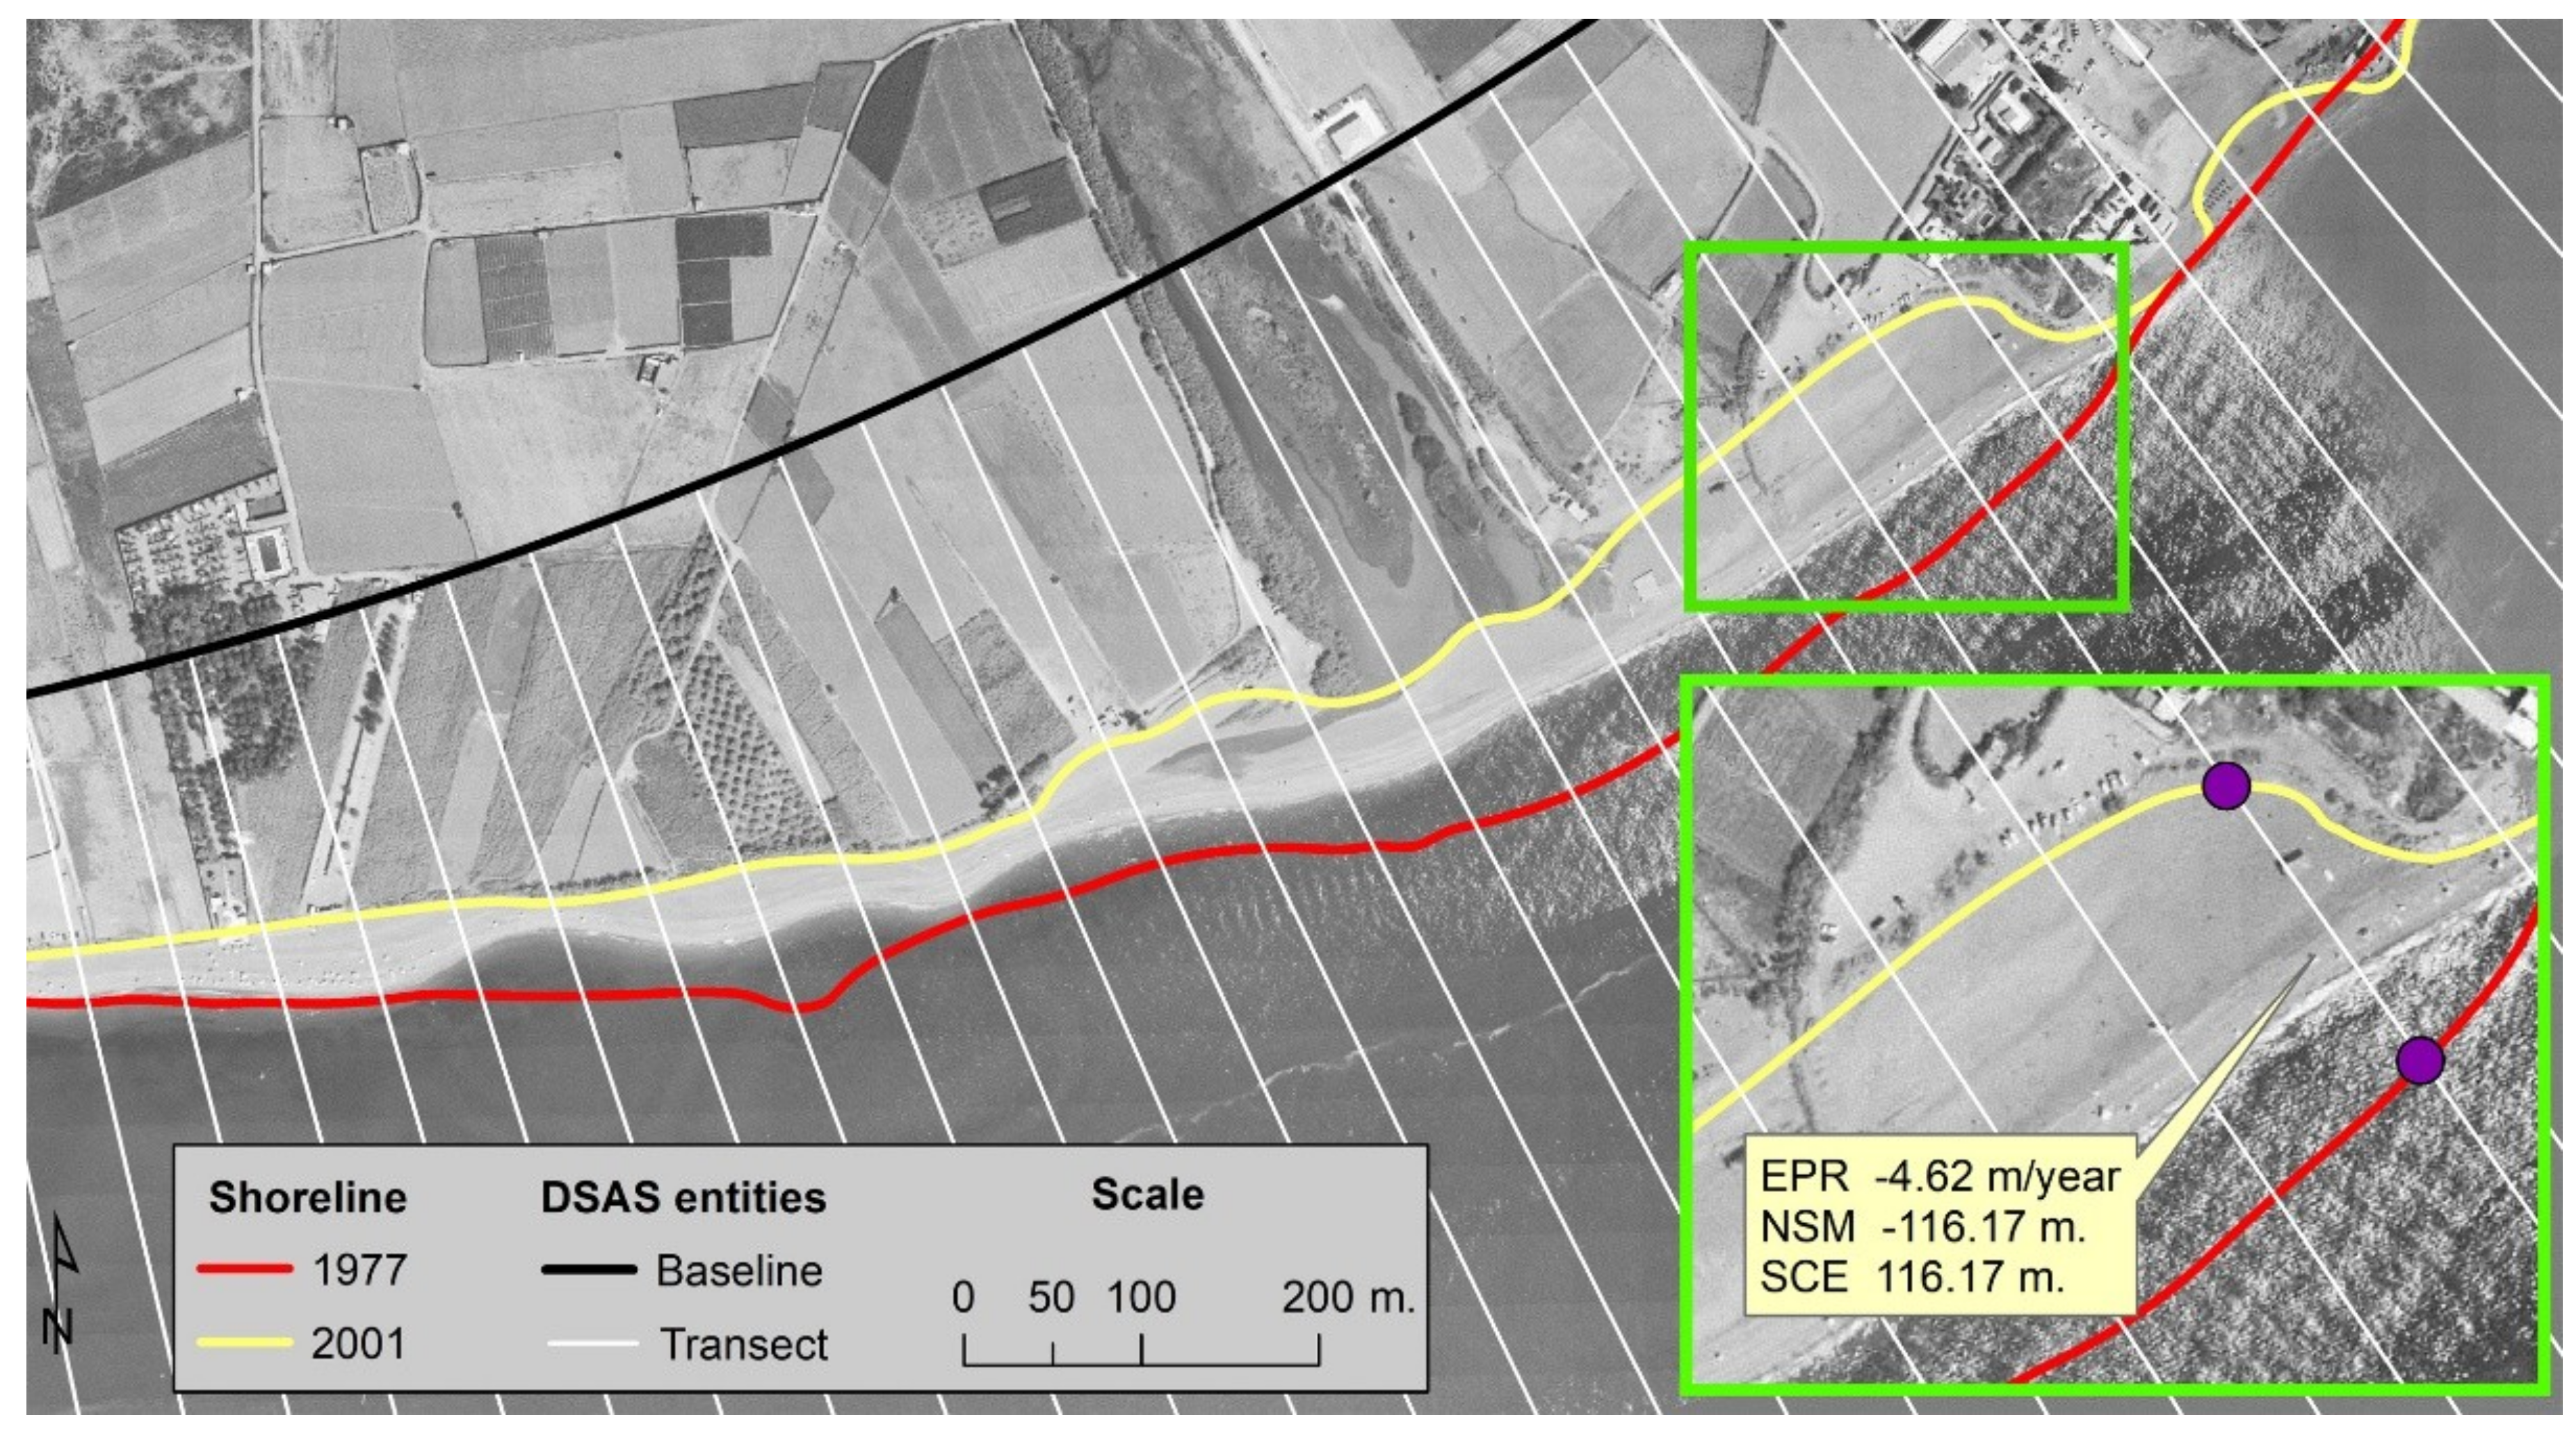
The calculation process was based on exhaustive measurement of the distance between the oldest and the most recent shoreline (net shoreline movement, NSM), expressed in real values, and closest and farthest from the baseline (shoreline change envelope, SCE), expressed in absolute values. End point rate (EPR) stands out among the possible calculation methods, as it is the most used in the current literature. It develops a rate corresponding to the shoreline’s linear position change between two or more study dates, expressed in metres/year (
Figure 5). In order to proportionally represent the rates obtained, the results from each study period were divided into different fields according to their sign, assigned positive values and assigning to the negative values their absolute value.
3.2.2. Error Assessment
In the process of photo-interpretation and digitization, there are several variables to consider when estimating an error uncertainty threshold (
Table 2):
- (1)
Spatial resolution of the source: the size of the minimum information unit (pixel) determines the scale of the image and hence its resolution [
40].
- (2)
Scale: the work’s scale is closely associated with the resolution of the screen used (1680 × 1050). In this case, a 1:2500 scale was chosen after various trials by the photo-interpreter to digitize the same point element clearly visible in an orthophoto. A mean continual error of 1.5 m was obtained.
- (3)
Photo-interpretation criterion: to quantify this variable, the mean distance between different sample shorelines, gathered by different expert photo-interpreters, was measured. The mean error of the different shoreline samples (different per the characteristics of the data sources) was 1.25 m for sources with sub-metric resolutions and 3 m for metric sources.
- (4)
Geo-referencing: this was only used in those cases where the geometric errors of the data sources required manual correction. In this case, the presence of occasional geometric errors in the historical orthophoto from 1956–1957 meant that manual geo-referencing via control points of 17 photograms had to be used for the entire study area.
The error calculation for each study date (expressed in metres) was calculated. It usually resulted from the root of the quadratic sum of the quantified variables [
10,
41], obtained by means of the following formula:
To ascertain the maximum possible error, the maximum potential error for each date (likewise expressed in metres) was calculated using the following formula:
The potential and square errors of the constant variables for each time period calculated for this research work are detailed in
Table 2, without adding the variable derivate from the manual geo-referencing. As it was only rarely applied to specific sections, it was not representative for the whole group).
3.3. Operational Phase
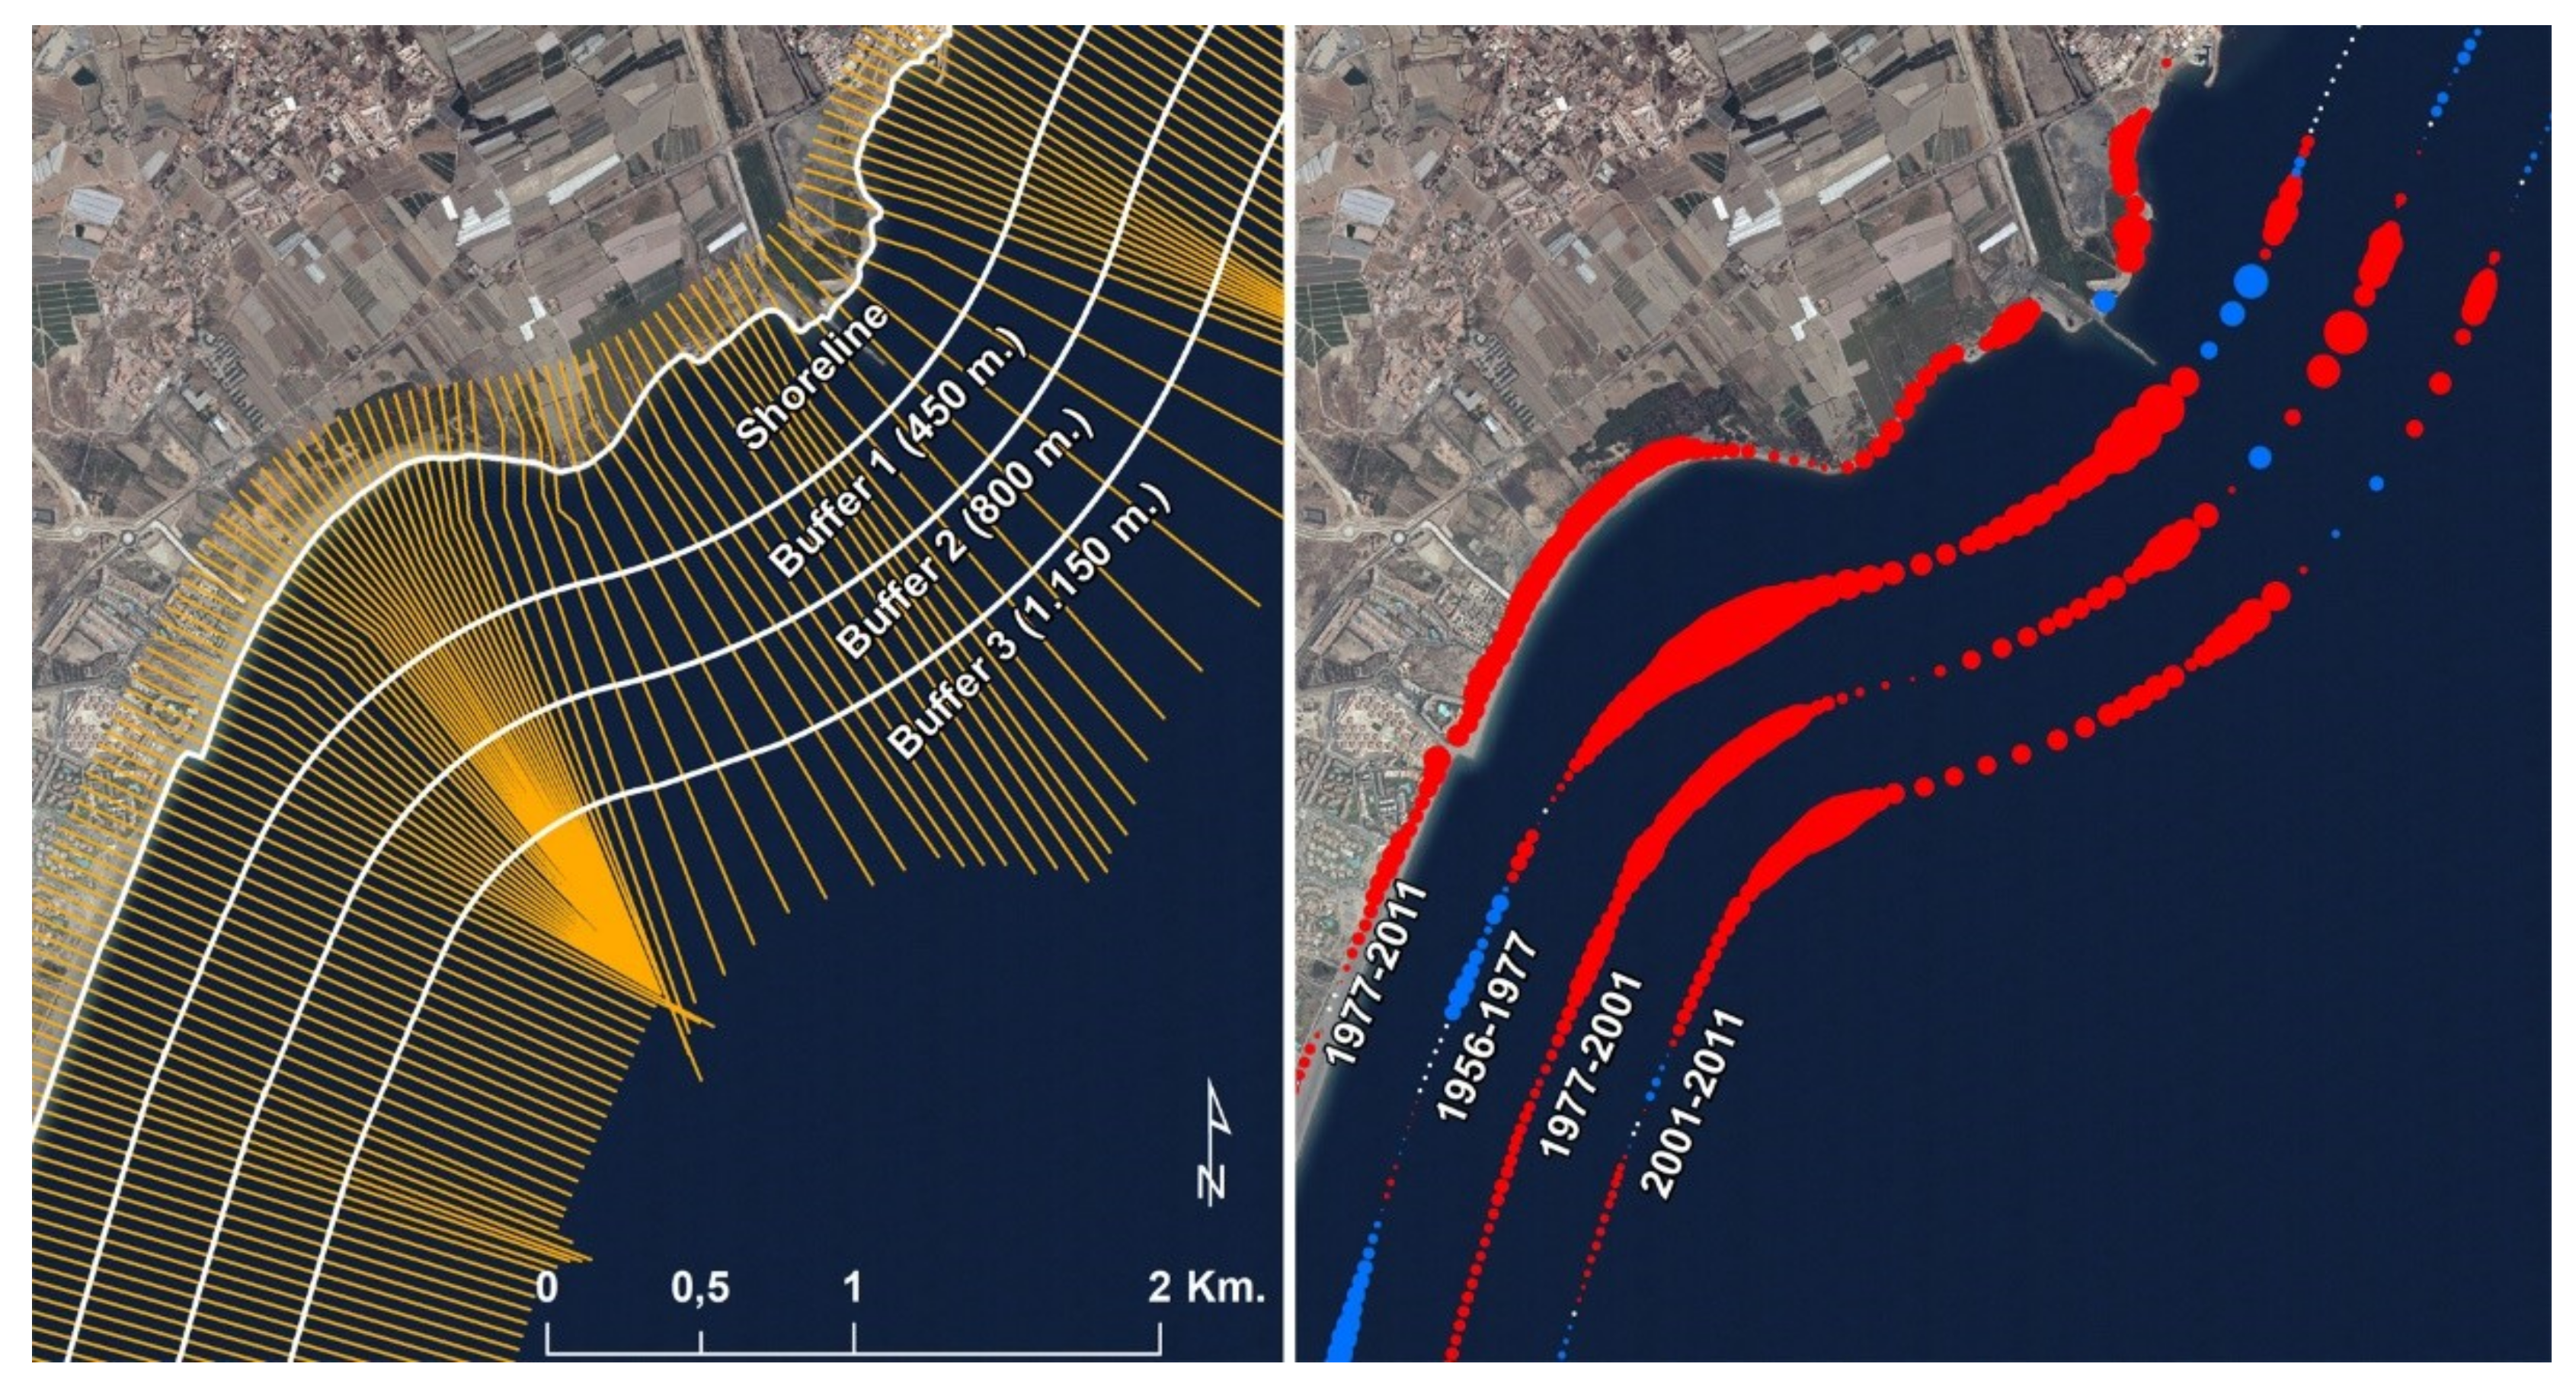
In this phase, all information related to erosion rates and shorelines was linked to the geometric component of the transects by means of a spatial join, generating a vector entity integrated into the data model for every 50 m of shore. In order to enable result comparisons for different periods, four offshore point entities were generated using a process of spatial intersection with transects. The first point entity was located at the coastline, and the rest using buffers at 450,800, and 1150 m from the coastline (
Figure 6). Given the nature of the data obtained, the data were represented using proportional symbols, assigning easy-to-interpret color tones. The color blue, for example, was thus assigned to sediment accumulation processes, red to erosion processes, and white to zones of sediment stability.
4. Results
The main result obtained for this work was the ascertainment of erosion rates for the entire Andalusian coast for the reference period 1977–2011 as well as for the other study periods (1956–1977, 1977–2001, and 2001–2011), and the linked thematic and geomorphological information. The erosion data model designed to fit this particular need provides a useful tool for improving the erosion rates analysis and interpretation. In what follows, we show different results, starting with the description of the erosion rates and its representation, followed by the erosion web-viewer, and an example of how the linked thematic data helps provide context for the interpretation of the erosion rates.
4.1. Representation of Erosion Rates
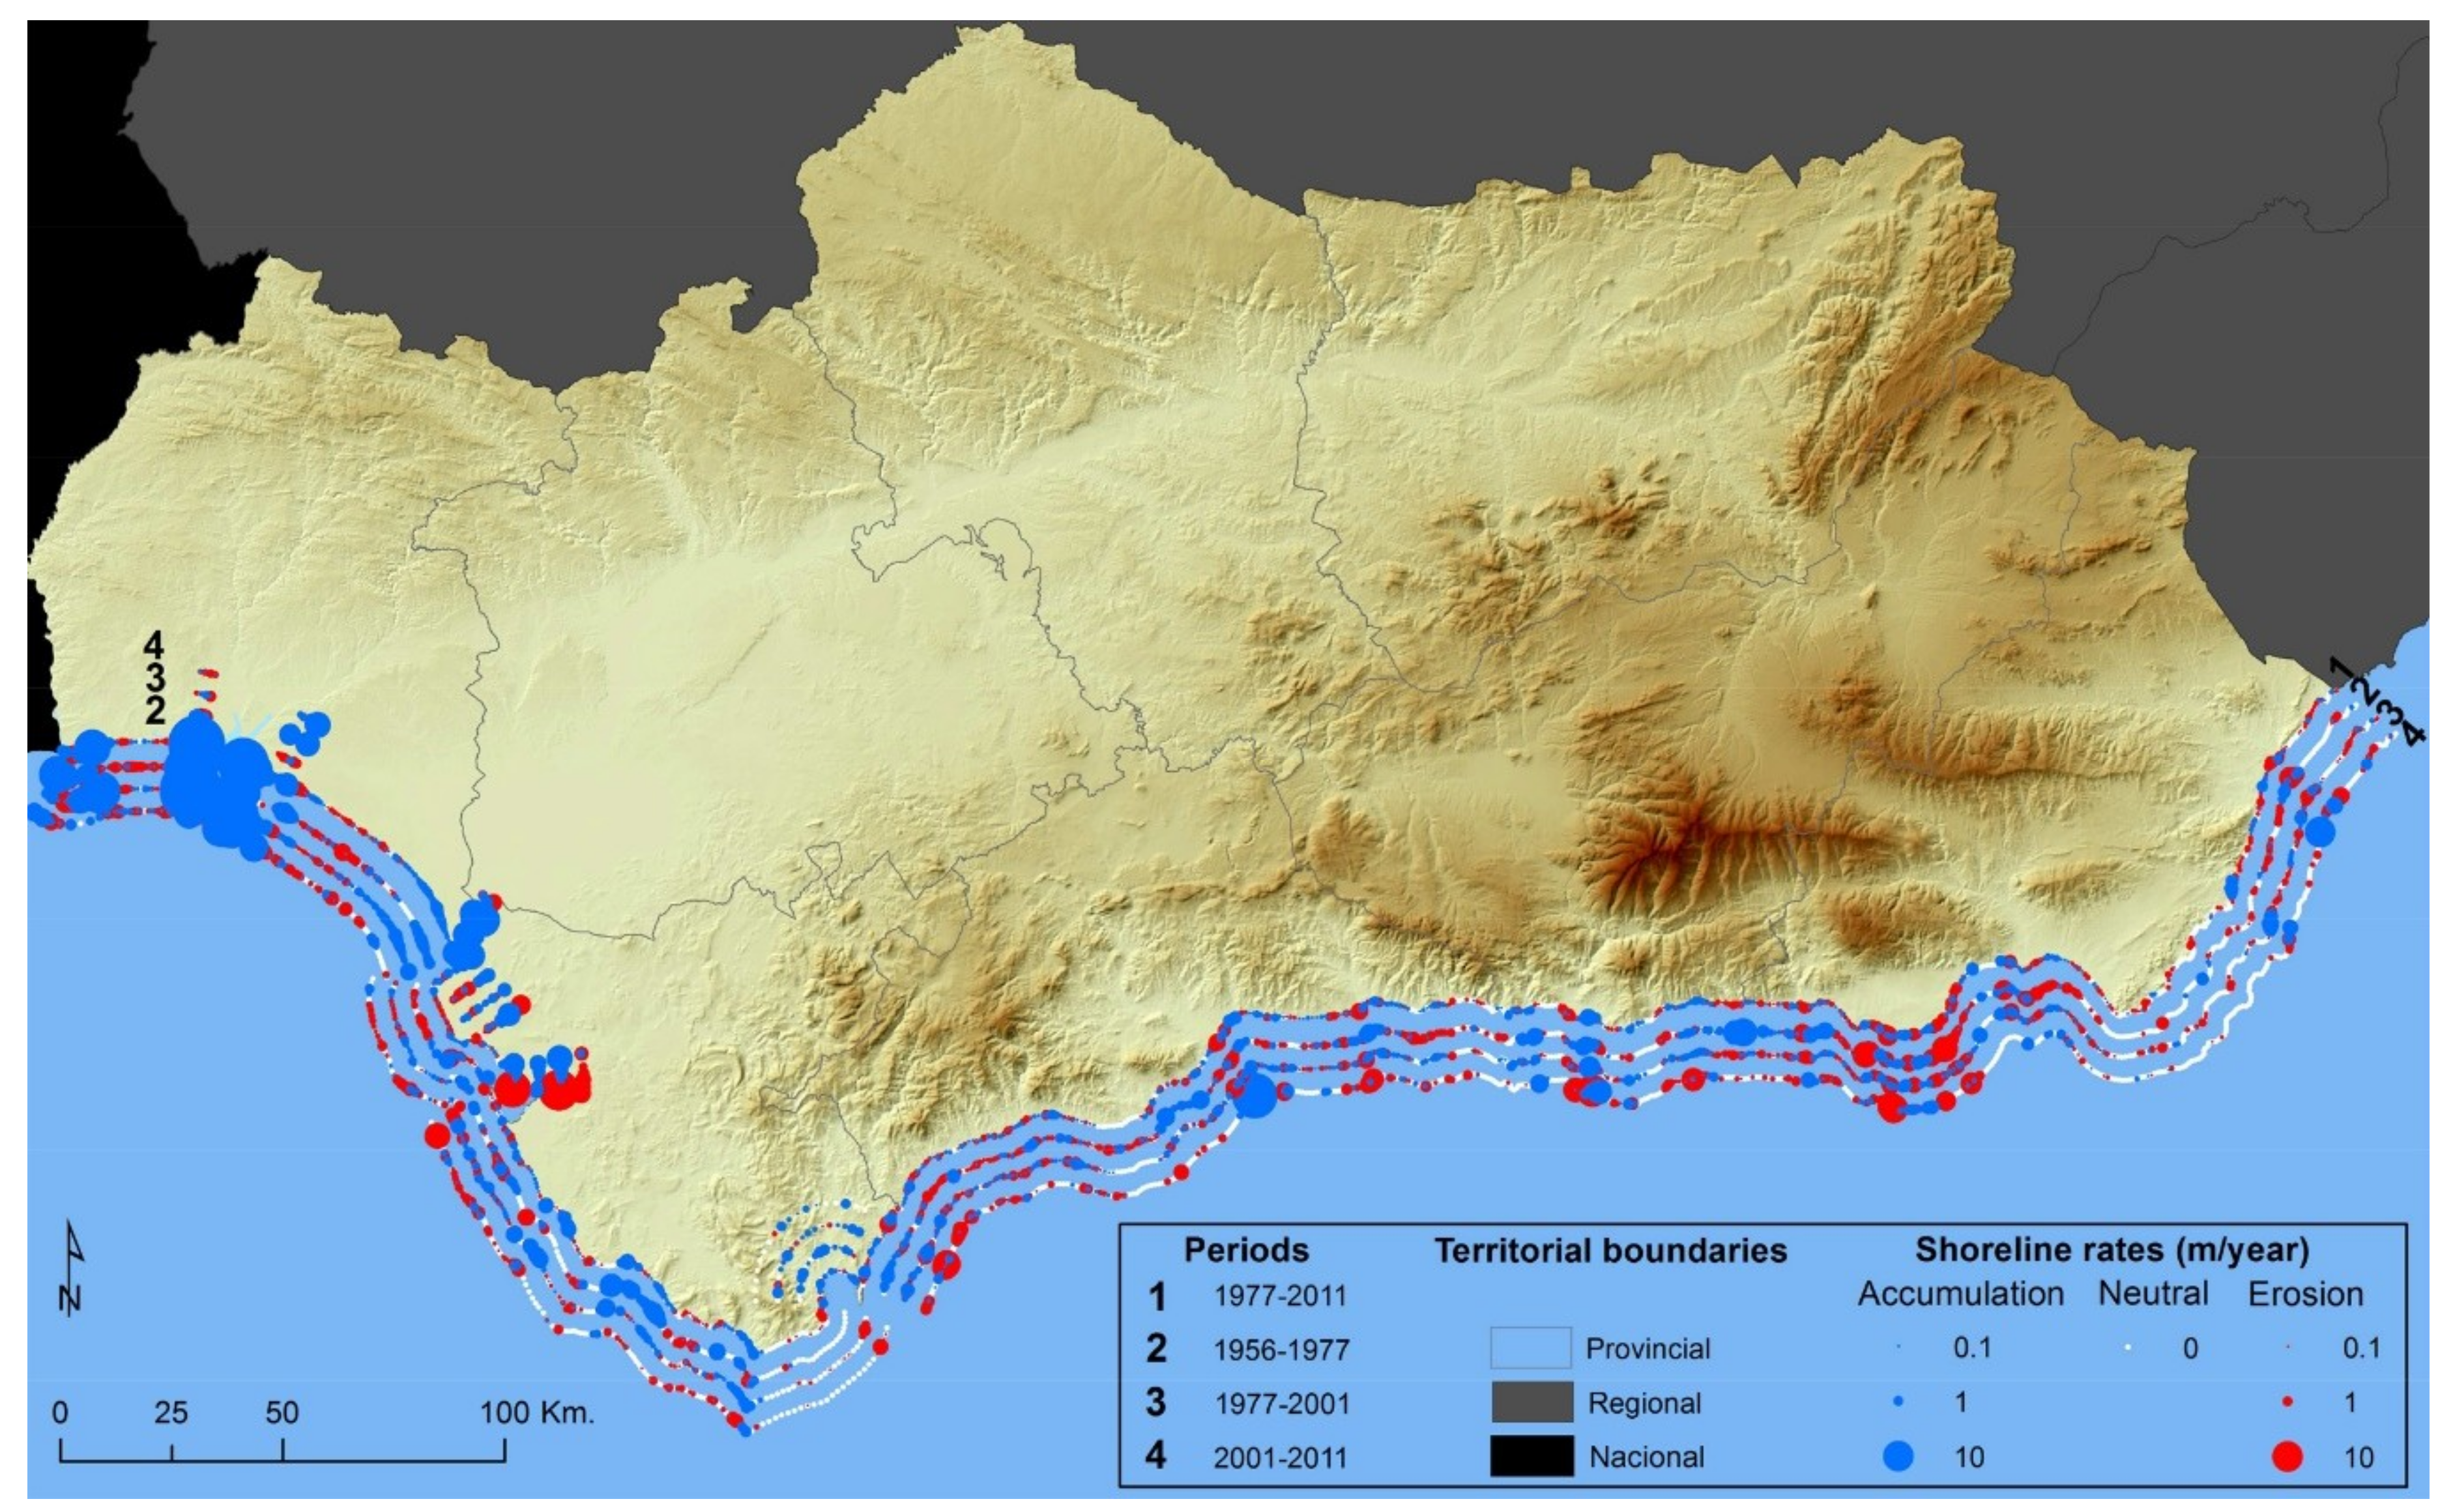
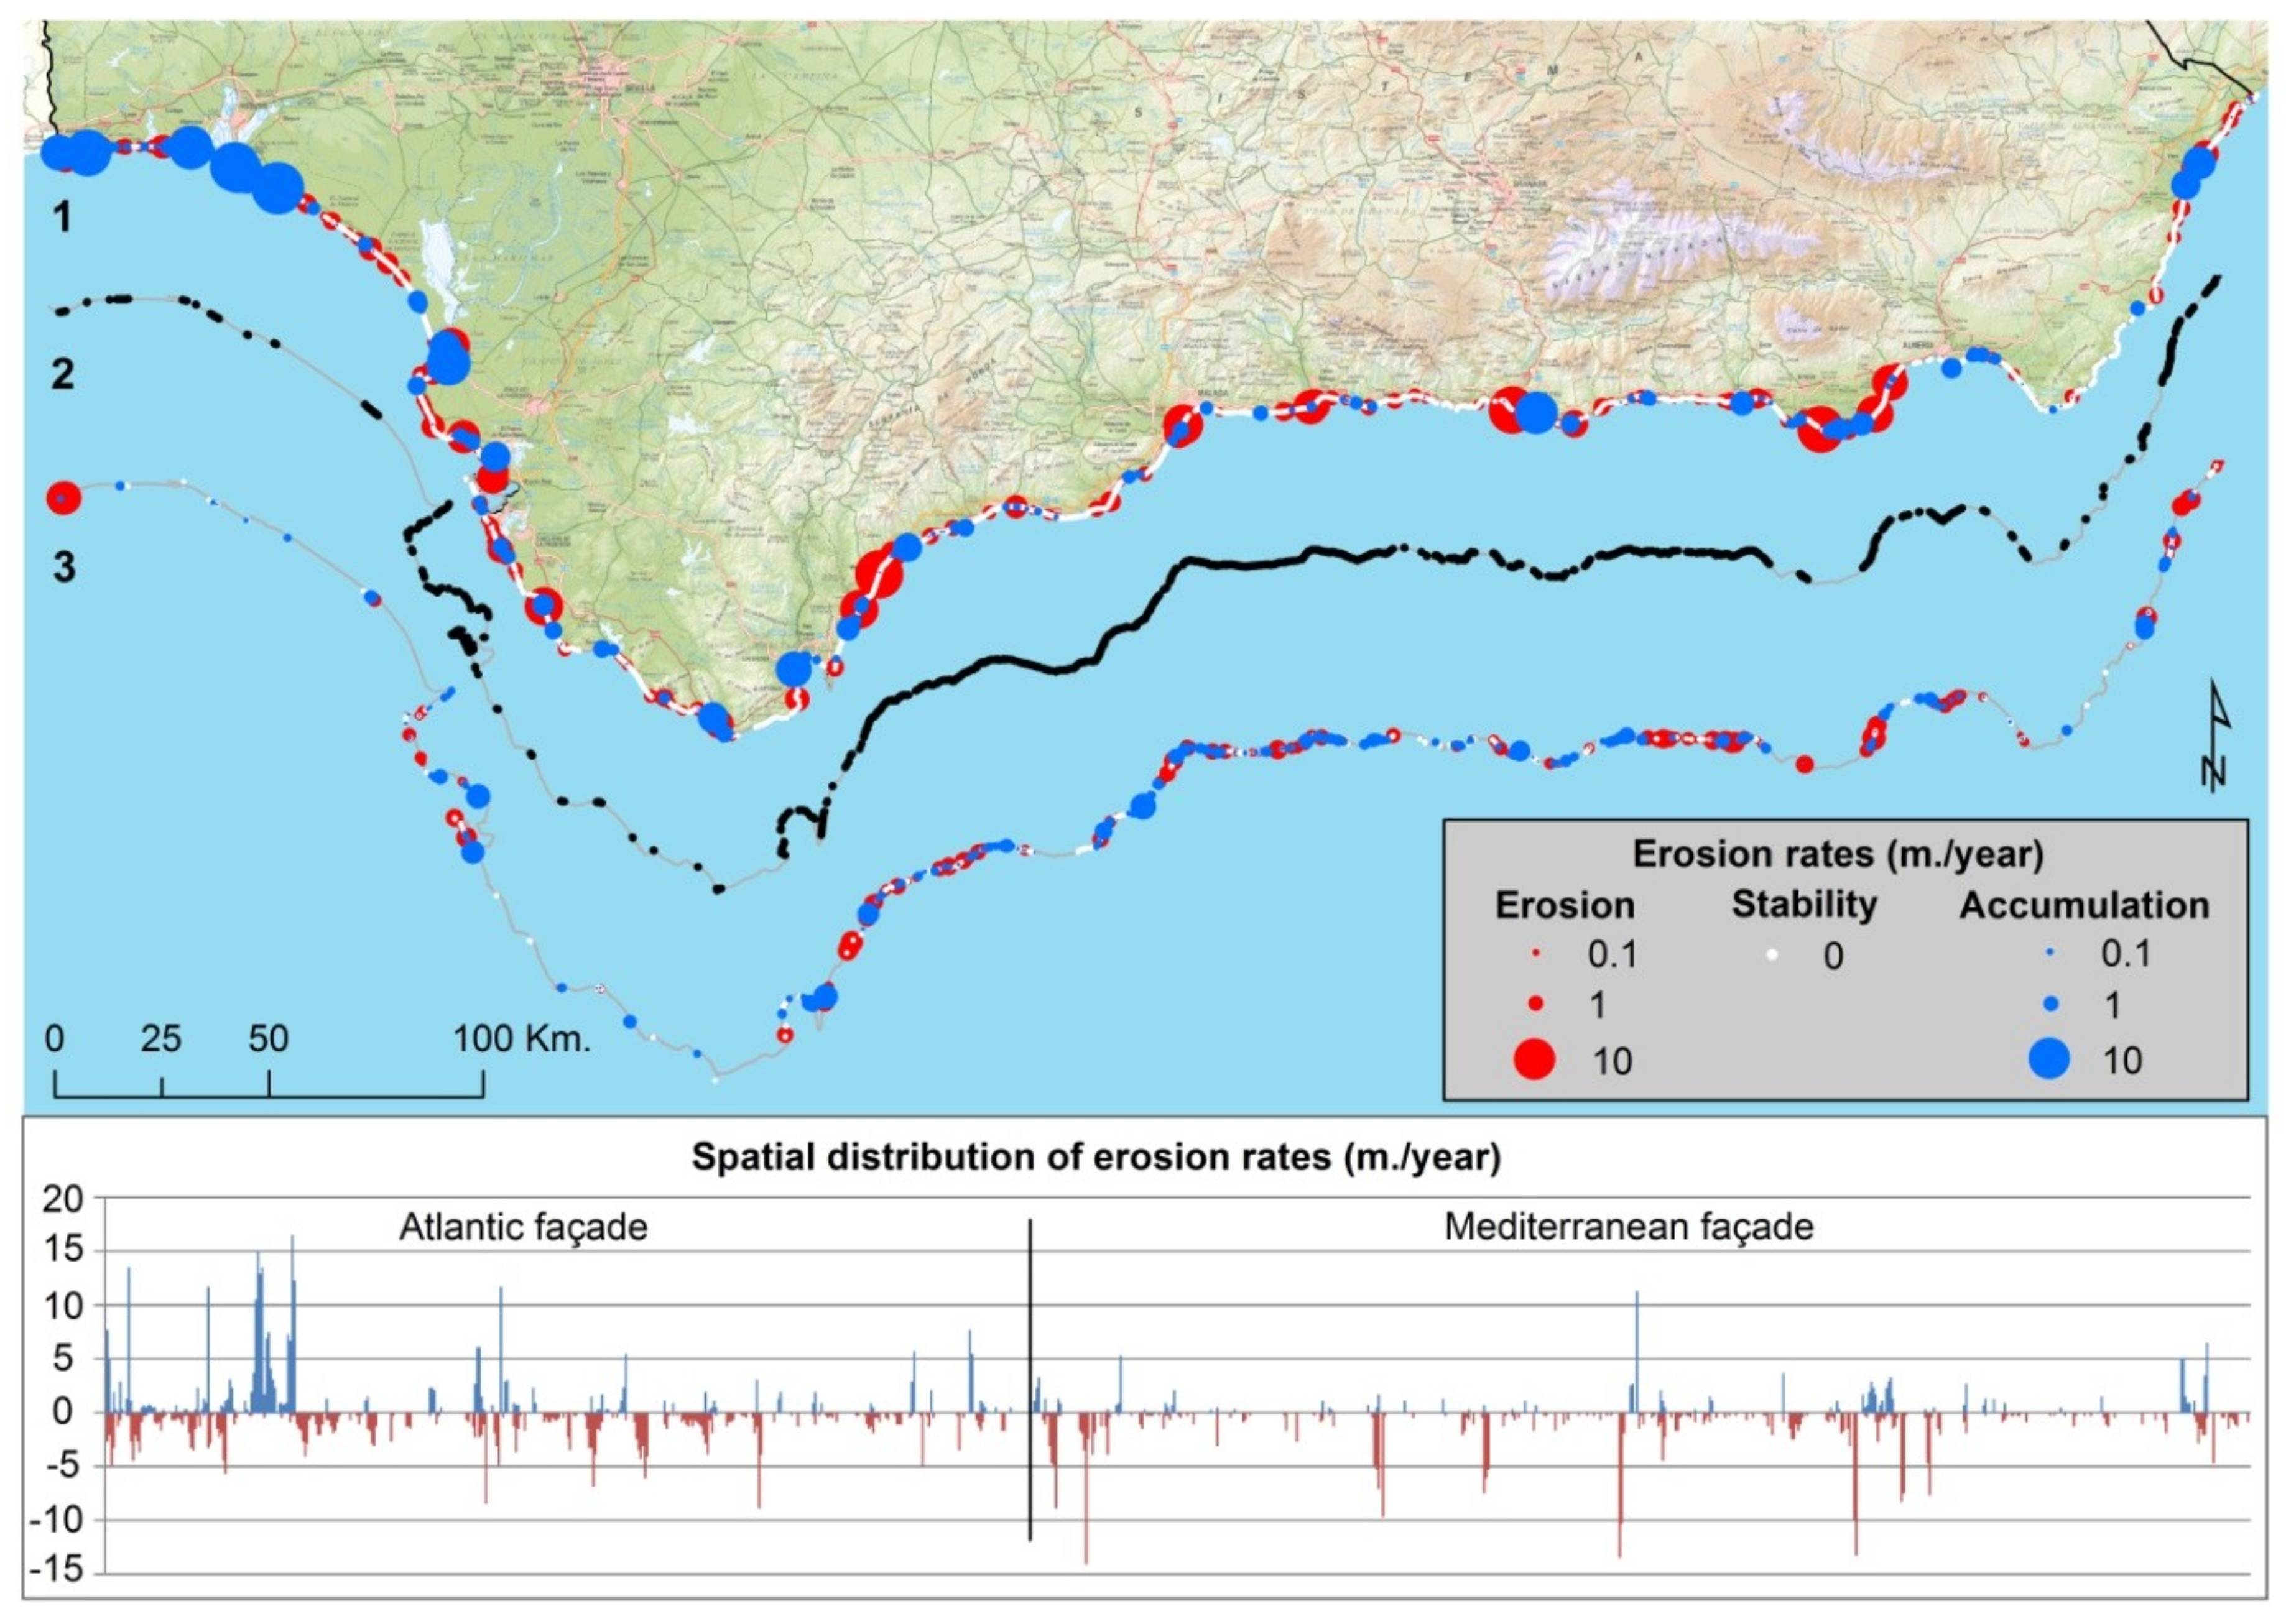
The overall erosion rates for the studied time periods are represented by offshore proportional dots (15,069 dots for each time period, representing each shoreline segment), showing the shoreline oscillation of the Andalusian beaches. Each dot (with erosion rate values) was linked to thematic and geomorphological information through the erosion data model previously described. The resulting geographical database can be easily exploited to extract useful information for different users. For example, the combination of the information stored in this database help explain the shoreline oscillation of different coastal sections in Andalusia and the influence of natural and human factors. This information can be exploited on different scales to suit different local and regional analysis. In this context, comparison studies between the Mediterranean and Atlantic coasts, as well as regional studies for integrated coast management schemes, are now possible for the first time. In addition, the data model can be easily updated to stay current with the dynamic nature of the coastal zone.
One example of our erosion rates results are shown in
Figure 7. Here, we can observe the erosion rates of the Andalusian beaches for different studied periods. These rates were resampled to one kilometre to be able to map them in a single static map. However, it is not very practical to distribute this information in static maps, as the data aggregation does not allow the use of detailed information (for example, there are erosion rates available at 50 m intervals). Furthermore, data aggregation may lead to the incorrect interpretation of the data. Thus, the vast amount of information obtained for this work complicates its visualisation by traditional methods, such as static maps. Alternatively, an interactive web-based viewer was developed to optimize our results and the linked thematic information, as is described in the following section.
As mentioned in the introduction, the calculation of volumetric erosion rates is not feasible due the lack of available data, and the use of proxies obtained by digitization techniques is the most common approach used to estimate erosion rates. However, although these proxies reasonably accurately represent the coastal dynamic, they have some limitations derived from their two-dimensional (2D) nature (distances and surfaces measurements), and they should be treated carefully as erosion is a 3D phenomenon (volumetric measurements). In this context, it is essential to highlight the importance of complement erosion rates derived from 2D approaches with thematic and geomorphological information. This will help provide context and interpret the results obtained. In order to show the potential and benefits of relating this information, an example focused on the influence of coastal infrastructures on erosion rates is explained in detail in
Section 4.3.
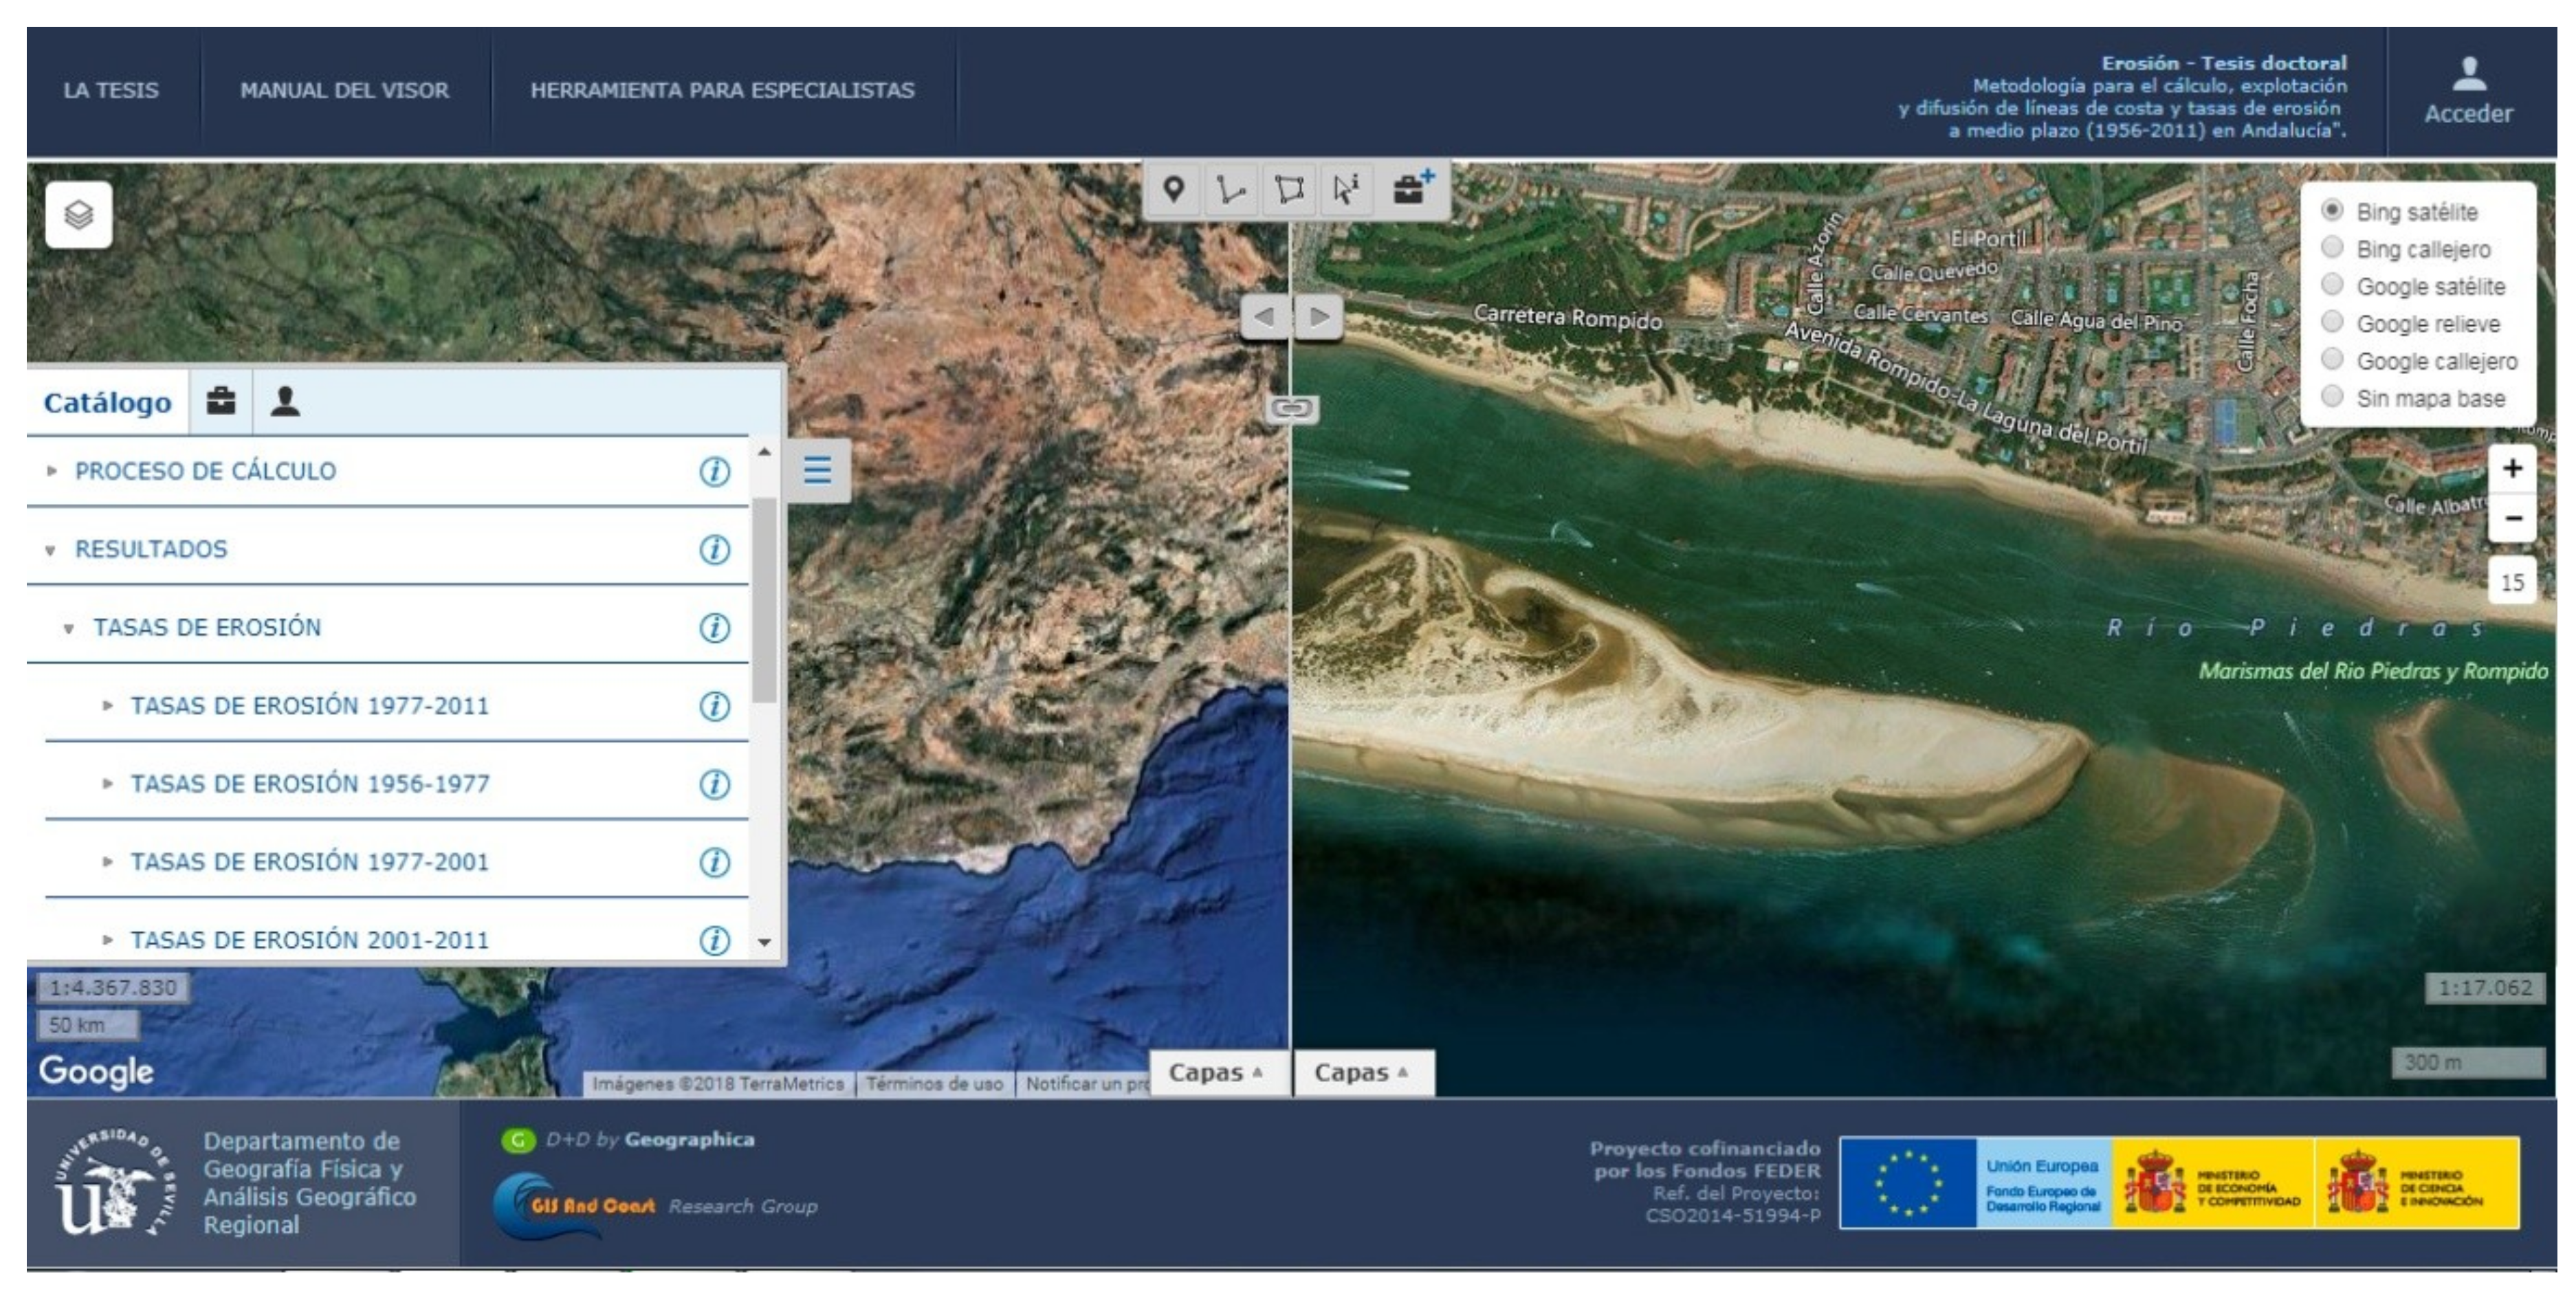
4.2. Web-Based Viewer
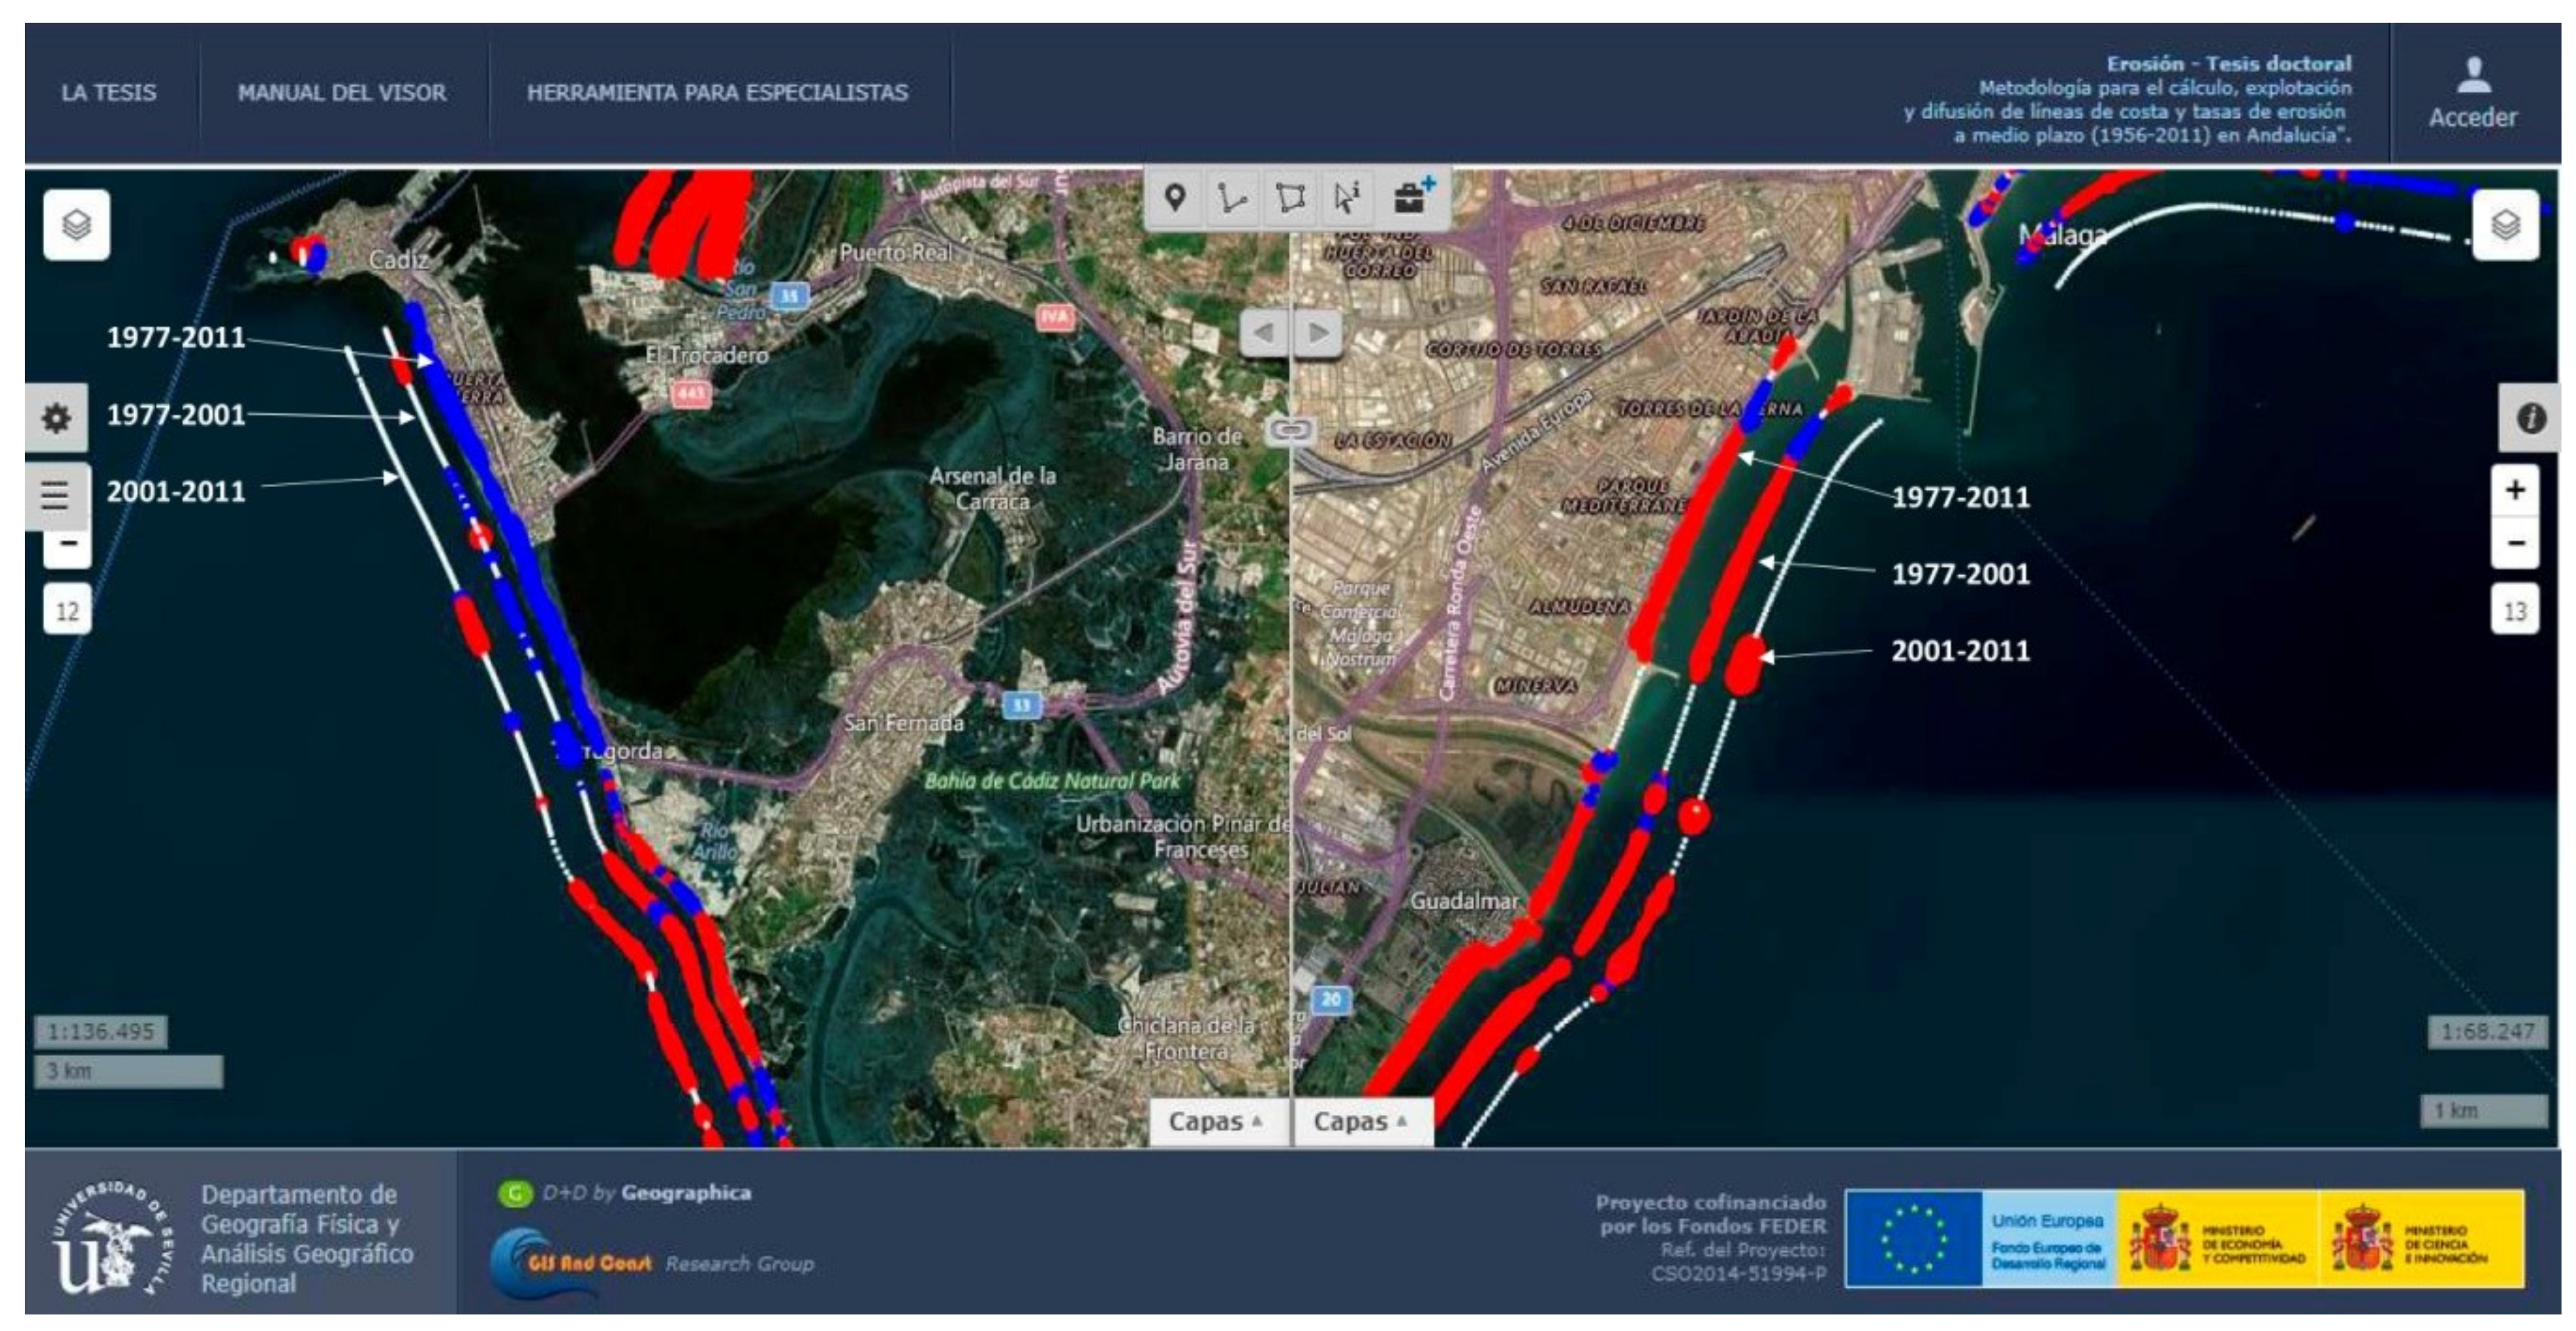
The erosion web viewer was designed to be used for the general public (e.g., citizens, politicians, and environmental managers). The purpose of this viewer was to disseminate effectively and easily detailed coastal data (e.g., erosion rates) using map web services in OGC. This viewer includes a set of tools that also provides access to related documents (pdf) and visualisation tools (e.g., panoramic photographs and geo-localisation with GPS) that are displayed on a user-friendly interface (
Figure 8). Some of the applications and functionalities of this viewer are listed below.
- (1)
A part of the navigation tools (e.g., zoom and pan) usually found in geographical web viewers, this viewer also includes digitization tools to create points, lines, or polygons, measurement tools to measure distances, and geo-location tools (GPS).
- (2)
The interface is divided into two windows, enabling spatial synchronization of both windows. This is particularly useful because information for different years or of different nature can be displayed simultaneously, improving the comparison analysis, for instance. An example using the erosion rates for different years in different locations is displayed in
Figure 9.
- (3)
This viewer integrates a structured catalogue where all the generated layers are available through web map servers (WMS) and web map tiling service (WMTS) in combination with other layers useful for the analysis and interpretation of the erosion rates. The external data are available in spatial data infrastructure catalogues or external web portals.
- (4)
This viewer allows the generation of customized views that can be saved for future sessions. This option facilitates the use of this viewer for planning and management purposes in coastal areas, as specific managers can customize their own views based on their own interest and practices.
- (5)
From the data catalogue available in the viewer, the user has access to the legend of the displayed data and to documents describing the data (pdf). The legend is also available a user manual to guide new users.
- (6)
This viewer allows the possibility of getting access to ‘GetFeatureInfo’ and to export/import files in KML format.
- (7)
Finally, there are also help tools to facilitate the interpretation and analysis of the erosion rates. In order to help the user, a link to virtual globes [
42] (Google Street View, Google and Bing aerial, Google and Bing satellite) is available.
4.3. Effects of Coastal Infrastructures on Erosion Rates
One of the outputs obtained from this work is the possibility of contrasting background information with erosion data to improve the interpretation of the results. Here, we assessed the effect of coastal infrastructures on the mentioned rates. Results revealed (
Figure 10 and
Table 3) an increase in the number of shoreline segments associated with beaches influenced by urban areas and/or coastal infrastructures. Particularly along the Mediterranean coast, the urbanization process has been very intense (
Figure 10), including the construction of a large amount of coastal defense infrastructures. The increase in the built environment along the coastal front has exponentially increased the vulnerability of these areas to erosive processes [
8,
43].
Overall, results for both the Mediterranean and Atlantic coasts showed greater percentages for erosive beach segments than cumulative beach segments for the last studied time period (2001–2011). Although percentage values for stable beach segments are clearly greater than for erosive and cumulative beaches, the Mediterranean coast presented a significantly higher percentage (81%) than the Atlantic coast (54%). Based on these results, an immediate interpretation would be that, overall, the Andalusia coast and especially the Mediterranean coast had a stable tendency during the most recent period (2001–2011). An analyst could interpret this as most beaches in Andalusia are not sensitive to erosive processes, and it is not necessarily the reality of this coast.
In order to put this information into perspective, all the information available in our erosion data model can be used. For example, erosion rates for previous periods, as well as thematic and geomorphological information, enable a more detailed analysis for the first time over those beaches characterised as stable in the first analysis. Thus, it is possible to analyse the behavior of those beach segments over other periods of time to determine a long term tendency, or to differentiate between the used proxies to obtain information about the nature of the backshore upper limit (e.g., foredune, coastal cliff, or infrastructure).
The retrospective analysis revealed that there are clear differences between the Mediterranean and Atlantic coast as well. The Atlantic coast showed roughly 28 km characterised as stable that used the infrastructure proxy for the most recent period (2001–2011). The majority of those beaches (~55%) were already stable for the previous time period (1977–2001), followed by ~25% of beaches with a cumulative tendency and ~20% with an erosive tendency. In contrast, the Mediterranean coast has been affected by an intense (past and current) urbanisation process, showing a completely different dynamic in past periods. Here, those beaches characterised as stable during the 2001–2011 period showed predominant erosive processes during the previous time period (1977–2001): ~40% characterised as erosive beaches, ~34% as stable beaches, and ~26% as cumulative beaches.
Once we have provided context to the previous results obtained, the interpretation and assessment of the state of those beaches may change completely. The increase in the upper limit of rigidity in Mediterranean beaches (built environment proxy) does not enable the natural variability of this limit, providing an incorrect assessment for those beaches. The analyst could incorrectly classify these beaches as stable and not sensitive. However, this assessment would be far from the real condition of these beaches, as they are the most sensitive beaches to coastal erosion.
5. Discussion
Erosion is one of the main threats to beach environments [
2,
8]. In Andalusia, this process is particularly important because 70% of the ECF is composed of sandy beach environments, which are sensitive to erosion processes. Thus, understanding beach behavior is vital to minimizing human pressures and to preserve these environments. Detailed information is essential to monitor and assess these environments, and is crucial for environmental and tourism planning.
It has been noted in this paper that the only source of information allowing retrospective calculations of medium- and long-term erosion rates on detailed scales are photogrammetric flights. Previous publications that have already used that information source [
10,
44,
45,
46] also agree with this statement. However, it has been proven that the only method to obtain a derived product with sufficient geometric consistency for a study area the size of the Andalusian coast is through the use of orthophotos derived from photogrammetric restitution (interior and exterior orientation and triangulation for instance). In the case of Andalusia, photogrammetric restitution was also performed for the products derived from historical photogrammetric flights (1956–1957 and 1977–1983). The products are freely and publicly available. Thus, the choice of that data source type is the most consistent from the standpoint of its geometric quality and the extent of the study area. The study area’s expanse is doubtless one of the main contributions of this study, as there are no precedents encompassing the entire Andalusian coast.
Regarding the chosen indicator, the type of shoreline indicator (proxy) chosen, the only ones possible are the type called feature-based proxies in the scientific literature. The choice was therefore to use the one most recommended in the scientific literature for medium–long-term studies: contact between the upper part of the dry beach (backshore) and the coastal dune (foredune), cliff, or infrastructure.
One of more relevant and innovative contributions from the methodological standpoint is its geometric rendering after photo interpretation. Exhaustive digitization of the proxy means that digitized shorelines present a great deal of variability and geometric sinuosity in just a few meters given the presence of interruptions in coastal dunes by human accesses or washover during storm-linked episodes, etc. The use of a smoothed line joining the most external sectors of backshore/dune contact (omitting some of those minor occasional oscillations) was thus considered to be an innovative proposal, based on the hypothesis that in medium–long-term evolution, the occasional incidence of erosive processes that are extreme or linked to human action will vary in position throughout that period [
31]. With that proposal (smoothed line), the generalized recession/advance of the shore in the medium–long-term could be more accurately evaluated.
Doubtless, the most critical element enabling an approach to study all Andalusian beaches, given that the proxy should be photo-interpreted, is the fact that the process is performed by just one photo-interpreter and at one single scale during all the digitization process (1:2500), using proprietary ArcGIS 10.3 software. It is therefore an unprecedented characteristic for a study area of this size, which guarantees the possibility of comparative analysis between calculations made for the whole study area (more than 900 linear km of coast).
The vast number of results obtained (15,069 dots including thematic and geomorphological information and erosion rates for different time periods) for the entire Andalusia, made the traditional cartographic representation of the erosion rates unfeasible. The designed web viewer facilitates the access, visualization, and dissemination of the results, providing several applications that allow a multi-scale visualisation. Thus, the user can have a complete view of the work undertaken here. In this context, the viewer could be a substitute for an interactive digital atlas of the erosion rates.
With regard to the designed methodology, unlike most previously published papers that calculated the rates once the shorelines’ geometry (proxy) had been digitized, leaving for subsequent work the respective analysis and association to other variables [
47,
48], this paper defines a conceptual data model that incorporates both the geometric component of the shorelines and various aforementioned theme-specific attributes for the different dates in an open-code spatial database manager—PostreSQL/PostGIS. This data model is dynamic, enabling new data and erosion rate calculations to be entered, making it a tool that can be adjusted to the needs of information inclusion. This facilitates the contextualization of the erosion rates.
From a conceptual point of view, it is necessary to select a proxy for the erosion rate calculation as a 2D phenomenon. The selected proxy greatly influences the estimation and interpretation of the resulting erosion rates [
10]. Thus, the thematic and geomorphological information linked to the different shorelines is essential to complement the obtained erosion rates, improving the interpretation of the results, as they can be analyzed considering contextual information.
6. Conclusions
We developed a methodological proposal for improving the analysis, interpretation, and geo-visualisation of coastal erosion rates with application to the Andalusian coast in Southern Spain. This is the first approach carried out by just one photo-interpreter at a detailed scale (1:2500) for the entire Andalusian coast, which enables comparisons of different sectors along this coast.
The design and implementation of a data model, linking thematic and geomorphological information to each shoreline segment, enable the contextualisation of the erosion rates and the improvement of the results interpretation. This model is an important result of this work that maximises the analytical data capacity. Its design and construction ensure the automation of processes and data flow in future updates, as well as geometrical and thematic data. Furthermore, the data model is repeatable and applicable to new study areas at different scales, and could be used by other users.
The vast amount of information obtained (derived from the digitization process and data model exploitation) made the production of classic static maps (digital or paper based) unfeasible. Thus, in order to maximise the access and dissemination of these results for different users (planners, researchers, and citizens for instance), they were integrated into a web viewer designed to that end. The viewer-friendly user interface, in combination with its wide functionalities, enables easy access, visualisation, and use of these data for future studies of different natures. Erosion data (point layers for different years) were mapped using offshore buffers at different distances from the coastline, enabling visualisation of erosion rates for the entire Andalusia and facilitating visual comparative analysis.
Finally, this work could be used as reference for future works of similar themes undertaken in the Andalusia coast, and provide a valuable source of data for different studies at local and regional scales. This work stands out from other erosion site-specific studies because, for the first time, comparisons are possible between different sectors of the Andalusian coast in Mediterranean and Atlantic coasts, simultaneously providing detailed regional information for integrated coastal management and other regional analysis.
Author Contributions
Conceptualization, A.P.-C., P.D.-C., M.F.-N. and J.O.-Z.; Data curation, A.P.-C.; Formal analysis, A.P.-C.; Funding acquisition, J.O.-Z.; Investigation, A.P.-C.; Methodology, A.P.-C., P.D.-C., M.F.-N. and J.O.-Z.; Project administration, J.O.-Z.; Resources, J.O.-Z.; Supervision, A.P.-C. and P.D.-C.; Validation, A.P.-C.; Visualization, P.D.-C.; Writing—original draft, M.F.-N.; Writing—review & editing, M.F.-N.
Acknowledgments
This research was supported by Ministerio de Economía y Competitividad (Grant No. CSO2014-51994-P).
Conflicts of Interest
The authors declare no conflict of interest.
References
- European Environment Agency (EEA). The Changing Faces of Europe’s Coastal Areas; No. 6; 2006. Available online: https://www.eea.europa.eu/publications/eea_report_2006_6 (accessed on 3 September 2018).
- Griggs, G. Coasts in Crisis. A Global Challenge; University of California Press: Oakland, CA, USA, 2017; p. 360. ISBN 0520293622. [Google Scholar]
- Malavasi, M.; Santoro, R.; Cutini, M; Acosta, A.T.R.; Carranza, M.L. The impact of human pressure on landscape patterns and plant species richness in Mediterranean coastal dunes. Plant Biosyst. 2016, 150, 73–82. [Google Scholar] [CrossRef]
- Pérez, A.; Marcos, C.; Pérez, I.M.; Barcala, E.; Hegazi, M.I.; Quispe, J. Detecting changes resulting from human pressure in a naturally quick-changing and heterogeneous environment: Spatial and temporal scales of variability in coastal lagoons. Estuar. Coastal Shelf Sci. 2007, 75, 175–188. [Google Scholar] [CrossRef]
- Peña, C.; Fraile, P.; Hernández, L.; Pérez, E.; Ariza, E. Measuring geomorphological vulnerability on beaches using a set of indicators (GVI): A tool for management. J. Environ. Manag. 2017, 204, 230–245. [Google Scholar] [CrossRef] [PubMed]
- Bowen, A.J.; Inman, D.L. Budget of Littoral Sands in the Vicinity of Point Arguello, California; No. TM-19; Army Coastal Engineering Research Center: Washington, DC, USA, 1966. [Google Scholar]
- Komar, P.D. Beach Processes and Sedimentation; Prentice-Hall: Englewood Cliffs, NY, USA, 1978; p. 544. ISBN 0137549385. [Google Scholar]
- Prieto, A. Metodología Para el Cálculo, Explotación y Difusión de Líneas de Costa y Tasas de Erosión a Medio-Largo Plazo (1956–2011) en Andalucía. Ph.D. Thesis, Universidad de Sevilla, Sevilla, Spain, 2017. [Google Scholar]
- Trenhaile, A.S. Coastal Dynamics and Landforms; Clarendon Press: Oxford, UK, 1997; p. 384. ISBN 0198233531. [Google Scholar]
- Del Río, L. Riesgos de Erosión Costera en el Litoral Atlántico Gaditano. Ph.D. Thesis, Universidad de Cádiz, Puerto Real, Spain, 2007. [Google Scholar]
- Pari, Y.; Ramana Murthy, M.V.; Jaya Kumar, S.; Subramanian, B.R.; Ramachandran, S. Morphological changes at Vellar estuary, India—Impact of the December 2004 tsunami. J. Environ. Manag. 2008, 89, 45–57. [Google Scholar] [CrossRef] [PubMed]
- Pye, K.; Blott, S.J. Assessment of beach and dune erosion and accretion using LiDAR: Impact of the stormy 2013–14 winter and longer term trends on the Sefton Coast, UK. Geomorphology 2016, 266, 146–167. [Google Scholar] [CrossRef]
- Martínez, C.; Quezada, M.; Rubio, P. Historical changes in the shoreline and littoral processes on a headland bay beach in central Chile. Geomorphology 2011, 135, 80–96. [Google Scholar] [CrossRef]
- Pennetta, M. Beach Erosion in the Gulf of Castellammare di Stabia in Response to the Trapping of Longshore Drifting Sediments of the Gulf of Napoli (Southern Italy). Geosciences 2018, 8, 235. [Google Scholar] [CrossRef]
- Thieler, E.R.; Danforth, W.W. Historical Shoreline Mapping (I): Improving Techniques and Reducing Positioning Errors. J Coastal Res. 1994, 10, 549–563. Available online: http://www.jstor.org/stable/4298252 (accessed on 3 September 2018).
- Thieler, E.R.; Danforth, W.W. Historical Shoreline Mapping (II): Application of the Digital Shoreline Mapping and Analysis Systems (DSMS/DSAS) to shoreline change mapping in Puerto Rico. J. Coastal Res. 1994, 10, 600–620. Available online: http://www.jstor.org/stable/4298256 (accessed on 3 September 2018).
- Cheng, J.; Wang, P.; Guo, Q. Measuring Beach Profiles along a Low-Wave Energy Microtidal Coast, West-Central Florida, USA. Geosciences 2016, 6, 44. [Google Scholar] [CrossRef]
- Harley, M.D.; Turner, I.L.; Short, A.D.; Ranasinghe, R. Assessment and integration of conventional, RTK-GPS and image-derived beach survey methods for daily to decadal coastal monitoring. Coastal Eng. 2011, 58, 194–205. [Google Scholar] [CrossRef]
- Lantuit, H.; Pollard, W.H. Fifty years of coastal erosion and retrogressive thaw slump activity on Herschel Island, southern Beaufort Sea, Yukon Territory, Canada. Geomorphology 2008, 95, 84–102. [Google Scholar] [CrossRef]
- Delgado, I.; Davidson, R.; Ollerhead, J. Application of a Remote Sensing Technique to the Study of Coastal Dunes. J. Coastal Res. 2009, 255, 1160–1167. [Google Scholar] [CrossRef]
- Ghoneim, E.; Mashaly, J.; Gamble, D.; Halls, J.; AbuBakr, M. Nile Delta exhibited a spatial reversal in the rates of shoreline retreat on the Rosetta promontory comparing pre- and post-beach protection. Geomorphology 2015, 228, 1–14. [Google Scholar] [CrossRef]
- Jones, R. Quantifying Extreme Weather Event Impacts on the Northern Gulf Coast Using Landsat Imagery. J. Coastal Res. 2015, 315, 1229–1240. [Google Scholar] [CrossRef]
- Scarelli, F.M.; Sistilli, F.; Fabbri, S.; Cantelli, L.; Barboza, E.G.; Gabbianelli, G. Seasonal dune and beach monitoring using photogrammetry from UAV surveys to apply in the ICZM on the Ravenna coast (Emilia-Romagna, Italy). Remote Sens. Appl. Soc. Environ. 2017, 7, 27–39. [Google Scholar] [CrossRef]
- Appeaning, K. Shoreline morphological changes and the human factor. Case study of Accra Ghana. J. Coastal Conserv. 2013, 17, 85–91. [Google Scholar] [CrossRef]
- Cellone, F.; Carol, E.; Tosi, L. Coastal erosion and loss of wetlands in the middle Río de la Plata estuary (Argentina). Appl. Geogr. 2016, 76, 37–48. [Google Scholar] [CrossRef]
- Fletcher, C.; Rooney, J.; Barbee, M.; Lim, S.; Richmond, B. Mapping shoreline change using digital orthophotogrammetry on Maui, Hawaii. J. Coastal Res. 2003, 38, 106–124. [Google Scholar]
- Ramírez, J.M.; Rodríguez, I.; Gracia, F.J.; Sánchez, M.J.; Barrio, F. Application of change detection techniques in geomorphological evolution of coastal areas. Example: Mouth of the River Ebro (period 1957–2013). Appl. Geogr. 2016, 75, 12–27. [Google Scholar] [CrossRef]
- Moore, L.J.; Griggs, G.B. Long-term cliff retreat and erosion hotspots along the central shores of the Monterey Bay National Marine Sanctuary. Mar. Geol. 2002, 181, 265–283. [Google Scholar] [CrossRef]
- Ojeda, J.; Borgniet, L.; Pérez, A.M.; Loder, J.F. Monitoring morphological changes along the coast of Huelva (SW Spain) using soft-copy photogrammetry and GIS. J. Coastal Conserv. 2002, 8, 69. [Google Scholar] [CrossRef]
- Díaz, P.; Prieto, A.; Ojeda, J.; Álvarez, J.I. Tasas de erosión en playas con dunas costeras en el litoral de Andalucía: Primeros datos globales. In Naturaleza, Territorio y Ciudad en un Mundo Global, Proceedings of the XXV Congreso de la Asociación de Geógrafos Españoles, Madrid, Spain, 25–27 October 2017; UAM Ediciones: Madrid, Spain, 2017; pp. 86–95. [Google Scholar]
- Gracia, F.J.; Anfuso, G.; Benavente, J.; Del Río, L.; Domínguez, L.; Martínez, J.A. Monitoring coastal erosion at different temporal scales on sandy beaches: Application to the Spanish Gulf of Cadiz coast. J. Coastal Res. 2005, SI, 22–27. Available online: https://www.jstor.org/stable/25737399 (accessed on 3 September 2018).
- Viciana, A. Erosión Costera en Almería 1957–1995; Instituto de Estudios Almerienses: Almería, Spain, 2001; p. 551. ISBN 84-8108-244-9. [Google Scholar]
- National Statistics Institute. Annual National Accounting of Spain. 2nd Quarter 2018. Available online: http://www.ine.es/dyngs/INEbase/es/categoria.htm?c=Estadistica_P&cid=1254735576581 (accessed on 3 September 2018).
- Regional Government of Andalusia. Turismo y Deporte. Available online: http://www.juntadeandalucia.es/andalucia/economia/turismo.html (accessed on 4 September 2018).
- Félix, A.; Baquerizo, A.; Santiago, J.M.; Losada, M.A. Coastal zone management with stochastic multi-criteria analysis. J. Environ. Manag. 2012, 112, 252–266. [Google Scholar] [CrossRef] [PubMed]
- Fernandez-Nunez, M.; Díaz, P.; Ojeda, J.; Prieto, A.; Sánchez, N. Multipurpose line for mapping coastal information using a data model: The Andalusian coast (Spain). J. Coastal Conserv. 2015, 19, 461–474. [Google Scholar] [CrossRef]
- Thieler, E.R.; Himmelstoss, E.A.; Zichichi, J.L.; Ergun, A. Digital Shoreline Analysis System (DSAS) Version 4.0—An ArcGIS Extension for Calculating Shoreline Change; Serial Number 2008-1278; U.S. Geological Survey: Reston, VA, USA, 2009. Available online: https://pubs.er.usgs.gov/publication/ofr20081278 (accessed on 3 September 2018).
- Regulates the Geodetic System of Official Reference in Spain. Royal Decree 1071/2007. 27 July 2007.
- Anfuso, G. Morfología y Dinámica Sedimentaria del Litoral Gaditano Entre Chipiona y Rota. Ph.D. Thesis, Universidad de Cádiz, Puerto Real, Spain, 2001. [Google Scholar]
- Bosque, J. Sistemas de Información Geográfica; Rialp: Madrid, Spain, 1992; p. 451. ISBN 84-321-3154-7. [Google Scholar]
- Coyne, M.A.; Fletcher, C.H.; Richmond, B. Mapping coastal erosion hazard areas in Hawaii: Observations and errors. J. Coastal Res. 1999, SI, 171–184. Available online: http://www.jstor.org/stable/25736194 (accessed on 3 September 2018).
- Butler, D. Virtual globes: The web-wide world. Nature 2006, 439, 776–778. [Google Scholar] [CrossRef] [PubMed]
- Villar, A.; Ojeda, J. El desarrollo de una base de datos espacial sobre el proceso de urbanización en el litoral de Andalucía: Indicadores del colapso inmobiliario (2004-2007-2009). In Tecnologías de Información Geográfica en el Contexto de Cambio Global, Proceedings of the XV Congreso de las Tecnologías de la Información Geográfica, Madrid, Spain, 19–21 September 2012; CSIC-IEGD: Madrid, Spain, 2012; pp. 427–437. [Google Scholar]
- Dolan, R.; Hayden, B.; Heywood, J. A new photogrammetric method for determining shoreline erosion. Coastal Eng. 1978, 2, 21–39. [Google Scholar] [CrossRef]
- Dolan, R.; Haiden, B.; May, B.P.; May, S. The reability of shoreline change measurements from aerial photographs. Shore Beach 1980, 48, 22–29. [Google Scholar]
- Morton, R.A.; Miller, T.L.; Moore, L.J. National Assessment of Shoreline Change: Part 1 Historical Shoreline Changes and Associated Coastal Land Loss along the U.S Gulf of Mexico; DIANE Publishing: Collingdale, PA, USA, 2004. [Google Scholar]
- Bakhoum, P.W.; Ndour, A.; Niang, I.; Sambou, B.; Traore, V.B.; Diaw, A.T.; Sambou, H.; Ndiaye, M.L. Coastline Mobility of Goree Island (Senegal), from 1942 to 2011. Mar. Sci. 2017, 7, 1–9. [Google Scholar] [CrossRef]
- Bheeroo, R.A.; Chandrasekar, N.; Kaliraj, S.; Magesh, N.S. Shoreline change rate and erosion risk assessment along the Trou Aux Biches–Mont Choisy beach on the northwest coast of Mauritius using GIS-DSAS technique. Environ. Ear. Sci. 2016, 75, 1–12. [Google Scholar] [CrossRef]
© 2018 by the authors. Licensee MDPI, Basel, Switzerland. This article is an open access article distributed under the terms and conditions of the Creative Commons Attribution (CC BY) license (http://creativecommons.org/licenses/by/4.0/).


