
miR-152-3p Represses the Proliferation of the Thymic Epithelial Cells by Targeting Smad2
by

Ying Li
†, 
Xintong Wang
†,
Qingru Wu
,
Fenfen Liu
,
Lin Yang
,
Bishuang Gong
,
Kaizhao Zhang
,
Yongjiang Ma
and
Yugu Li
* College of Veterinary Medicine, South China Agricultural University, Guangzhou 510642, China
*
Author to whom correspondence should be addressed.
†
These authors contributed equally to this work.
Genes 2022, 13(4), 576; https://doi.org/10.3390/genes13040576
Submission received: 20 February 2022
/
Revised: 19 March 2022
/
Accepted: 21 March 2022
/
Published: 24 March 2022
(This article belongs to the Topic MicroRNA: Mechanisms of Action, Physio-Pathological Implications, and Disease Biomarkers)
Abstract
:MicroRNAs (miRNAs) control the proliferation of thymic epithelial cells (TECs) for thymic involution. Previous studies have shown that expression levels of miR-152-3p were significantly increased in the thymus and TECs during the involution of the mouse thymus. However, the possible function and potential molecular mechanism of miR-152-3p remains unclear. This study identified that the overexpression of miR-152-3p can inhibit, while the inhibition of miR-152-3p can promote, the proliferation of murine medullary thymic epithelial cell line 1 (MTEC1) cells. Moreover, miR-152-3p expression was quantitatively analyzed to negatively regulate Smad2, and the Smad2 gene was found to be a direct target of miR-152-3p, using the luciferase reporter assay. Importantly, silencing Smad2 was found to block the G1 phase of cells and inhibit the cell cycle, which was consistent with the overexpression of miR-152-3p. Furthermore, co-transfection studies of siRNA–Smad2 (siSmad2) and the miR-152-3p mimic further established that miR-152-3p inhibited the proliferation of MTEC1 cells by targeting Smad2 and reducing the expression of Smad2. Taken together, this study proved miR-152-3p to be an important molecule that regulates the proliferation of TECs and therefore provides a new reference for delaying thymus involution and thymus regeneration.
1. Introduction
The thymus is an important immune organ both in animals and humans. It mainly comprises the thymocytes and thymic stromal cells at different stages of maturity. The thymic epithelial cells (TECs) constitute the thymic stromal cells, providing a specific microenvironment for differentiating, developing, and maturing thymocytes [1]. However, the thymus gradually begins to degenerate with aging after the organism reaches sexual maturity. In-depth studies of thymus involution revealed differences in the size and structure of the thymus at different ages. The number of thymocytes and TECs were found to mainly decrease [2,3]. The thymus of the male mouse has been reported to reach its maximum at the age of 1 month (1 M), and thymocyte populations were found to decrease sharply from 1 to 3 months of age (3 M) until this trend of decrease attained stability [4,5]. Studies have shown the destruction of the normal thymic microenvironment to mainly reduce the numbers of TECs [5,6], and the process of thymus involution in mice was found to be delayed or slowed down by promoting the proliferation of TECs [7,8,9]. Therefore, TECs were found to be vital for thymic involution, and changes in TEC number were found to affect age-related thymic involution [10].
MicroRNAs (miRNAs) are noncoding small RNA molecules that regulate gene expression by directly binding to the 3′ untranslated region (UTR) of target mRNAs [11,12]. Previous studies have demonstrated that miRNAs can participate in biological processes, such as cell differentiation, autophagy, apoptosis, and proliferation [13,14]. In recent years, further studies have suggested that miRNAs may be related to thymic involution [15]. For example, the absence of Dicer or the miR-29a cluster causes rapid loss of thymic cellularity [16]; likewise, miR-181a-5p can regulate TEC proliferation by regulating TGF-β signaling [17], microRNA-195a-5p is known to inhibit the proliferation of TECs by targeting Smad7 [18], the miR-205-5p-mediated FA2H-TFAP2A feedback loop inhibits the proliferation of TECs and participates in the age-related involution of the mouse thymus [19], and miR-199b-5p promotes the proliferation of TECs by activating Wnt signaling by targeting Fzd6 [20]. In our previous study, the expression of miRNAs was compared in mouse thymus tissues and TECs of different ages using miRNA microarray and RNA-seq technology. When the differential expression profiles of the thymus and TECs were analyzed in mice, miR-152-3p expression levels were found to increase significantly with age [21,22,23,24] (Table S1). However, the mechanism by which miR-152-3p is involved in thymic involution has not yet been elucidated.
Smad belongs to the SMAD family of proteins, divided into the receptor-regulated SMADs (R-SMADs), common-mediator SMADs (co-SMADs), and inhibitory SMADs (I-SMADs). Smad2 and Smad3 belong to the R-SMADs [25,26,27]. SMAD2 is a downstream protein involved in the transforming growth factor signaling pathway which regulates multiple signals, such as proliferation, differentiation, and apoptosis [28,29,30,31]. At present, there are very few reports on Smad2 affecting TECs and regulating thymic involution. This study investigated the effect of miR-152-3p on proliferating murine medullary thymic epithelial cell line 1 (MTEC1) cells and studied the regulation of gene expression between miR-152-3p and Smad2 and its role in regulating thymic involution.
2. Materials and Methods
2.1. Animals
This study involved 20 male SPF BALB/c mice, ages 1 M and 3 M, with 10 mice of each age. All the animal experiments in this study were conducted according to the protocol approved by the Animal Protection Committee of South China Agricultural University (Guangzhou, China).
2.2. Isolation of the Thymus Tissues and TECs
miR-152-3p expression was detected and verified from the isolated thymic tissues (5 mice per age) and TECs (5 mice per age) under sterile conditions. The thymus tissues were isolated from the mice in each age group with sterile forceps and stored in the tissue tube in liquid nitrogen (−196 °C). The method of isolating and purifying the TECs was performed according to a previous description [19,32]. Briefly, the chopped thymus was digested in collagenase for 30 min at 37 °C. Then, the termination solution (Dulbecco’s Modified Eagle Medium (DMEM) containing 10% fetal bovine serum (FBS)) was added. The collected cell suspension was filtered through an 80 μm cell sieve and then added to the Percoll cell separation solution (Sigma-Aldrich, St. Louis, MO, USA), centrifuged at 600 rcf for 30 min, and the white cell layer was collected. Then, anti-mouse CD45 magnetic beads and anti-mouse CD326 magnetic beads (BD, East Rutherford, NJ, USA) were used to sort and enrich the TECs. Finally, a CytoFLEX flow cytometer (Beckman Coulter Inc., Atlanta, GA, USA) was used to check the purity of the enriched cells.
2.3. Culture of the MTEC1 and HEK-293T Cells
The MTEC1 cells were donated by the Peking University Health Science Center (Beijing, China). The MTEC1 cells were cytologically identified as being as densely arranged as the epithelial cells. The immunohistochemical assay confirmed that the cytoplasm of the cells was rich in keratin. Electron microscopy identified the desmosomes between the cells, and the cytoplasm was found to have bundles of tonofilaments, with developed Golgi apparatuses, abundant mitochondria, rough endoplasmic reticula, and high electron-dense granules. This cell line was found to be positive for the rat anti-mouse thymic stromal antibody 33, which corresponded to the antibody 33-positive epithelial cells distributed in the medulla area identified by immunofluorescence staining of the mouse thymus section. Therefore, this cell line was derived from the epithelial cells in the medulla region of the thymus and had functions similar to the murine TECs [33]. The HEK-293T cells were acquired from the American Type Culture Collection (ATCC, Manassas, VA, USA) and all the cells were grown in DMEM supplemented with 10% FBS (Thermo Fisher Scientific, Waltham, MA, USA) in a humidified atmosphere of 37 °C and 5% CO2.
2.4. RT-qPCR Assays
The total RNA was extracted from the thymus or cells using Trizol reagent (Takara, Kusatsu, Japan), following the protocol. The RNA concentration and purity of each sample were quantified using a NanoDrop ND-2000 (NanoDrop Technologies, Bio Tek, Winooski, VT, USA) according to the following criteria: A260/A280 > 1.8; A260/A230 > 2.0. Then, cDNA was synthesized using the random primers or oligo (DT), following the instructions for the ReverTra Ace qPCR Kit (Toyobo, Osaka, Japan). Using the cDNA as a template, a quantitative reverse transcription polymerase chain reaction (RT-qPCR) was performed using SYBR Green real-time PCR Master Mix (Toyobo, Osaka, Japan). The reaction conditions were 5 min at 95 °C, followed by 40 amplification cycles of 10 s at 95 °C and 30 s at 60 °C. β-actin and U6 were used as the internal controls of mRNA and miRNA, respectively. The primer software Premier 5.0 (PREMIER Biosoft International, Palo Alto, CA, USA) was used to design the mRNA primers (Table 1), while the miRNA primers were designed according to instructions by RiboBio Co. (Guangzhou, China). Finally, the expression level was determined by the 2−ΔΔCT method.
2.5. Cell Viability Assay
The MTEC1 cells were inoculated in a 96-well plate at a density of 5 × 10³ cells/well and cultured at 37 °C in an incubator containing 5% CO2 for 12 h. Then, 50 nM miR-152-3p mimic, 100 nM miR-152-3p inhibitor, or mimic/inhibitor negative control (mimic/inhibitor-nc) (RiboBio, Guangzhou, China) were transfected into the MTEC1 cells using Lipofectamine 3000 (Invitrogen, Carlsbad, CA, USA), according to the manufacturer’s instructions. After 48 h of transfection, 10 µL CCK-8 (MedChemExpress, Monmouth, NJ, USA) was added to each well and reacted in an incubator containing 5% CO2 at 37 °C for 2 h. Subsequently, the absorbance of the MTEC1 cells plated in a 96-well plate was measured at OD450 nm using an automatic microplate reader (Thermo Fisher Scientific), and the influence of miR-152-3p expression on the viability of MTEC1 cells was analyzed.
2.6. Cell Proliferation Assay
The MTEC1 cells were inoculated into a 12-well plate at a confluence of 1 × 10⁵ cells per well and were transfected with miR-152-3p mimic, miR-152-3p inhibitor, and negative control according to the method mentioned above. After 48 h of culture, 500 μL of medium containing 50 μmol/L 5-ethynyl-2′-deoxyuridine (EdU) was added to each well. Subsequently, the transfected MTEC1 cells were fixed and stained according to the steps outlined for the EdU kit (RiboBio, Guangzhou, China). Cell fluorescence was collected and photographed using the Leica DM4000 B LED microscope (Leica Microsystems, Wetzlar, Germany).
2.7. Cell Cycle Assay
The MTEC1 cells were transfected with siRNA–Smad2 (siSmad2), miR-152-3p mimic, inhibitor, and negative control, and were, respectively, digested with 0.25% trypsin and collected in a 1.5 mL centrifuge tube. Then, 1 mL of 70% ethanol was added to each tube and fixed at 4 °C for 12 h. The supernatant was discarded after the solution was centrifuged at 1500 rpm for 5 min and the MTEC1 cells were washed twice with PBS. After that, 500 μL of propidium iodide (PI) staining solution was added to the tube and incubated at 37 °C in the dark for 30 min. Finally, the cell suspension was placed on a CytoFLEX flow cytometer (Beckman Coulter Inc., Atlanta, CA, USA) in a 1.5 mL centrifuge tube for detection, and the data were analyzed using ModFit software (Verity Software House, Topsham, ME, USA). This experiment was repeated three times.
2.8. Target Genes Prediction
Different prediction tools, including miRBase (https://mirbase.org (accessed on 12 March 2019)), TargetScan (https://www.targetscan.org (accessed on 12 March 2019)), and miRDB (https://mirdb.org (accessed on 12 March 2019)), were used for predicting the target genes of miR-152-3p. Then, the three predictions results were intersected to select the candidate target gene of miR-152-3p. The functions of candidate target genes were predicted according to the Gene Ontology (GO) database (http://geneontology.org (accessed on 18 March 2019)) and the Kyoto Encyclopedia of Genes and Genomes (KEGG) database (http://www.kegg.jp/kegg (accessed on 18 March 2019)). Finally, the candidate target genes related to the cell cycle and cell proliferation were selected for verification.
2.9. Dual-Luciferase Reporter Gene Assay
The targeted regulatory relationship between Smad2 and miR-152-3p was further determined by constructing the reporter gene plasmid of the target gene, Smad2. Specifically, the wild-type (WT) fragment of Smad2 3′ UTR was amplified using the primers containing the miR-152-3p and Smad2 binding site (Table 2). Then, the Smad2 3′ UTR mutant-type (MUT) fragment was synthesized by mutating 4 bases of the binding site using the Stratagene mutation kit (Stratagene, Heidelberg, Germany). Subsequently, these two fragments were connected to the luciferase reporter vector pmiRGLO (Promega, Madison, WI, USA) and the recombinant plasmids pmiRGLO–Smad2-3′ UTR-WT and pmiRGLO–Smad2-3′ UTR-MUT were constructed. The extracted recombinant plasmid was then co-transfected with the miR-152-3p mimic into the HEK-293T cells. After 48 h of transfection, the activity of luciferase was detected using a dual-luciferase detection kit (Promega, Madison, WI, USA).
2.10. Western Blot Analysis
The Western blot experiments were performed according to a previously published method [20]. Briefly, the total protein of the cells was extracted using RIPA lysis buffer (Sigma-Aldrich, St. Louis, MO, USA), and then the concentration of the protein samples was measured using a BCA kit (Thermo Fisher Scientific, Waltham, MA, USA). The denatured protein was continuously electrophoresed using an SDS-PAGE for 1 h. After transferring the protein from the gel to a PVDF membrane, skimmed milk powder was added and sealed at 25 °C for 1 h. After removing the blocking solution, the primary antibodies (mouse anti-SMAD2, mouse anti-C-MYC, mouse anti-β-ACTIN) were added and incubated overnight at 4 °C. The next day, the primary antibody was recovered, and the secondary antibody was added and incubated for 1 h at 37 °C. Finally, ECL chemiluminescence solution (Solarbio, Beijing, China) was added to the protein membranes away from the light, and the images were collected using the Tannon 5200 chemiluminescence analyzer (Tannon, Shanghai, China).
2.11. Statistical Analysis
The statistical software SPSS 17.0 (Chicago, IL, USA) was used for the analyses and the Student’s t-test and one-way analysis of variance (ANOVA) were used for comparison between the groups. The mean ± standard deviation (SD) was used to represent the data. A p < 0.05 was considered to be statistically significant. Here, *, **, ***, and **** represent p < 0.05, p < 0.01, p < 0.001, and p < 0.0001, respectively.
3. Results
3.1. The Expression of miR-152-3p in the Mice Thymus and TECs
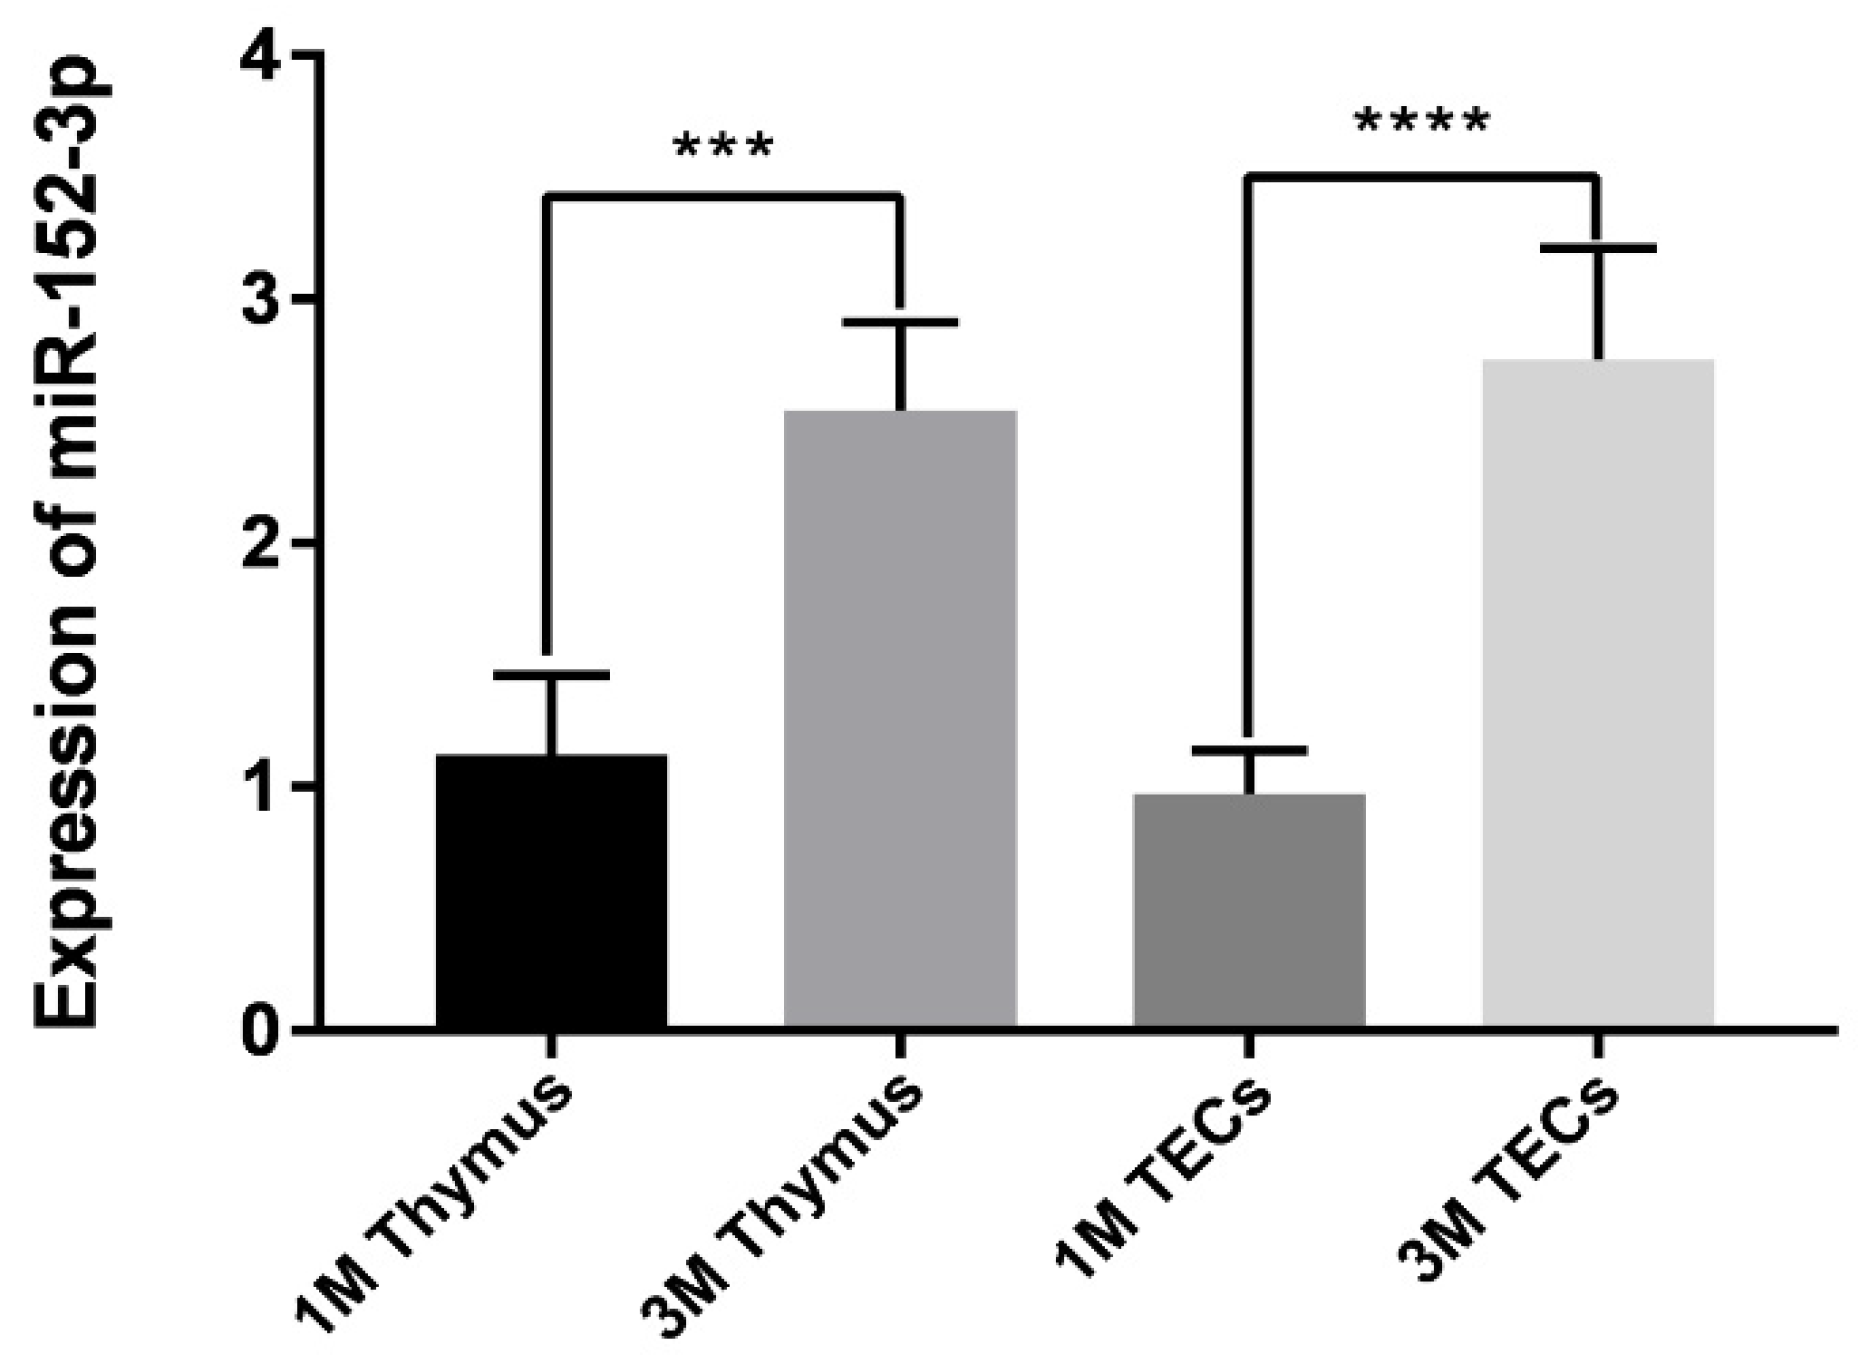
The expression of miR-152-3p in the isolated thymus and TECs from the 1 M and 3 M mice was detected using RT-qPCR. The results indicated the expression of miR-152-3p in the thymus tissues and TECs of the 3 M mice to be significantly higher than in the 1 M mice (Figure S1 and Figure 1). This finding was consistent with previous miRNA microarray and RNA-seq data [21,22,23,24], suggesting that miR-152-3p might be crucial for regulating age-related thymic involution.
3.2. miR-152-3p Inhibits the Viability and Proliferation of MTEC1 Cells
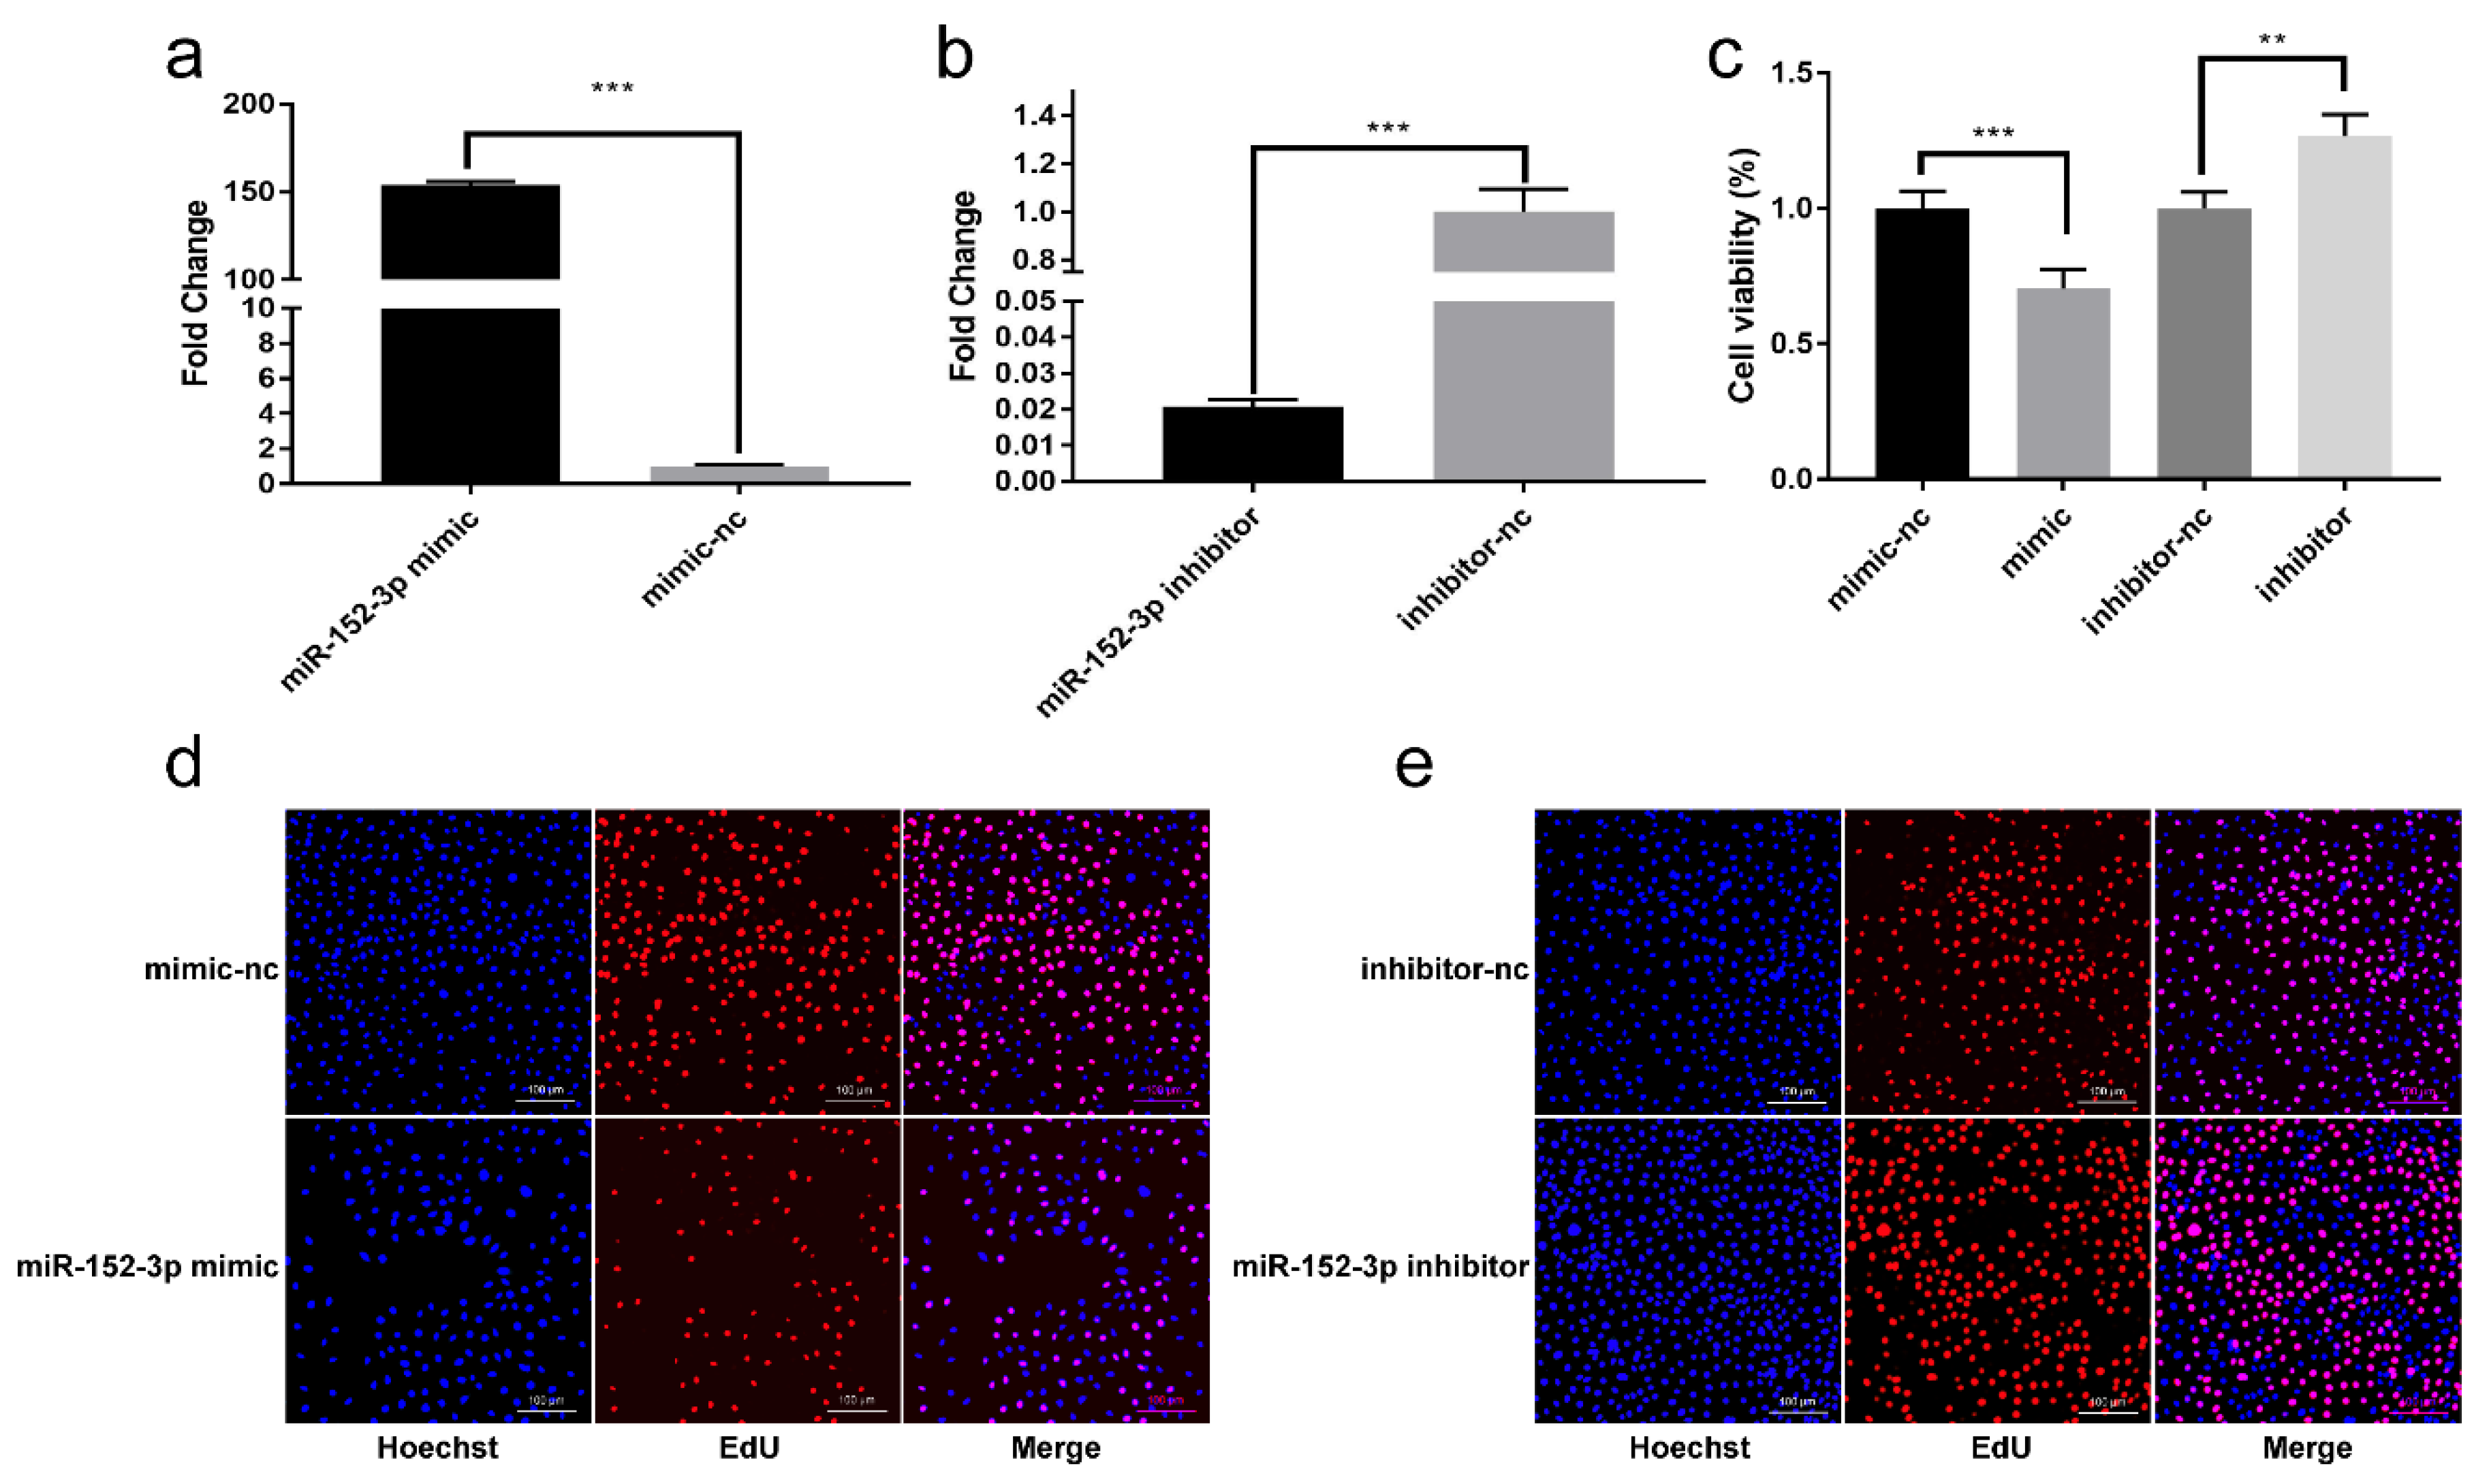
The function of miR-152-3p was studied using the miR-152-3p mimics and inhibitors for detecting its effects on the MTEC1 cells. The RT-qPCR results indicated a significant change in the expression of miR-152-3p in the MTEC1 cells due to the mimic and inhibitor of miR-152-3p, corroborating that miR-152-3p can be successfully transfected into MTEC1 cells (Figure 2a,b). CCK-8 detection revealed the viability of the MTEC1 cells to be significantly down-regulated when transfected with 50 nM of the miR-152-3p mimic, while the administration of 100 nM of the miR-152-3p inhibitor was found to increase the viability of the MTEC1 cells (Figure 2c). Furthermore, the EdU results demonstrated the numbers of fluorescently stained cells in the miR-152-3p mimic group to be lower than in the mimic-nc group (Figure 2d). Conversely, the numbers of fluorescent cells in the miR-152-3p inhibitor group were found to increase compared to the inhibitor-nc group (Figure 2e) (Tables S2–S6). These data confirmed that miR-152-3p overexpression can significantly inhibit MTEC1 cell proliferation.
3.3. miR-152-3p Represses the Cell Cycle of MTEC1 Cells
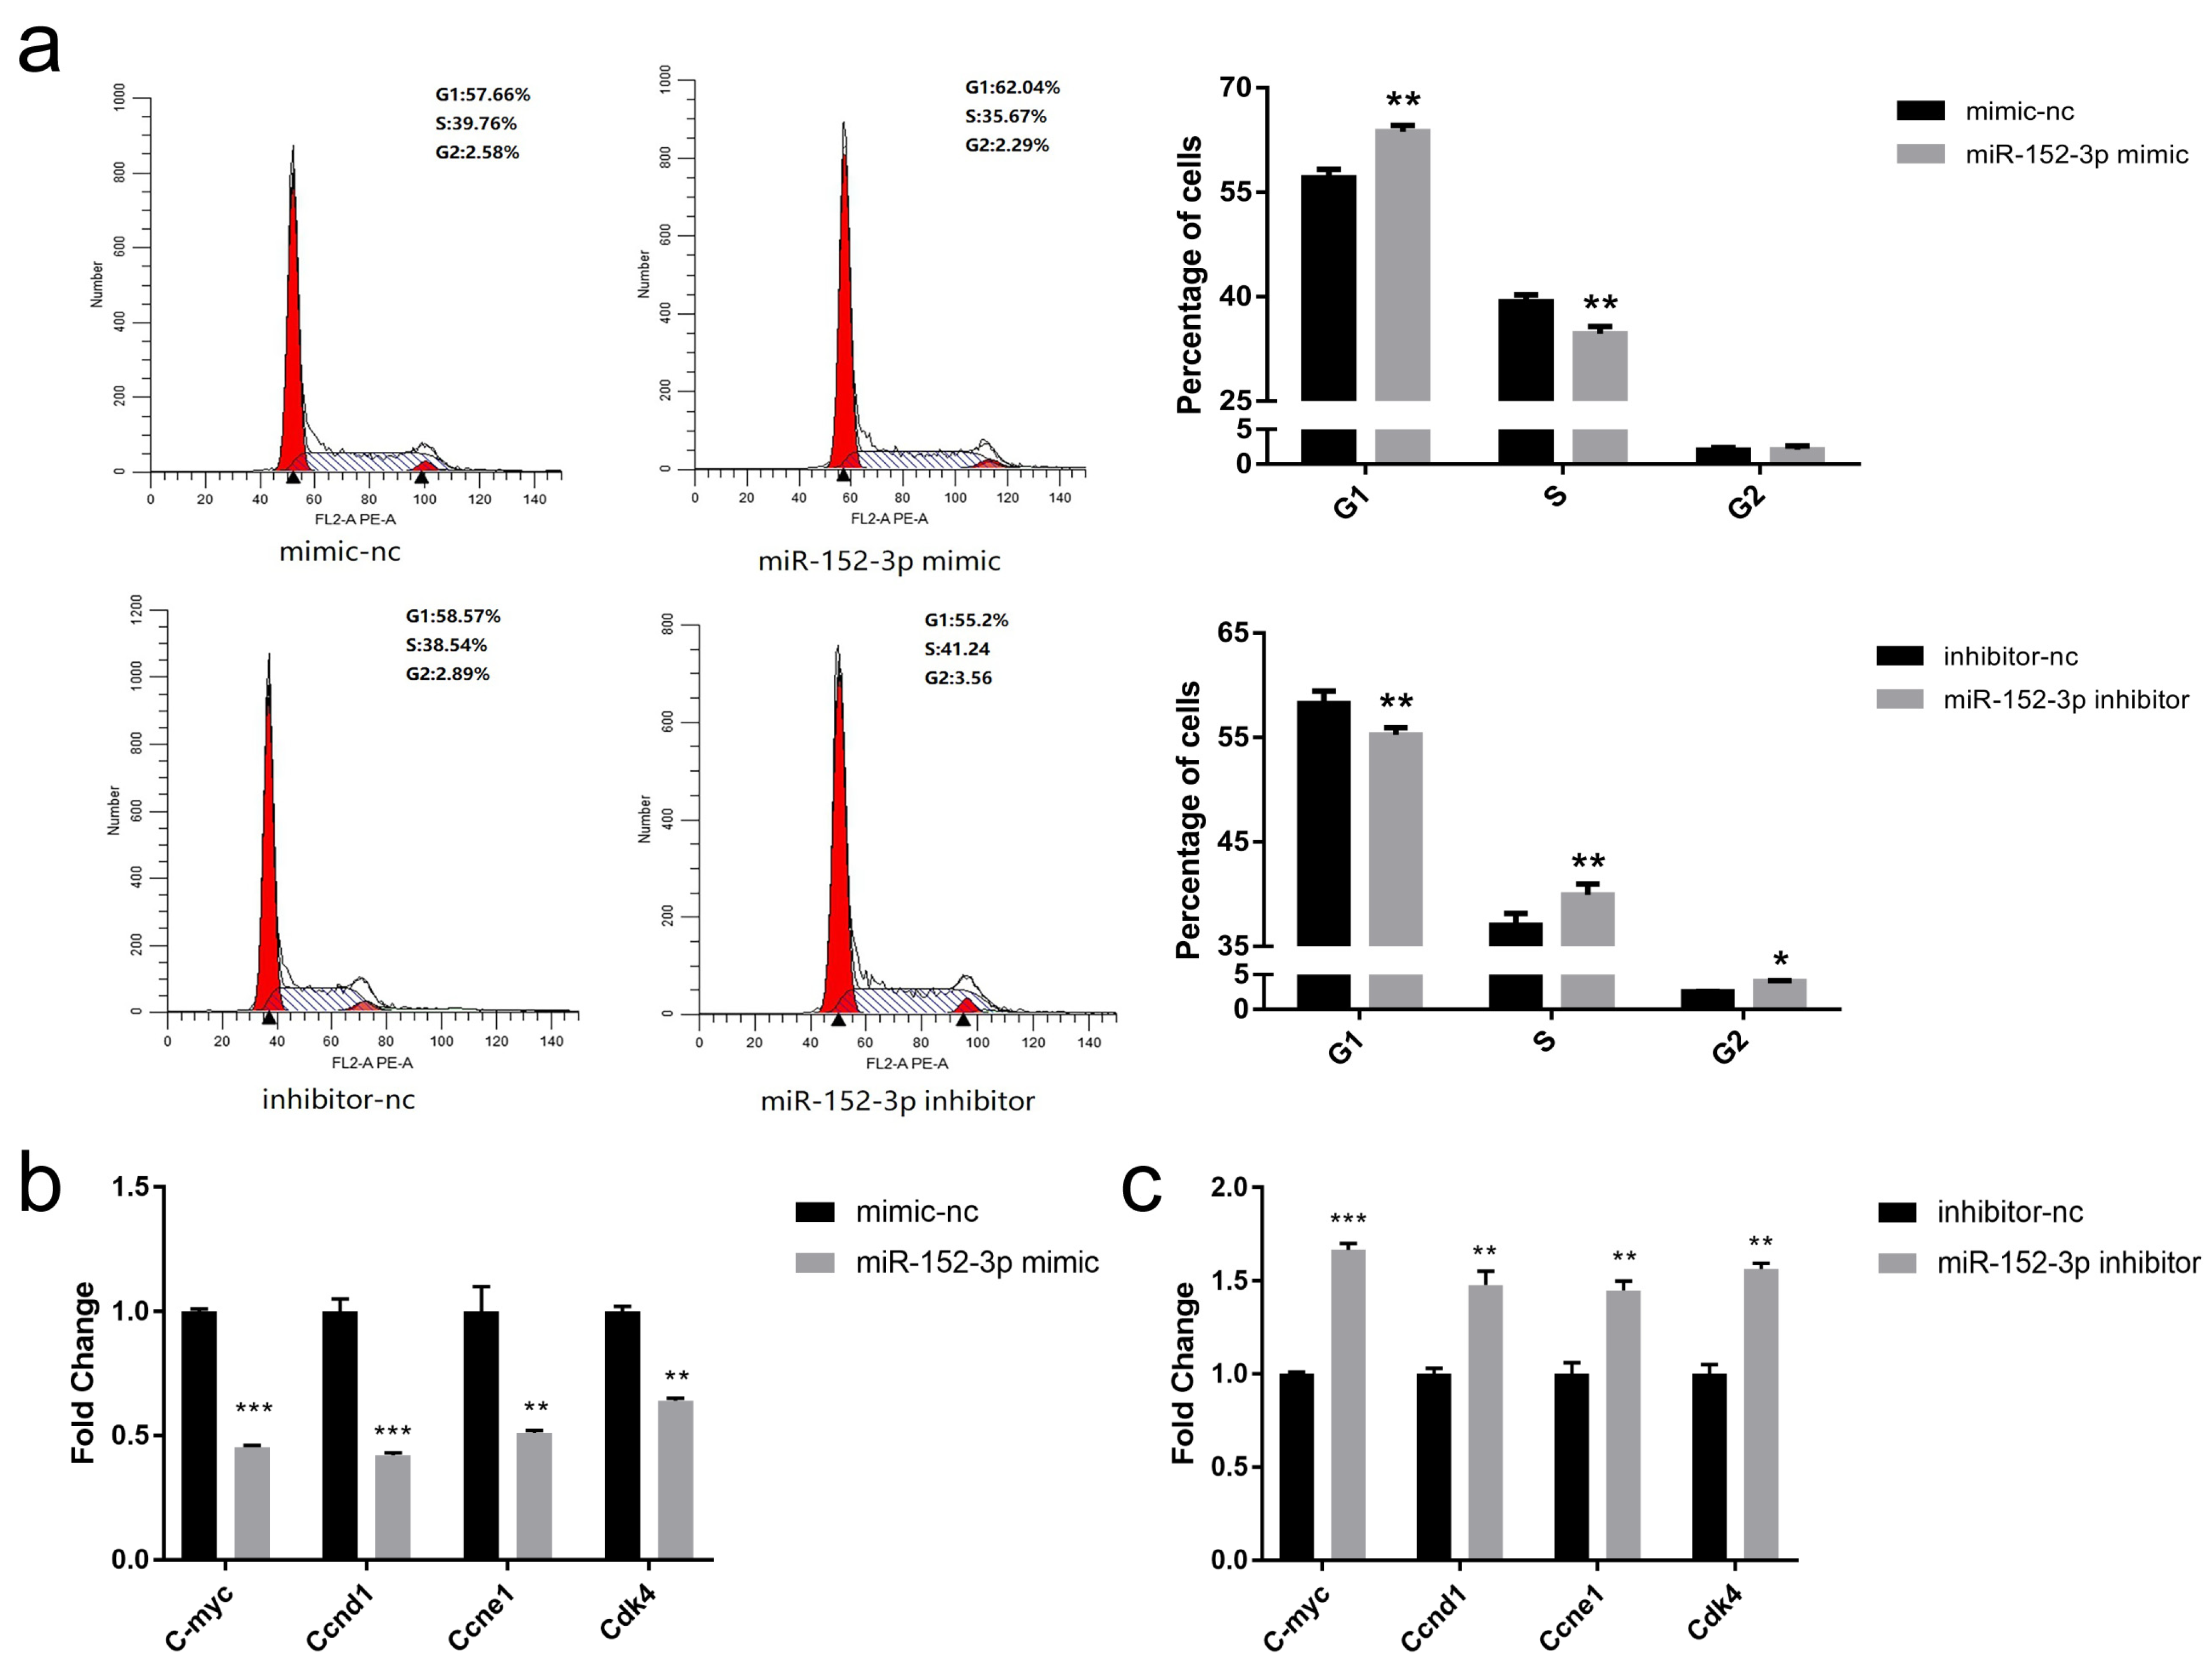
To explore the inhibitory effect of miR-152-3p on the proliferation of MTEC1 cells, the effect of miR-152-3p on the cell cycle was analyzed. After 48 h of transfection, the number of MTEC1 cells in the G1 phase of the miR-152-3p mimic group increased sharply compared to the mimic-nc group, and MTEC1 cell numbers were found to significantly decrease in the S phase. However, compared with the inhibitor-nc group, the miR-152-3p inhibitor group was found to have fewer MTEC1 cells in the G1 phase, and the cells in the S phase were found to increase (Figure 3a). The expression levels of cell cycle-related genes were further detected, as shown in Figure 3b, and the gene expression levels of C-myc, Ccnd1, Ccne1, and Cdk4 in the miR-152-3p mimic group were found to significantly decrease relative to those in the mimic-nc group. When the expression of miR-152-3p in the MTEC1 cells was inhibited, the gene expression levels of C-myc, Ccnd1, Ccne1, and Cdk4 were found to significantly increase (Figure 3c). These results suggest that miR-152-3p overexpression leads to G1 phase arrest and cell cycle inhibition, thereby inhibiting MTEC1 cell proliferation.
3.4. Putative Target Genes of miR-152-3p
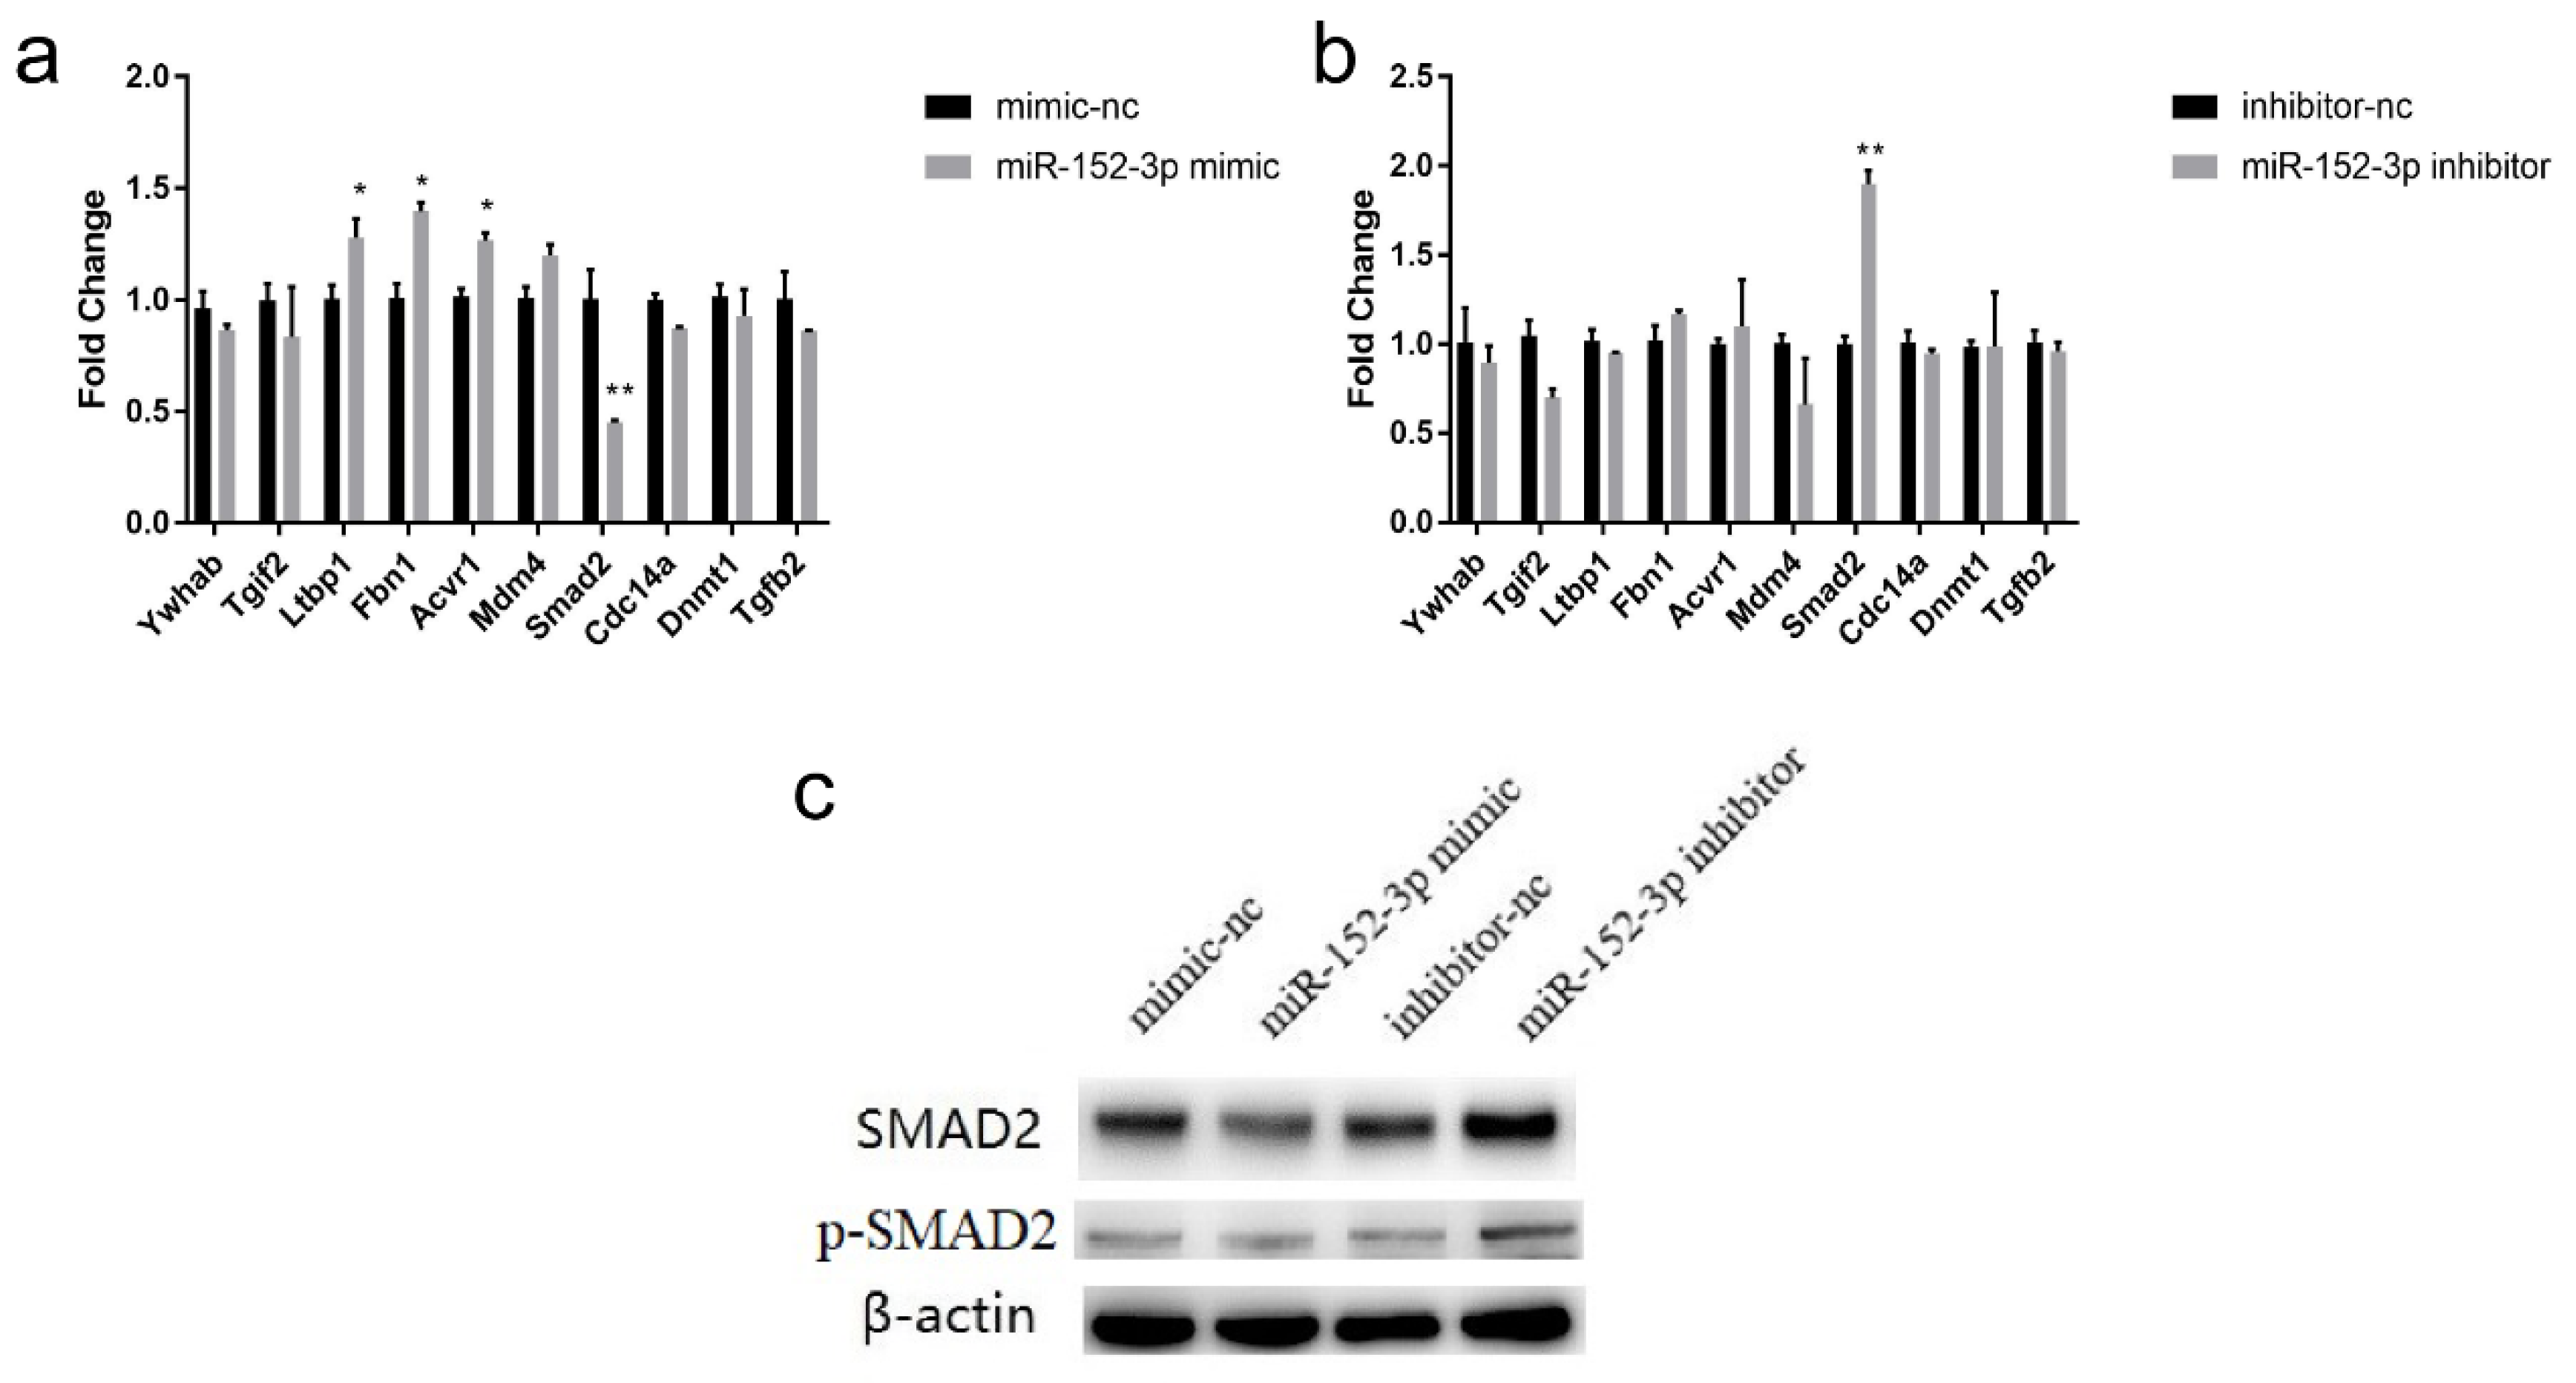
For identifying the mRNAs targeted by miR-152-3p, the GO and KEGG databases were analyzed for 344 predicted target genes from the intersection of different prediction websites, and 10 candidate genes (Ywhab, Tgif2, Ltbp1, Fbn1, Acvr1, Mdm4, Smad2, Cdc14a, Dnmt1, and Tgfb2) related to the cell cycle and cell proliferation were screened. Then, 10 candidate gene expression levels were detected in the MTEC1 cells transfected with the miR-152-3p mimic, mimic-nc, miR-152-3p inhibitor, and inhibitor-nc. Smad2 expression was significantly down-regulated in the miR-152-3p mimic group, while Ltbp1, Fbn1, and Acvr1 expressions were significantly up-regulated (Figure 4a). In contrast, Smad2 expression was significantly up-regulated in the miR-152-3p inhibitor group (Figure 4b). The Western blot results showed that the SMAD2 expression corresponded to the results of the RT-qPCR (Figure 4c and Figure S2a), collectively indicating that Smad2 may be a target gene of miR-152-3p.
3.5. Validation of the Target Gene Smad2
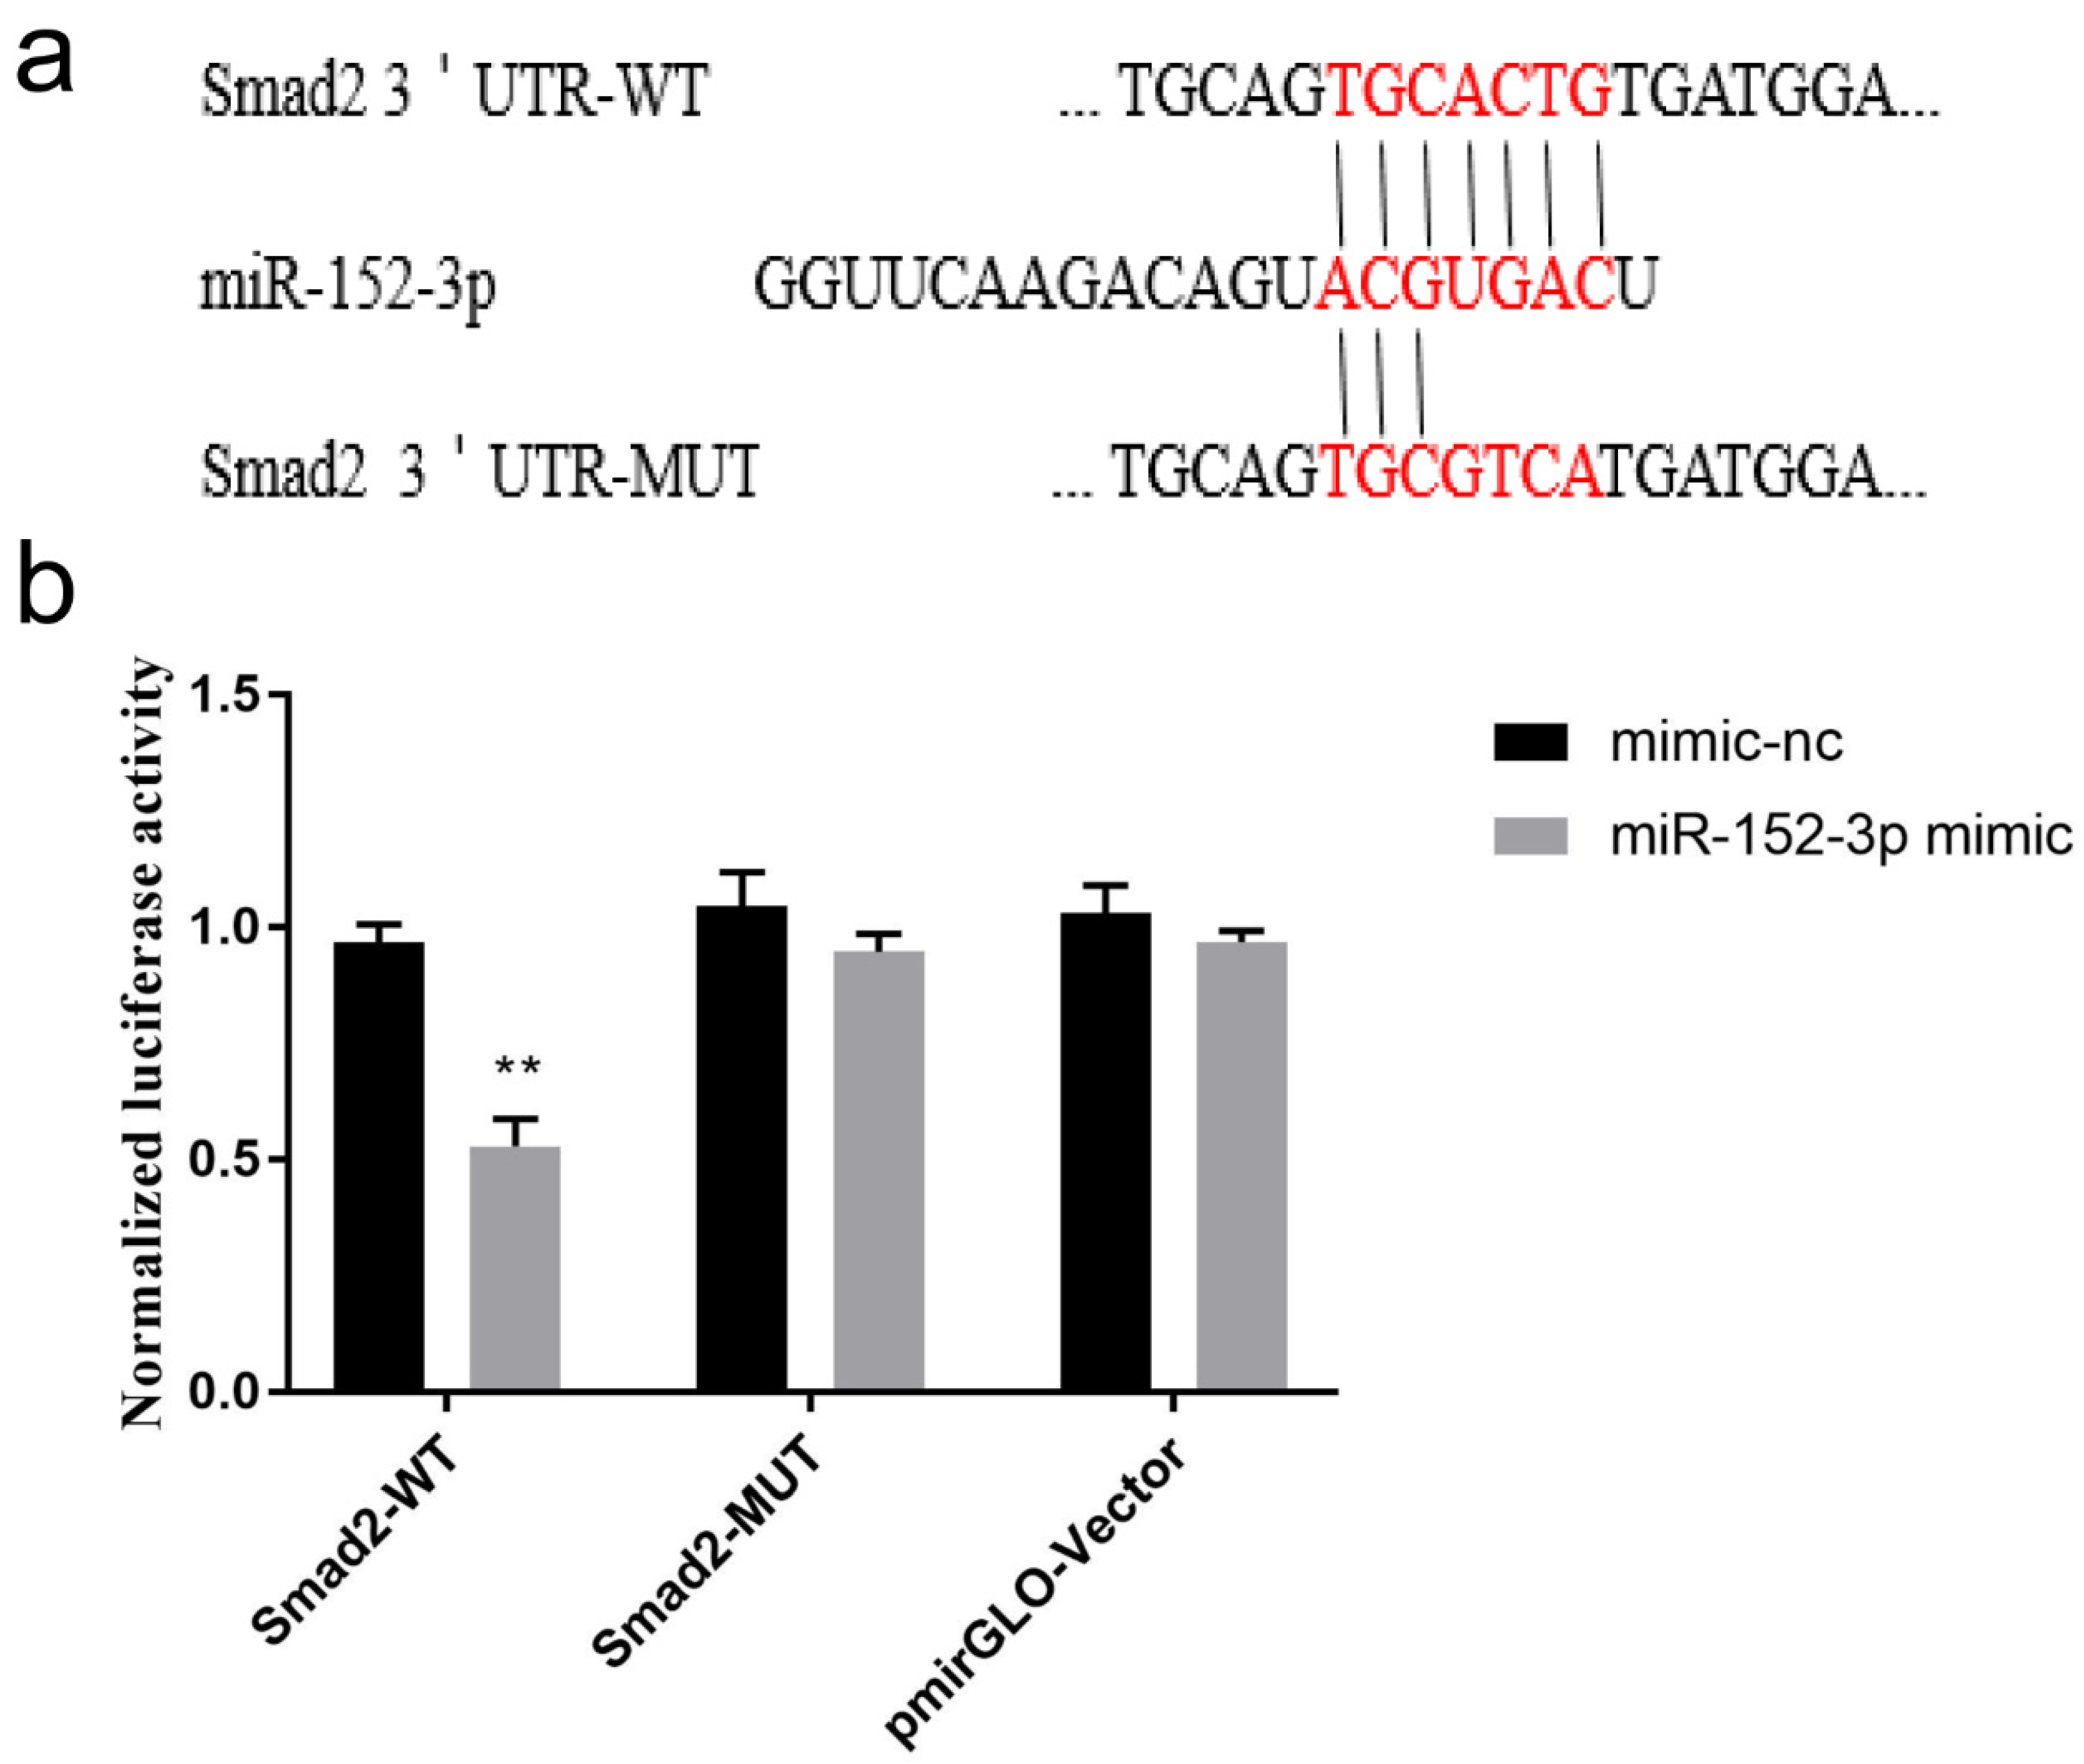
The miRNA target tool was used to determine the relationship between Smad2 and miR-152-3p, and this miRNA was found to directly bind to the 745–751 bp (UGCACUG) and 6263–6269 bp (UGCACUG) sites of Smad2 3′ UTR. As shown in Figure 5a, the two recombinant reporter plasmids of Smad2 containing WT and MUT, respectively, were designed. The miR-152-3p mimic and recombinant reporter plasmid were co-transfected into HEK-293T cells, and the luciferase activity of the pmirGLO–Smad2-3′ UTR-WT + miR-152-3p mimic group was found to be significantly lower than that of the pmirGLO–Smad2-3′ UTR-WT + mimic-nc group. However, the co-transfection group of pmirGLO–Smad2-3′ UTR-MUT + miR-152-3p mimic (Figure 5b) showed no significant change. These results showed that miR-152-3p could bind to the seed sequence of Smad2 3′ UTR, and Smad2 was the direct target gene regulated by miR-152-3p in the MTEC1 cells.
3.6. miR-152-3p Regulated the Proliferation of MTEC1 Cells by Targeting Smad2
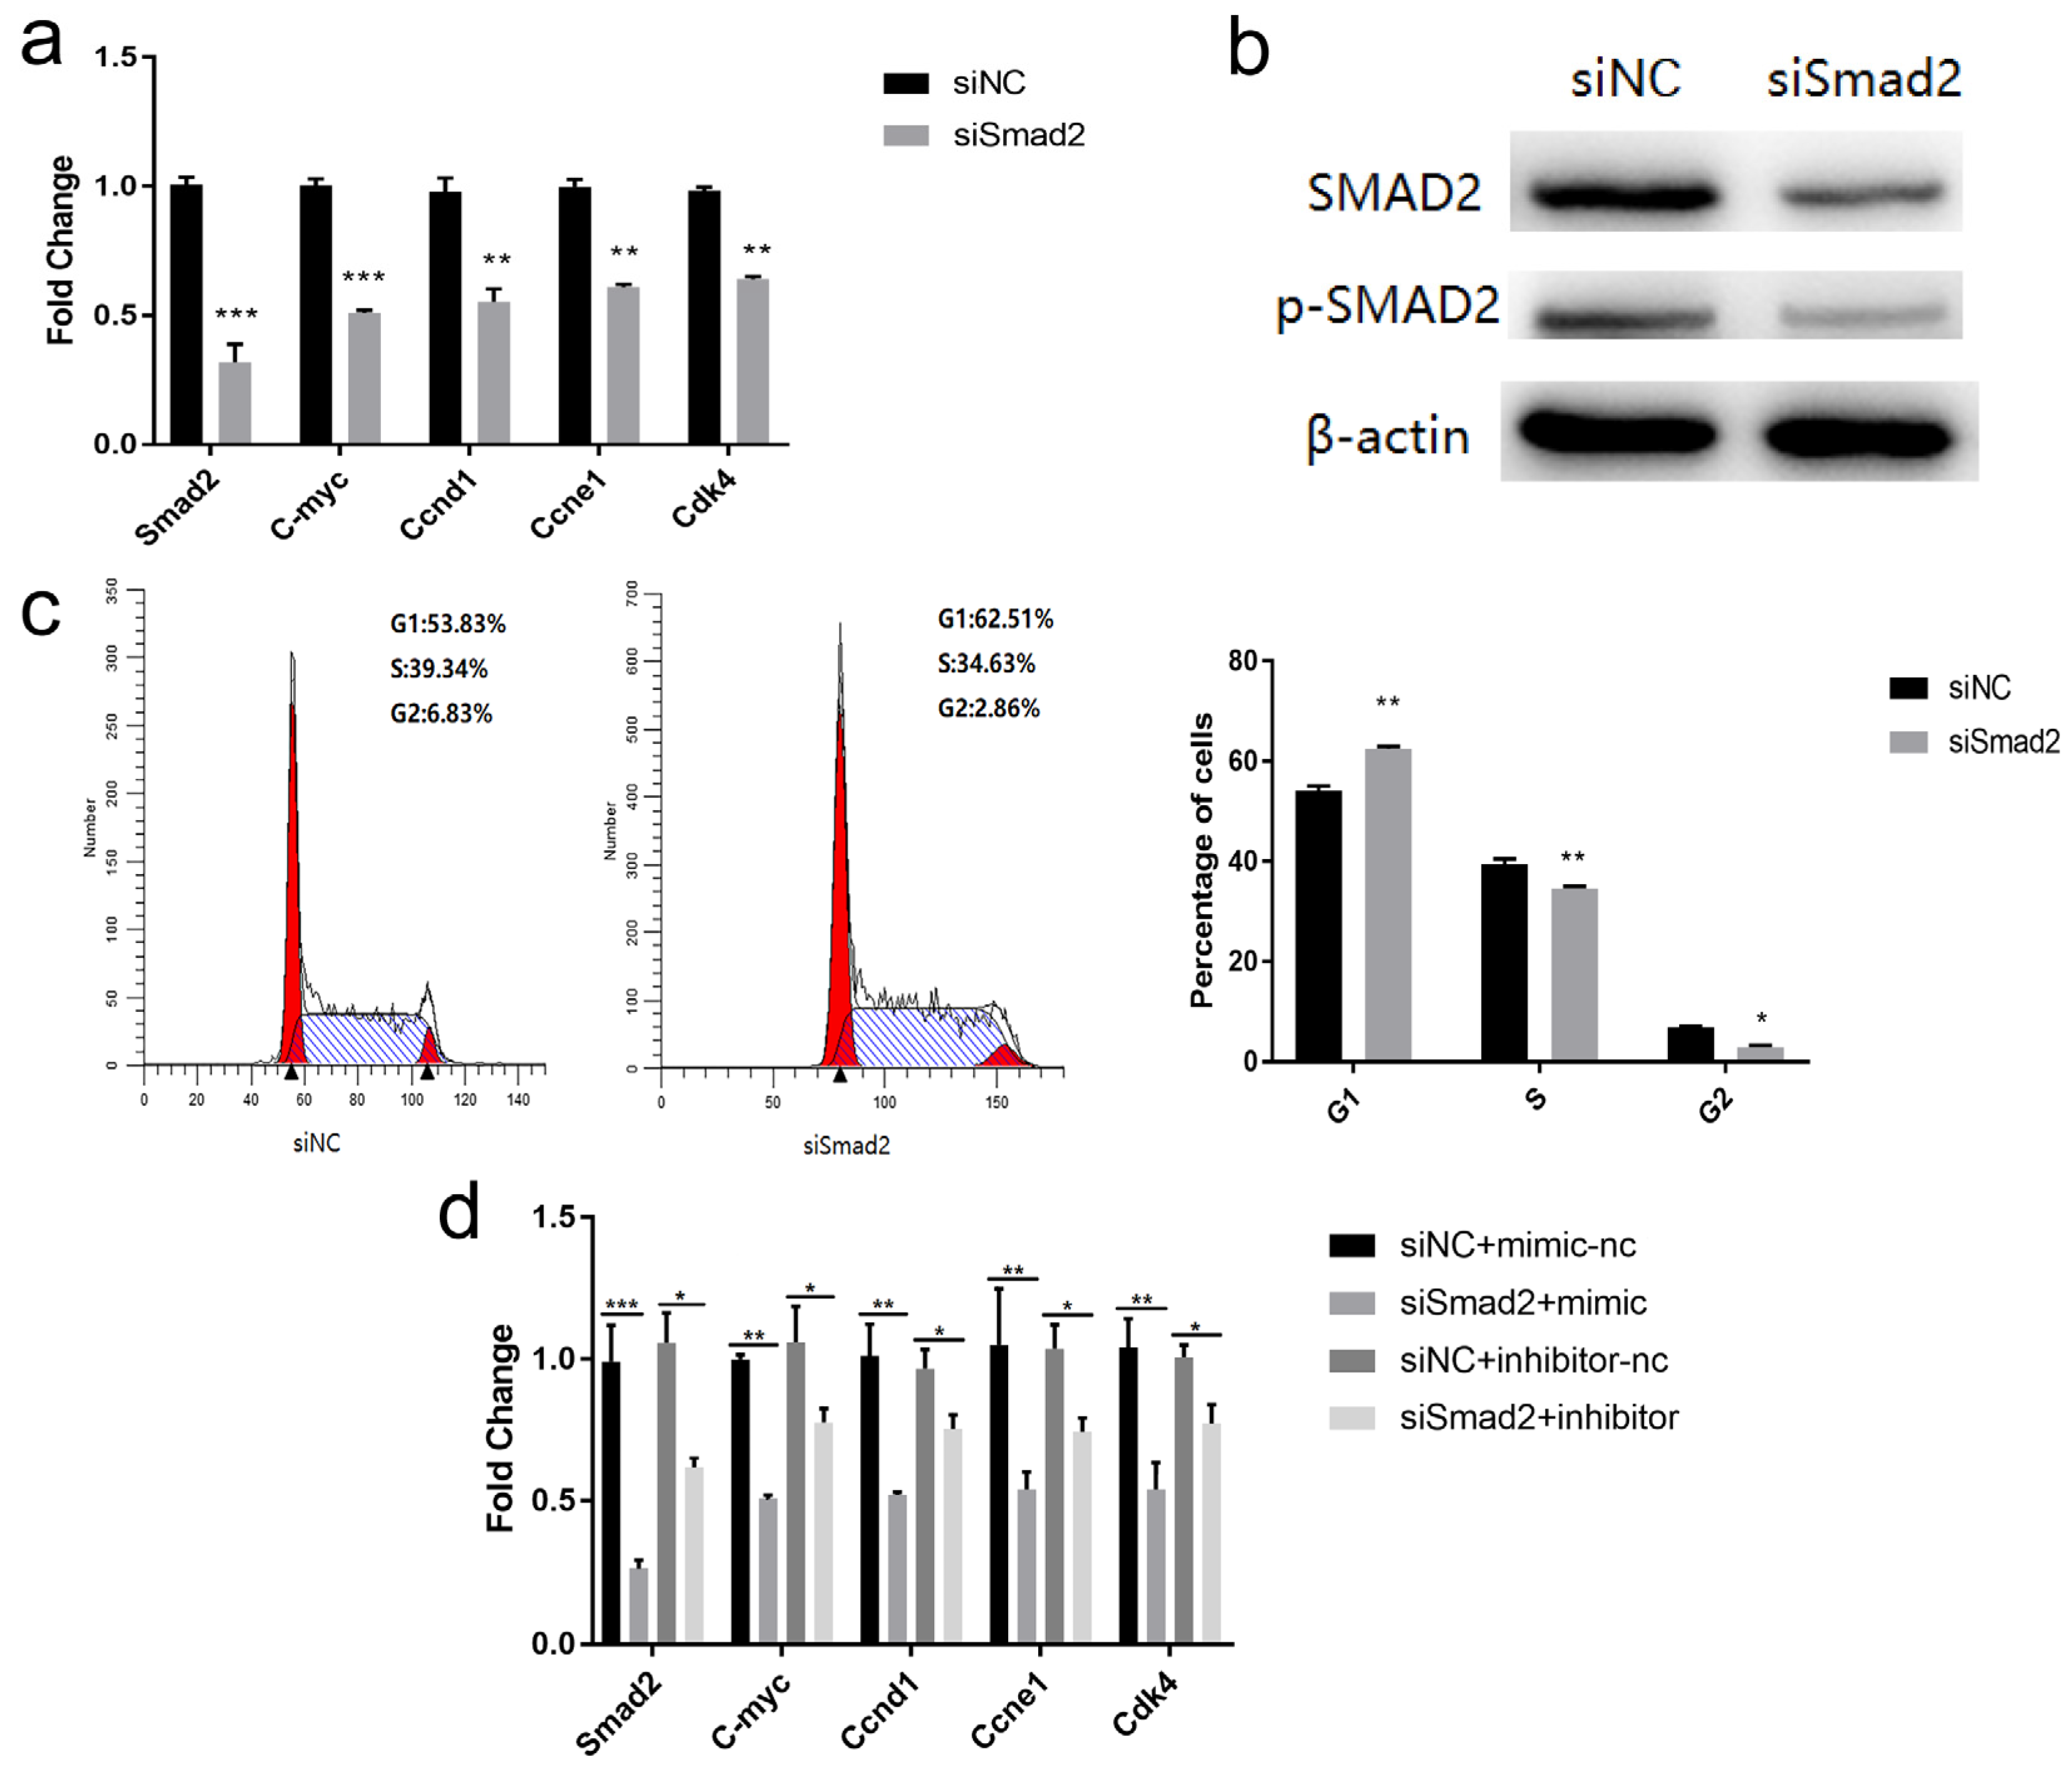
To explore the biological functions of Smad2, siSmad2 were transfected into the MTEC1 cells. The quantitative results revealed that the expression of Smad2 was suppressed, and the expression of C-myc, Ccnd1, Ccne1, and Cdk4, related to the cell cycle, was found to be significantly reduced (Figure 6a). In Figure 6b, the SMAD2 protein in the siSmad2 group decreased compared to the control (Figure S2b). The flow cytometry study verified that after transfection of siSmad2, cell number in the G1 phase increased significantly, and the cellular population in the S phase and G2 phase decreased significantly (Figure 6c). These results were consistent with the results of miR-152-3p overexpression. Subsequently, siSmad2 and miR-152-3p mimics/inhibitors were co-transfected into the MTEC1 cells. The mRNA expression of Smad2, C-myc, Ccnd1, Ccne1, and Cdk4 in the siSmad2 + mimic group was found to be significantly reduced compared to the siNC + mimic-nc group. A similar trend was observed in the siSmad2 + inhibitor group (Figure 6d). These results indicated that miR-152-3p affects cell cycle progression by targeting Smad2, thereby regulating the proliferation of MTEC1 cells.
4. Discussion
MicroRNAs critically regulate a series of developmental and physiological pathways, including cell proliferation, differentiation, and apoptosis. In addition, miRNAs take part in constructing the thymus microenvironment, affecting the development, maturation, and involution of the thymus [15,34,35]. When the differential expression profiles of the thymus and TECs were analyzed in the 1 M and 3 M mice, miR-152-3p was found to be highly expressed in the 3M group. In our study, we confirmed that miR-152-3p expression was elevated in age-related thymic involution. miR-152-3p is reportedly related to the proliferation of a variety of cells. For instance, miR-152-3p can promote cell proliferation and invasion in the keloid fibroblasts by targeting Foxf1 [36]. Furthermore, miR-152-3p has been identified in multiple studies as being involved in regulating the occurrence and development of cancer. For example, Yin et al. [37] proved that miR-152-3p can target Cdk8 to inhibit the occurrence of liver cancer. In 2020, Zhu et al. [38] reported that miR-152-3p inhibition or overexpression of KLF4 could reduce the expression of Ifitm3 in colon cancer cells, weakening the ability of the cancer cells to proliferate. However, so far, no studies have reported the regulation of proliferation of TECs by miR-152-3p. This study used mouse MTEC1 cells and showed that over-expression of miR-152-3p in MTEC1 cells could significantly reduce cell viability, blocking the G1 phase and inhibiting cell proliferation, while inhibiting miR-152-3p expression had the opposite effect. These data indicated that miR-152-3p could regulate the cell cycle and affect the proliferation of MTEC1 cells. To further study its mechanism, Smad2 was predicted to be the target gene of miR-152-3p based on the negative regulation characteristics of miRNA on the target genes.
The SMAD protein has three domains: the N-terminal Mad Homology 1, C-terminal Mad Homology 2, and the linking region. The N-terminal domain recognizes the specific DNA sequences, while the C-terminal domain accounts for the protein–protein interactions [39]. The SMAD2 protein links comprise multiple phosphorylation sites that can be phosphorylated by the different kinases to execute different functions and participate in regulating the TGF-signaling pathways. For example, when the Smad2/3–SMAD4 complex translocates into the nucleus, the phosphorylation site of Smad2/3 is phosphorylated by CDK8 and CDK9, combining Smad2/3 with the other transcription cofactors to improve transcriptional activity [40]. On the other hand, the Smad2/3 phosphorylation sites can be phosphorylated by GSK3, enabling the E3 ubiquitin ligase NeDD4-L to recognize Smad2/3, promoting its degradation and inhibiting the TGF-β signaling pathway [41]. SMAD2 is a downstream protein in the transforming growth factor signaling pathway, responsible for regulating multiple signals, such as proliferation, apoptosis, and differentiation. Studies have found that LNC-LFAR1 expression inhibition can inhibit bile duct cancer cell proliferation, migration, and invasion, and reduce the expression of Vimentin, Tgf-β1, Smad2, and Smad4 [42]. Furthermore, the increase in Tgf-β1 and decrease in Smad2 in the non-T cells of the mouse thymus after burn injury suggested that TECs might account for increased thymic apoptosis [43]. However, it has not been reported whether miR-152-3p regulates cell proliferation by targeting Smad2 in TECs. In our study, the dual-luciferase experiment demonstrated that miR-152-3p is targeted to bind Smad2, inhibiting its expression. Furthermore, up-regulation of miR-152-3p in MTEC1 cells could induce G1 arrest by targeting Smad2. Conversely, down-regulation of miR-152-3p could promote the proliferation and cell cycle progression of MTEC1 cells. Our results verified that the proliferation of TECs is negatively regulated by miR-152-3p via the targeting of Smad2. In addition, miR-152-3p overexpression or suppression of Smad2 was also confirmed to inhibit the expression of C-myc, triggering G1 phase arrest. This corroborates previous reports stating that C-myc participates in cell proliferation by regulating G1-related genes and protein kinases [44]. Smad2 acts upstream of C-myc in the cell cycle pathway; hence, Smad2 inhibition can reduce the expression of C-myc. Therefore, miR-152-3p can be speculated to indirectly regulate C-myc in inhibiting MTEC1 cellular proliferation. However, the detailed mechanism of miR-152-3p in regulating the cell cycle and cell proliferation remains to be further investigated.
5. Conclusions
Our study proved that miR-152-3p is an important regulatory molecule in thymic involution. miR-152-3p can inhibit the proliferation of TECs cells by targeting the 3′ UTR of Smad2. The cell cycle signaling pathway regulated by Smad2 is crucial for miR-152-3p to regulate the proliferation of TECs. Although there are no further studies to identify other direct targets of miR-152-3p, our experiments preliminarily suggest that up-regulation of miR-152-3p can be used as a potential biomarker in age-related thymic involution.
Supplementary Materials
The following supporting information can be downloaded at: https://www.mdpi.com/article/10.3390/genes13040576/s1, Figure S1: The purity of enriched TECs was detected by flow cytometry, Figure S2: Grayscale analysis of WB bands, Table S1: Expression levels of miR-152-3p in sequencing data, Tables S2–S5: List of proliferating cells in the merge picture of the mimic-nc/miR-152-3p mimic/inhibitor-nc/miR-152-3p inhibitor group, Table S6: Summary of the number of proliferating cells in each group, Data S1: Effects of overexpression or inhibition of miR-152-3p on cell cycle progression in MTEC1 cells, Data S2: Effect of silencing Smad2 on cell cycle progression of MTEC1 cells.
Author Contributions
Conceptualization, Y.L. (Ying Li) and Y.L. (Yugu Li); data curation, B.G.; formal analysis, L.Y.; funding acquisition, Y.L. (Yugu Li); investigation, Q.W. and K.Z.; methodology, X.W.; project administration, Y.L. (Yugu Li); resources, Y.L. (Yugu Li); software, Y.L. (Ying Li) and X.W.; supervision, Y.M. and Y.L. (Yugu Li); validation, Y.L. (Ying Li), X.W. and F.L.; visualization, X.W. and Q.W.; writing—original draft preparation, Y.L. (Ying Li) and X.W.; writing—review and editing, Y.L. (Ying Li) and Y.L. (Yugu Li). All authors have read and agreed to the published version of the manuscript.
Funding
This research was funded by the Guangdong Basic and Applied Basic Research Foundation (No. 2019B1515210011) and the National Natural Scientific Foundation of China (No. 31572475).
Institutional Review Board Statement
All the animal experiments in this study were conducted according to the protocol approved by the Animal Protection Committee of South China Agricultural University (Guangzhou, China).
Data Availability Statement
Raw data on the cell cycle of this study are available in Supplementary Materials. Other data reported in this study are available from the corresponding author upon reasonable request.
Conflicts of Interest
The authors have no competing interest to declare.
References
- Wang, H.; Pan, W.; Zheng, L.; Zhong, X.-P.; Tan, L.; Liang, Z.; He, J.; Feng, P.; Zhao, Y.; Qiu, Y.-R. Thymic Epithelial Cells Contribute to Thymopoiesis and T Cell Development. Front. Immunol. 2020, 10, 3099. [Google Scholar] [CrossRef] [PubMed]
- Palmer, D.B. The effect of age on thymic function. Front. Immunol. 2013, 4, 316. [Google Scholar] [CrossRef] [PubMed] [Green Version]
- Akha, A.A.S. Aging and the immune system: An overview. J. Immunol. Methods 2018, 463, 21–26. [Google Scholar] [CrossRef] [PubMed]
- Gui, J.; Morales, A.J.; Maxey, S.E.; Bessette, K.A.; Ratcliffe, N.R.; Kelly, J.A.; Craig, R.W. MCL1 increases primitive thymocyte viability in female mice and promotes thymic expansion into adulthood. Int. Immunol. 2011, 23, 647–659. [Google Scholar] [CrossRef] [PubMed] [Green Version]
- Gui, J.; Mustachio, L.M.; Su, D.-M.; Craig, R.W. Thymus Size and Age-related Thymic Involution: Early Programming, Sexual Dimorphism, Progenitors and Stroma. Aging Dis. 2012, 3, 280–290. [Google Scholar]
- Gui, J.; Zhu, X.; Dohkan, J.; Cheng, L.; Barnes, P.F.; Su, D.-M. The aged thymus shows normal recruitment of lymphohematopoietic progenitors but has defects in thymic epithelial cells. Int. Immunol. 2007, 19, 1201–1211. [Google Scholar] [CrossRef] [Green Version]
- Sun, L.; Guo, J.; Brown, R.; Amagai, T.; Zhao, Y.; Su, D.-M. Declining expression of a single epithelial cell-autonomous gene accelerates age-related thymic involution. Aging Cell 2010, 9, 347–357. [Google Scholar] [CrossRef] [Green Version]
- Zook, E.C.; Krishack, P.A.; Zhang, S.; Zeleznik-Le, N.J.; Firulli, A.B.; Witte, P.L.; Le, P.T. Overexpression of Foxn1 attenuates age-associated thymic involution and prevents the expansion of peripheral CD4 memory T cells. Blood 2011, 118, 5723–5731. [Google Scholar] [CrossRef] [Green Version]
- Garfin, P.M.; Min, D.; Bryson, J.L.; Serwold, T.; Edris, B.; Blackburn, C.; Richie, E.; Weinberg, K.I.; Manley, N.R.; Sage, J.; et al. Inactivation of the RB family prevents thymus involution and promotes thymic function by direct control of Foxn1 expression. J. Exp. Med. 2013, 210, 1087–1097. [Google Scholar] [CrossRef] [Green Version]
- Odaka, C.; Hauri-Hohl, M.; Takizawa, K.; Nishikawa, Y.; Yano, M.; Matsumoto, M.; Boyd, R.; Holländer, G.A. TGF-β type II receptor expression in thymic epithelial cells inhibits the development of Hassall’s corpuscles in mice. Int. Immunol. 2013, 25, 633–642. [Google Scholar] [CrossRef] [Green Version]
- Ambros, V. The functions of animal microRNAs. Nature 2004, 431, 350–355. [Google Scholar] [CrossRef] [PubMed]
- Bartel, D.P. MicroRNAs: Genomics, Biogenesis, Mechanism, and Function. Cell 2004, 116, 281–297. [Google Scholar] [CrossRef] [Green Version]
- John, B.; Enright, A.; Aravin, A.; Tuschl, T.; Sander, C.; Marks, D.S. Human MicroRNA Targets. PLoS Biol. 2004, 2, e363. [Google Scholar] [CrossRef] [PubMed] [Green Version]
- Liu, X.; Fortin, K.; Mourelatos, Z. MicroRNAs: Biogenesis and Molecular Functions. Brain Pathol. 2008, 18, 113–121. [Google Scholar] [CrossRef]
- Xu, M.; Gan, T.; Ning, H.; Wang, L. MicroRNA Functions in Thymic Biology: Thymic Development and Involution. Front. Immunol. 2018, 9, 2063. [Google Scholar] [CrossRef] [PubMed]
- Papadopoulou, A.S.; Dooley, J.; Linterman, M.; Pierson, W.; Ucar, O.; Kyewski, B.; Zuklys, S.; A Hollander, G.; Matthys, P.; Gray, D.; et al. The thymic epithelial microRNA network elevates the threshold for infection-associated thymic involution via miR-29a mediated suppression of the IFN-α receptor. Nat. Immunol. 2011, 13, 181–187. [Google Scholar] [CrossRef] [Green Version]
- Guo, D.; Ye, Y.; Qi, J.; Zhang, L.; Xu, L.; Tan, X.; Yu, X.; Liu, Q.; Liu, J.; Zhang, Y.; et al. MicroRNA-181a-5p enhances cell proliferation in medullary thymic epithelial cells via regulating TGF-β signaling. Acta Biochim. Biophys. Sin. 2016, 48, 840–849. [Google Scholar] [CrossRef] [Green Version]
- Guo, D.; Ye, Y.; Qi, J.; Xu, L.; Zhang, L.; Tan, X.; Tan, Z.; Yu, X.; Zhang, Y.; Ma, Y.; et al. MicroRNA-195a-5p inhibits mouse medullary thymic epithelial cells proliferation by directly targeting Smad7. Acta Biochim. Biophys. Sin. 2016, 48, 290–297. [Google Scholar] [CrossRef] [Green Version]
- Gong, B.; Wang, X.; Li, B.; Li, Y.; Lu, R.; Zhang, K.; Li, B.; Ma, Y.; Li, Y. miR-205-5p inhibits thymic epithelial cell proliferation via FA2H-TFAP2A feedback regulation in age-associated thymus involution. Mol. Immunol. 2020, 122, 173–185. [Google Scholar] [CrossRef]
- Wang, X.; Li, Y.; Gong, B.; Zhang, K.; Ma, Y.; Li, Y. miR-199b-5p enhances the proliferation of medullary thymic epithelial cells via regulating Wnt signaling by targeting Fzd6. Acta Biochim. Biophys. Sin. 2020, 53, 36–45. [Google Scholar] [CrossRef]
- Ye, Y.; Li, D.; Ouyang, D.; Deng, L.; Zhang, Y.; Ma, Y.; Li, Y. MicroRNA expression in the aging mouse thymus. Gene 2014, 547, 218–225. [Google Scholar] [CrossRef] [PubMed]
- Guo, D.; Ye, Y.; Qi, J.; Tan, X.; Zhang, Y.; Ma, Y.; Li, Y. Age and sex differences in microRNAs expression during the process of thymus aging. Acta Biochim. Biophys. Sin. 2017, 49, 409–419. [Google Scholar] [CrossRef] [PubMed] [Green Version]
- Jia, H.-L.; Zeng, X.-Q.; Huang, F.; Liu, Y.-M.; Gong, B.-S.; Zhang, K.-Z.; Zeng, J.-H.; Guo, D.-G.; Wang, Z.-Y.; Li, Y.-G. Integrated microRNA and mRNA sequencing analysis of age-related changes to mouse thymic epithelial cells. IUBMB Life 2018, 70, 678–690. [Google Scholar] [CrossRef] [PubMed] [Green Version]
- Li, B.; Zhang, K.; Ye, Y.; Xing, J.; Wu, Y.; Ma, Y.; Li, Y. Effects of Castration on miRNA, lncRNA, and mRNA Profiles in Mice Thymus. Genes 2020, 11, 147. [Google Scholar] [CrossRef] [PubMed] [Green Version]
- Kamato, D.; Burch, M.L.; Piva, T.J.; Rezaei, H.B.; Rostam, M.A.; Xu, S.; Zheng, W.; Little, P.J.; Osman, N. Transforming growth factor-β signalling: Role and consequences of Smad linker region phosphorylation. Cell. Signal. 2013, 25, 2017–2024. [Google Scholar] [CrossRef]
- Chen, T.; Li, J.; Liu, J.; Li, N.; Wang, S.; Liu, H.; Zeng, M.; Zhang, Y.; Bu, P. Activation of SIRT3 by resveratrol ameliorates cardiac fibrosis and improves cardiac function via the TGF-β/Smad3 pathway. Am. J. Physiol. Circ. Physiol. 2015, 308, H424–H434. [Google Scholar] [CrossRef]
- Li, F.; Luo, J.; Wu, Z.; Xiao, T.; Zeng, O.; Li, L.; Li, Y.; Yang, J. Hydrogen sulfide exhibits cardioprotective effects by decreasing endoplasmic reticulum stress in a diabetic cardiomyopathy rat model. Mol. Med. Rep. 2016, 14, 865–873. [Google Scholar] [CrossRef] [Green Version]
- Yu, Y.; Ran, Q. Nuclear SMAD2 Restrains Proliferation of Glioblastoma. Cell. Physiol. Biochem. 2015, 35, 1756–1763. [Google Scholar] [CrossRef]
- Xu, F.; Zhou, D.; Meng, X.; Wang, X.; Liu, C.; Huang, C.; Li, J.; Zhang, L. Smad2 increases the apoptosis of activated human hepatic stellate cells induced by TRAIL. Int. Immunopharmacol. 2016, 32, 76–86. [Google Scholar] [CrossRef]
- Lin, Y.; Tian, G.; Zhang, H.; Yuan, W.; Xie, Y.; Yang, Y.; Wang, J.; Liang, Y. Long non-coding RNA SNHG16 regulates human aortic smooth muscle cell proliferation and migration via sponging miR-205 and modulating Smad2. J. Cell. Mol. Med. 2019, 23, 6919–6929. [Google Scholar] [CrossRef] [Green Version]
- Lamarche, É.; AlSudais, H.; Rajgara, R.; Fu, D.; Omaiche, S.; Wiper-Bergeron, N. SMAD2 promotes myogenin expression and terminal myogenic differentiation. Development 2021, 148, dev195495. [Google Scholar] [CrossRef] [PubMed]
- Guo, Z.; Chi, F.; Song, Y.; Wang, C.; Yu, R.; Wei, T.; Gui, J.; Zhu, X. Transcriptome analysis of murine thymic epithelial cells reveals age-associated changes in microRNA expression. Int. J. Mol. Med. 2013, 32, 835–842. [Google Scholar] [CrossRef] [PubMed] [Green Version]
- Wu, J.; Zhang, L.; Fu, A.; Chen, W. Cytological identification of the murine MTEC1 thymus epithelial cell line. ACTA Anat. Sin. 1990, 21, 408–410, 463. (In Chinese) [Google Scholar]
- Xu, M.; Sizova, O.; Wang, L.; Su, D.-M. A Fine-Tune Role of Mir-125a-5p on Foxn1 During Age-Associated Changes in the Thymus. Aging Dis. 2017, 8, 277–286. [Google Scholar] [CrossRef] [Green Version]
- Geenen, V. The thymus and the science of self. Semin. Immunopathol. 2021, 43, 5–14. [Google Scholar] [CrossRef]
- Wang, R.; Bai, Z.; Wen, X.; Du, H.; Zhou, L.; Tang, Z.; Yang, Z.; Ma, W. MiR-152-3p regulates cell proliferation, invasion and extracellular matrix expression through by targeting FOXF1 in keloid fibroblasts. Life Sci. 2019, 234, 116779. [Google Scholar] [CrossRef]
- Yin, T.; Liu, M.-M.; Jin, R.-T.; Kong, J.; Wang, S.-H.; Sun, W.-B. miR-152-3p Modulates hepatic carcinogenesis by targeting cyclin-dependent kinase 8. Pathol. Res. Pract. 2019, 215, 152406. [Google Scholar] [CrossRef]
- Zhu, X.; Shen, Z.; Man, D.; Ruan, H.; Huang, S. miR-152-3p Affects the Progression of Colon Cancer via the KLF4/IFITM3 Axis. Comput. Math. Methods Med. 2020, 2020, 8209504. [Google Scholar] [CrossRef]
- Macias, M.J.; Martin-Malpartida, P.; Massagué, J. Structural determinants of Smad function in TGF-β signaling. Trends Biochem. Sci. 2015, 40, 296–308. [Google Scholar] [CrossRef] [Green Version]
- Alarcón, C.; Zaromytidou, A.-I.; Xi, Q.; Gao, S.; Yu, J.; Fujisawa, S.; Barlas, A.; Miller, A.N.; Manova-Todorova, K.; Macias, M.J.; et al. Nuclear CDKs Drive Smad Transcriptional Activation and Turnover in BMP and TGF-β Pathways. Cell 2009, 139, 757–769. [Google Scholar] [CrossRef] [Green Version]
- Gao, S.; Alarcón, C.; Sapkota, G.; Rahman, S.; Chen, P.-Y.; Goerner, N.; Macias, M.J.; Erdjument-Bromage, H.; Tempst, P.; Massagué, J. Ubiquitin Ligase Nedd4L Targets Activated Smad2/3 to Limit TGF-β Signaling. Mol. Cell 2009, 36, 457–468. [Google Scholar] [CrossRef] [PubMed] [Green Version]
- Chen, C.; Li, H.; Wang, X.; Wang, L.; Zeng, Q. Lnc-LFAR1 affects intrahepatic cholangiocarcinoma proliferation, invasion, and EMT by regulating the TGFβ/Smad signaling pathway. Int. J. Clin. Exp. Pathol. 2019, 12, 2455–2461. [Google Scholar] [PubMed]
- Hobson, K.G.; Cho, K.; Adamson, L.K.; Greenhalgh, D.G. Burn-Induced Thymic Apoptosis Corresponds with Altered TGF-β1 and Smad 2/3. J. Surg. Res. 2002, 105, 4–9. [Google Scholar] [CrossRef] [PubMed]
- Kenneth, N.S.; White, R.J. Regulation by c-Myc of ncRNA expression. Curr. Opin. Genet. Dev. 2009, 19, 38–43. [Google Scholar] [CrossRef]
Figure 1.
The expression of miR-152-3p from isolated thymuses and thymic epithelial cells (TECs). The miR-152-3p from the thymuses and TECs of 1 M and 3 M mice were quantified using RT-qPCR. Data represent the mean ± standard deviation (SD) of three biological replicates (Student’s t-test: ***, p < 0.001; ****, p < 0.0001).

Figure 2.
The effect of miR-152-3p on the viability and proliferation of the murine medullary thymic epithelial cell line 1 (MTEC1) cells. (a,b) The transfection efficiency of the miR-152-3p mimic and inhibitor in the MTEC1 cells. (c) CCK-8 assays to examine the proliferation of MTEC1 cells. (d,e) The proliferation effect of the MTEC1 cells was detected using the 5-ethynyl-2′-deoxyuridine (EdU) kit. While Hoechst stains the nucleus blue, EdU reacts with Apollo stain to turn the replicating cells red. Magnification: 100×. The RT-qPCR data were normalized to the level of U6. Data were expressed as mean ± SD for three biological replicates (Student’s t-test: **, p < 0.01; ***, p < 0.001).

Figure 3.
The effects of miR-152-3p on the cell cycle of MTEC1 cells. (a) The cell cycle of MTEC1 cells was detected by flow cytometry when the miR-152-3p was overexpressed and inhibited. (b,c) RT-qPCR was used to detect the expression of the cell cycle-related genes in the MTEC1 cells. The RT-qPCR data were normalized to the level of β-actin for mRNA. Data were expressed as mean ± SD for three biological replicates (Student’s t-test: *, p < 0.05, **, p < 0.01; ***, p < 0.001).

Figure 4.
Screening of the miR-152-3p target genes. (a,b) The effect of miR-152-3p gain and silencing in the MTEC1 cells on the expression of 10 candidate target genes. (c) SMAD2 protein expression level in the MTEC1 cells. The RT-qPCR data were normalized to the level of β-actin for mRNA. Data were expressed as mean ± SD for three biological replicates (Student’s t-test: *, p < 0.05; **, p < 0.01).

Figure 5.
The direct target gene of miR-152-3p is Smad2. (a) The binding sites and mutant bases of miR-152-3p and Smad2 3′ UTR. (b) Luciferase activity of the recombinant plasmids pmirGLO–Smad2-3′ UTR-WT or pmirGLO–Smad2-3′ UTR-MUT co-transfection with the miR-152-3p mimic. The RT-qPCR data were normalized to the level of U6. Data were expressed as mean ± SD for three biological replicates (Student’s t-test: **, p < 0.01).

Figure 6.
miR-152-3p inhibits the proliferation of MTEC1 cells by targeting Smad2. (a) The expression level of the cell cycle-related genes was detected in the MTEC1 cells transfected with siRNA–Smad2 (siSmad2). (b) siSmad2 decreased the expression of the SMAD2 protein in the MTEC1 cells. (c) The effect of siSmad2 on MTEC1 cell cycle progression was measured using flow cytometry. (d) After co-transfection with miR-152-3p and siSmad2, cell cycle-related gene expression was detected in the MTEC1 cells. The RT-qPCR data were normalized to the level of β-actin for mRNA. Data were expressed as mean ± SD for three biological replicates (Student’s t-test: *, p < 0.05; **, p < 0.01; ***, p < 0.001).


Table 1.
Primer sequences for the quantitative reverse transcription polymerase chain reaction (RT-qPCR).
Table 1.
Primer sequences for the quantitative reverse transcription polymerase chain reaction (RT-qPCR).
| Genes | Forward and Reverse Primer Sequences (5′–3′) | Product Size (bp) |
|---|---|---|
| C-myc | F: GCAACTTCTCCACCGCCGAT | |
| NM_010849.4 | R: AACCGCTCCACATACAGTCCT | 141 |
| Ccnd1 | F: CATGAACTACCTGGACCGCTT | |
| NM_007631.2 | R: TGCTTGTTCTCATCCGCCTCT | 285 |
| Ccne1 | F: GTGCGAAGTCTATAAGCTCCA | |
| NM_007633.2 | R: CGCCATCTGTAACATAAGCAA | 194 |
| Cdk4 | F: CTACATACGCAACACCCG | |
| NM_009870 | R: TCAAAGATTTTCCCCAACT | 118 |
| Ywhab | F: CCGGAGAAAATAAACAAACCAC | |
| NM_018753.6 | R: CAATCGCCTCATCAAATGCC | 201 |
| Tgif2 | F: TCTGCACCGCTACAACGCCTA | |
| NM_173396.3 | R: ACTGATTAGGGTCTTTGCCAT | 158 |
| Ltbp1 | F: GCTCTTTCCGCTGCCTCTGTTATC | |
| NM_019919.4 | R: AGTTCACACTCGTTCACATCCACAC | 82 |
| Fbn1 | F: GAGTGCCAAGAAATCCCGAAC | |
| NM_007993.2 | R: AATCGTGTTTCTGCAAGTCCC | 174 |
| Acvr1 | F: ATCGCTTCAGACATGACCTCC | |
| NM_001110204.1 | R: TCCGAAGGCAGCTAACCGTA | 127 |
| Mdm4 | F: TTGTTTCAGACACTACGGATGA | |
| NM_001302801.1 | R: GTTTGCTCAGAATTAGCAGCTT | 100 |
| Smad2 | F: CTCTCCAACGTTAACCGAAATG | |
| NM_010754.5 | R: CACCTATGTAATACAAGCGCAC | 82 |
| Cdc14a | F: CTTACAACCTCACCGTCCT | |
| NM_001080818.2 | R: TATTCTTCCGCATCAAACGTCT | 94 |
| Dnmt1 | F: GAGACGAAAAACGACACGTAAA | |
| NM_001199432.1 | R: CACTTTGGTGAGTTGATCTTCG | 117 |
| Tgfb2 | F: CTGTACCTTCGTGCCGTCT | |
| NM_009367.4 | R: GCCATCAATACCTGCAAATCTCG | 82 |
| β-actin | F: CATCCGTAAAGACCTCTATGCCAA | |
| NM_007393.5 | R: ATGGAGCCACCGATCCACA | 171 |
Table 2.
Primer sequences of the Smad2 3′ untranslated region (UTR).
| Target Gene | Primer Sequence (5′–3′) | Accession No. | Product Length |
|---|---|---|---|
| Smad2 3′UTR | F: GAGCTCTCTTGTAACAGAAACCGTGTG R: GTCGACAATAGTGTCCACCTTCCGAG | NM_010754.5 | 671 bp |
Note: The italics indicate restriction sites (Sac I and Sal I).
Publisher’s Note: MDPI stays neutral with regard to jurisdictional claims in published maps and institutional affiliations. |
© 2022 by the authors. Licensee MDPI, Basel, Switzerland. This article is an open access article distributed under the terms and conditions of the Creative Commons Attribution (CC BY) license (https://creativecommons.org/licenses/by/4.0/).
Share and Cite
MDPI and ACS Style
Li, Y.; Wang, X.; Wu, Q.; Liu, F.; Yang, L.; Gong, B.; Zhang, K.; Ma, Y.; Li, Y. miR-152-3p Represses the Proliferation of the Thymic Epithelial Cells by Targeting Smad2. Genes 2022, 13, 576. https://doi.org/10.3390/genes13040576
AMA Style
Li Y, Wang X, Wu Q, Liu F, Yang L, Gong B, Zhang K, Ma Y, Li Y. miR-152-3p Represses the Proliferation of the Thymic Epithelial Cells by Targeting Smad2. Genes. 2022; 13(4):576. https://doi.org/10.3390/genes13040576
Chicago/Turabian StyleLi, Ying, Xintong Wang, Qingru Wu, Fenfen Liu, Lin Yang, Bishuang Gong, Kaizhao Zhang, Yongjiang Ma, and Yugu Li. 2022. "miR-152-3p Represses the Proliferation of the Thymic Epithelial Cells by Targeting Smad2" Genes 13, no. 4: 576. https://doi.org/10.3390/genes13040576
Note that from the first issue of 2016, this journal uses article numbers instead of page numbers. See further details here.