Article

Effect of miR-302b MicroRNA Inhibition on Chicken Primordial Germ Cell Proliferation and Apoptosis Rate

1
Animal Biotechnology Department, Institute of Genetics and Biotechnology, Hungarian University of Agriculture and Life Sciences, 2100 Godollo, Hungary
2
Institute for Farm Animal Gene Conservation, National Centre for Biodiversity and Gene Conservation, 2100 Godollo, Hungary
3
Faculty of Medicine, Institute of Translational Medicine, Semmelweis University, 1089 Budapest, Hungary
4
Institute of Enzymology, Research Centre for Natural Sciences, 1117 Budapest, Hungary
5
Stem-Cell and Brain Research Institute, USC1361 INRA, U1208 INSERM, 69675 Bron, France
*
Author to whom correspondence should be addressed.
These authors contributed equally to this work.
Genes 2022, 13(1), 82; https://doi.org/10.3390/genes13010082
Submission received: 24 November 2021 / Revised: 16 December 2021 / Accepted: 23 December 2021 / Published: 28 December 2021
(This article belongs to the Special Issue RNA Interference Pathways, Volume II)

Abstract

:
The primordial germ cells (PGCs) are the precursors for both the oocytes and spermatogonia. Recently, a novel culture system was established for chicken PGCs, isolated from embryonic blood. The possibility of PGC long-term cultivation issues a new advance in germ cell preservation, biotechnology, and cell biology. We investigated the consequence of gga-miR-302b-5P (5P), gga-miR-302b-3P (3P) and dual inhibition (5P/3P) in two male and two female chicken PGC lines. In treated and control cell cultures, the cell number was calculated every four hours for three days by the XLS Imaging system. Comparing the cell number of control and treated lines on the first day, we found that male lines had a higher proliferation rate independently from the treatments. Compared to the untreated ones, the proliferation rate and the number of apoptotic cells were considerably reduced at gga-miR-302b-5P inhibition in all PGC lines on the third day of the cultivation. The control PGC lines showed a significantly higher proliferation rate than 3P inhibited lines on Day 3 in all PGC lines. Dual inhibition of gga-miR-302b mature miRNAs caused a slight reduction in proliferation rate, but the number of apoptotic cells increased dramatically. The information gathered by examining the factors affecting cell proliferation of PGCs can lead to new data in stem cell biology.

1. Introduction

Germ cell development generates totipotency throughout genetic as well as epigenetic regulation of the genome function. Primordial germ cells (PGCs) are the first germ cell population established during the development and serve as precursors for both the oocytes and spermatogonia [1]. PGCs, similarly to embryonic stem cells (ESCs) [2] and induced pluripotent stem cells (iPSCs) [3], are essential tools in stem cell biology and research. It is possible to genetically modify the PGCs and create germ cell chimeras from the transgenic PGCs, as was shown by Nakamura and co-workers [4]. Chicken PGCs can be easily isolated from the fertilized eggs at the early stages of embryonic development and can be maintained in vitro utilizing already established protocols [5,6]. This accessibility provides a unique tool to explore better medium formulations and investigate stem cell properties, such as factors governing pluripotency and self-renewal [7].
One of the emerged pluripotency factors in stem cell biology are miRNAs [8,9,10,11]. They play a fundamental role in maintaining the pluripotency of PGCs [12,13]. MicroRNAs (miRNAS) are small non-coding RNAs found in the genome that post-transcriptionally regulate gene expression via mRNA degradation or translation inhibition. The miRNAs are known to regulate important physiological and pathological processes [14]. The genes for the miRNAs are dispersed throughout the genome: some are intergenic, while others are located in intronic, or in exonic regions [11]. The biogenesis of miRNAs is a multi-step process in higher vertebrates. The process begins with RNA polymerase II transcribing these miRNA genes into primary-miRNA (pri-miRNA) transcipts. This pri-miRNA is further processed by the microprocessor complex consisting of DROSHA, DGCR8 and spliceosome components into precursor miRNA (pre-miRNA). The Exportin-5 enzyme exports pre-miRNAs out of the nucleus into the cytoplasm. This pre-miRNA is further cleaved by Dicer, another Ribonuclease III type enzyme, with the help of the TRBP into a miRNA duplex complex. The duplex consists of a 5P and a 3P strand, and the process of arm selection results in the guide RNA strand incorporating into the RNA-induced silencing complex (RISC), which mediates the RNAi-related gene silencing; the partial base pairing between the mature miRNA and the target mRNA leads to translation inhibition or mRNA degradation. Apart from this canonical maturation process, there are several Drosha- or Dicer-independent pathways of miRNA biogenesis [15,16,17]. MiRANs are crucial for gene regulation during pluripotency, self-renewal, and differentiation of ESCs and iPSCs [18]. They are expressed during the earliest embryonic developmental stages [9,19]. During embryonic development [19,20,21,22], the quantity of miRNAs is strongly regulated [16,20]. If the expression levels of non-coding RNAs become too high, they can act as cancer-promoting agents, which can cause the cells to escape standard mechanisms of control and become malignant in nature [8,17,23]. MicroRNAs belonging to the miR-302 family are emerging as key players in the control of cell growth. Khodayari and co-workers identified a novel mechanism of ephrin-A1 mediated anti-oncogenic signaling in malignant pleural mesothelioma (MPM) through miR-302b upregulation and inhibition of MM tumor sphere growth by inducing apoptosis [24]. Apoptosis is described by specific morphological and biochemical features in which caspase activation plays a central function as a component of both health and disease [25]. Understanding the mechanisms of apoptosis and other variants of programmed cell death provides deeper insight into various disease processes and may thus influence therapeutic strategy.
Our present study identified a novel effect of the gga-miR-302b on chicken PGC proliferation by inhibiting gga-miR-302b-5P (5P) and gga-miR-302b-3P (3P). We demonstrated that, in the case of gga-miR-302b-5P and gga-miR-302b-3P inhibition, PGCs showed a significantly reduced proliferation rate than the control PGCs. The inhibition of gga-miR-302b-5P reduced the apoptotic rate of all the examined PGC lines. Together, these findings suggest that the cells might undergo an additional pathway of cell degradation, besides apoptosis, that needs to be determined experimentally. The differentiation capacity of inhibited cells needs to be explored also.

2. Materials and Methods

2.1. Experimental Animals and Animal Care

Animals were kept according to the standard rules of the Hungarian Animal Protection Law (1998. XXVIII). Permission for experimental animal research at the National Centre for Biodiversity and Gene Conservation, Institute for Farm Animal Gene Conservation (Gödöllő, Hungary), was provided by the National Food Chain Safety Office, Animal Health and Animal Welfare Directorate (Budapest, Hungary). Fertilized eggs from Black Transylvanian Naked Neck Chicken were provided by the National Centre for Biodiversity and Gene Conservation, Institute for Farm Animal Gene Conservation (Gödöllő, Hungary).

2.2. Isolation, Establishment, and Maintenance of PGC Lines

Eggs were collected and incubated before the experiment. Circulating PGCs were isolated from fertilized eggs (HH stage 14–16) from Black Transylvanian Naked Neck chicken embryos and transferred to 300 μL culture medium in a 48-well plate without feeder cells. The culture medium was prepared as described by Whyte and colleagues [6]. The egg surface was cleaned up with 70% EtOH prior to opening. Next, 1 μL of blood was taken by a glass micro-pipette from the dorsal aorta of the embryo under a stereomicroscope. After 1–2 weeks, red blood cells died and PGCs prevailed. PGCs were cultured and used for the experiment. Half of the medium was changed every other day. When the total cell number reached 1.0 × 10⁵, the cells were divided into two and propagated at 2–4.0 × 10⁵ cells/mL medium in a 24-well plate [26]. Tissue samples for sex-determination were collected from every isolated embryo and stored at −20 °C until further use. The time of isolation, the exact age of the embryos (HH stages) cells [27], and visual the presence/absence of developmental abnormalities were recorded.

2.3. Cell Counting Using Arthur Fluorescence Cell Counter

The cell counting of the chicken PGCs before preparing the cell proliferation assay was performed using the Arthur Novel Fluorescence Cell Counter (NanoEnTek, Pleasanton, CA, USA). Two separate counts in parallel confirmed the results. For each line, PGCs were collected from 6 wells of a 24-well plate. Cell concentration was calculated from 25 μL PGC suspension by the Arthur Cell Counter. After cell number calculation, 1 × 10³ cells were placed into each well of one 96-well plate. Further, the cell number was measured every 4 h, for three days, using High-Content Screening Molecular Device. The measurement using ImageXpress Micro XLS Imaging System with a built-in incubator was performed at the Molecular Cell Biology Research Group (Institute of Enzymology, Research Centre for Natural Sciences): 96-well plate, with 6-6 parallel wells, of four previously established PG cell lines: two male (M1: #508-ZZ; M2: #512-ZZ) and two females (F1: #509-ZW; F2: #513-ZW) PGC line prepared for each condition. At the end of the experiment, the samples were collected for apoptosis measurement and immunostaining (Supplementary Figure S1).

2.4. Apoptosis Rate Measurement Using Arthur Fluorescence Cell Counter

Apoptosis rate was measured on Day 3. 10× Annexin V Binding Buffer was diluted to 1× (AD10—Dojindo Molecular Technologies, Inc., Rockville, MD, USA) with tissue culture grade water (Applied Biosystems, Life Technologies, Carlsbad, CA, USA). Both the Annexin V FITC and the Propidium Iodide components were used at 5 μL/test in a final volume of 100 μL. The apoptotic and necrotic rate of the PGCs was measured using the Arthur Novel Fluorescence Cell Counter (NanoEnTek, Pleasanton, CA, USA).

2.5. Immunostaining of PGCs

PGCs were fixed with 4% PFA for 10 min. After washing with PBS, the fixed cells were blocked for 45 min with a blocking buffer containing 5% (v/v) BSA, then were incubated with each of the primary antibodies including mouse anti-SSEA-1 (1:10, Developmental Studies Hybridoma Bank, Iowa City, Iowa, USA) and rabbit anti-VASA (CVH) (1:1000; kindly provided by Bertrand Pain, Lyon, France). After overnight incubation in the primary antibody solution in a humid chamber at 4 °C, the cells were washed three times with PBS. Then the cells were incubated for 1 h with the secondary antibodies, Alexa-Fluor488-conjugated donkey anti-rabbit-IgG (Applied Biosystems, Life Technologies, Carlsbad, CA, USA) or Alexa-Fluor-555-conjugated donkey-anti-mouse-IgM (Applied Biosystems, Life Technologies, Carlsbad, CA, USA) in a dark, humid chamber, at 37 °C temperature. After washing once with 1× PBS, the nucleus was stained with TO-PRO®-3 stain for 15 min (1:500, Molecular Probes Inc., Eugene, OR, USA). After three rounds of 1x PBS, wash coverslips were mounted on the slide with the application of 20 μL VECTASHIELD® Mounting Media (Vector Laboratories Inc., Burlingame, CA, USA) and analysed by confocal microscopy (TCS SP8, Leica Microsystems IR GmbH Wetzlar, Hessen, Germany). Negative controls were stained only with the secondary antibodies.

2.6. RNA Isolation

We collected the cells for RNA isolation in RNA Aqueous Lysis Buffer Micro Kit (Applied Biosystems). The isolated RNA was then used for qRT-PCR analysis for stem cell- and germ cell-specific markers as well as for the miRNAs: gga-miR-302b-5P and gga-miR-302b-3P (Table 1 and Table 2). The concentration of the extracted RNAs was determined using the NanoDrop One Spectrophotometer (Thermo Fisher Scientific, Waltham, MA, USA). The isolated RNA samples were stored at −70 °C.

2.7. CDNA Writing, qRT-PCR

The extracted RNA samples were reverse transcribed into cDNA with High-Capacity cDNA Reverse Transcription Kit, following the instructions of the manufacturer (Applied Bio systems, Life Technologies, Carlsbad, CA, USA). RT master mix was used for cDNA writing. The cDNA was stored at −20 °C. The synthesized cDNA was then used for qRT-PC. The reaction was performed by Eppendorf MasterCycler Realplex machine. TaqMan PCR master mix was applied for the qPCR as a double-stranded fluorescent DNA-specific dye according to the manufacturer’s instructions (Applied Bio systems, Life Technologies, Carlsbad, CA, USA). GAPDH was used as an internal control (housekeeping gene). For each gene examined, three parallels were analysed, fluorescence emission was detected and relative quantification was calculated with the GenEx7 program (MultiD Analyses AB, Göteborg, Sweden).
The qRT-PCR analysis was used for checking the expression of the PGC-specific and stem cell-specific markers in the chicken PGCs. The mRNA analysis was done for the following genes given in Table 1 below.
The qRT-PCR analysis was done to check the expression of miR-302b-3P and miR-302b-5P mature miRNA expression. MiR-92 was used as an internal control (Table 2).

2.8. Inhibition gga-miR-302b-5P and gga-miR-302b-3P Using MicroRNA Inhibitors

Cultured chicken PGCs were transfected with inhibitors against the gga-miR-302b-5P and gga-miR-302b-3P at 100 nM final concentration using the transfection agent siPORT (Applied Biosystems, Life Technologies, Carlsbad, CA, USA). We used the following inhibitors given in Table 3 below.

2.9. Statistical Analysis

The expression or repression of the target gene relative to the internal control gene in each sample was calculated with the GenEx 7.0 program (Multiday, SE) using the formula 2−ΔΔCt, where ΔCt = Ct target gene—Ct internal control and ΔΔCt = ΔCt test sample—ΔCt control sample. Statistical differences between the examined groups were assessed by t-test using the GenEx 7.0 software. The data are presented as mean ± SD and p values of less than 0.05 were regarded as statistically significant. Labels on the pictures: p < 0.05 *, p < 0.01 **, p < 0.001 ***.

3. Results

There were two male (M1: #508-ZZ; M2: #512-ZZ) and two female (F1: #509-ZW; F2: #513-ZW) PG cell lines used in this study. The cell number of these cell lines was measured every 4 h for three days, using the XLS Imaging system with a built-in incubator. Our aim was to examine the proliferation rate of the PGCs on Day 1, Day 2, and Day 3 after the inhibition of gga-miR-302b-5P (5P) or gga-miR-302b-3P (3P) or using anti-gga-miR-302b-5P and anti-gga-miR-302b-3P inhibitors together (5P/3P inhibition). For example, the proliferation rate on the third day was calculated by dividing the average cell number counted on the third day (h76) by the second day (h52). We compared the proliferation rate of control and treated lines on the first day (28 h/4 h), on the second day (52 h/28 h) and on the third day (76 h/52 h) (Supplementary Figure S1).

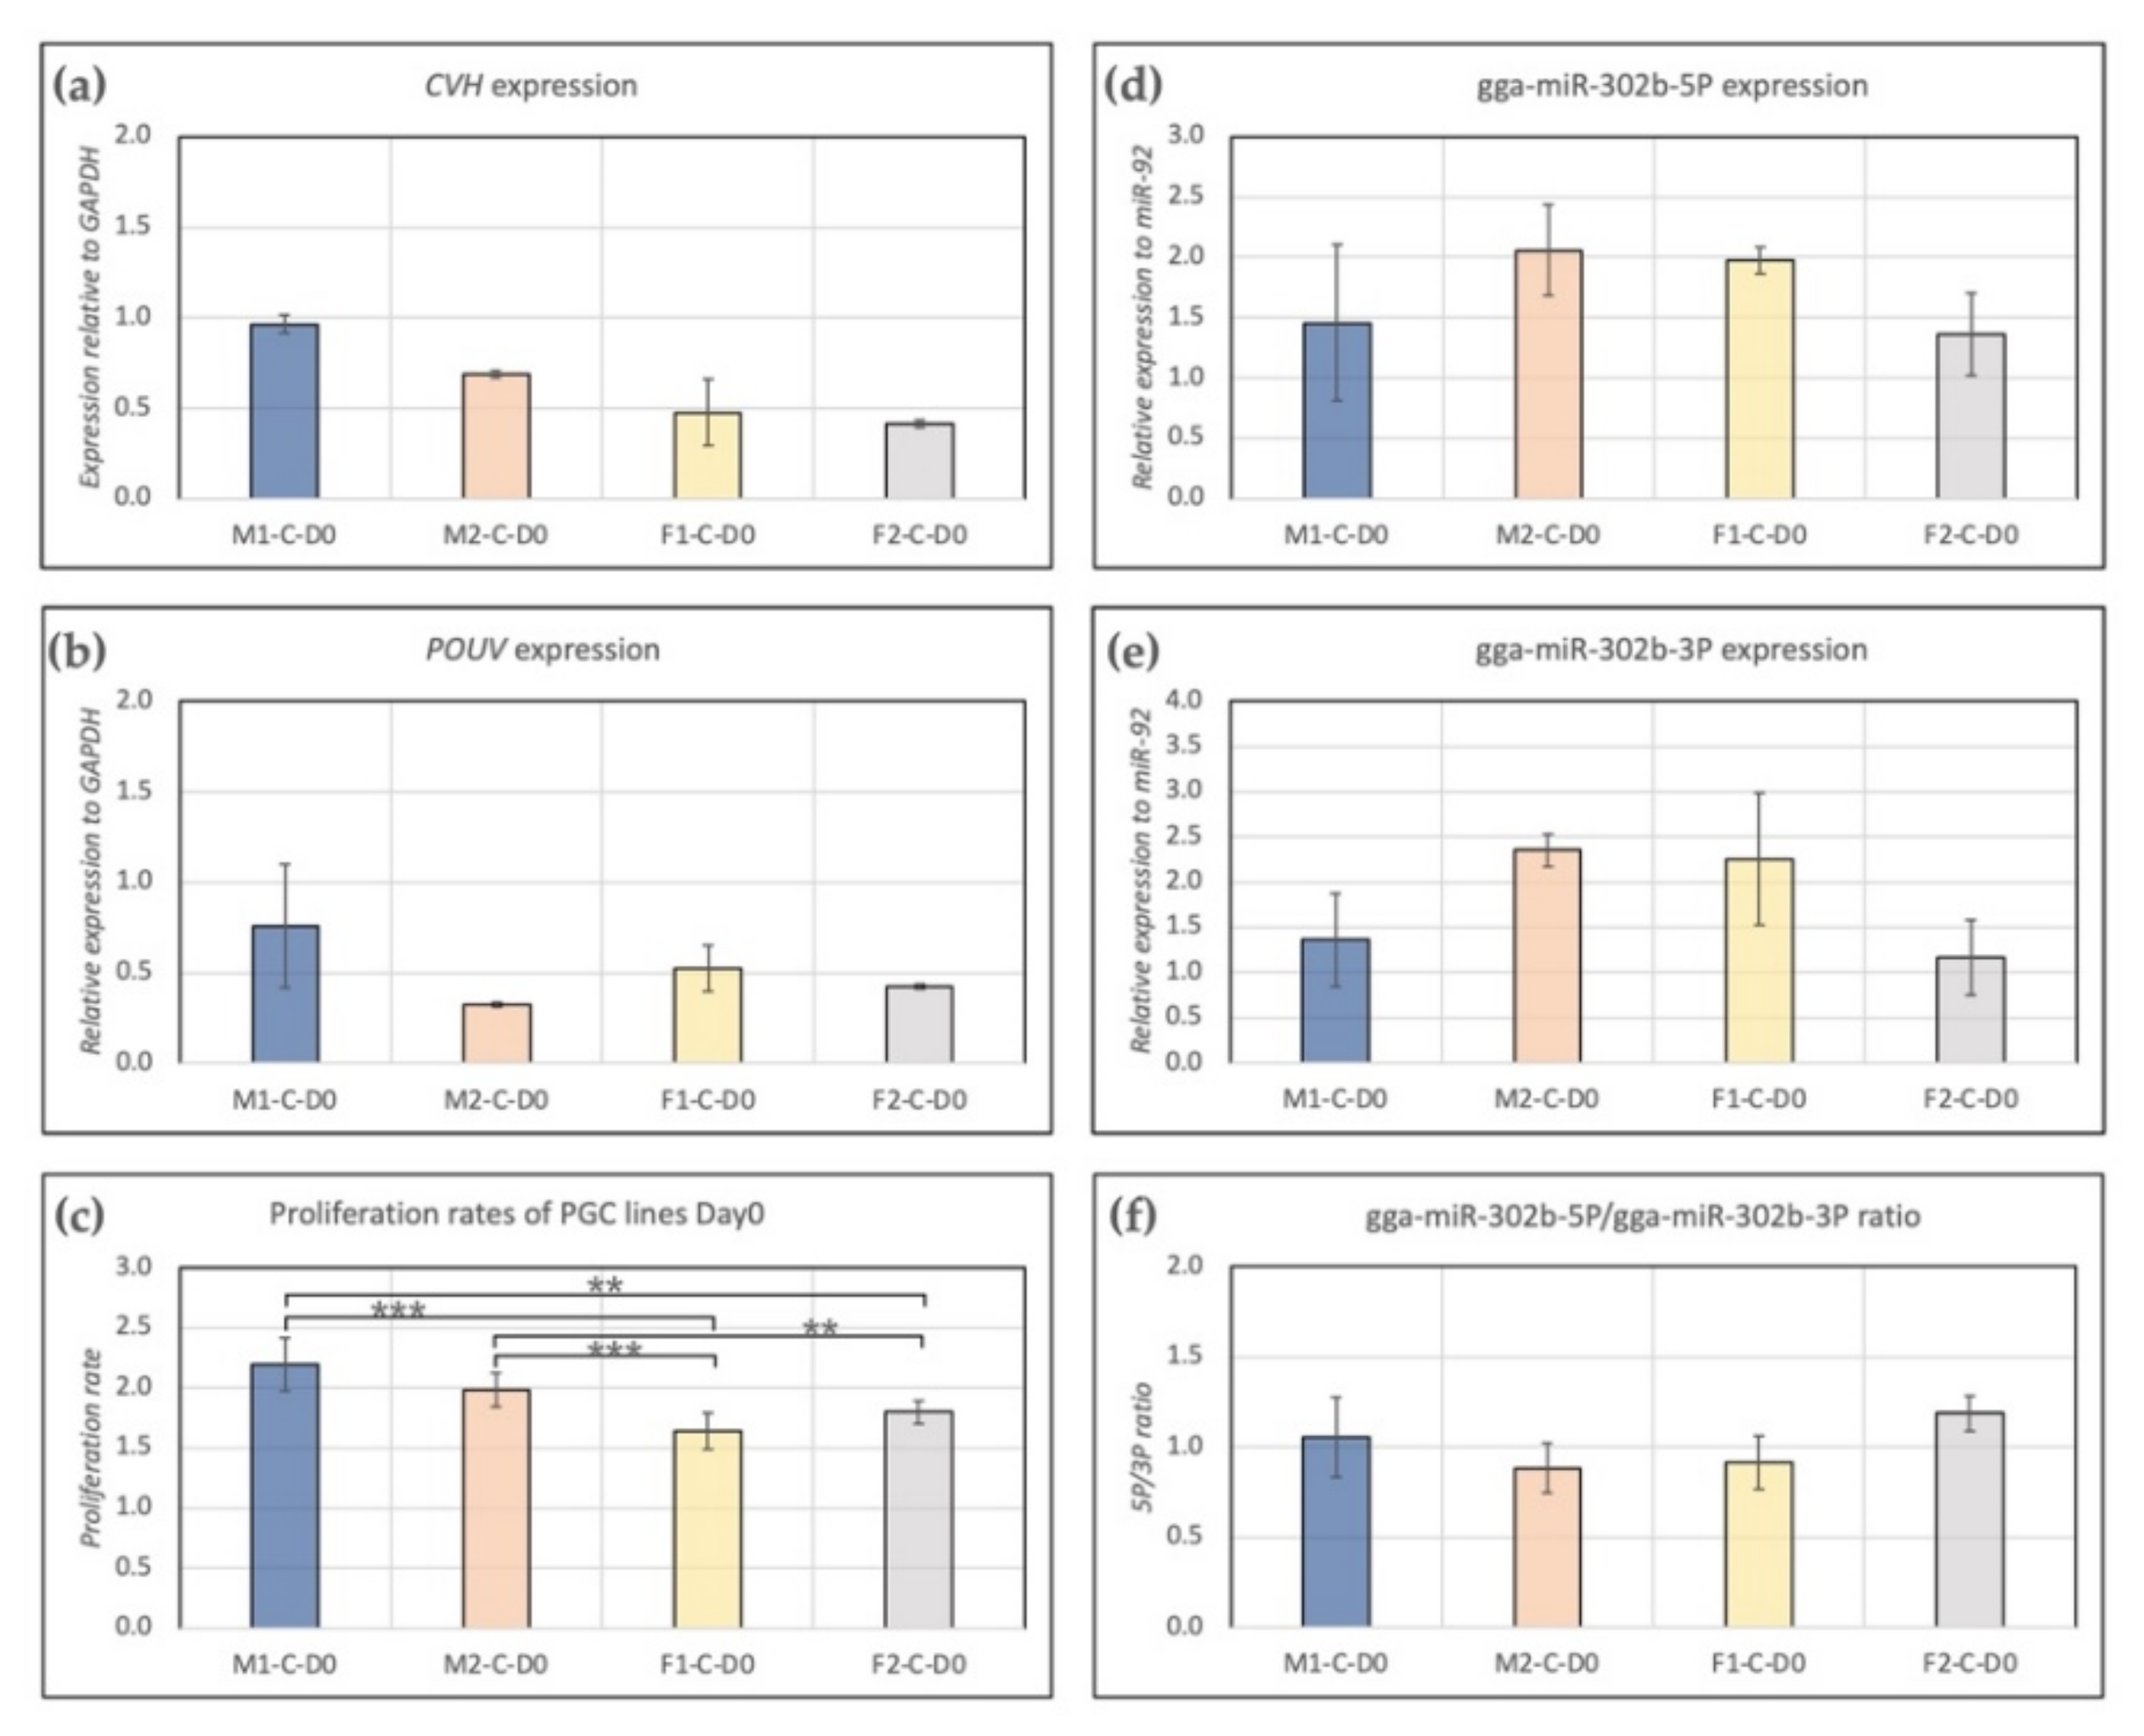
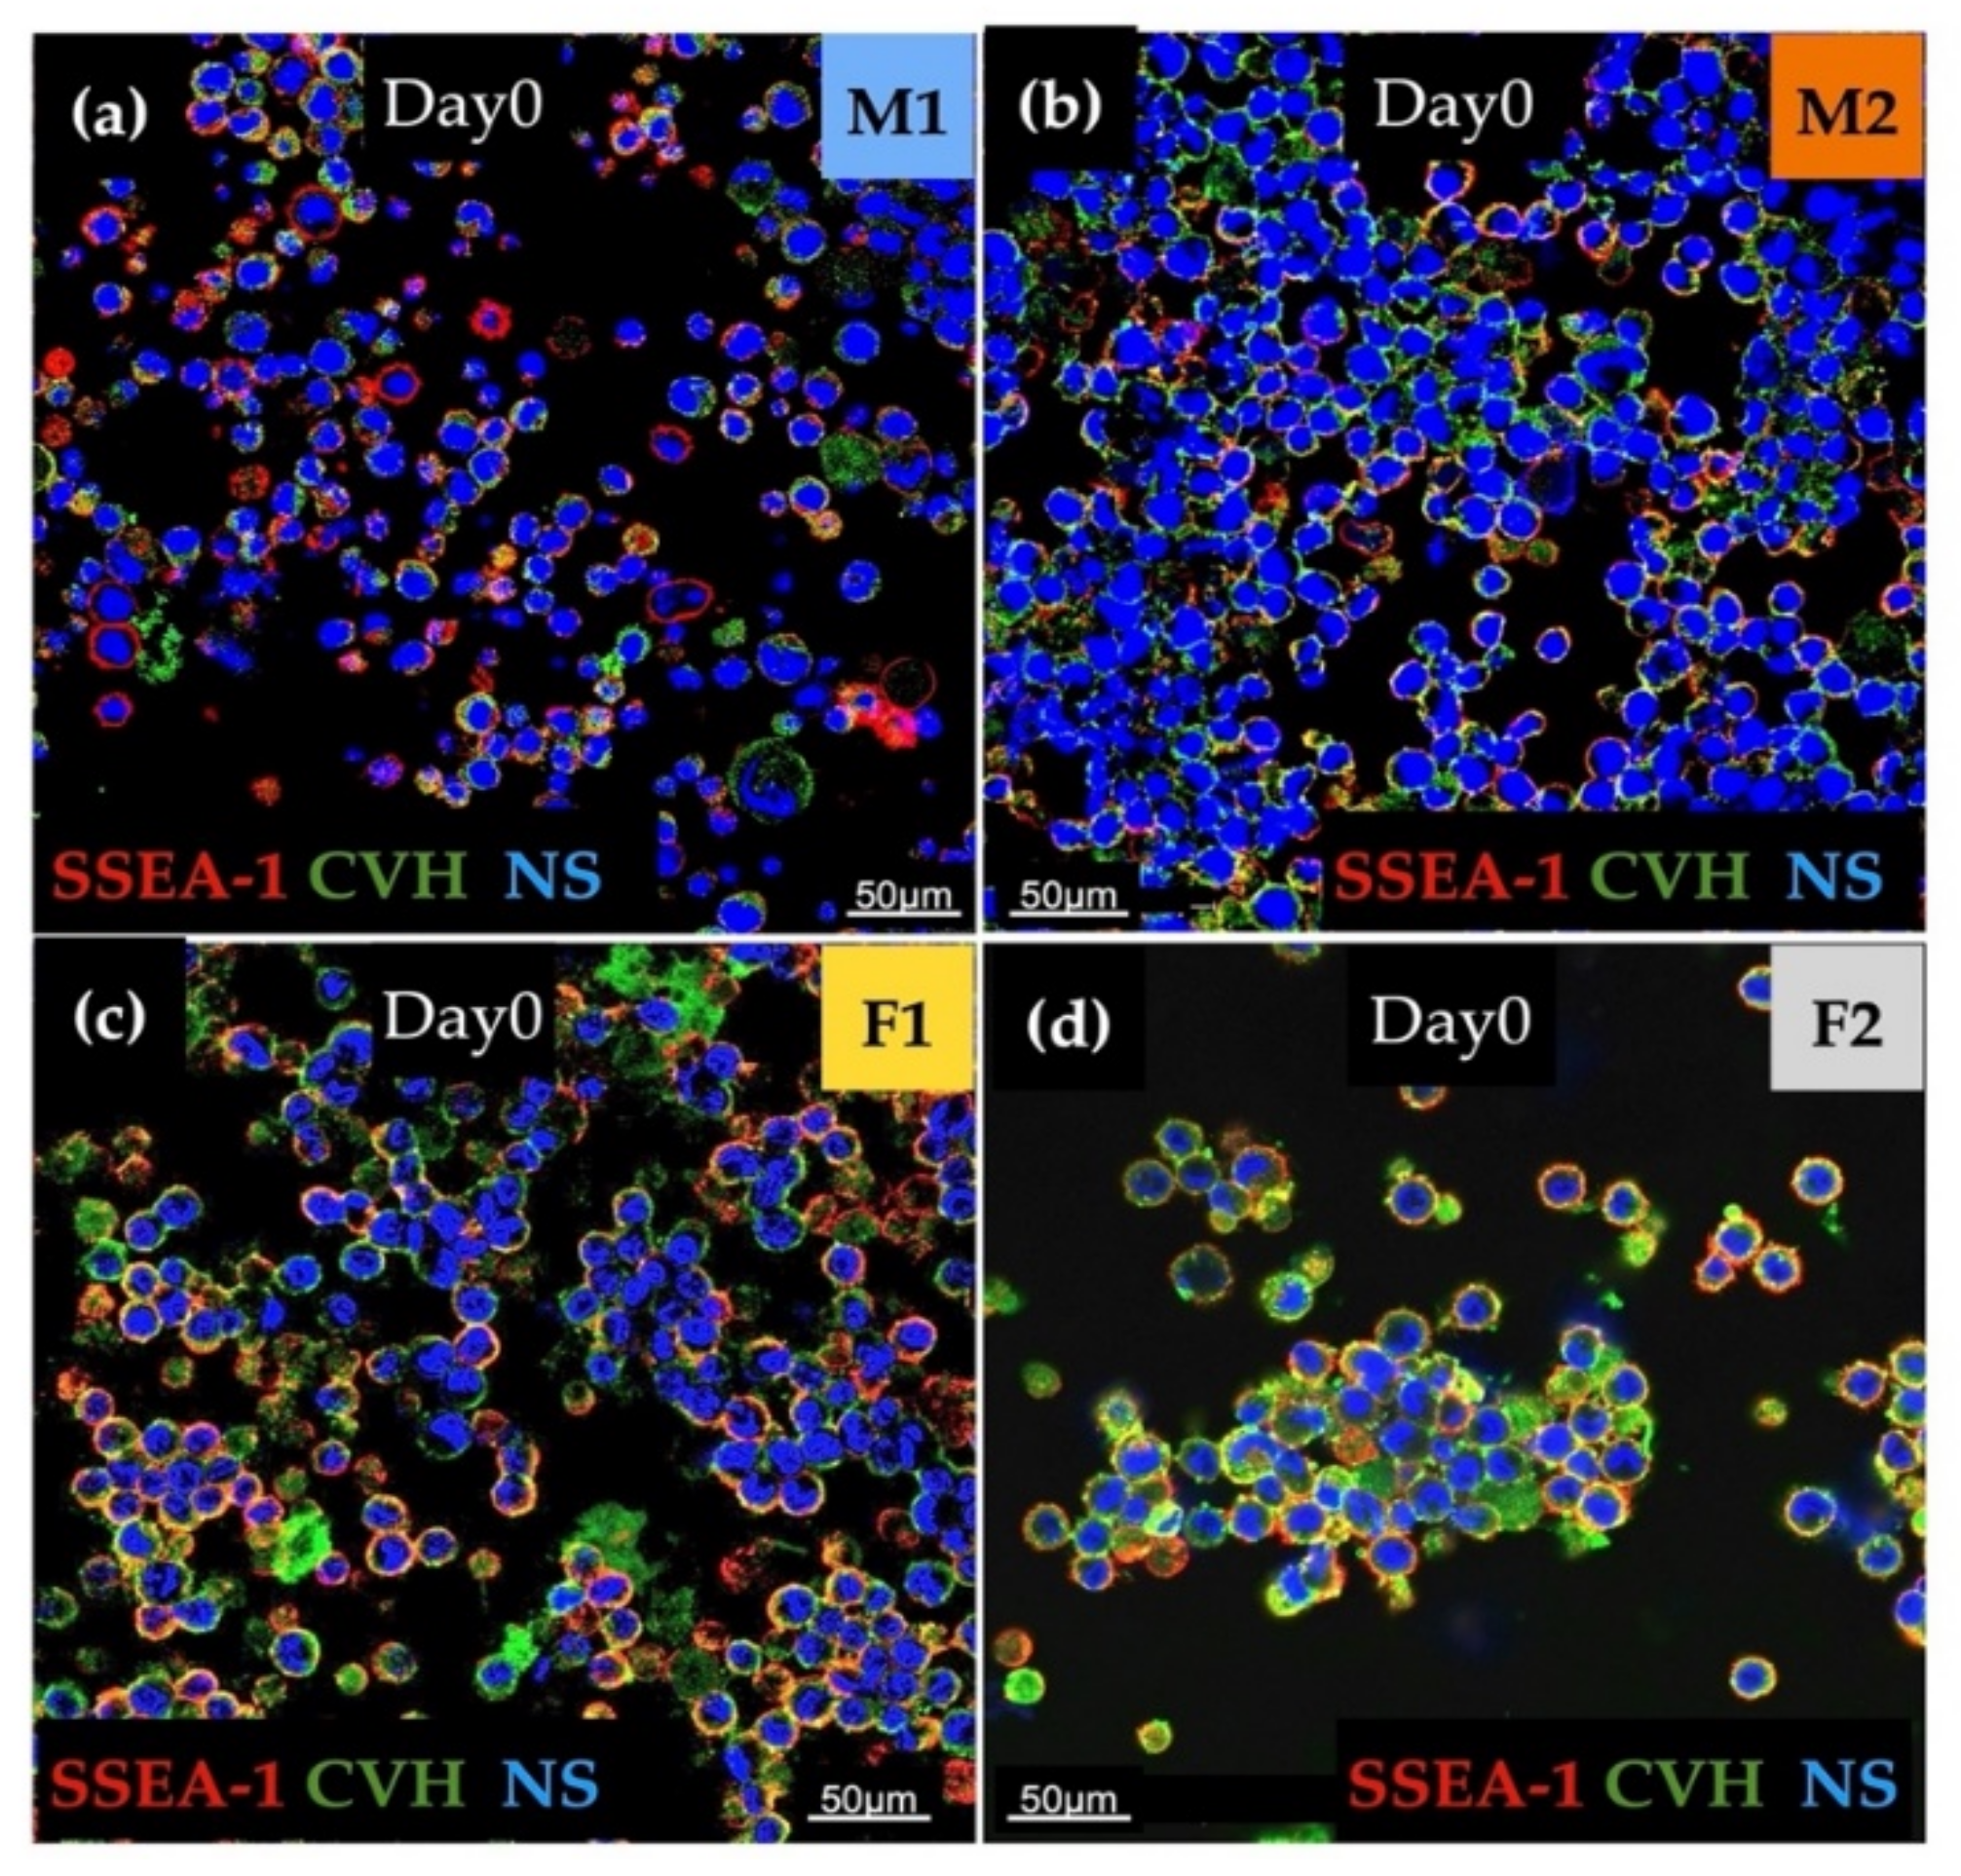
3.1. Characterization of Stem Cell- and Germ Cell-Specific Marker Expression Profile of PG Cell Lines at Day 0

The used PG cell lines were characterized before the experiments.
Expression of CVH and POUV were measured. We found higher expression of CVH (germ cell-specific marker, Figure 1a) in male lines (M1, M2) than in females (F1, F2). POUV (stem cell-specific marker, Figure 1b) expression was the highest in the case of the M1 PGC line. Furthermore, a significant difference was found between the proliferation rate of male and female lines. In the case of males, we found a significantly higher proliferation rate compared to female lines (Figure 1c). Gga-miR-302b-5P (Figure 1d) and gga-miR-302b-3P (Figure 1e) miRNAs were also analysed at Day 0. The expression of both miRNAs was the highest in the case of cell line M2, but the difference was not significant. Interestingly, the 5P/3P ratio was the highest in cell line F2 (Figure 1f); although that was not the case regarding the proliferation rate (Figure 1c).
The immunostaining was done to analyse the expression of stem cell-specific SSEA-1 and germ cell-specific CVH. We found high expression for examined markers in all cell lines. Aggregation of cells in the case of the female lines (F1, F2) was also detectable (Figure 2).
The cell number was increased in all cell lines during the cultivation period (4–76 h, Figure 3B). The M1 and M2 (male, ZZ genotypes) lines showed a significantly decreased proliferation rate on Day 2 and Day 3 compared to Day 1 (Figure 3A(a,b)). The proliferation rate of F1 (female, ZW genotype, Figure 3A(c)) PGCs did not change, while the proliferation rate of F2 (female, ZW genotype, Figure 3A(d)) line increased significantly on Day 2 and Day 3 compared to Day 1. This outcome can explain why we got the highest 5P/3P ratio in the case of F2 PGCs (Figure 1f). This finding fit with our earlier result [28] also. The immunostaining revealed high SSEA-1 and CVH expression in all lines (Figure 3A(e–h)).

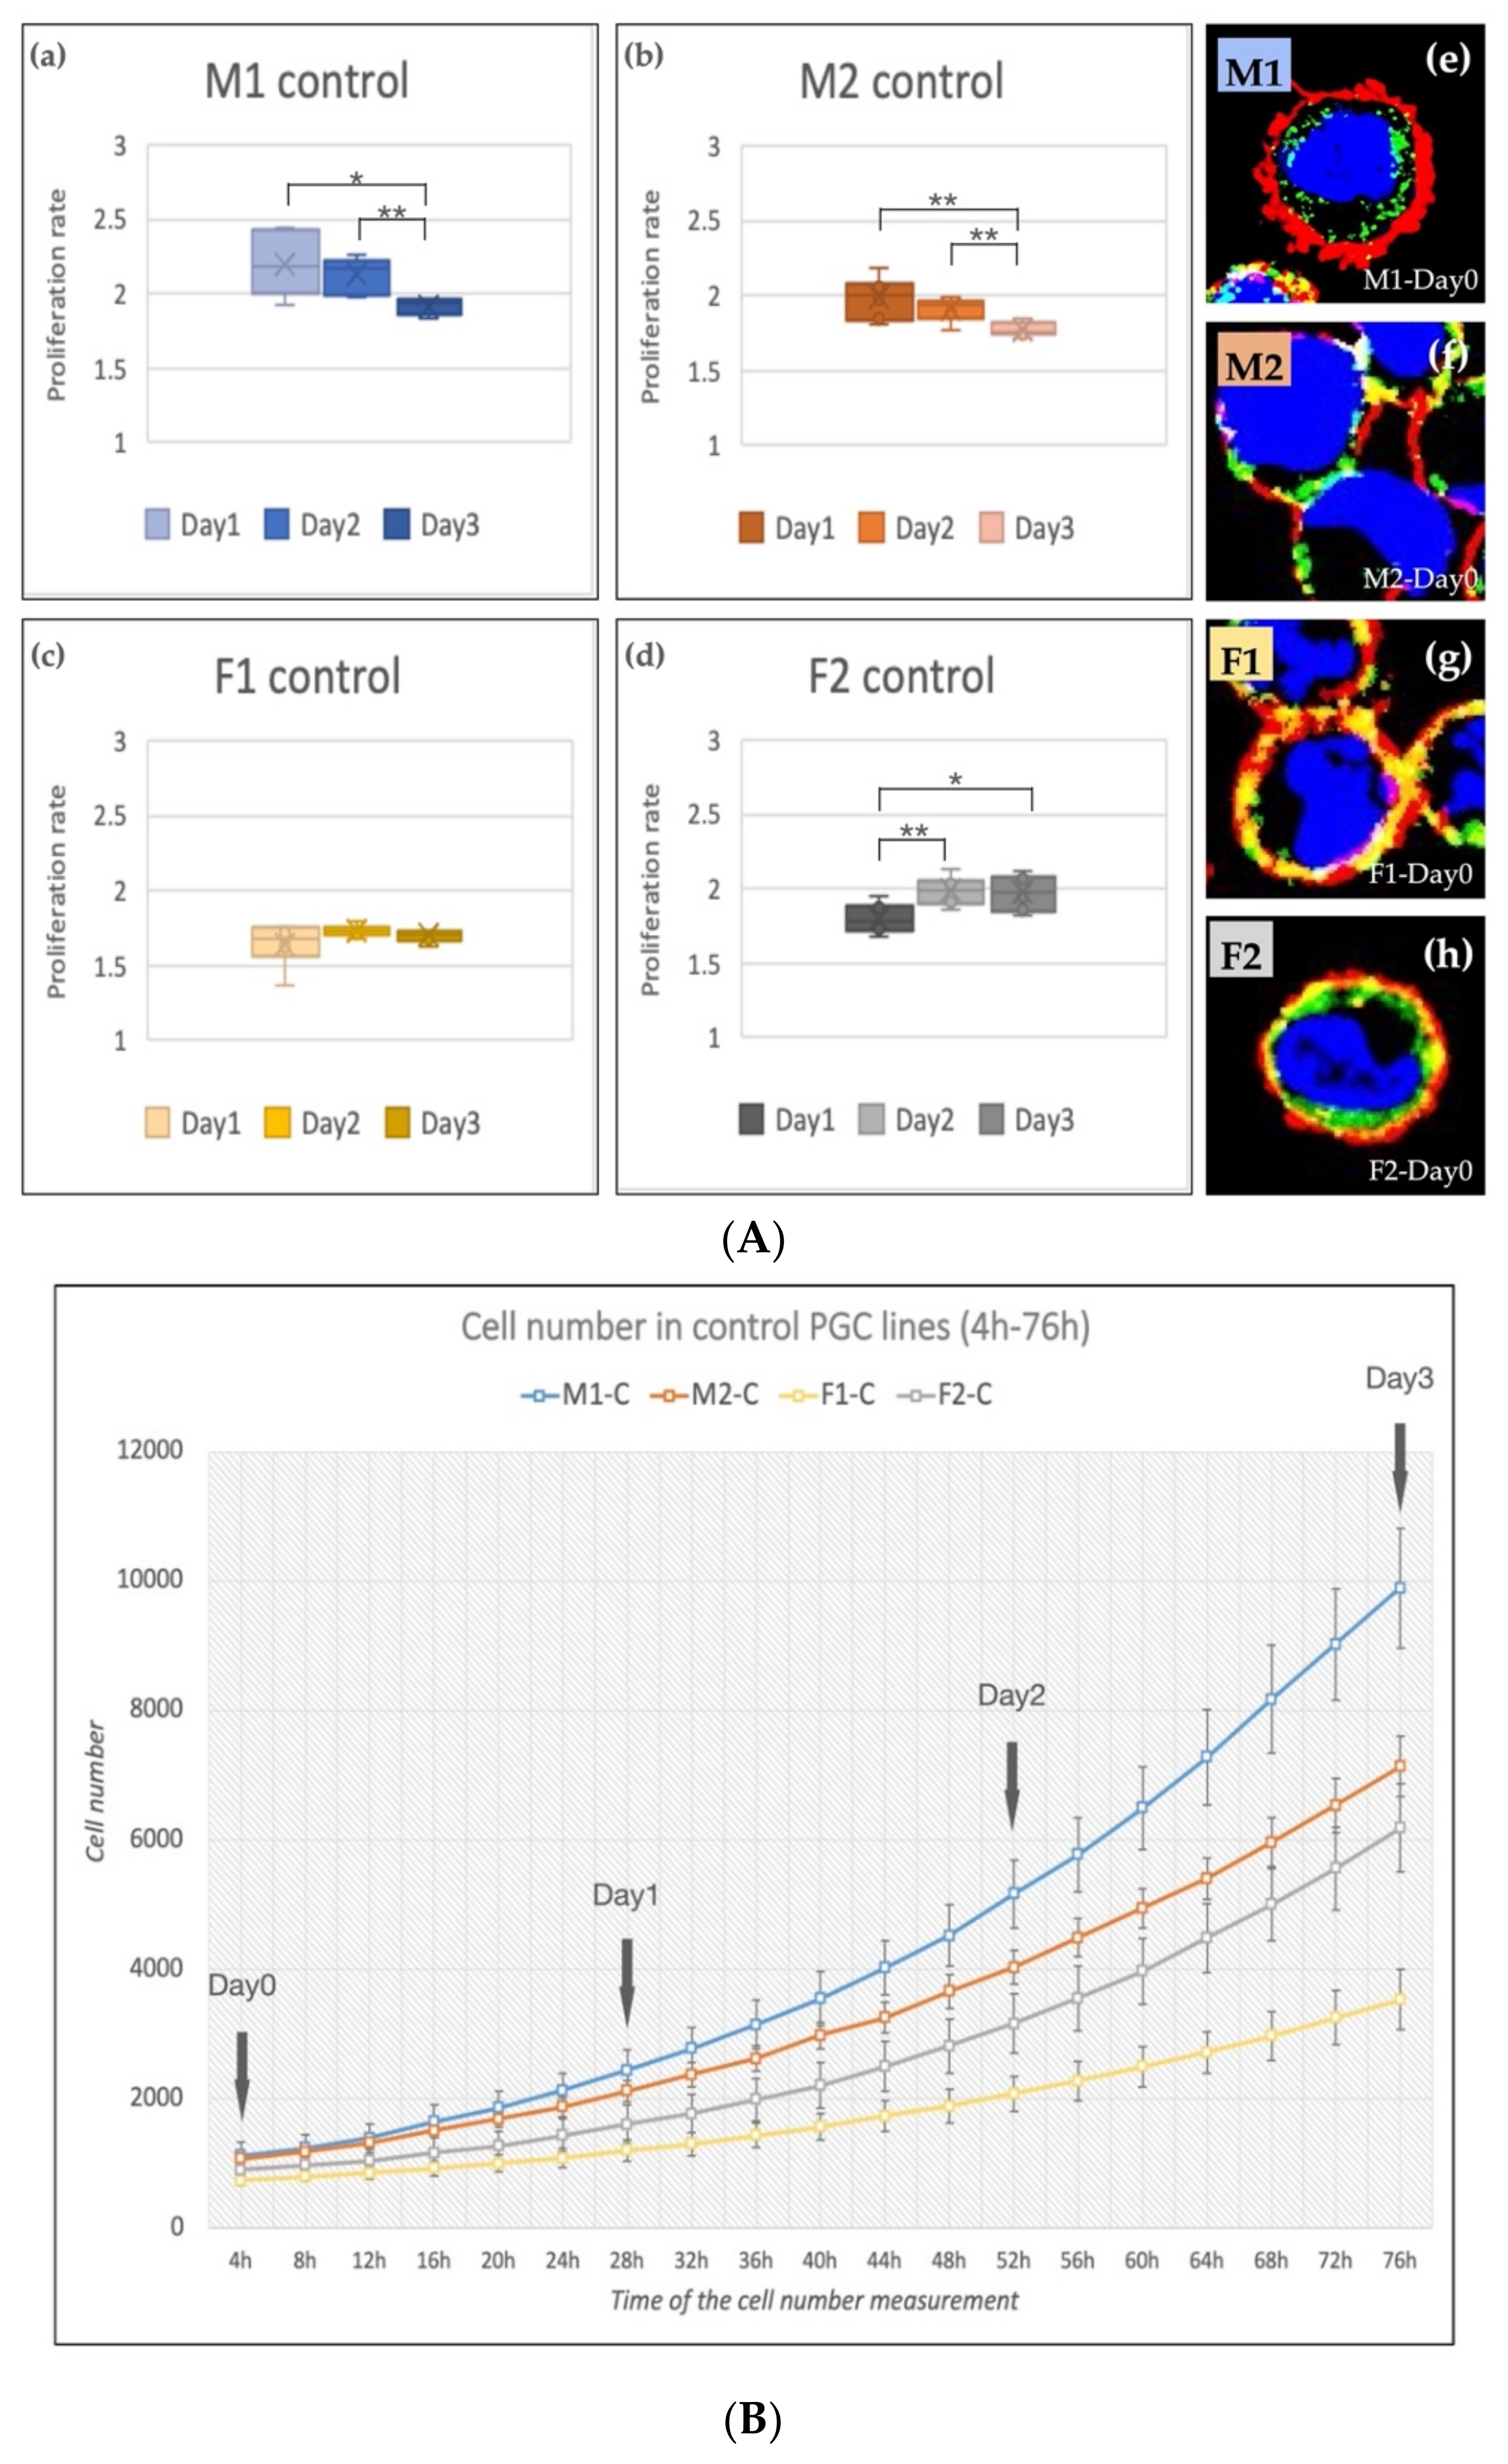
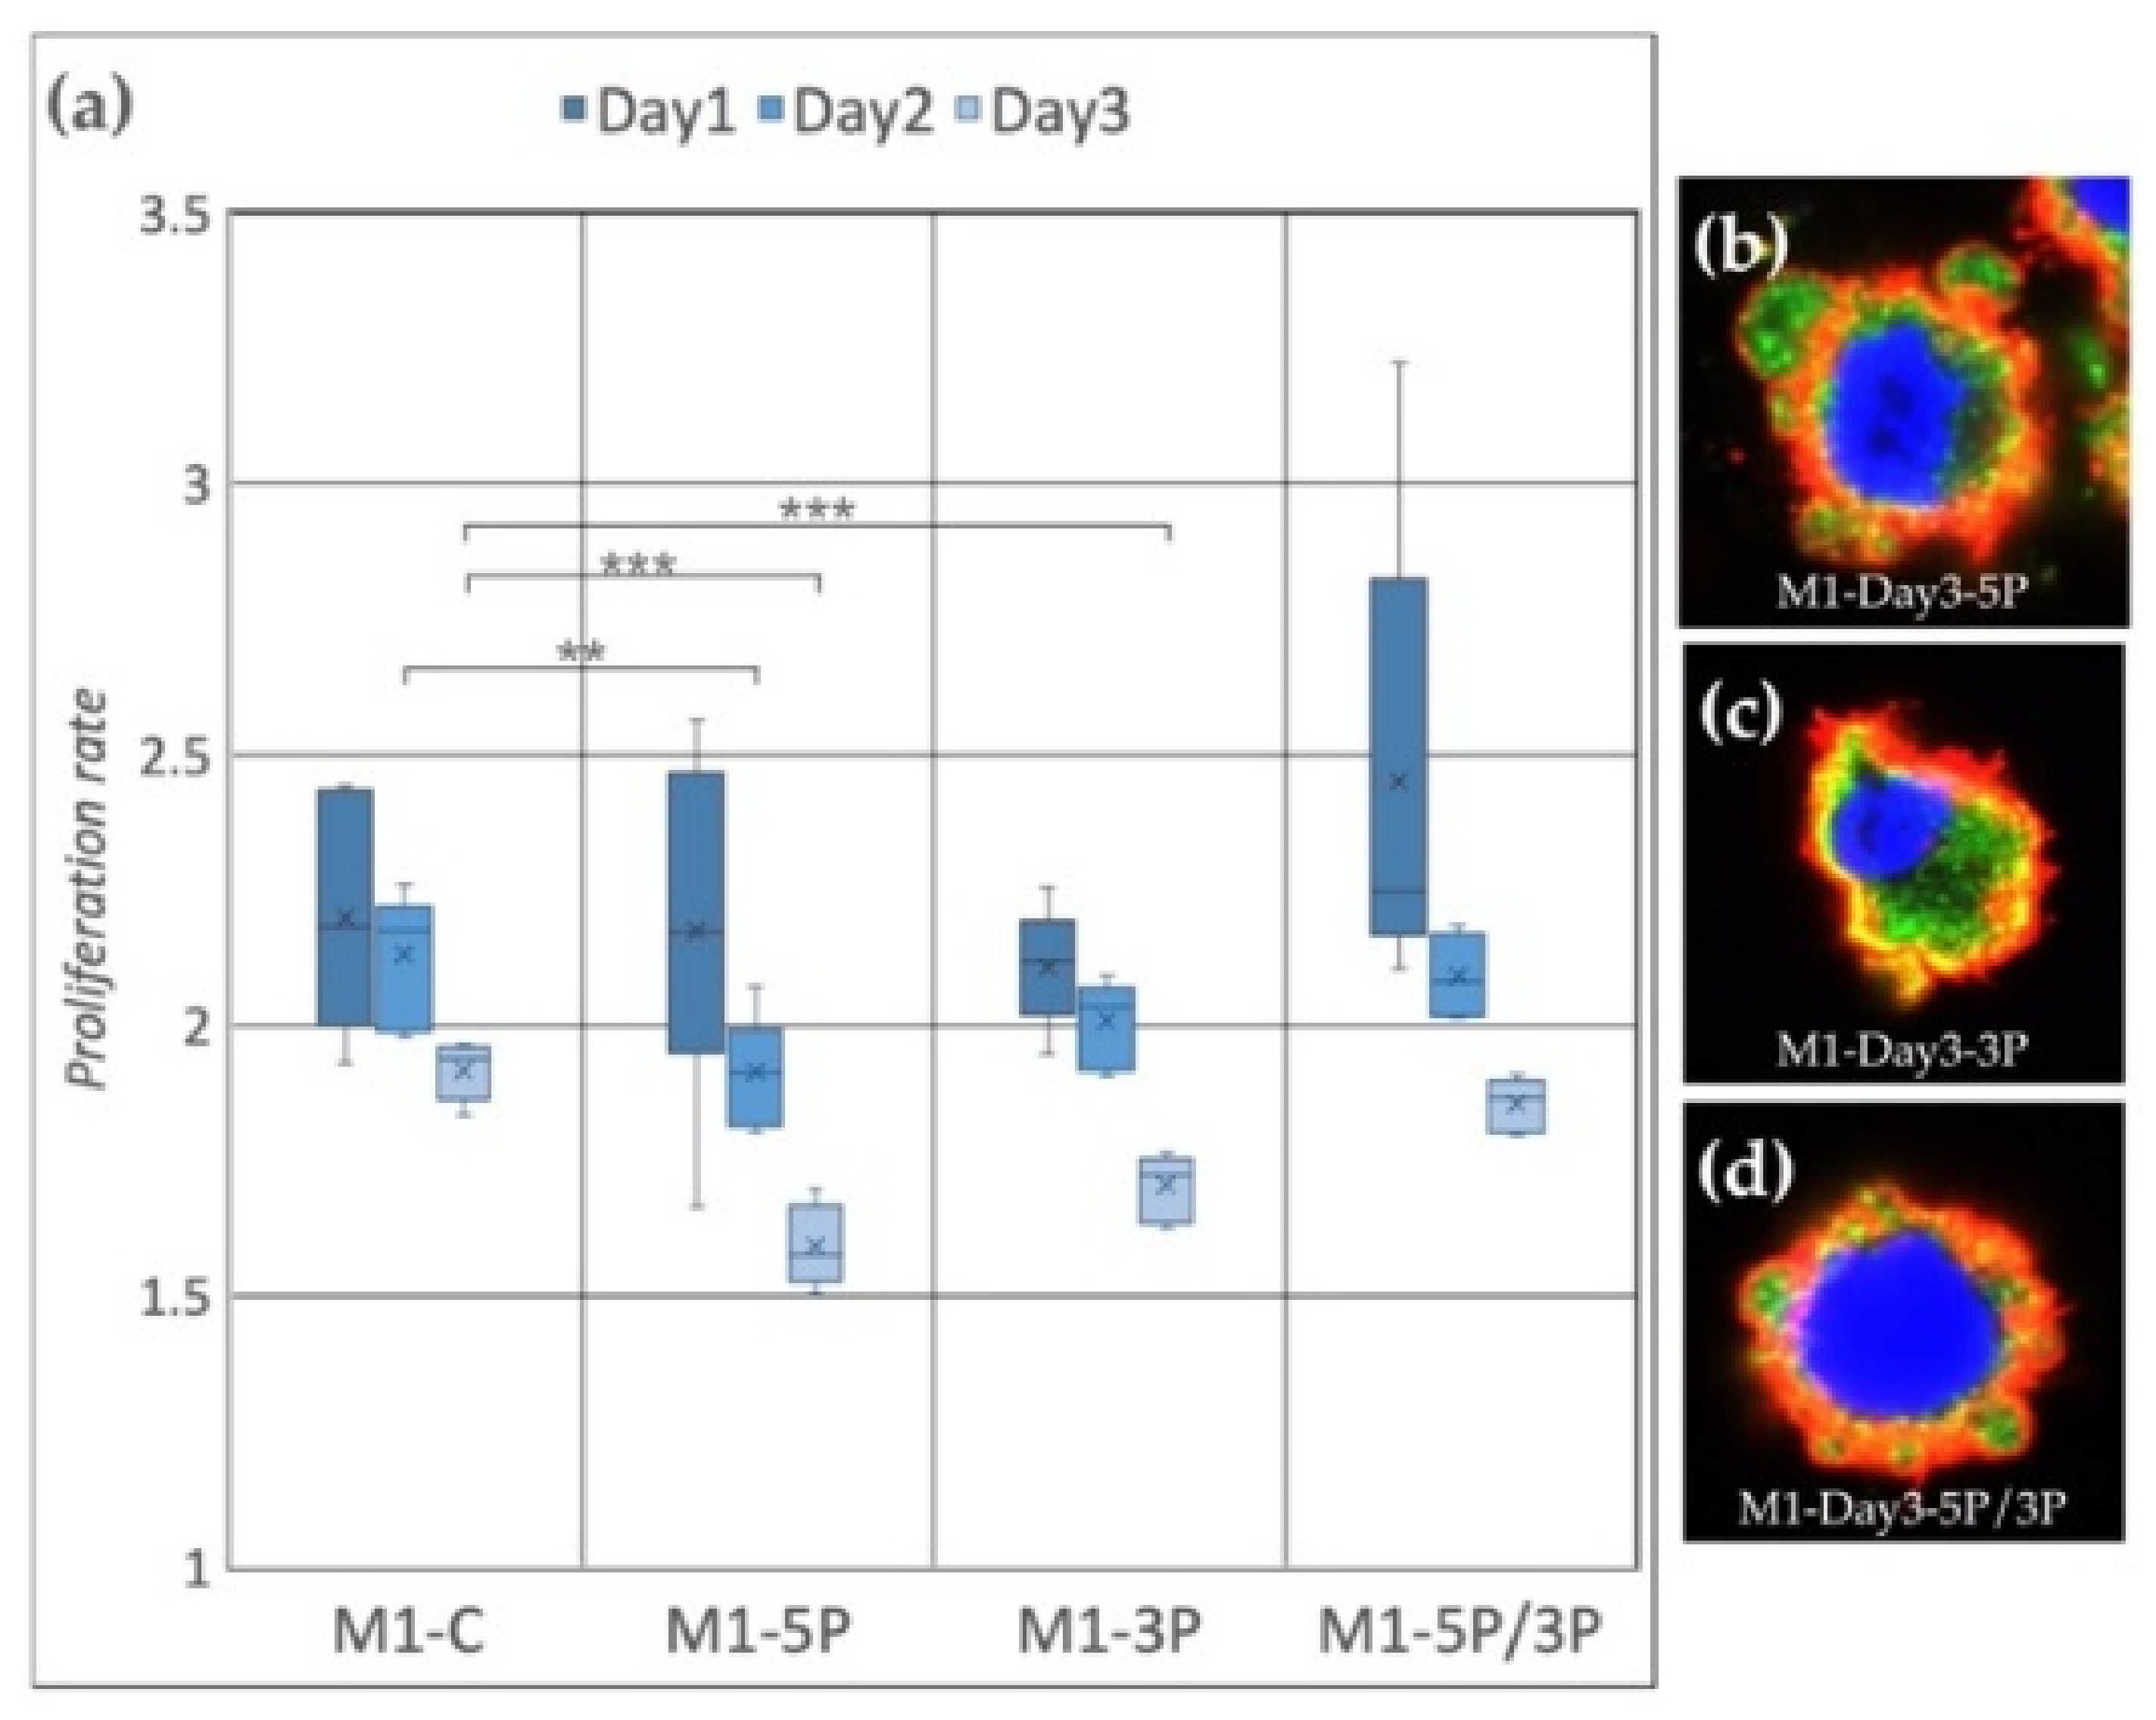
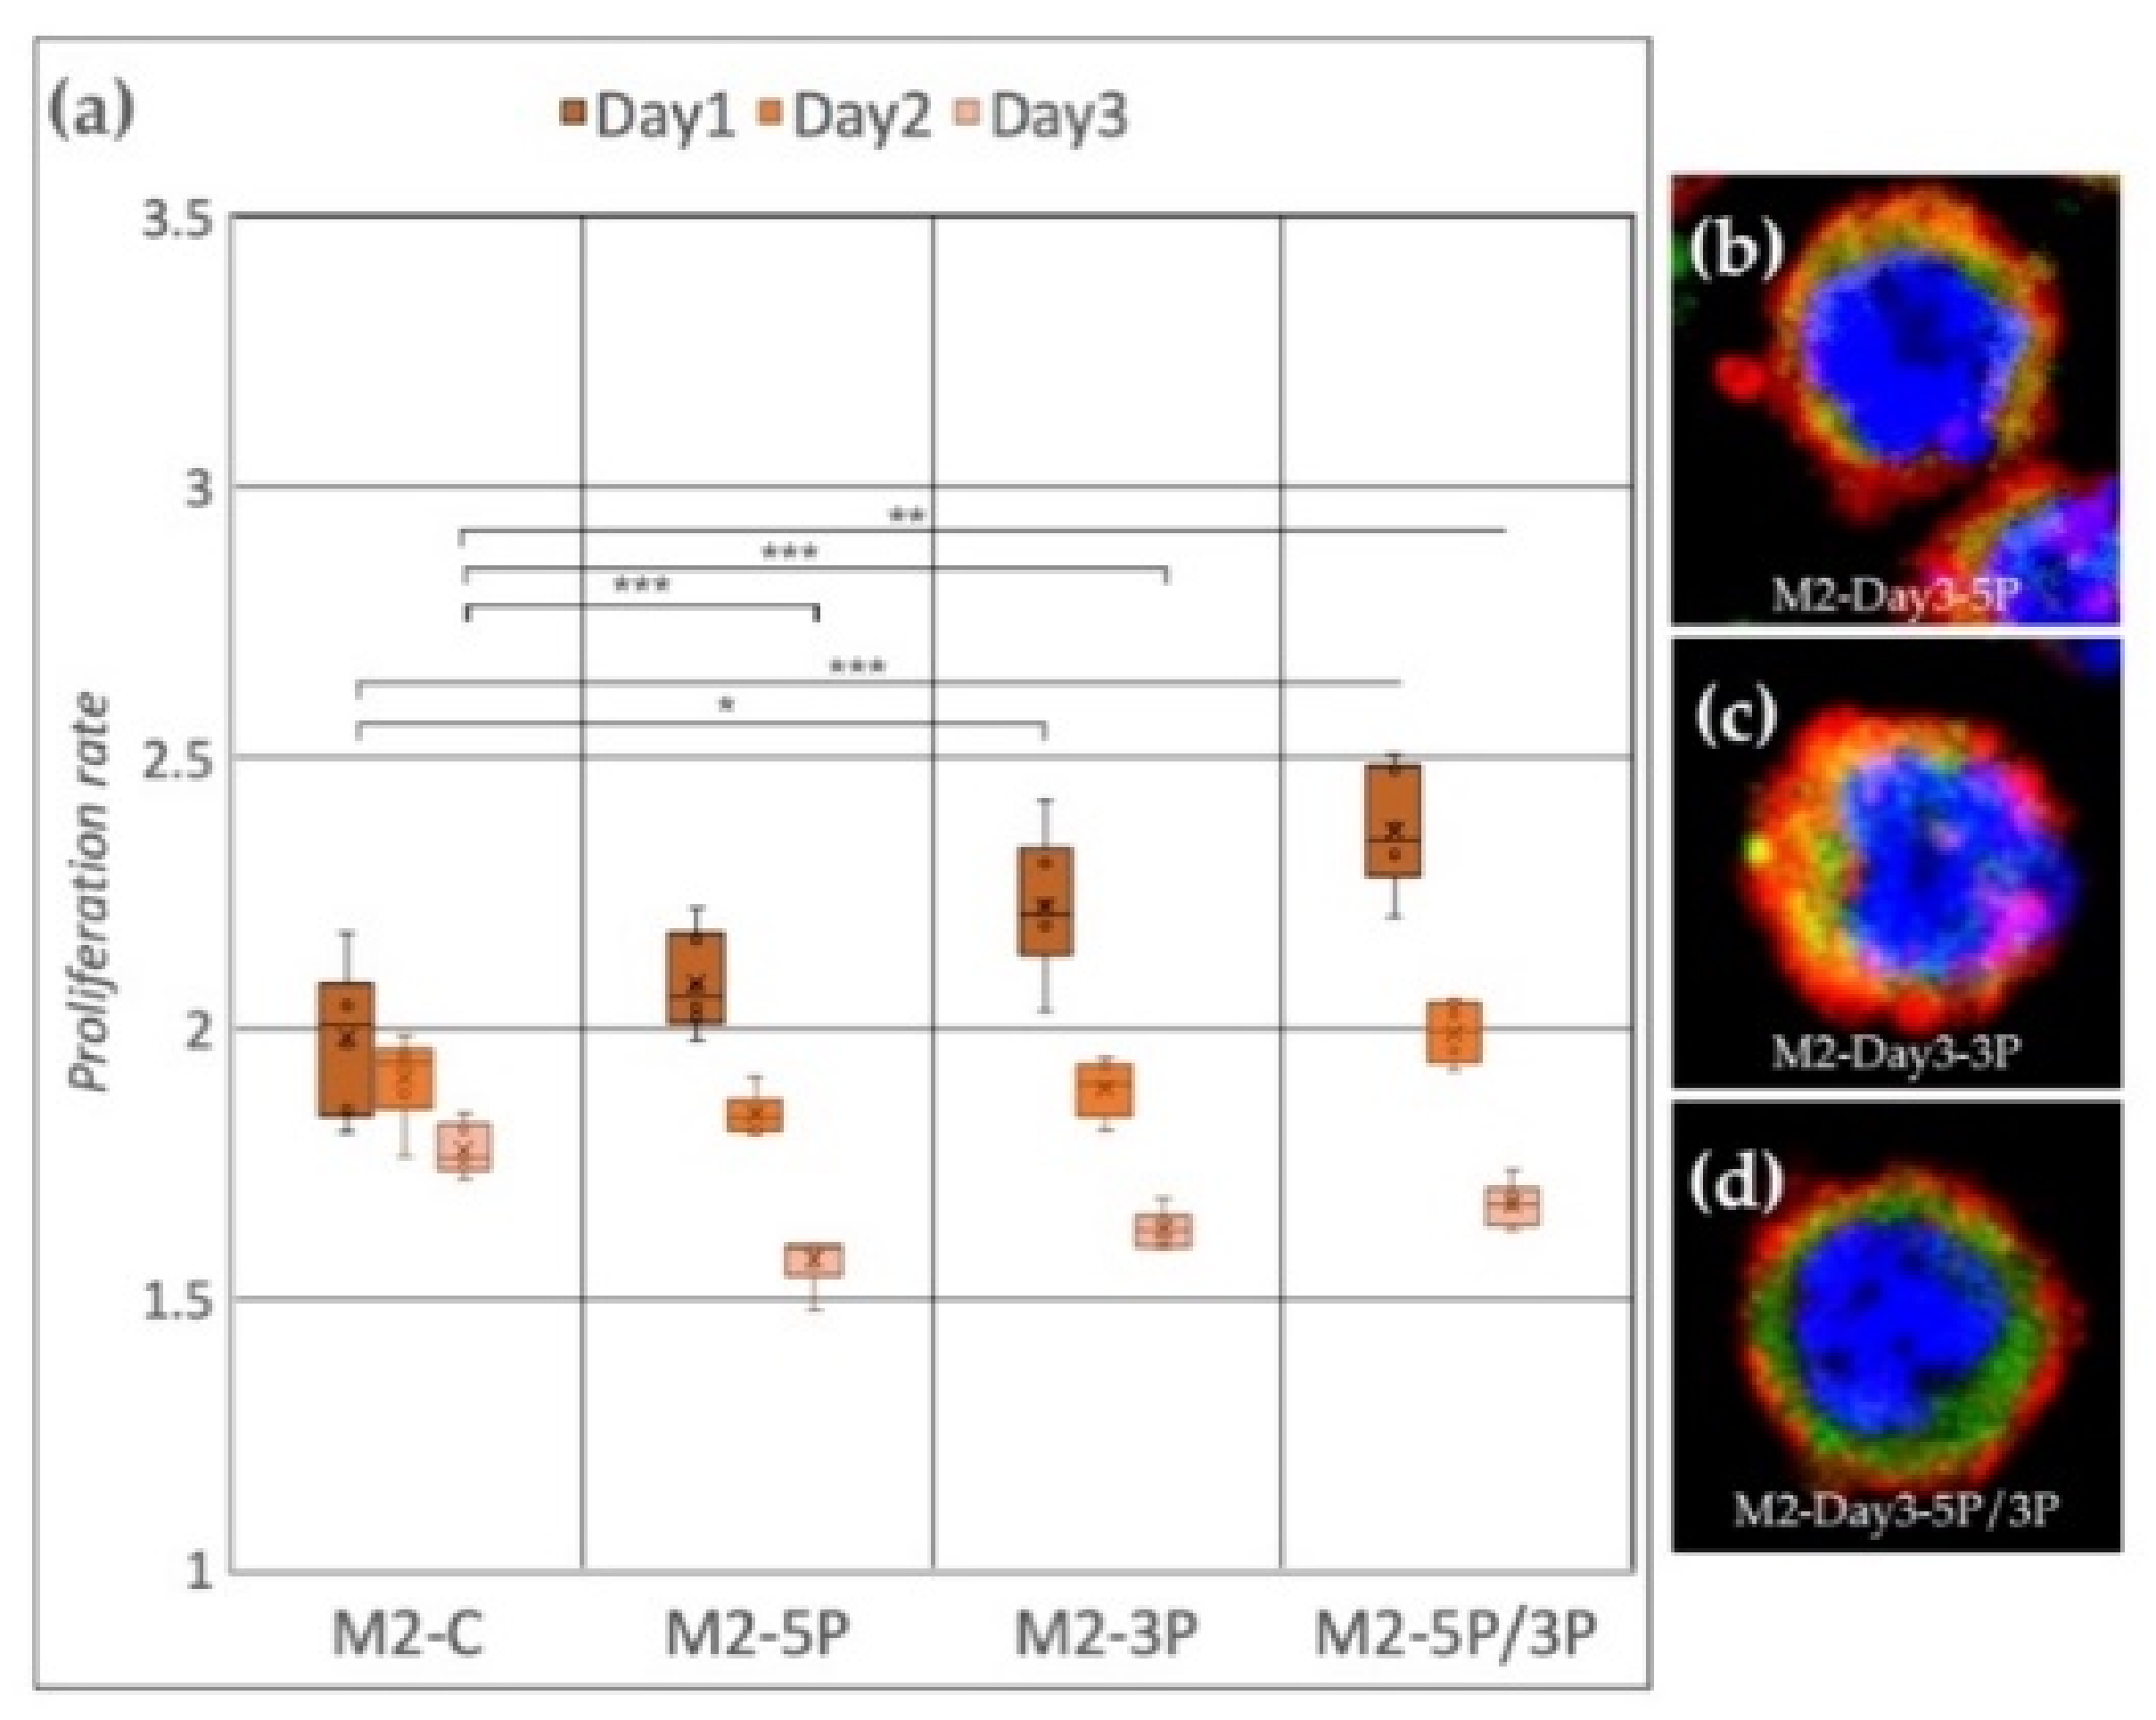
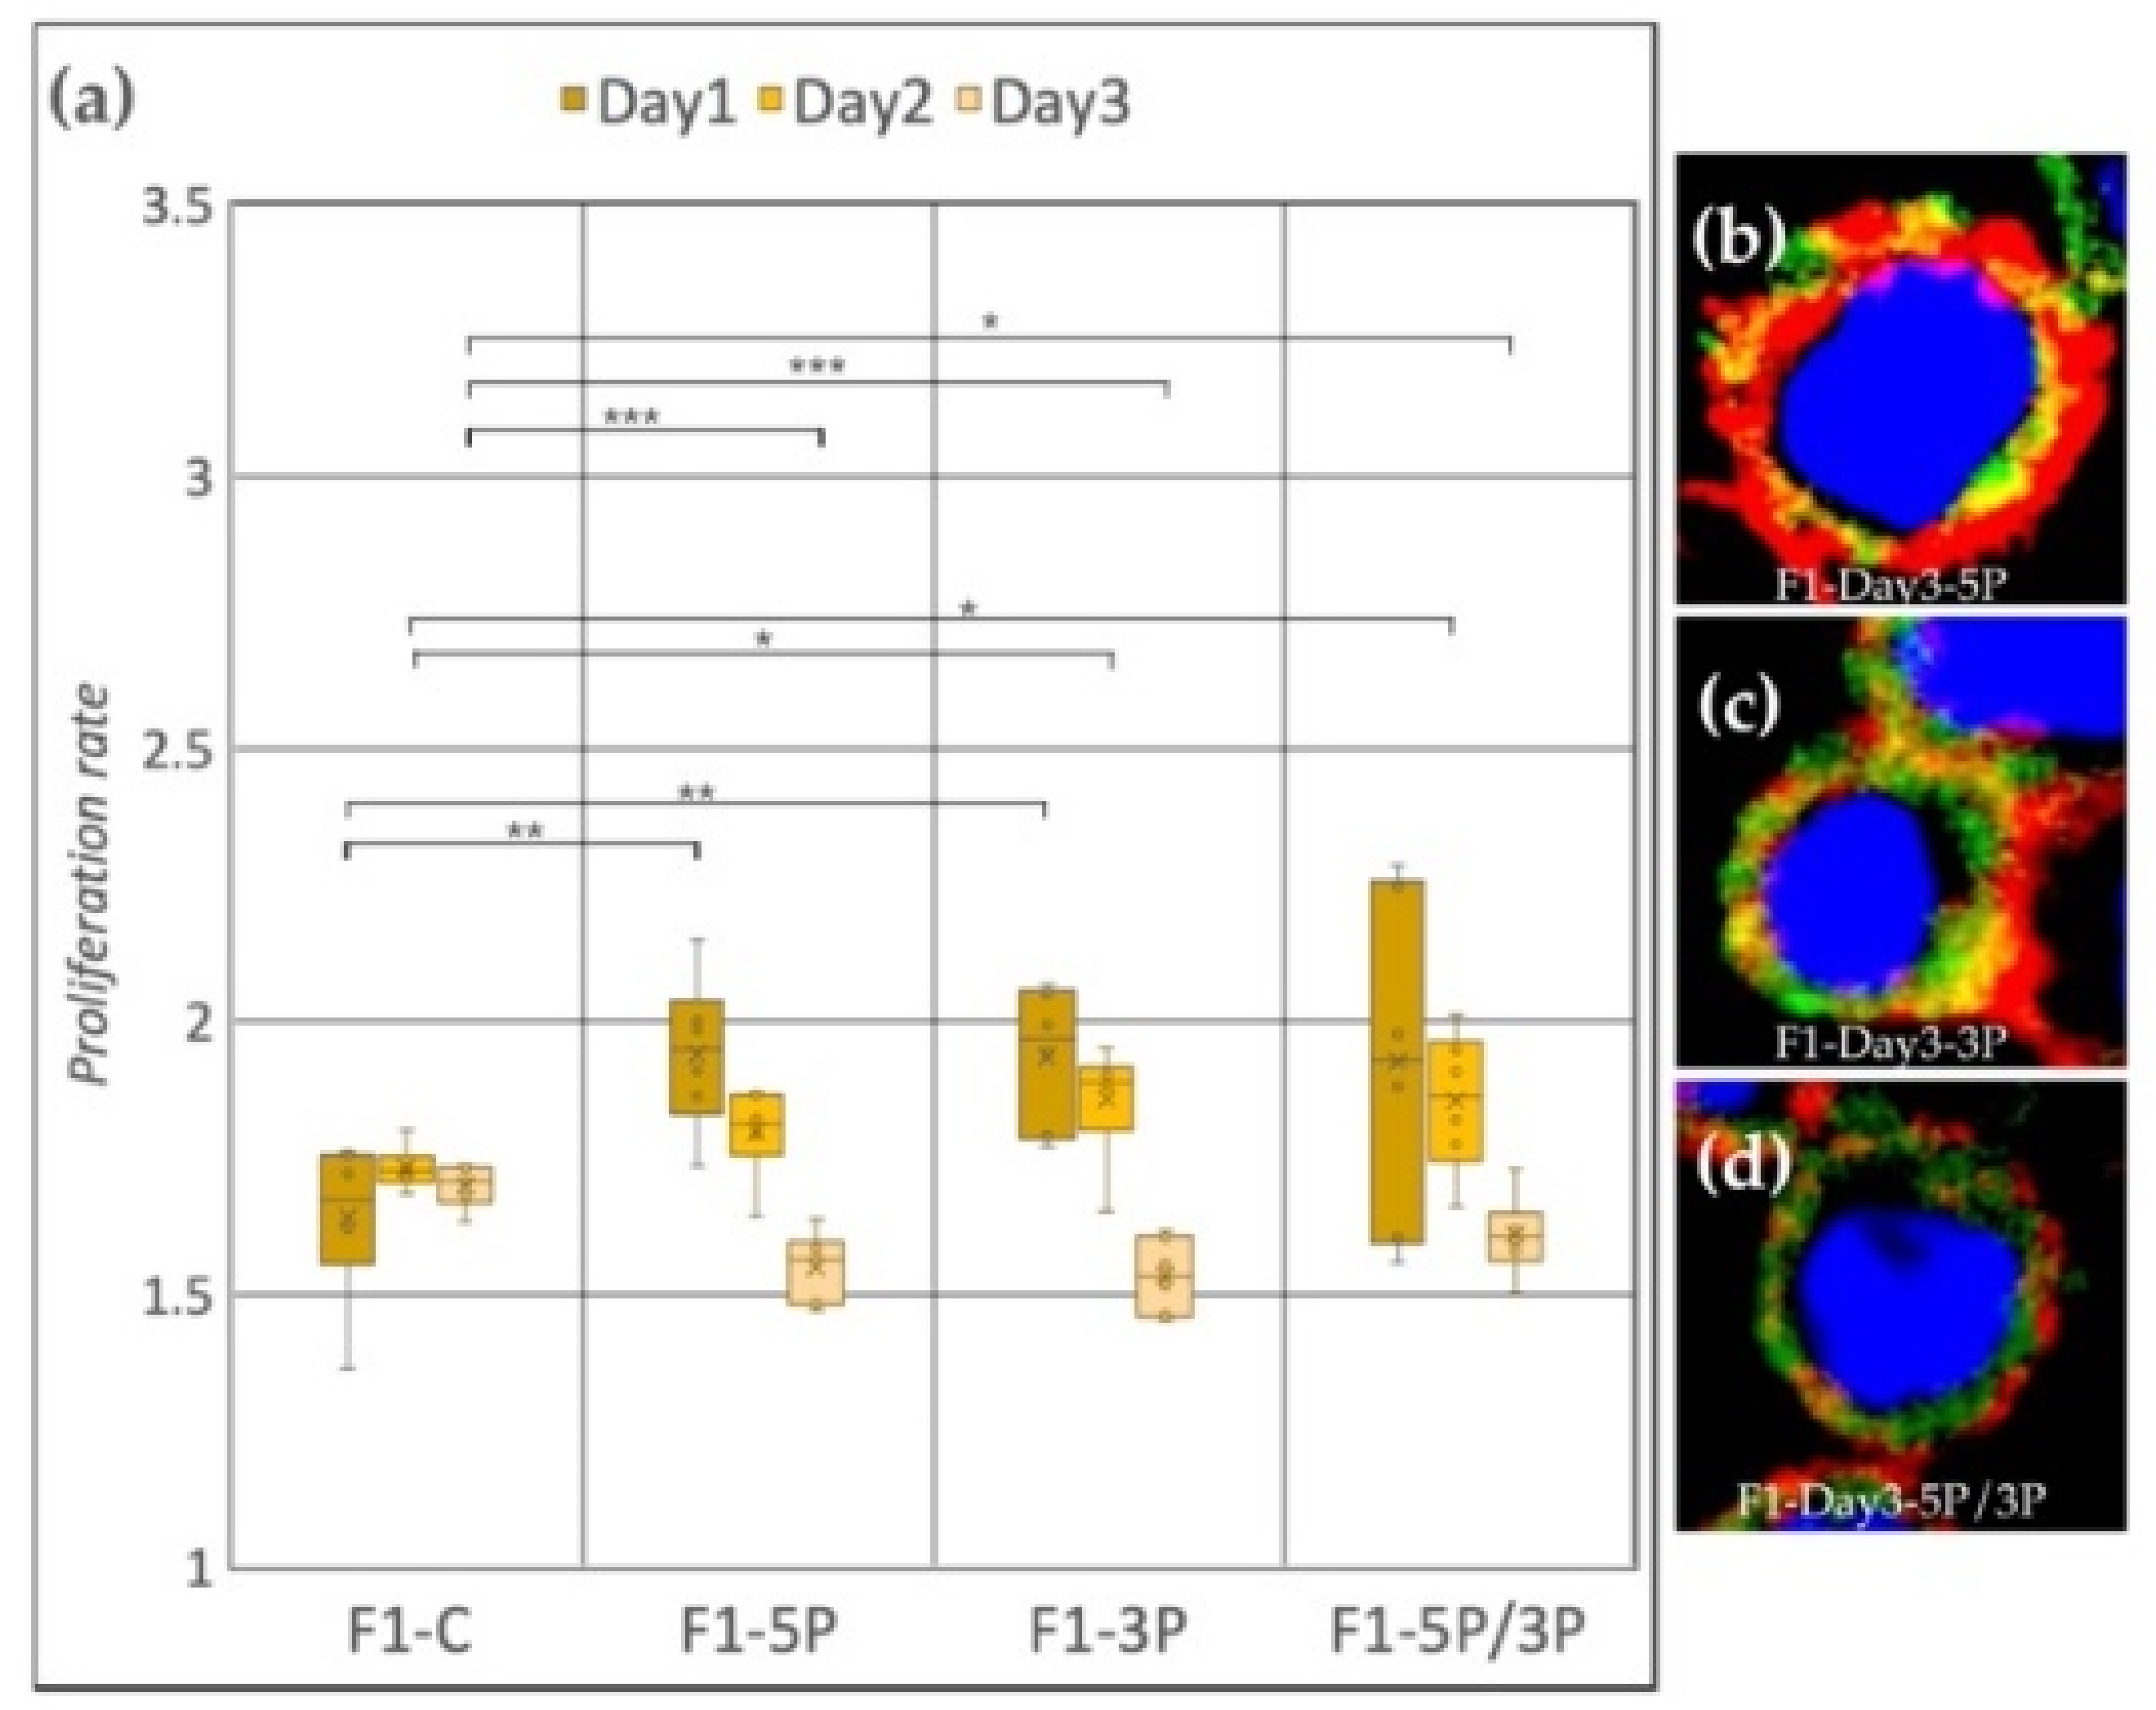
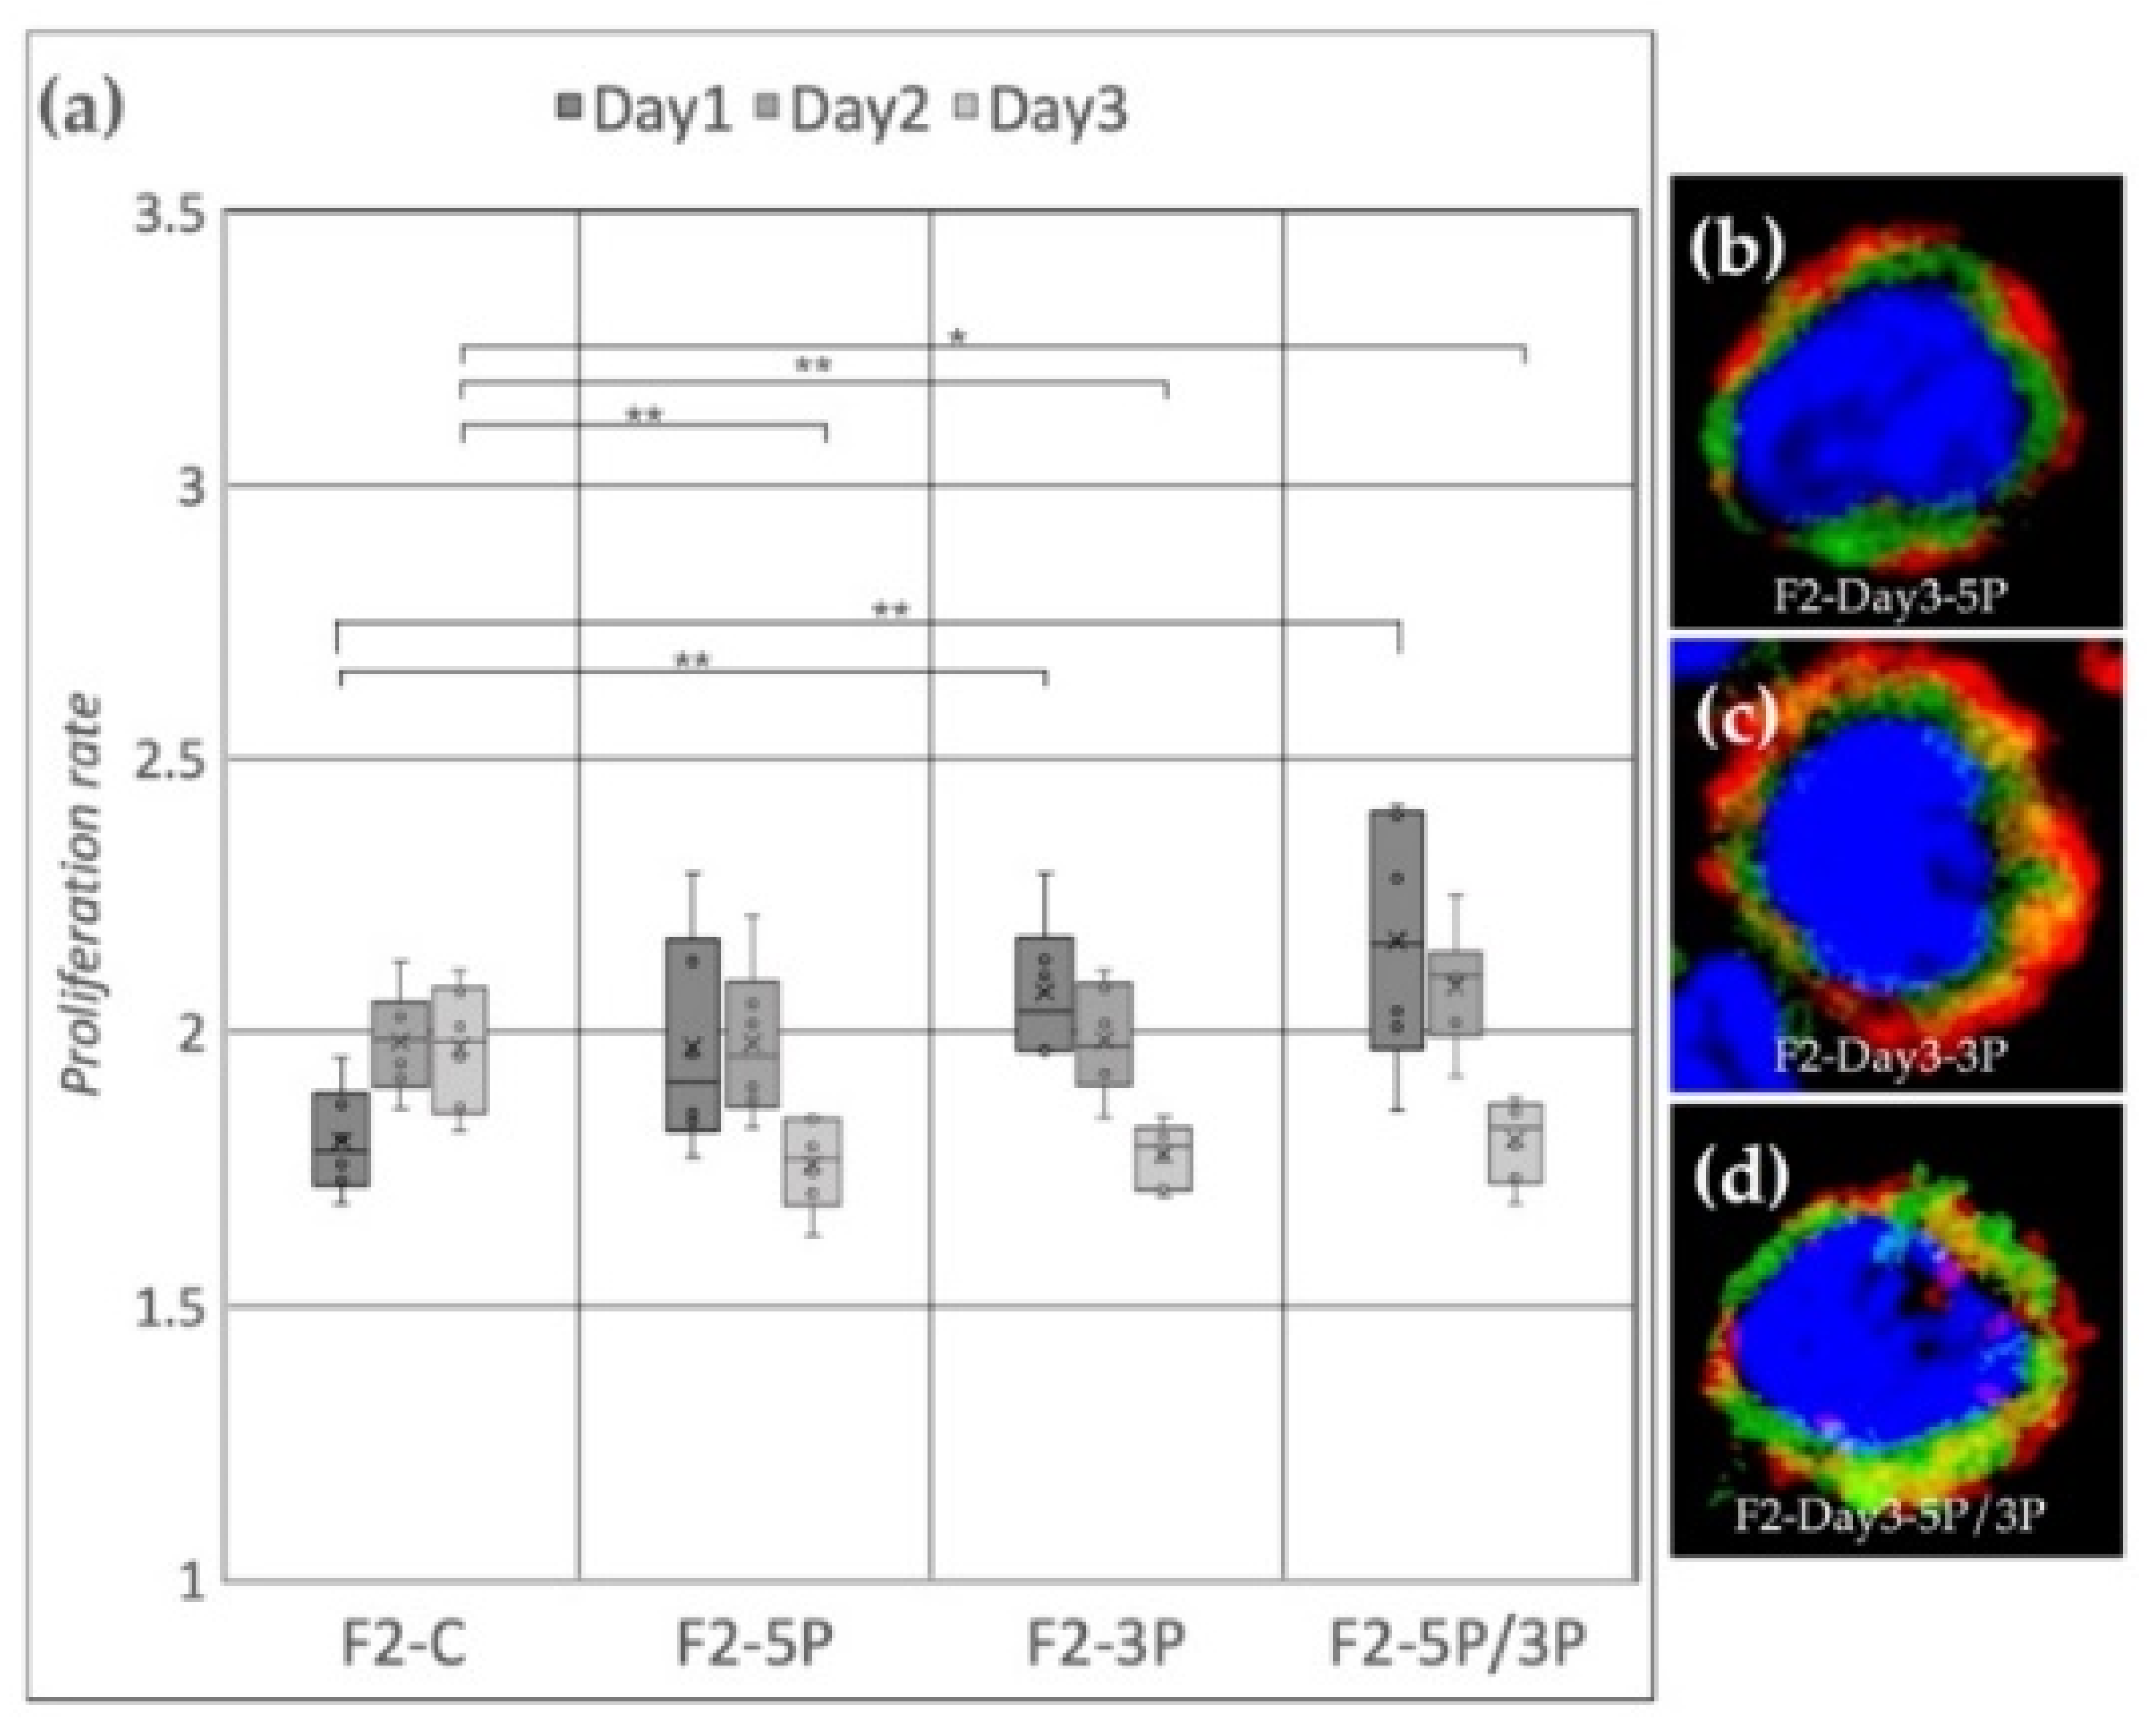
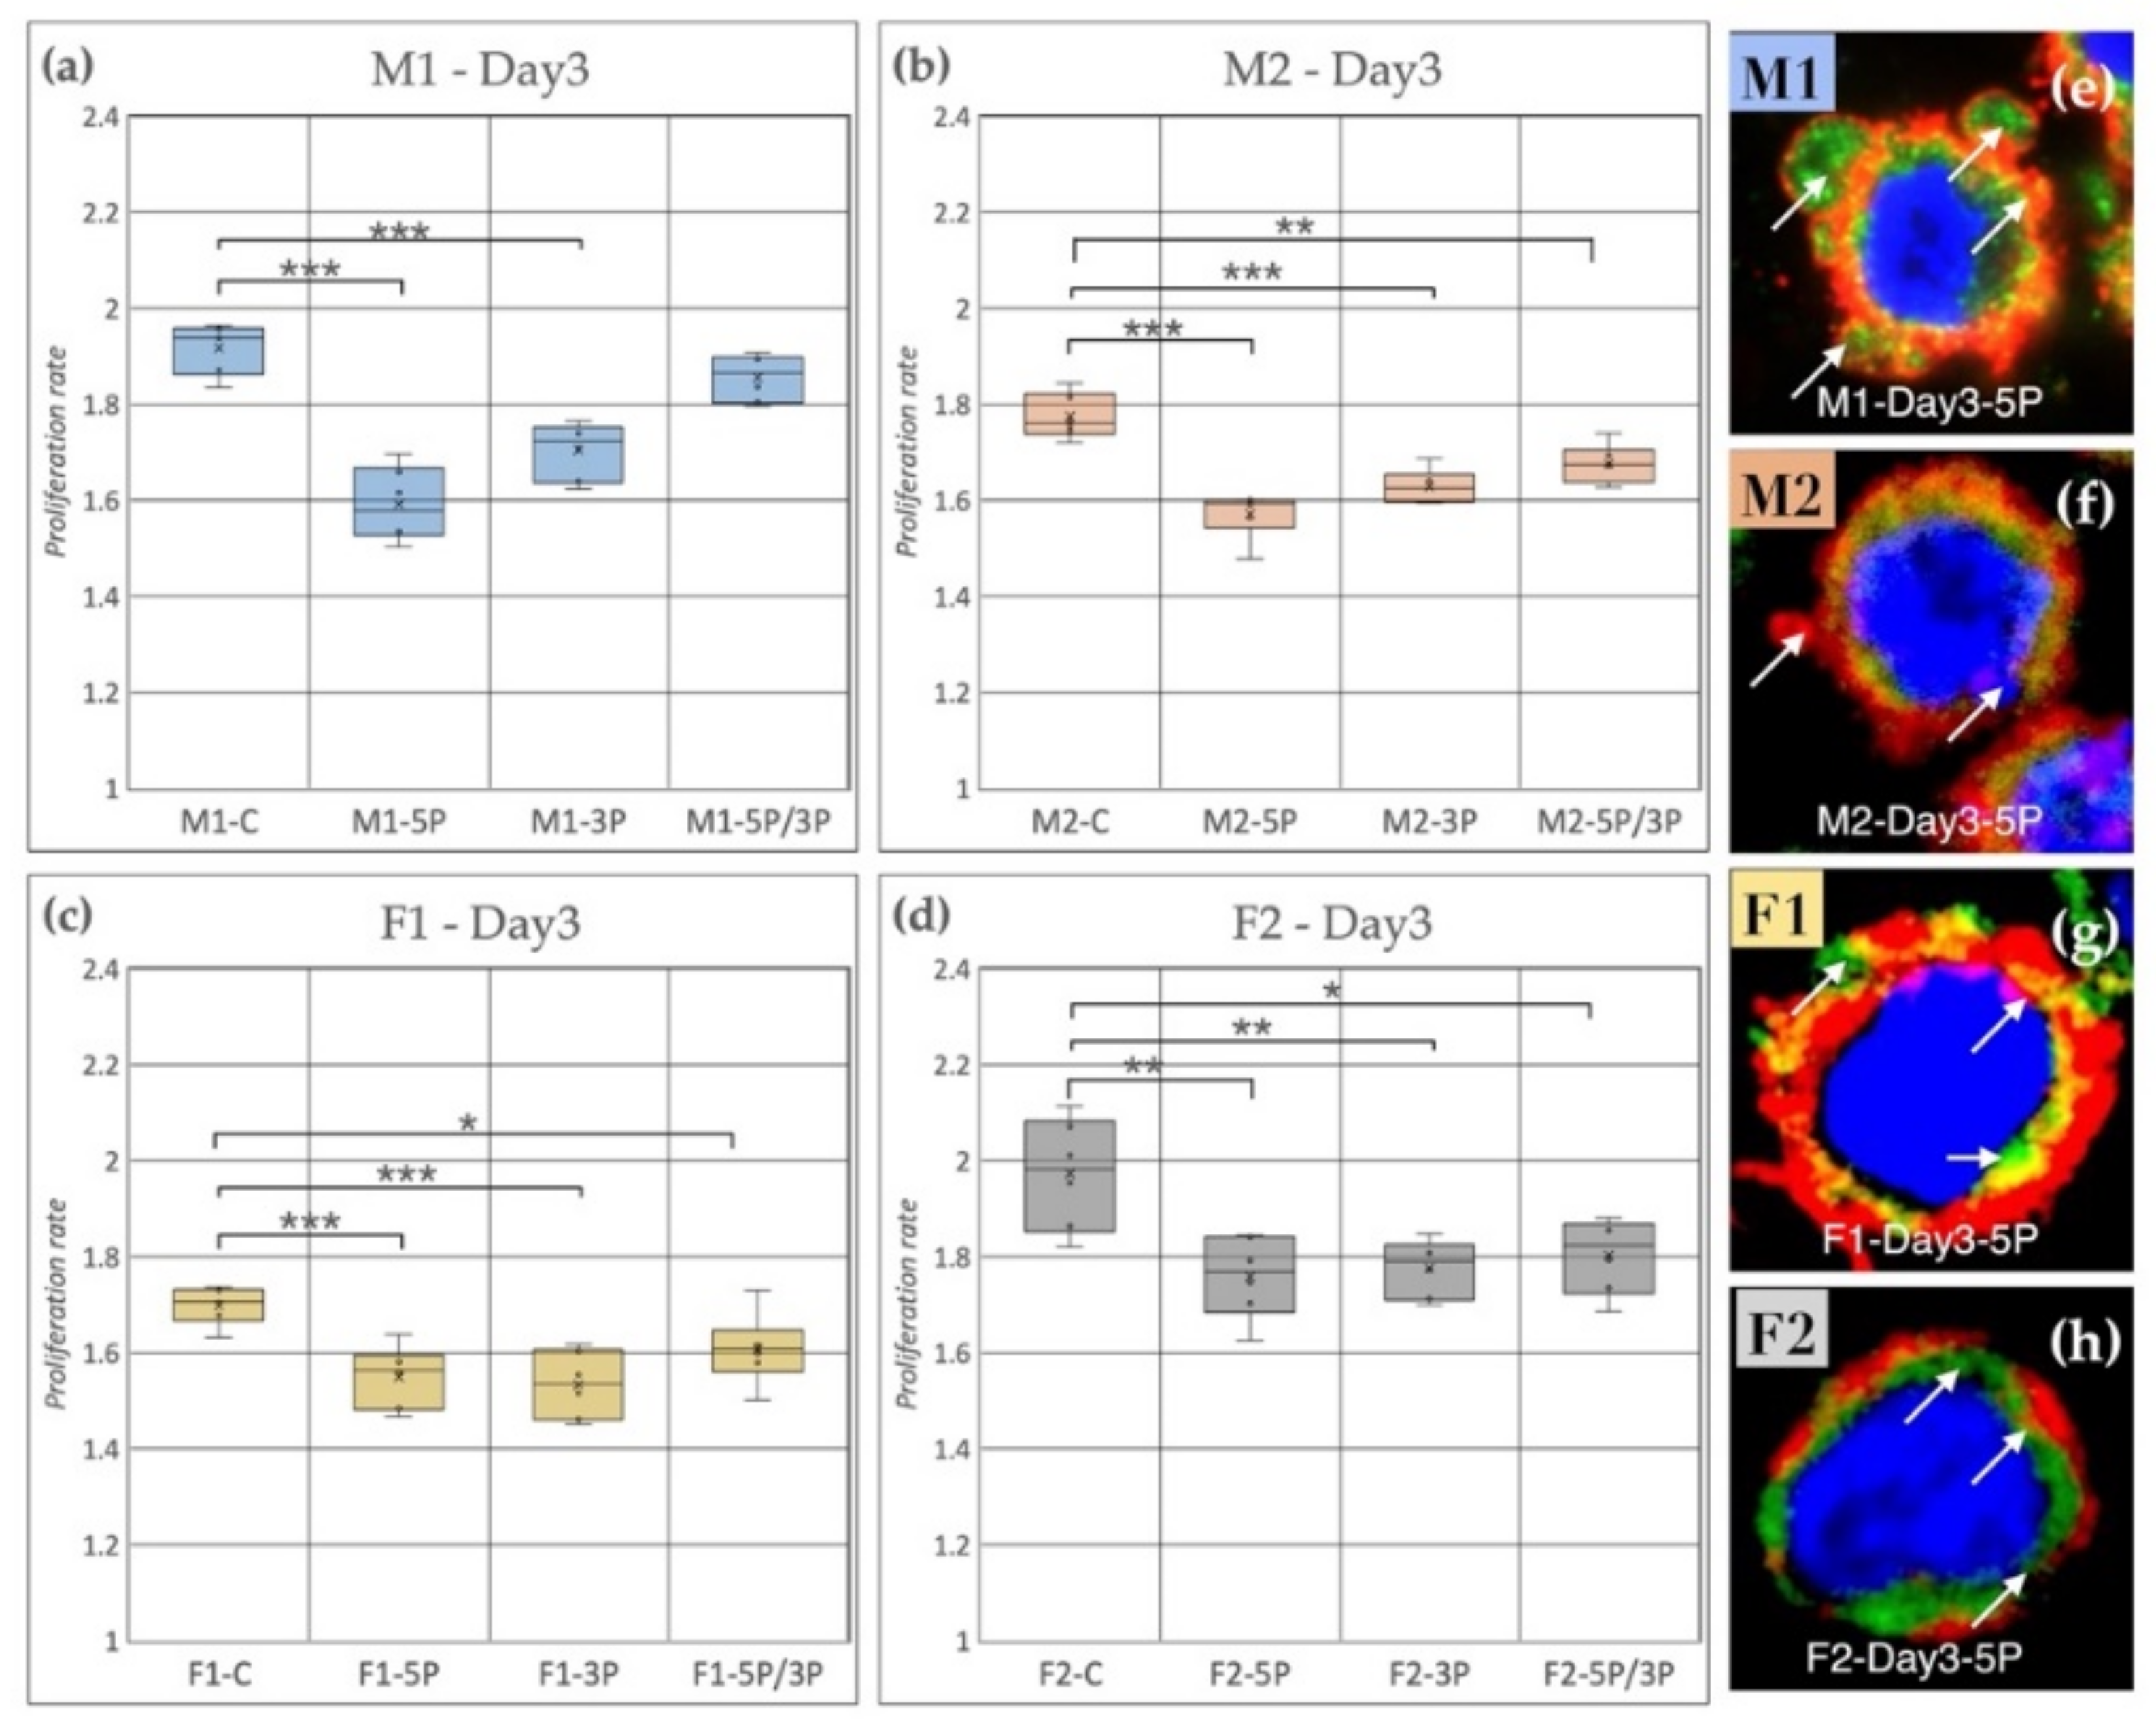
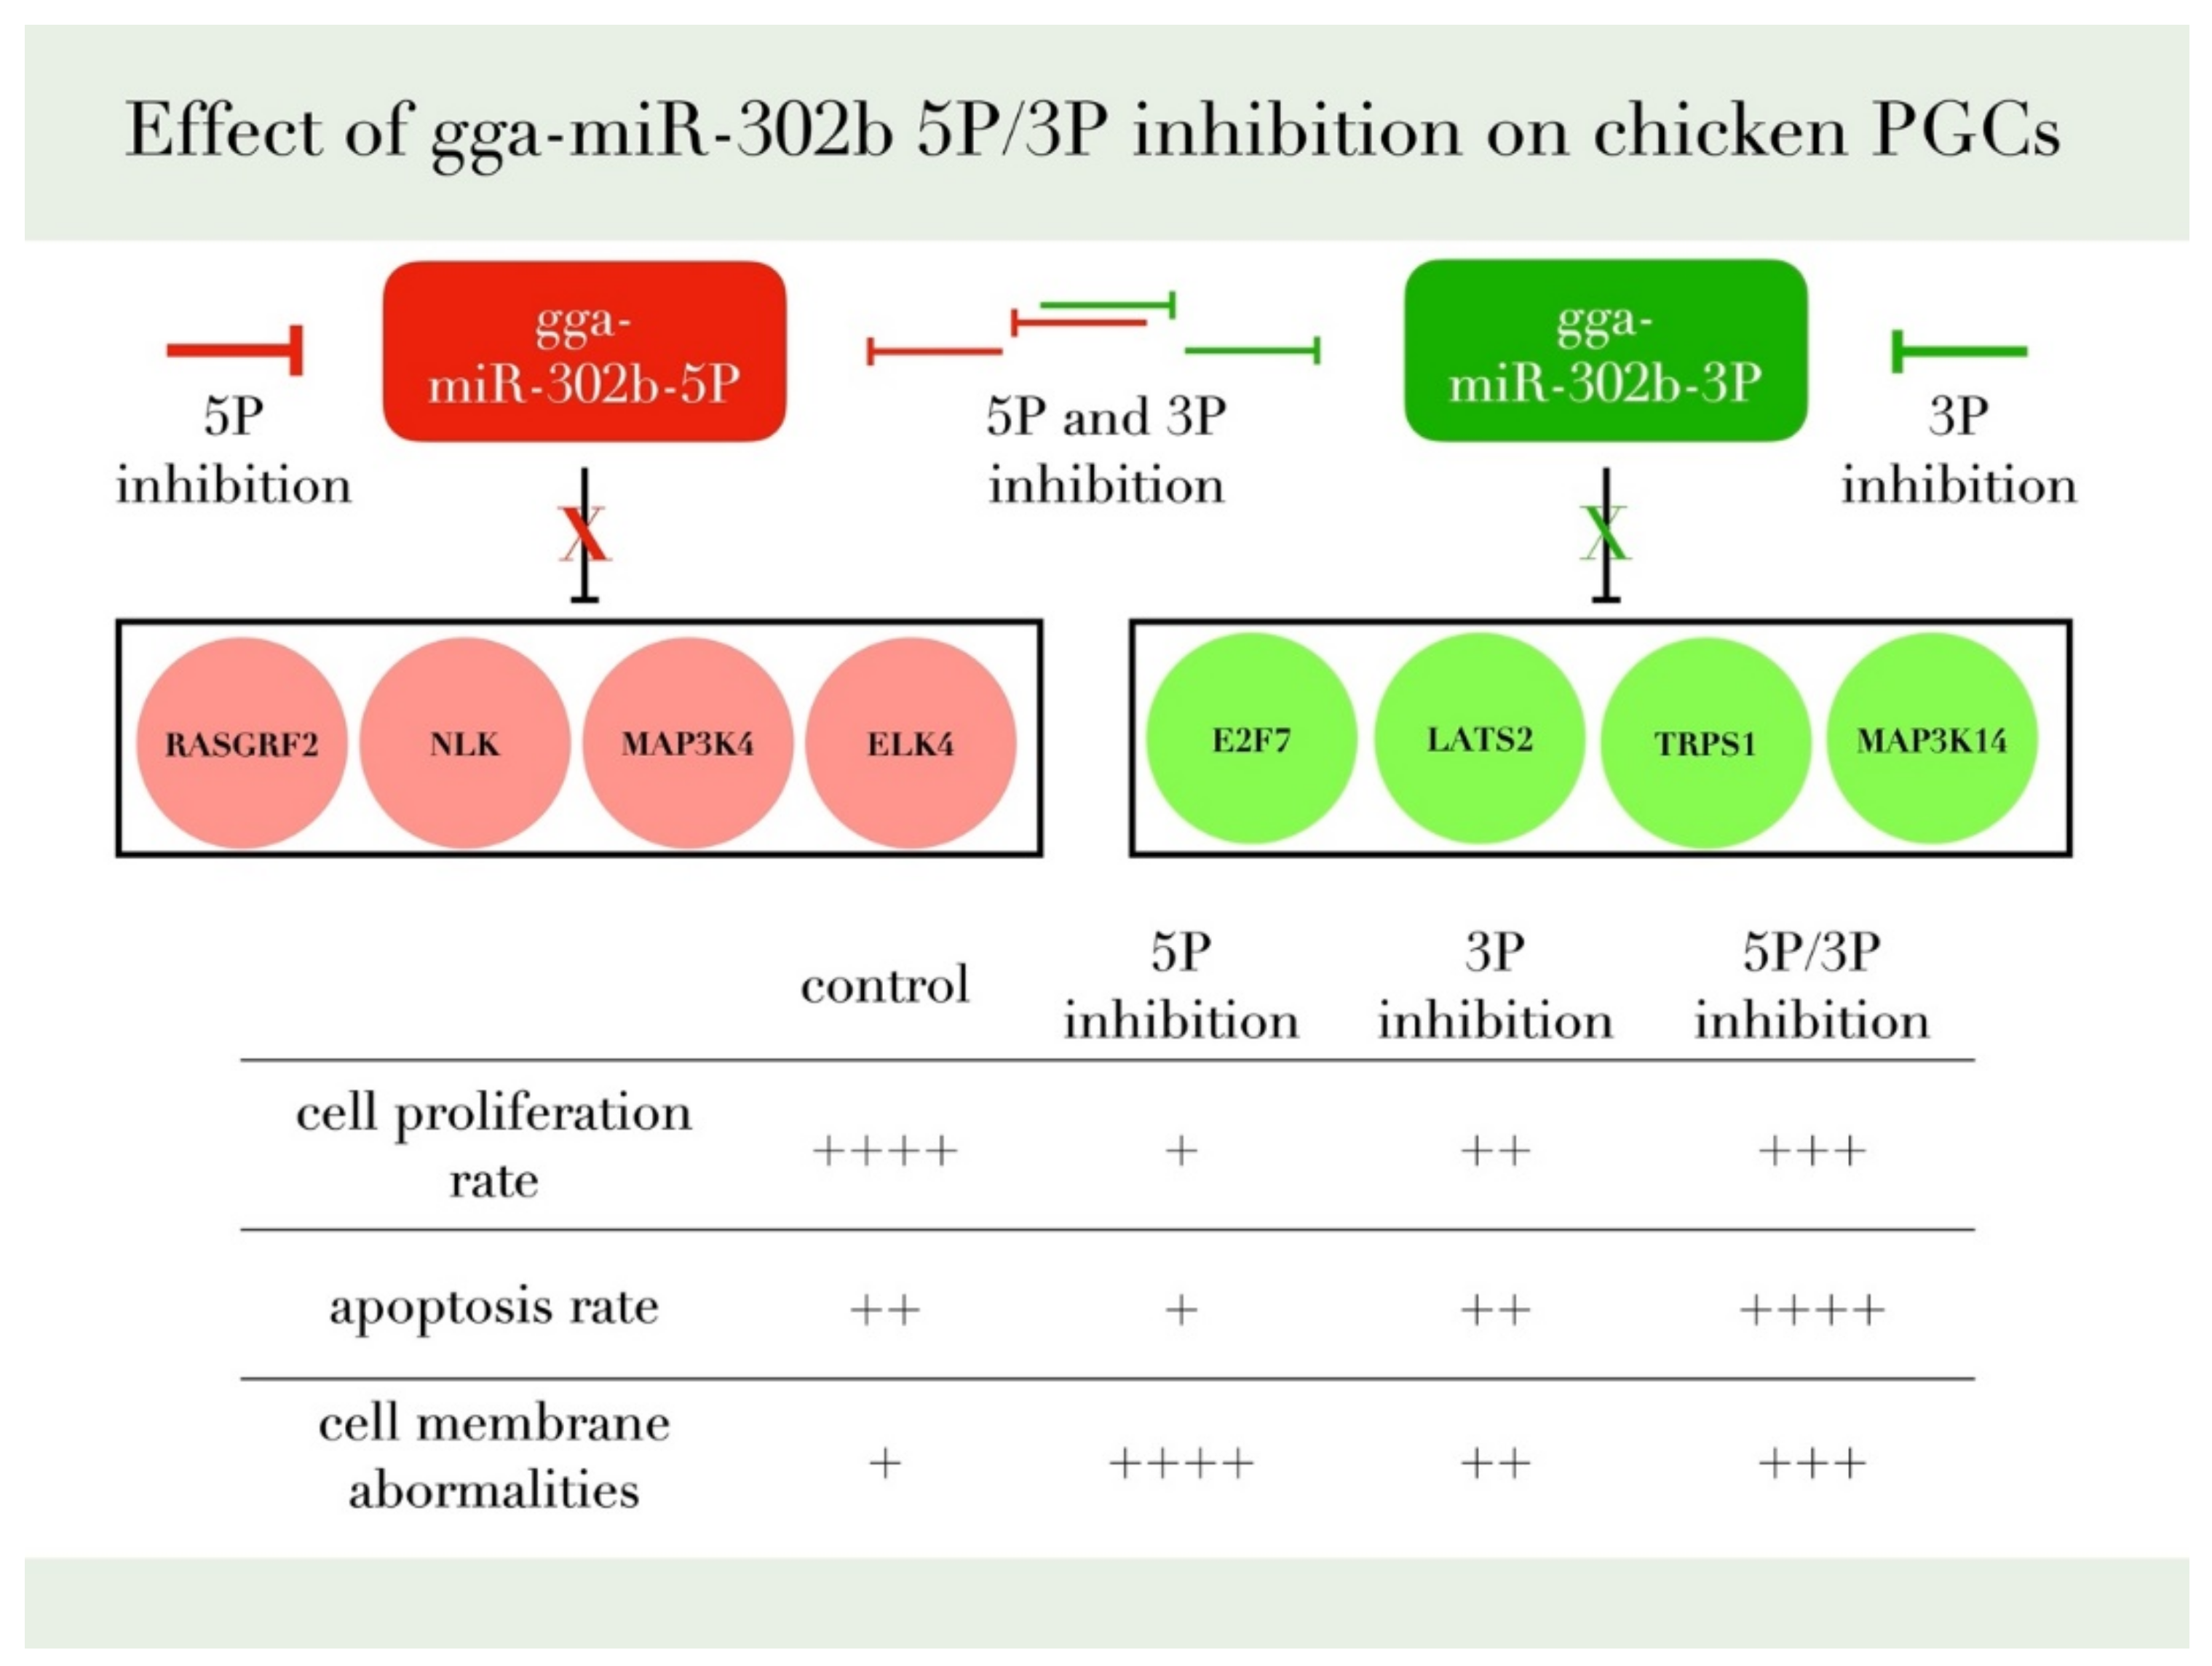
3.2. Effect of Anti-gga-miR-302b-5P, -3P and 5P/3P Inhibition on the Proliferation Rate of PGC Lines

We aimed to examine the proliferation rate of the PGCs on Day 1, Day 2 and Day 3 after the inhibition of gga-miR-302b-5P or gga-miR-302b-3P or the inhibition of both (Supplementary Figure S1).
In the case of the M1 cell line (Figure 4a), on Day 2, the proliferation rate of 5P inhibited cells was significantly lower compared to the control. On Day 3, both 5P and 3P inhibited lines showed lower proliferation rates. The dual inhibition did not cause any detectable differences. We fixed the cells after three days of cultivation. Immunostaining was performed to detect the expression of SSEA-1 (stem cell-specific cell surface marker) and CVH (germ cell-specific marker expressing in the cytoplasm) (Figure 4b–d). In the case of 5P inhibition (Figure 4b), cytoplasm blebbing on most of the cell surface was visible, while in the control condition on Day 0 and Day 3, we could not find membrane deformities (Supplementary Figures S2–S4). The staining of these protrusions showed that they contain only cytoplasm. No sign of nuclear degradation was visible.
Cell line M2 (ZZ genotype) (Figure 5a) showed a significant proliferation rate increase compared to the control after inhibition of 3P and 5P/3P on Day 1. On Day 2, no difference was observed between the treated and the control groups. On Day 3, all three inhibitions caused the proliferation to slow down. Small protrusions of the cytoplasm were present only after inhibiting against the 5P (Figure 5b–d).
Cell line F1 (ZW genotype) (Figure 6a) showed a significant proliferation rate increase compared to the control after inhibition of 5P and 3P on Day 1. On Day 2, also significant proliferation rate increase was observed, but in the case of 3P and 5P/3P inhibition. Then, on Day 3, all three inhibitions caused the proliferation to slow down. Small protrusions of the cytoplasm were present after all inhibition treatments (Figure 6b–d).
Cell line F2 (ZW genotype) (Figure 7a) showed a significant proliferation rate increase compared to the control after 3P and 5P/3P inhibition on Day 1. On Day 2, no difference was observed between the treated and the control groups. Then, on Day 3, all three inhibitions caused the proliferation to slow down. Small protrusions of the cytoplasm were present after 3P and 5P/3P inhibition (Figure 7c,d).
Based on our results, we can conclude that, on the third day of the experiment, inhibition of 5P and 3P caused a drastic decrease in the proliferation rate for all cell lines compared to the control (Figure 8); however, the time scale of inhibition was different in the cell lines. Figure 8 shows the proliferation rate comparison on Day 3. It is visible that the control samples had significantly higher proliferation rates in the case of M2, F1, F2 (Figure 8b–d) than the treated ones. M1 PGCs did not show a difference compared to control after 5P/3P inhibition (Figure 8a).
It is also shown by the immunostaining that the 5P inhibited lines had a higher amount of blebbing cells than the other conditions (Figure 8e–h).

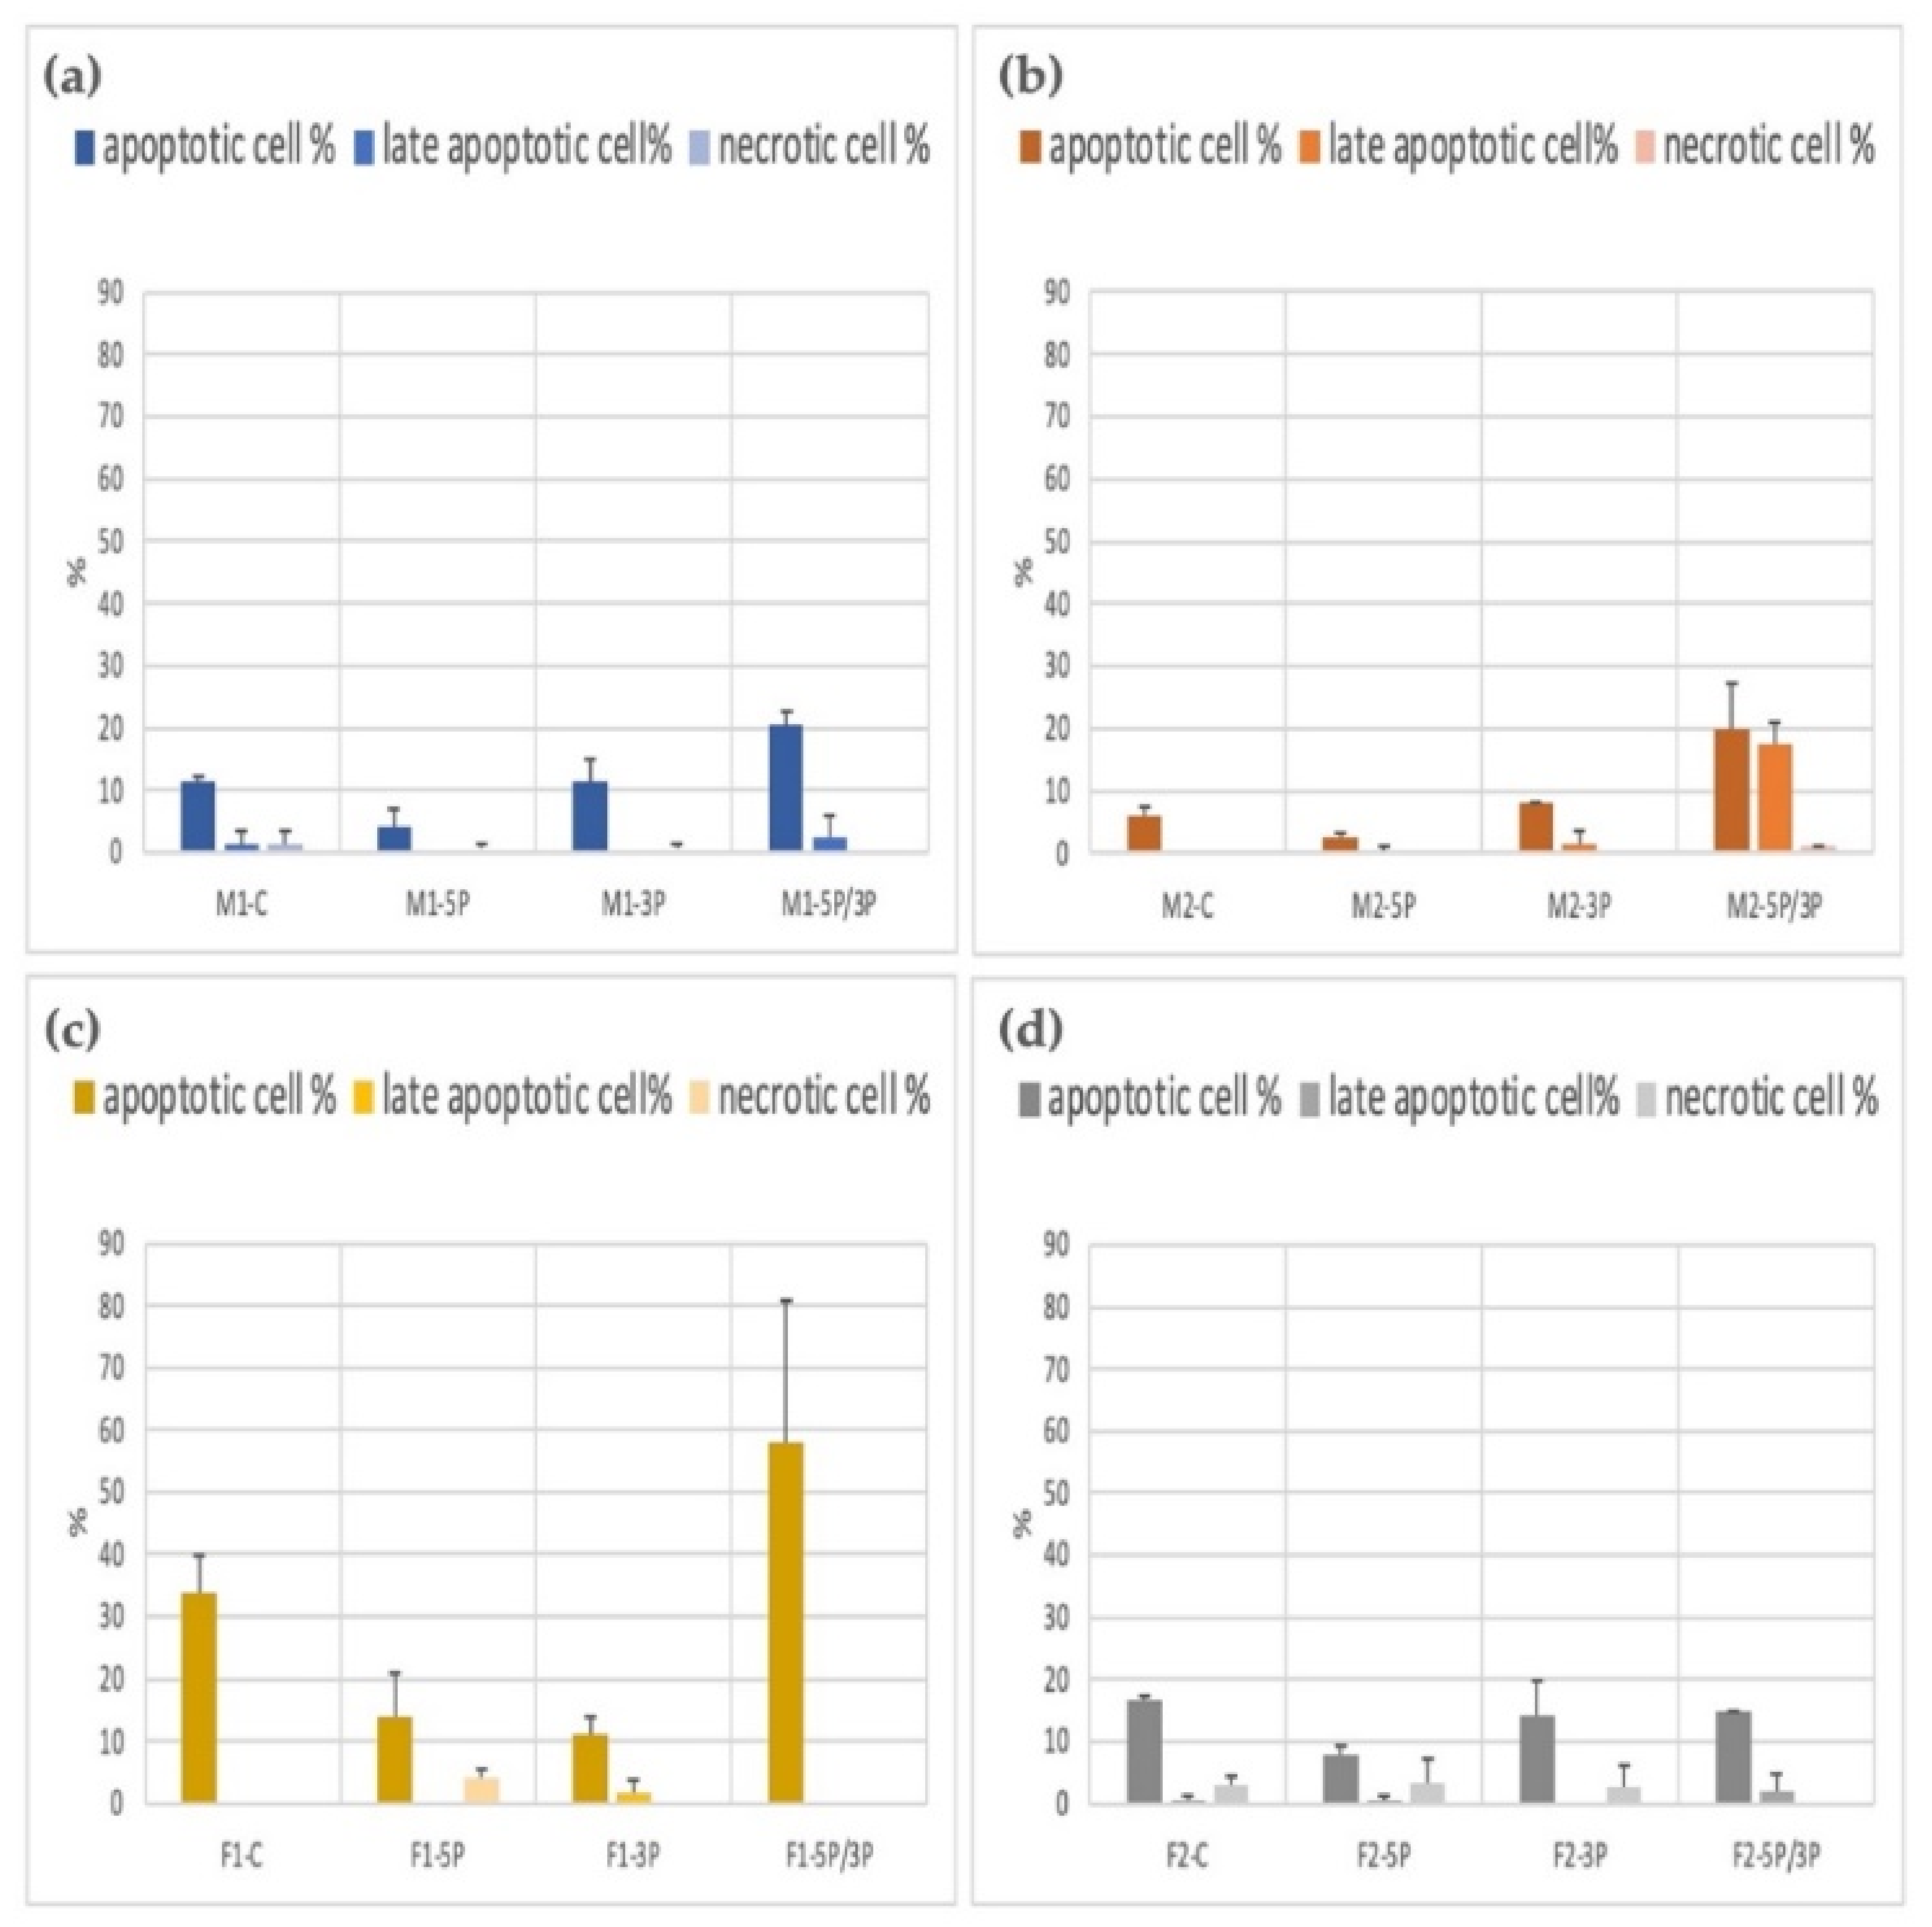
3.3. Determination of the Apoptotic, Late Apoptotic, and Necrotic Cell Ratio of PGC Lines

The apoptotic/necrotic staining was done with the Apoptotic Cell Detection Kit. The cell number calculation was performed using the Arthur Novel Fluorescent Cell Counter. We used two parallel measurements. The average apoptotic, late apoptotic, and necrotic ratios are illustrated in Figure 9. We found that 5P-inhibited PG cells showed a significantly lower apoptotic rate in all cell lines. The 5P/3P inhibition caused the highest percentage of cell death. The highest apoptotic rates were found in the case of the F1 cell line.

4. Discussion

Chicken Primordial germ cells (PGCs) can be found in the central region of the forming embryo disc. They are the first germ cell population during the development. These cells are precursors of oocytes and spermatogonia. Our study investigated the effect of miR-302b-5P and -3P on cell proliferation and apoptosis via a miRNA inhibition-based assay in PGCs. The information collected by examining the factors affecting cell proliferation of PGCs can lead to new data in stem cell biology [29].
It was published that Lin28 is a negative regulator of let-7 miRNA, and it is essential for PGC development in mouse [30]. The miR-290-295 and miR-17-92 clusters are important in mouse PGCs. MiR-290-295 cluster deficiency in mice leads to embryo lethality and germ cell deficiencies together with PGC migration problems [31]. Overexpression of Lin28 is associated with human germ-cell tumors [30]. In chicken, miR-363 is involved in gonadal development [3]. Moreover, miR-181a inhibits PGC differentiation [32].
The miR-302 cluster is embryonic stem cell-specific and evolutionarily conserved in vertebrates. The miR-302/367 cluster, generally consisting of five members, miR-367, miR-302d, miR-302a, miR-302c and miR-302b, is ubiquitously distributed in vertebrates and occupies an intragenic cluster located in the gene La-related protein 7 (LARP7) [32]. The cluster is cited for playing vital roles in diverse biological processes, such as the pluripotency of human embryonic stem cells (hESCs), self-renewal and reprogramming [28].
The miR-302-367 promoter is known to be transcriptionally regulated by the ESC-specific transcription factors Oct3/4, Sox2 and Nanog, and its activity is restricted to the ESC compartment. Functionally, this cluster regulates the cell cycle in ESCs, promoting self-renewal and pluripotency, therefore representing a master regulator in maintaining hESC stemness. It helps overcome the G1 to S phase transition during the cell cycle.
It was observed that miR-302 is endogenously highly expressed in human embryonic stem cells (hESCs) and human-induced pluripotent stem cells (hiPSCs). Inhibition of miR-302 using antagomirs resulted in downregulation of the self-renewal rate of hESCs, hiPSCs which was observed via cell colony formation assay [33].
We reported earlier a concordant dysregulation between the two arms of gga-miR-302b-5P and 3P [28] In this study, we identify that inhibition of the 3P arm slightly decreased the proliferation, indicating a role of the miR-302b-3P arm in cell proliferation. The cells inhibited with the 5P arm had a lower apoptotic rate than the cells that showed a dual inhibition. This result is consistent with Wu et al. [33], where the 5P acts as a proliferation promoter and oncomiR. Inhibition of miR-302b 5P arm decreased the proliferation rate and lowered the apoptotic rate, indicating a role of the 5P arm in promoting the proliferation of PGCs in vitro and in vivo. Our experimental data have confirmed the proliferation rate reduction after the inhibition of gga-miR-302b-5P and gga-miR-302b-3P (Figure 10).
It has been demonstrated that the members of the miR-302/367 cluster have a critical role in regulating the balance of G1-to-S transition. Three target genes were identified: CDK2, Cyclin D1/D2 and BMI-1 [34].
Figure 10. This figure summarizes our findings and the most relevant target genes of gga-miR-302b-5P and gga-miR-302b-3P predicted by the bioinformatic analysis published previously [28,35,36].
Genes 13 00082 g010
It is also essential to identify the miR-302b-5P and -3P expression pattern. In nature, both the 5P or 3P miRNA form has been reported, and 5P/3P ratio depends on temporal, spatial, physiological, and pathological conditions. Specific arm selection is supposed to be thermodynamically controlled. Changes in strand selection in cancer cells or developmental stages are possibly associated with the presence of signals. Dicer may affect the 5P/3P strand selection of concurrent expression in cancer cells. In summary, co-regulation of the 5P/3P miRNA in normal and pluripotent tissues and cells is subjected to subtle physiological changes in pre-miRNA processing enzymes and signals [29,37].
It was issued previously that miR-302b has an essential role in cellular glucose metabolism. Glucose energy and metabolism are crucial for embryonic stem cells, induced pluripotent stem cells, and germ cells. A variety of miRNAs regulate glucose metabolism in the pancreas, liver, brain, and muscle adipose tissue. Research papers published by Rengaraj and colleagues [12,32,38,39] described that miR-302b has a significant regulatory effect on glucose phosphate isomerase (GPI), which plays an essential role in glucose metabolism. Alteration of GPI can be associated with the abnormal function of stem and germ cells.
Oct4 and Sox2 are transcription factors essential for pluripotency during early embryogenesis and maintaining embryonic stem cell (ESC) pluripotency. They bind to a conserved promoter region of miR-302 [40]. MiR-302a is predicted to target many cell cycle regulators. Moreover, miR-302a represses the translation of cyclin D1 in hESCs. The transcriptional activation of miR-302 and the translational repression of its targets, such as cyclin D1, may provide a link between Oct4/Sox2 and cell cycle regulation in pluripotent cells. Varying stability and stoichiometry of such complexes offer a means to fine-tune developmental decisions [41].
The apoptotic rate of the cells inhibited against gga-miR-302b-5P showed a negative correlation, while the proliferation rate still dropped. Apoptosis occurs whenever there is an injury to the cell that cannot be repaired. The most common cause of such injury is DNA damage. Whenever cells detect DNA damage, they trigger the response of the p53 gene, which is the most crucial inducer of apoptosis. The second pathological condition under which apoptosis can be observed is whenever misfolded protein accumulates [42]. Multiple types of death can be observed simultaneously in tissues or cell cultures exposed to the same stimulus [43]. The externalization of phosphodiesterase is an early event of apoptosis, occurring while the plasma membrane remains intact. The biological spectrum of cell deaths is much more diverse. The formation of additional “blebbing” on the membrane surface of inhibited cells needs to be addressed. The non-apoptotic membrane blebbing is known to be a cellular migration mechanism [44].
We found that inhibition of miRNA gga-miR-302b-5P has a dual effect. It was reported that the miR-302b acts as an anti-tumor specific miRNA. It has been stated that various miRNAs regulate the intrinsic and the extrinsic pathway for apoptosis in cancer cells. The role of miR-302b-5P in hepatocellular carcinoma (HCC) is still unclear [33]. Guo and co-workers published that upregulation of the miRNAs leads to extensive upregulation of pro-apoptosis genes and pathways, leading to extensive cell death and blebbing [45]. These results indicate the tumor suppressor role of miR-302b-3P in the pathogenesis of gastric cancer. MiR-302b-3p promotes self-renewal properties in Leukemia Inhibitory Factor-Withdrawn Embryonic Stem Cells [46]. miR-302b exhibited anti-tumor activity by reversing EphA2 regulation, which relayed a signalling transduction cascade that attenuated the functions of N-cadherin, β-catenin, and Snail (markers of Wnt/β-catenin and epithelial-mesenchymal transition, EMT). This modulation of EphA2 also had distinct effects on cell proliferation and migration in vivo [47].
MAPK signalling is responsible for maintaining pluripotency and proliferation in mammals. It can be hypothesized that probably the high expression of gga-miR-302b-5P is contributed to controlling the MAPK signaling pathway [21] and TGFβR2. Their targets are downstream targets in other molecular pathways like p53 signalling, FOXO signaling, TGFβ signalling, and apoptosis. MiR-302b-5P might cause a high proliferation rate in PGC lines through inhibiting the MAPK pathway components.

5. Conclusions

Our findings could help to improve the in vitro conditions for PGC cultivation to gain stable germline competence comparable to in vivo PGCs. Many proteins and ligands are targets of the gga-miR-302b-5P and -3P. We can hypothesize that the inhibition of the 5P arms of miR-302b might lead to an upregulation of these pathways, causing a decrease in proliferation and apoptosis rate. Investigating the cell cycle regulatory function of gga-miR-302b-3P can help to understand its tumor suppressor role of miR-302b-3P in different types of cancer.

Supplementary Materials

The following figures are available online at https://www.mdpi.com/article/10.3390/genes13010082/s1, Figure S1: Description of the experiment, Figure S2: Immunostaining of control M1 PGCs on Day 1, Figure S3: Immunostaining of control M1 PGCs on Day 3, Figure S4: Immunostaining of 5P inhibited M1 PGCs on Day 3.

Author Contributions

Conceptualization, E.G., E.P.V. and B.P.; methodology, B.L., R.T., M.A. and A.E.; validation, E.G., L.H. and E.P.V.; formal analysis, E.G. and B.L.; investigation, B.L., N.T.S., E.G., Z.H., M.U. and A.E; writing—original draft preparation, E.G., A.E., B.L., R.T., G.S. and N.T.S.; writing—review and editing, E.P.V., B.P., R.T., M.T.S.A., M.A. and N.T.S.; visualization, E.G. and Z.H.; supervision, E.G. and L.H. funding acquisition, E.G., E.P.V. and B.P. All authors have read and agreed to the published version of the manuscript.

Funding

This research was funded by VEKOP-2.3.2-16-2016-00012, TKP2020-NKA-24, 2019-2.1.11-TÉT-2019-00036.

Institutional Review Board Statement

All applied methods in NBGK-HGI were approved by the Directorate of Food Safety and Animal Health of the Government Office of Pest County (License number: PE/EA197-4/2016) and by the Institutional Ethical Review Board.

Informed Consent Statement

Not applicable.

Data Availability Statement

The data presented in this study are available on request from the corresponding author.

Acknowledgments

We thank the animal keepers of the National Centre for Biodiversity and Gene Conservation for the egg collection and the housing of poultry.

Conflicts of Interest

The authors declare no conflict of interest.

References

  1. Reik, W.; Surani, M.A. Germline and Pluripotent Stem Cells. Cold Spring Harb. Perspect. Biol. 2015, 7, a019422. [Google Scholar] [CrossRef] [Green Version]
  2. Evans, M.J.; Kaufman, M.H. Establishment in Culture of Pluripotential Cells from Mouse Embryos. Nature 1981, 292, 154–156. [Google Scholar] [CrossRef]
  3. Takahashi, K.; Yamanaka, S. Induction of Pluripotent Stem Cells from Mouse Embryonic and Adult Fibroblast Cultures by Defined Factors. Cell 2006, 126, 663–676. [Google Scholar] [CrossRef] [PubMed] [Green Version]
  4. Nakamura, Y.; Kagami, H.; Tagami, T. Development, Differentiation and Manipulation of Chicken Germ Cells. Dev. Growth Differ. 2013, 55, 20–40. [Google Scholar] [CrossRef] [PubMed]
  5. Nandi, S.; Whyte, J.; Taylor, L.; Sherman, A.; Nair, V.; Kaiser, P.; McGrew, M.J. Cryopreservation of Specialized Chicken Lines Using Cultured Primordial Germ Cells. Poult. Sci. 2016, 95, 1905–1911. [Google Scholar] [CrossRef] [PubMed]
  6. Whyte, J.; Glover, J.D.; Woodcock, M.; Brzeszczynska, J.; Taylor, L.; Sherman, A.; Kaiser, P.; McGrew, M.J. FGF, Insulin, and SMAD Signaling Cooperate for Avian Primordial Germ Cell Self-Renewal. Stem Cell Rep. 2015, 5, 1171–1182. [Google Scholar] [CrossRef] [PubMed] [Green Version]
  7. Moradi, S.; Braun, T.; Baharvand, H. MiR-302b-3p Promotes Self-Renewal Properties in Leukemia Inhibitory Factor-Withdrawn Embryonic Stem Cells. Cell J. 2018, 20, 61–72. [Google Scholar] [CrossRef] [PubMed]
  8. Rad, S.M.A.H.; Bavarsad, M.S.; Arefian, E.; Jaseb, K.; Shahjahani, M.; Saki, N. The Role of MicroRNAs in Stemness of Cancer Stem Cells. Oncol. Rev. 2013, 7, 8. [Google Scholar] [CrossRef]
  9. Maraghechi, P.; Hiripi, L.; Tóth, G.; Bontovics, B.; Bosze, Z.; Gócza, E. Discovery of Pluripotency-Associated MicroRNAs in Rabbit Preimplantation Embryos and Embryonic Stem-like Cells. Reproduction 2013, 145, 421–437. [Google Scholar] [CrossRef] [PubMed] [Green Version]
  10. Li, N.; Long, B.; Han, W.; Yuan, S.; Wang, K. MicroRNAs: Important Regulators of Stem Cells. Stem Cell Res. Ther. 2017, 8, 110. [Google Scholar] [CrossRef]
  11. Houbaviy, H.B.; Murray, M.F.; Sharp, P.A. Embryonic Stem Cell-Specific MicroRNAs. Dev. Cell 2003, 5, 351–358. [Google Scholar] [CrossRef]
  12. Rengaraj, D.; Lee, B.R.; Lee, S.I.; Seo, H.W.; Han, J.Y. Expression Patterns and Mirna Regulation of DNA Methyltransferases in Chicken Primordial Germ Cells. PLoS ONE 2011, 6, e19524. [Google Scholar] [CrossRef]
  13. Rengaraj, D.; Park, T.S.; Lee, S.I.; Lee, B.R.; Han, B.K.; Song, G.; Han, J.Y. Regulation of Glucose Phosphate Isomerase by the 3′UTR-Specific MiRNAs MiR-302b and MiR-17-5p in Chicken Primordial Germ Cells. Biol. Reprod. 2013, 89, 33. [Google Scholar] [CrossRef]
  14. Houbaviy, H.B.; Dennis, L.; Jaenisch, R.; Sharp, P.A. Characterization of a Highly Variable Eutherian MicroRNA Gene Characterization of a Highly Variable Eutherian MicroRNA Gene. RNA 2005, 11, 1245–1257. [Google Scholar] [CrossRef] [PubMed] [Green Version]
  15. Bartel, D.P. MicroRNAs: Genomics, Biogenesis, Mechanism, and Function. Cell 2004, 116, 281–297. [Google Scholar] [CrossRef] [Green Version]
  16. Winter, J.; Jung, S.; Keller, S.; Gregory, R.I.; Diederichs, S. Many Roads to Maturity: MicroRNA Biogenesis Pathways and Their Regulation. Nat. Cell Biol. 2009, 11, 228–234. [Google Scholar] [CrossRef]
  17. Choo, K.B.; Soon, Y.L.; Nguyen, P.N.N.; Hiew, M.S.Y.; Huang, C.J. MicroRNA-5p and -3p Co-Expression and Cross-Targeting in Colon Cancer Cells. J. Biomed. Sci. 2014, 21, 95. [Google Scholar] [CrossRef] [PubMed] [Green Version]
  18. Hashemzadeh, M.R. Role of Micro RNAs in Stem Cells, Cardiac Differentiation and Cardiovascular Diseases. Gene Rep. 2017, 8, 11–16. [Google Scholar] [CrossRef]
  19. Darnell, D.K.; Kaur, S.; Stanislaw, S.; Konieczka, J.K.; Yatskievych, T.A.; Antin, P.B. MicroRNA Expression during Chick Embryo Development. Dev. Dyn. 2006, 235, 3156–3165. [Google Scholar] [CrossRef] [PubMed]
  20. Ha, M.; Kim, V.N. Regulation of MicroRNA Biogenesis. Nature reviews. Mol. Cell Biol. 2014, 15, 509–524. [Google Scholar] [CrossRef]
  21. Zhan, J.; Jiao, D.; Wang, Y.; Song, J.; Wu, J.; Wu, L.; Chen, Q.; Ma, S. Integrated MicroRNA and Gene Expression Profiling Reveals the Crucial MiRNAs in Curcumin Anti-Lung Cancer Cell Invasion. Thorac. Cancer 2017, 8, 461–470. [Google Scholar] [CrossRef] [PubMed]
  22. Jiao, D.M.; Yan, L.; Wang, L.S.; Hu, H.Z.; Tang, X.L.; Chen, J.; Wang, J.; Li, Y.; Chen, Q.Y. Exploration of Inhibitory Mechanisms of Curcumin in Lung Cancer Metastasis Using a MiRNA-Transcription Factor-Target Gene Network. PLoS ONE 2017, 12, e0172470. [Google Scholar]
  23. Picon-Ruiz, M.; Pan, C.; Drews-Elger, K.; Jang, K.; Besser, A.H.; Zhao, D.; Morata-Tarifa, C.; Kim, M.; Ince, T.A.; Azzam, D.J.; et al. Interactions between Adipocytes and Breast Cancer Cells Stimulate Cytokine Production and Drive Src/Sox2/MiR-302b-Mediated Malignant Progression. Cancer Res. 2016, 76, 491–504. [Google Scholar] [CrossRef] [PubMed] [Green Version]
  24. Khodayari, N.; Mohammed, K.A.; Lee, H.; Kaye, F.; Nasreen, N. MicroRNA-302b Targets Mcl-1 and Inhibits Cell Proliferation and Induces Apoptosis in Malignant Pleural Mesothelioma Cells. Am. J. Cancer Res. 2016, 6, 1996. [Google Scholar] [PubMed]
  25. Lu, X.X.; Cao, L.Y.; Chen, X.; Xiao, J.; Zou, Y.; Chen, Q. PTEN Inhibits Cell Proliferation, Promotes Cell Apoptosis, and Induces Cell Cycle Arrest via Downregulating the PI3K/AKT/HTERT Pathway in Lung Adenocarcinoma A549 Cells. BioMed Res. Int. 2016, 2016, 2476842. [Google Scholar] [CrossRef] [PubMed] [Green Version]
  26. Lázár, B.; Molnár, M.; Sztán, N.; Végi, B.; Drobnyák, Á.; Tóth, R.; Tokodyné Szabadi, N.; McGrew, M.J.; Gócza, E.; Patakiné Várkonyi, E. Successful Cryopreservation and Regeneration of a Partridge Colored Hungarian Native Chicken Breed Using Primordial Germ Cells. Poult. Sci. 2021, 100, 101207. [Google Scholar] [CrossRef]
  27. Hamburger, V.; Hamilton, H.L. A Series of Normal Stages in the Development of the Chick Embryo. J. Morphol. 1951, 88, 49–92. [Google Scholar] [CrossRef] [PubMed]
  28. Lázár, B.; Anand, M.; Tóth, R.; Várkonyi, E.P.; Liptói, K.; Gócza, E. Comparison of the MicroRNA Expression Profiles of Male and Female Avian Primordial Germ Cell Lines. Stem Cells Int. 2018, 2018, 1780679. [Google Scholar] [CrossRef] [Green Version]
  29. Cai, D.; He, K.; Chang, S.S.; Tong, D.; Huang, C. MicroRNA-302b Enhances the Sensitivity of Hepatocellular Carcinoma Cell Lines to 5-FU via Targeting Mcl-1 and DPYD. Int. J. Mol. Sci. 2015, 16, 23668–23682. [Google Scholar] [CrossRef] [Green Version]
  30. West, J.A.; Viswanathan, S.R.; Yabuuchi, A.; Cunniff, K.; Takeuchi, A.; Park, I.H.; Sero, J.E.; Zhu, H.; Perez-Atayde, A.; Frazier, A.L.; et al. A Role for Lin28 in Primordial Germ-Cell Development and Germ-Cell Malignancy. Nature 2009, 460, 909–913. [Google Scholar] [CrossRef] [PubMed] [Green Version]
  31. Hayashi, K.; Chuva de Sousa Lopes, S.M.; Kaneda, M.; Tang, F.; Hajkova, P.; Lao, K.; O’Carroll, D.; Das, P.P.; Tarakhovsky, A.; Miska, E.A.; et al. MicroRNA Biogenesis Is Required for Mouse Primordial Germ Cell Development and Spermatogenesis. PLoS ONE 2008, 3, e1738. [Google Scholar] [CrossRef] [Green Version]
  32. Lee, S.I.; Lee, B.R.; Hwang, Y.S.; Lee, H.C.; Rengaraj, D.; Song, G.; Park, T.S.; Han, J.Y. MicroRNA-Mediated Posttranscriptional Regulation Is Required for Maintaining Undifferentiated Properties of Blastoderm and Primordial Germ Cells in Chickens. Proc. Natl. Acad. Sci. USA 2011, 108, 10426–10431. [Google Scholar] [CrossRef] [PubMed] [Green Version]
  33. Wu, H.-Y.; Cai, K.-T.; Ma, J.; Chen, G.; Dang, Y.-W.; Lu, H.-P.; Pan, S.-L. Evaluation of MiR-302b-5p Expression and Molecular Mechanism in Hepatocellular Carcinoma: Findings Based on RT-qPCR and in Silico Analysis. Pathol. Res. Pract. 2019, 215, 152424. [Google Scholar] [CrossRef]
  34. Lin, S.L.; Chang, D.C.; Ying, S.Y.; Leu, D.; Wu, D.T.S. MicroRNA MiR-302 Inhibits the Tumorigenecity of Human Pluripotent Stem Cells by Coordinate Suppression of the CDK2 and CDK4/6 Cell Cycle Pathways. Cancer Res. 2010, 70, 9473–9482. [Google Scholar] [CrossRef] [PubMed] [Green Version]
  35. Cataldo, A.; Cheung, D.G.; Balsari, A.; Tagliabue, E.; Coppola, V.; Iorio, M.; Palmieri, D.; Croce, C.M. MiR-302b Enhances Breast Cancer Cell Sensitivity to Cisplatin by Regulating E2F1 and the Cellular DNA Damage Response. Oncotarget 2016, 7, 786–797. [Google Scholar] [CrossRef] [Green Version]
  36. Sun, Y.; Liu, W.-Z.; Liu, T.; Feng, X.; Yang, N.; Zhou, H.-F. Signaling Pathway of MAPK/ERK in Cell Proliferation, Differentiation, Migration, Senescence and Apoptosis. J. Recept. Signal Transduct. 2015, 35, 600–604. [Google Scholar] [CrossRef] [PubMed]
  37. Huang, M.; Li, D.; Huang, Y.; Cui, X.; Liao, S.; Wang, J.; Liu, F.; Li, C.; Gao, M.; Chen, J.; et al. HSF4 Promotes G1/S Arrest in Human Lens Epithelial Cells by Stabilizing P53. Biochim. Biophys. Acta-Mol. Cell Res. 2015, 1853, 1808–1817. [Google Scholar] [CrossRef] [Green Version]
  38. Rengaraj, D.; Lee, B.R.; Choi, J.W.; Lee, S.I.; Seo, H.W.; Kim, T.H.; Choi, H.J.; Song, G.; Han, J.Y. Gene Pathways and Cell Cycle-Related Genes in Cultured Avian Primordial Germ Cells. Poult. Sci. 2012, 91, 3167–3177. [Google Scholar] [CrossRef]
  39. Kang, K.S.; Lee, H.C.; Kim, H.J.; Lee, H.G.; Kim, Y.M.; Lee, H.J.; Park, Y.H.; Yang, S.Y.; Rengaraj, D.; Park, T.S.; et al. Spatial and Temporal Action of Chicken Primordial Germ Cells during Initial Migration. Reproduction 2015, 149, 179–187. [Google Scholar] [CrossRef] [PubMed] [Green Version]
  40. Greer Card, D.A.; Hebbar, P.B.; Li, L.; Trotter, K.W.; Komatsu, Y.; Mishina, Y.; Archer, T.K. Oct4/Sox2-Regulated MiR-302 Targets Cyclin D1 in Human Embryonic Stem Cells. Mol. Cell. Biol. 2008, 28, 6426–6438. [Google Scholar] [CrossRef] [Green Version]
  41. Orkin, S.H.; Hochedlinger, K. Chromatin Connections to Pluripotency and Cellular Reprogramming. Cell 2011, 145, 835–850. [Google Scholar] [CrossRef] [PubMed] [Green Version]
  42. Elmore, S. Apoptosis: A Review of Programmed Cell Death. Toxicol. Pathol. 2007, 35, 495–516. [Google Scholar] [CrossRef] [PubMed]
  43. Fink, S.L.; Cookson, B.T. Apoptosis, Pyroptosis, and Necrosis: Mechanistic Description of Dead and Dying Eukaryotic Cells. Infect. Immun. 2005, 73, 1907–1916. [Google Scholar] [CrossRef] [Green Version]
  44. Srihawong, T.; Kuwana, T.; Siripattarapravat, K.; Tirawattanawanich, C. Chicken Primordial Germ Cell Motility in Response to Stem Cell Factor Sensing. Int. J. Dev. Biol. 2015, 59, 453–460. [Google Scholar] [CrossRef] [PubMed] [Green Version]
  45. Guo, M.; Gan, L.; Si, J.; Zhang, J.; Liu, Z.; Zhao, J.; Gou, Z.; Zhang, H. Role of MiR-302/367 Cluster in Human Physiology and Pathophysiology. Acta Biochim. Biophys. Sin. 2020, 52, 791–800. [Google Scholar] [CrossRef] [PubMed]
  46. Guo, B.; Zhao, Z.; Wang, Z.; Li, Q.; Wang, X.; Wang, W.; Song, T.; Huang, C. MicroRNA-302b-3p Suppresses Cell Proliferation Through AKT Pathway by Targeting IGF-1R in Human Gastric Cancer. Cell. Physiol. Biochem. 2017, 42, 1701–1711. [Google Scholar] [CrossRef] [PubMed]
  47. Huang, J.; He, Y.; Mcleod, H.L.; Xie, Y.; Xiao, D.; Hu, H.; Chen, P. MiR-302b Inhibits Tumorigenesis by Targeting EphA2 via Wnt/β-Catenin/EMT Signaling Cascade in Gastric Cancer. BMC Cancer 2017, 17, 886. [Google Scholar] [CrossRef] [PubMed] [Green Version]
Figure 1. Characterization of PGC lines M1, M2, F1 and F2 on Day 0 of the experiments. Expression of CVH (a), POUV (b), gga-miR-302b-5P (d) and gga-miR-302b-3P (e) were analysed. GAPDH (in the case of CVH and POUV) and miR-92 (in the case of microRNAs) were used as housekeeping genes in the experiments. The proliferation rate (c) and 5P/3P ratio (f) for the PGC lines are also presented (p < 0.01 **, p < 0.001 ***).
Genes 13 00082 g001
Figure 2. The immunostaining was performed with SSEA-1 (red), CVH (green) and TO-PRO™-3 for nuclear staining (blue). We examined M1 (a), M2 (b), F1 (c) and F2 (d) PG cell lines (Scale: 50 µm).
Genes 13 00082 g002
Figure 3. (A) The proliferation rate of the control PGC lines on Day 1, Day 2 and Day 3 (ad) and immunostaining (eh) of the four lines are shown in the figure. The immunostaining was achieved with SSEA-1 (red), CVH (green) and TO-PRO™-3 for nuclear staining (blue). (B) Analysis of the cell number. The cell number measurements were performed every 4 h (from 4 h to 76 h). We calculated the proliferation rates on Day 1, Day 2 and Day 3 (p < 0.05 *, p < 0.01 **).
Genes 13 00082 g003
Figure 4. (a) Proliferation rate of M1 (ZZ genotype) PGC line on Day 1, Day 2 and Day 3. M1-C: non-inhibited, M1-5P: gga-miR-302b-5P inhibition, M1-3P: gga-miR-302b-3P inhibition, M1-5P/3P: gga-miR-302b-5P and gga-miR-302b-3P inhibition. (bd) Immunostaining of M1 PGCs after three days of cultivation in different culture conditions. The immunostaining was achieved with SSEA-1 (red), CVH (green) and TO-PRO™-3 for nuclear staining (blue) (p < 0.01 **, p < 0.001 ***).
Genes 13 00082 g004
Figure 5. (a) Proliferation rate of M2 (ZZ genotype) PGC line on Day 1, Day 2 and Day 3. M2-C: non-inhibited, M2-5P: gga-miR-302b-5P inhibition, M2-3P: gga-miR-302b-3P inhibition, M2-5P/3P: gga-miR-302b-5P and gga-miR-302b-3P inhibition. (bd) Immunostaining of M2 PGCs after three days of cultivation with different culture conditions. The immunostaining was achieved with SSEA-1 (red), CVH (green) and TO-PRO™-3 for nuclear staining (blue) (p < 0.05 *, p < 0.01 **, p < 0.001 ***).
Genes 13 00082 g005
Figure 6. (a) Proliferation rate of F1 (ZW genotype) PGC line on Day 1, Day 2 and Day 3. F1-C: non-inhibited, F1-5P: gga-miR-302b-5P inhibition, F1-3P: gga-miR-302b-3P inhibition, F1-5P/3P: gga-miR-302b-5P and gga-miR-302b-3P inhibition. (bd) Immunostaining of F1 PGCs after three days of cultivation with different culture conditions. The immunostaining was achieved with SSEA-1 (red), CVH (green) and TO-PRO™-3 for nuclear staining (blue) (p < 0.05 *, p < 0.01 **, p < 0.001 ***).
Genes 13 00082 g006
Figure 7. (a) Proliferation rate of F2 (ZW genotype) PGC line on Day 1, Day 2 and Day 3. F2-C: non-inhibited, F2-5P: gga-miR-302b-5P inhibition, F2-3P: gga-miR-302b-3P inhibition, F2-5P/3P: gga-miR-302b-5P and gga-miR-302b-3P inhibition. (bd) Immunostaining of F2 PGCs after three days of cultivation with different culture conditions. The immunostaining was achieved with SSEA-1 (red), CVH (green) and TO-PRO™-3 for nuclear staining (blue) (p < 0.05 *, p < 0.01 **).
Genes 13 00082 g007
Figure 8. (a) Comparison of the proliferation rate of M1 (a), M2 (b) (ZZ genotype) and F1 (c), F2 (d) (ZW genotype) PGC lines on Day 3. C: non-inhibited, 5P: gga-miR-302b-5P inhibition, 3P: gga-miR-302b-3P inhibition, 5P/3P: gga-miR-302b-5P and gga-miR-302b-3P inhibition. (eh) Immunostaining of M1, M2, F1 and F2 PGCs after three days of cultivation in anti-gga-miR-302b-5P inhibitor-containing medium. The immunostaining was achieved with SSEA-1 (red), CVH (green) and TO-PRO™-3 for nuclear staining (blue). Arrows show the blebbings on the cell surface (p < 0.05 *, p < 0.01 **, p < 0.001 ***).
Genes 13 00082 g008
Figure 9. Comparison of the apoptotic, late apoptotic, and necrotic cell percentage in M1 (a), M2 (b) (ZZ genotype) and F1 (c), F2 (d) (ZW genotype) PGC lines.: C: non-inhibited, 5P: gga-miR-302b-5P inhibition, 3P: gga-miR-302b-3P inhibition, 5P/3P: gga-miR-302b-5P andgga-miR-302b-3P inhibition.
Genes 13 00082 g009
Table 1. Primers used at the mRNA analysis.
Gene SymbolGene Full Name (Organism)NCBI NumberPrimersLength of the Product (bp)
GAPDHGlyceraldehyde-3-phosphate dehydrogenase (Gallus gallus)NM_204305.1FWGACGTGCAGCAGGAACACTA112
RVCTTGGACTTTGCCAGAGAGG
POUVPOU domain class 5 transcription factor 3 (Pou5f3) (Gallus gallus)NM_001110178.1FWGAGGCAGAGAACACGGACAA109
RVTTCCCTTCACGTTGGTCTCG
CVHDEAD-box helicase 4 (DDX4) (Gallus gallus)NM_204708.1FWGAACCTACCATCCACCAGCA113
RVATGCTACCGAAGTTGCCACA
Table 2. Primers used at the miRNA analysis.
NameGeneAccession NumberAssay IDSequence
miR-92hsa-miR-92MI0000719000430UAUUGCACUUGUCCCGGCCUG
gga-miR-302b-3Phsa-miR-302bMI0000772000531UAAGUGCUUCCAUGUUUUAGUAG
gga-miR-302b-5Pgga-miR-302b*MI0003700008131_matACUUUAACAUGGAGGUGCUUUCU
Table 3. Inhibitors used at the miRNA inhibition assays.
NameGeneCatalog NumberAssay IDType of Inhibitor
anti-miR-302b-3phsa-miR-302b-3PAM17000AM10081anti-miRTM-miRNA inhibitor
anti-miR-302b-5pgga-miR-302b-5P4464084MH11349mirVanaTM miRNA Inhibitor
Publisher’s Note: MDPI stays neutral with regard to jurisdictional claims in published maps and institutional affiliations.

