Article

A Genome-Wide Identification Study Reveals That HmoCYP76AD1, HmoDODAα1 and HmocDOPA5GT Involved in Betalain Biosynthesis in Hylocereus

Guangdong Provincial Key Laboratory of Postharvest Science of Fruits and Vegetables/Key Laboratory of Biology and Genetic Improvement of Horticultural Crops (South China), Ministry of Agriculture and Rural Affairs, College of Horticulture, South China Agricultural University, Guangzhou 510642, China
*
Author to whom correspondence should be addressed.
Genes 2021, 12(12), 1858; https://doi.org/10.3390/genes12121858
Submission received: 28 October 2021 / Revised: 18 November 2021 / Accepted: 18 November 2021 / Published: 23 November 2021
(This article belongs to the Section Plant Genetics and Genomics)

Abstract

:
Betalains are water-soluble nitrogen-containing pigments with multiple bioactivities. Pitayas are the only at large-scale commercially grown fruit containing abundant betalains for consumers. Currently, the key genes involved in betalain biosynthesis remain to be fully elucidated. Moreover, genome-wide analyses of these genes in betalain biosynthesis are not available in betalain-producing plant species. In this study, totally 53 genes related to betalain biosynthesis were identified from the genome data of Hylocereus undatus. Four candidate genes i.e., one cytochrome P-450 R gene (HmoCYP76AD1), two L-DOPA 4,5-dioxygenase genes (HmoDODAα1 and HmoDODAα2), and one cyclo-DOPA 5-O glucosyltransferase gene (HmocDOPA5GT) were initially screened according to bioinformatics and qRT-PCR analyses. Silencing HmoCYP76AD1, HmoDODAα1, HmoDODAα2 or HmocDOPA5GT resulted in loss of red pigment. HmoDODAα1 displayed a high level of L-DOPA 4,5-dioxygenase activity to produce betalamic acid and formed yellow betaxanthin. Co-expression of HmoCYP76AD1, HmoDODAα1 and HmocDOPA5GT in Nicotiana benthamiana and yeast resulted in high abundance of betalain pigments with a red color. These results suggested that HmoCYP76AD1, HmoDODAα1, and HmocDOPA5GT play key roles in betalain biosynthesis in Hylocereus. The results of the present study provide novel genes for molecular breeding programs of pitaya.

1. Introduction

Betalains are a group of hydrophilic nitrogen-containing pigments with multiple functions [1,2,3]. Betalains are usually used as functional additives in pharmaceuticals, cosmetic, and food products due to their antimicrobial effects and natural colorant [4]. In addition, betalains are involved in plant protection against abiotic and biotic stresses [5,6,7,8,9,10]. Therefore, it is of great significance to enhance the betalain contents in plants through genetic transformation.
Betalains are secondary metabolites derived from L-tyrosine. The betalain biosynthetic pathway can be divided into three stages [11,12]. At present, cytochrome P450 (CYP), 4,5-dihydroxy-phenylalanine (DOPA)-dioxygenase (DOD), and glucosyltransferase (GT) have been characterized as key players in betalain biosynthesis. CYP enzyme can catalyze the hydroxylation of tyrosine to L-3,4-dihydroxyphenylalanine (L-DOPA) and the subsequent oxidation of DOPA to 5,6-dihydroxyindoline-2-carboxylic acid (cyclo-DOPA) [12,13]. Based on phylogenetic analyses of 100 Caryophyllales plants, CYP76AD1-like genes are classified into CYP76AD1-α, CYP76AD1-β and CYP76AD1-γ [14]. The functions of CYP76AD1-α genes (BvCYP76AD1, MjCYP76AD3, CqCYP76AD1 and AtriCYP76AD1) encoding betalain biosynthesis enzymes have been elucidated in Beta vulgaris [13], Mirabilis jalapa [15], Chenopodium quinoa [16] and Amaranthus tricolor [17]. The CYP76AD1-β genes (BvCYP76AD5, BvCYP76AD6 and MjCYP76AD15) encoding the enzyme convert tyrosine into L-DOPA which have been confirmed in M. jalapa and B. vulgaris [18,19]. However, the function of CYP76AD1-γ genes remains unknown.
The key enzymatic step in betalain biosynthesis is the formation of betalamic acid [11,12]. 4,5-DOPA dioxygenase extradiol (DODA) catalyzes the L-DOPA to seco-DOPA and then convert to betalamic acid spontaneously [20]. L-DOPA 4,5-dioxygenase is a rate-limiting enzyme encoded by the DODA gene [21]. Within Caryophyllales, gene duplication in the LigB/DODA gene lineage gives rise to the DODAα and DODAβ clades, with at least one homologue from the DODAβ lineage and two paralogues from the DODAα lineage [14,22]. Repeated convergent acquisition of L-DOPA 4,5-dioxygenase activity is consistent with the gene duplication events within the DODAα clade in Caryophyllales [22]. In B. vulgaris, BvDODAα1 exhibits high levels of L-DOPA 4,5-dioxygenase activity, compared with low L-DOPA 4,5-dioxygenase activity for BvDODAα2 [12,13,23,24]. Gene duplications within the DODAα lineage related to L-DOPA 4,5-dioxygenase activity are found in Amaranthus hypochondriacus [25], Parakeelya mirabilis [24], Stegnosperma halimifolium, Carnegiea gigantea, Mesembryanthemum crystallinum, Macarthuria australis, Telephium imperati, Polycarpon tetraphyllum, Cardionema ramosissimum, Spergularia marina, Limeum aethiopicum and Kewa caespitosa [22]. Betalains are divided into betaxanthins (yellow-orange pigments) and betacyanins (red-violet pigments). Betaxanthins are from spontaneous formation of betalamic acid and amino acids or amines. The formation of betacyanins can be carried out through glycosylation by GT [11,12]. One of the glycosylation routes is performed directly on betanidin by UDPG-dependent betanidin 5-O-glucosyltransferase (B5GT)/betanidin 6-O-glucosyltransferase (B6GT) [26,27]. B5GT and B6GT have been isolated from Dorotheanthus bellidiformis [28,29]. Another glycosylation occurs on glucosylated cDOPA by the action of a cDOPA 5-O-glucosyltransferase (cDOPA-5GT), which was found in M. jalapa, A. hypochondriacus and C. quinoa [3,15,25,30].
Pitaya is a climbing vine cactus species in the family of Cactaceae. It is becoming increasingly fashionable worldwide due to its adaption to arid conditions, attractive appearance, delicious taste and rich nutrients [3,31,32]. Pitaya is the edible fruit containing high levels of betalains at large-scale commercial cultivation. Currently, there are mainly four types of pitayas, namely red peel with white pulp pitaya (Hylocereus undatus), red peel with red pulp pitaya (Hylocereus monacanthus), yellow peel with green scales and white pulp pitaya (H. undatus) and yellow peel with thorny and white pulp pitaya (Hylocereus megalanthus/Selenicereus megalanthus), which are commercially produced as fruit crops [33,34]. Recently, the coding genes of key enzymes involved in pitaya have been obtained from transcriptome database. Compared to H. undatus, CYP76ADs, DODA and GTs in red pulp were upregulated in H. monacanthus [35,36,37,38,39]. In addition, HpNAC, HpGSTs and HpWRKY may play roles in the regulation of betalain biosynthesis in coordination with MYB transcription factor in pitaya [37,40,41]. Recently, candidate genes CYP76AD-α, CYP76AD-β, and CYP76AD-γ involved in betalain biosynthesis were isolated from pitaya genome [42,43]. The DODA lineage experienced gene duplication resulting in two main clades: DODA-α and DODA-β. Betalain-related GT enzymes (B5GT, B6GT, and cDOPA5GT) from flavonoid-related GTs showed higher expression levels in H. monacanthus than that of H. undatus. However, genome-wide identification and function of these genes involved in betalain biosynthesis in pitaya are still not available. In this study, the genome-wide identification and characterization of genes related to betalain biosynthesis were performed using available H. undatus genome data [43]. The functions of candidate genes were analyzed through virus-induced gene silencing (VIGS), transient expression, yeast recombinant expression, and genetic transformation. The results of the present study will provide valuable information for a better understanding of betalain biosynthesis in pitaya.

2. Materials and Methods

2.1. Plant Materials

‘Guanhuahong’ (red peel and green scales with red pulp, H. monacanthus), ‘Hongguan No. 1′ (red peel and red scales with red pulp, H. monacanthus) and ‘Guanhuabai’ (red peel and green scales with white pulp, H. undatus) pitayas, Arabidopsis thaliana (Columbia, wild type) and N. benthamiana were used as materials. ‘Guanhuahong’ and ‘Guanhuabai’ pitayas were used to select the candidate genes due to the higher production of betalain in ‘Guanhuahong’ pitaya than that of ‘Guanhuabai’ pitaya [35]. Pulps of ‘Guanhuahong’ and ‘Guanhuabai’ pitayas were collected at four developmental stages (Figure 1A(a,b)): S1, 19 days after artificial pollination (DAAP); S2, 23 DAAP; S3, 25 DAAP and S4, 29 DAAP. Peels of ‘Guanhuahong’ pitaya were collected at four developmental stages (Figure 1A(c)): S1, 23 DAAP; S2, 25 DAAP; S3, 27 DAAP and S4, 29 DAAP. Three fruits were sampled at each developmental stage. Fruits with 40–50 cm stem of ‘Hongguan No. 1′ were collected on the 23 DAAP and cultivated in a climate room (26 °C; 16:8 h, light:dark) for VIGS. A. thaliana and N. benthamiana plants were cultivated in a climate room (22 °C; 70% humidity; 16:8 h, light:dark; 2500 Lux light intensity). All samples were immediately frozen in liquid nitrogen and stored at −80 °C until further use. All experiments were repeated in triplicate.

2.2. Gene Identification and Phylogenetic Analyses

Genes associated with betalain biosynthesis were downloaded from NCBI database according to the publications. The GenBank Accession No. are listed in Supplementary Table S1. Gene sequences were identified by BLAST search of H. undatus genomes [43] using TBtools software [44]. Annotated gene sequences were manually checked and adjusted to remove the repeated sequences and retain the genes with identity equal to or greater than 40%. Each potential gene was further manually examined to ensure the complete conserved domain using the Conserved Domain Database (CDD) (http://www.ncbi.nlm.nih.gov/cdd (accessed on 1 September 2019)).
Alignment of multiple sequences was performed with CLUSTAL (Bootstrap value = 1000). The phylogenetic tree was constructed using a neighbors-joining (NJ) method with MEGA7.0 software. The Newick tree was exported from MEGA7.0 and improved with iTOL (https://itol.embl.de/gallery.cgi (accessed on 20 July 2021)).

2.3. Chromosomal Distribution Analysis

The location information of genes related to betalain biosynthesis was obtained from the pitaya genome database [43]. The gene location map was constructed using TBtools software [44].

2.4. Relative Expression Analyses by qRT-PCR

qRT-PCR was performed with SYBR® Premix Ex Taq™ II (Tli RNase H Plus) (TaKaRa, Shiga, Japan) in an ABI 7500 Real-Time PCR System (Applied Biosystems, New York, NY, USA) using the following process: initial denaturation step at 95 °C for 1 min, followed by 40 cycles of 15 s at 95 °C, 30 s at 58 °C and 40 s at 72 °C. The melting curve analyses were included in every reaction to confirm primer specificity and stability. A total of 10 μL reaction mixture included 1 μL of cDNA (Ct = 21), 0.5 μL of each primer (2 mM), 5 μL of 2× SYBR® Premix Ex Taq™ II and 3 μL of double distilled water (ddH2O). Relative expression levels were calculated by the 2−ΔΔCT method [45]. The data were normalized using the Actin (1) for pitaya [46], AtActin2 (AT3G18780) for A. thaliana [47], and NtActin1 for N. benthamiana [48], respectively. Three biological replicates for each reaction were performed. All qRT-PCR primers were designed by BatchPrimer3v1.0 (http://batchprimer3.bioinformatics.ucdavis.edu/index.html (accessed on 3 October 2019)) (Supplementary Table S2).

2.5. Full-Length cDNA Amplification and Plasmid Construction

Results from qRT-PCR indicated that all four candidate genes were preferentially expressed in pigmented tissues. Differences in nucleotide sequence and amino acids were detected between H. monacanthus and H. undatus. Therefore, the sequences from H. monacanthus were used in the subsequent experiments. Total RNA was extracted using EASYspin Plus Complex Plant RNA Kit (RN53) (Aidlab Biotechnology, Beijing, China) according to the manufacturer’s protocol. The cDNAs were synthesized using a PrimeScriptTM RT reagent Kit with gDNA Eraser (TaKaRa, Shiga, Japan). The full-length coding sequences of HmoCYP76AD1 (MZ541999), HmoDODAα1 (MZ542000), HmoDODAα2 (MZ542001), and HmocDOPA-5GT (MZ542002) were cloned using Phanta® Max Super-Fidelity DNA Polymerase (Vazyme, Nanjing, China). Vectors were constructed using ClonExpress®II One Step Cloning Kit (Vazyme, Nanjing, China) according to the manufacturer’s manual. Gene coding sequences were constructed into pEAQ-GFP and pC18 vectors for transient expression. pPZP6k90 vector harboring gene coding sequences was used for genetic transformation. All gene fragments were recombined into a pTRV2 vector for VIGS assay. Single-gene expression vectors (YES2-Ura, pYES3-Trp) and/or double-gene expression vector (pESC-Ura) were used for recombinant expression in yeast. The primers used for gene cloning and vector construction are listed in Supplementary Table S2. The information of all vectors is described in Supplementary Text S3.

2.6. Subcellular Localization Assay

The pEAQ-GFP fusion vectors (pEAQ-HmoCYP76AD1, pEAQ-HmoDODAα1, pEAQ-HmoDODAα2, and pEAQ-HmocDOPA-5GT), positive control GFP vector, and the nuclear and plasma membrane RFP marker [49] were transformed into Agrobacterium tumefaciens strain GV3101 (Coolaber, Beijing, China) using the freeze-thaw method. The bacterial suspensions harboring the RFP marker and pEAQ-GFP fusion vectors were mixed with 1:1 ratio and co-infiltrated into the abaxial side of 4- to 6-week-old N. benthamiana plants according to the method of Cheng et al. (2017) [40]. Two to three days after infiltration, the abaxial epidermis of the leaves was subjected to confocal microscopy (Zeiss LSM 7 DUO, Oberkochen, Germany). The fluorescence signals were detected using an emission bandwidth of 488/505-525 nm for GFP and 543/585-615 nm for RFP.

2.7. VIGS of Candidate Genes in H. monacanthus

Fragments of HmoCYP76AD1 (421 bp), HmoDODAα1 (407 bp), HmoDODAα2 (365 bp), and HmocDOPA-5GT (491 bp) genes were cloned into the pTRV2 vector, transformed into A. tumefaciens strain GV3101 (Coolaber, Beijing, China) and infiltrated into the scales of ‘Hongguan No. 1’ pitaya on the 23 DAAP following the method of Xie et al. (2020) [39]. The A. tumefaciens was suspended to an OD600 of 0.4 with VIGS infiltration buffer (10 mM MES, 10 mM MgCl2 and 200 μM acetosyringone). Bacterial suspension harboring pTRV2-HmoCYP76AD1, pTRV2-HmoDODAα1, pTRV2-HmoDODAα2 or pTRV2-HmocDOPA-5GT vector and pTRV1 plasmid were mixed in a 1:1 ratio and used for co-infiltration. A. tumefaciens strains harboring pTRV2-HmB5GT1 and pTRV2 were used as positive and negative controls, respectively. Fifteen fruits were used for VIGS. Phenotypes were observed after 14 d of cultivation at 25 °C with 75% relative humidity. Samples were collected for betalain content and gene expression analyses. Betalains were extracted and measured following the method of Hua et al. (2016a) [35].

2.8. Genetic Transformation of A. thaliana

The constructed plasmids (pPZP6k90-HmoDODAα1 and pPZP6k90-HmoDODAα2) were separately introduced into the A. tumefaciens strain GV3101 (Coolaber, Beijing, China) and transferred to A. thaliana using the floral dipping transformation method [50]. T0 seeds were harvested, and transgenic lines were selected on MS medium supplemented with 100 mg/L kanamycin and confirmed by PCR analyses. T3 transgenic homozygous seedlings were used for phenotypic characterization and gene expression analyses.
Ten-day-old A. thaliana seedlings were transferred onto plates containing absorbent paper with 10 mM L-DOPA solution. Sterile water was substituted for the L-DOPA as a negative control. Inflorescences from transformed A. thaliana seedlings were collected and immersed in 10 mM L-DOPA solution or water for 24 h. Betalain pigment production in A. thaliana seedlings and inflorescences were photographed after 24 h treatment.

2.9. Transient Expression Assay in N. benthamiana

Transient expression vectors pC18 containing candidate genes (HmoCYP76AD1, HmoDODAα1, HmoDODAα2, HmoB5GT1 and HmocDOPA-5GT) were introduced into A. tumefaciens strain GV3101 (Coolaber, Beijing, China), respectively. Transient expression in N. benthamiana was performed as described previously [22,51]. A. tumefaciens strains were grown overnight in YEP media and resuspended in infiltration buffer (10 mM MES, 10 mM MgCl2 and 100 μM acetosyringone) to a final OD600 of 0.2–0.3. Agrobacteria harboring different plasmids were mixed in a 1:1 ratio before infiltration. Pigment deposition in the infected N. benthamiana leaves was analyzed within 2–3 d after co-infiltration. Betalains were extracted and measured as described by Hua et al. (2016a) [35]. 0.1 g fresh leaves were ground and mixed with 1 mL 80% (v/v) aqueous methanol solution. After sonicating for 10 min, samples were centrifuged and kept at room temperature for 20 min in darkness. Then the supernatants were measured through spectrophotometry (Infinite M200, Shanghai, China) at 478 nm for betaxanthins and 538 nm for betacyanins. Three biological replicates were performed for each experiment.

2.10. Recombinant Expression in Yeast

Coding sequences of candidate genes related to betalain biosynthesis were recombined into pYES2-Ura (for HmoCYP76AD1 and HmocDOPA-5GT), pYES3-Trp (for HmoDODAα1 and HmoDODAα2) and pESC-Ura (for tandem HmoCYP76AD1 and HmocDOPA-5GT) vectors, respectively. The constructed plasmids were transformed into Saccharomyces cerevisiae strain INVSc1 (Coolaber, Beijing, China) using the polyethylene glycol/lithium acetate (PEG/LiAc) method (Coolaber, Beijing, China). A single gene or different combinations of CYP76AD1-DODA and CYP76AD1-DODA-cDOPA5GT were transferred into yeast competent cells. Yeast strains were cultured overnight in SD medium lacking Ura and Trp (SD/SD- Ura -Trp). Single colonies were picked and transferred into liquid SC/SC- Ura -Trp with 2 mM ascorbate and 10 mM L-DOPA, and grown overnight at 200 rpm in a shaking water bath at 30 °C. An aliquot of 1 mL supernatant was transferred to a rotary evaporator to remove water, re-suspended in 100 μL of ddH2O, and then detected by spectral analysis (Infinite M200, Shanghai, China).

2.11. Statistical Analysis

The experiments were carried out at least three individual biological replicates. Data in figures are the mean ± standard errors (S.E.). Statistical analysis of one-way ANOVA was used to determine the significant differences using SPSS 17.0 software at p < 0.05 and p < 0.01.

3. Results

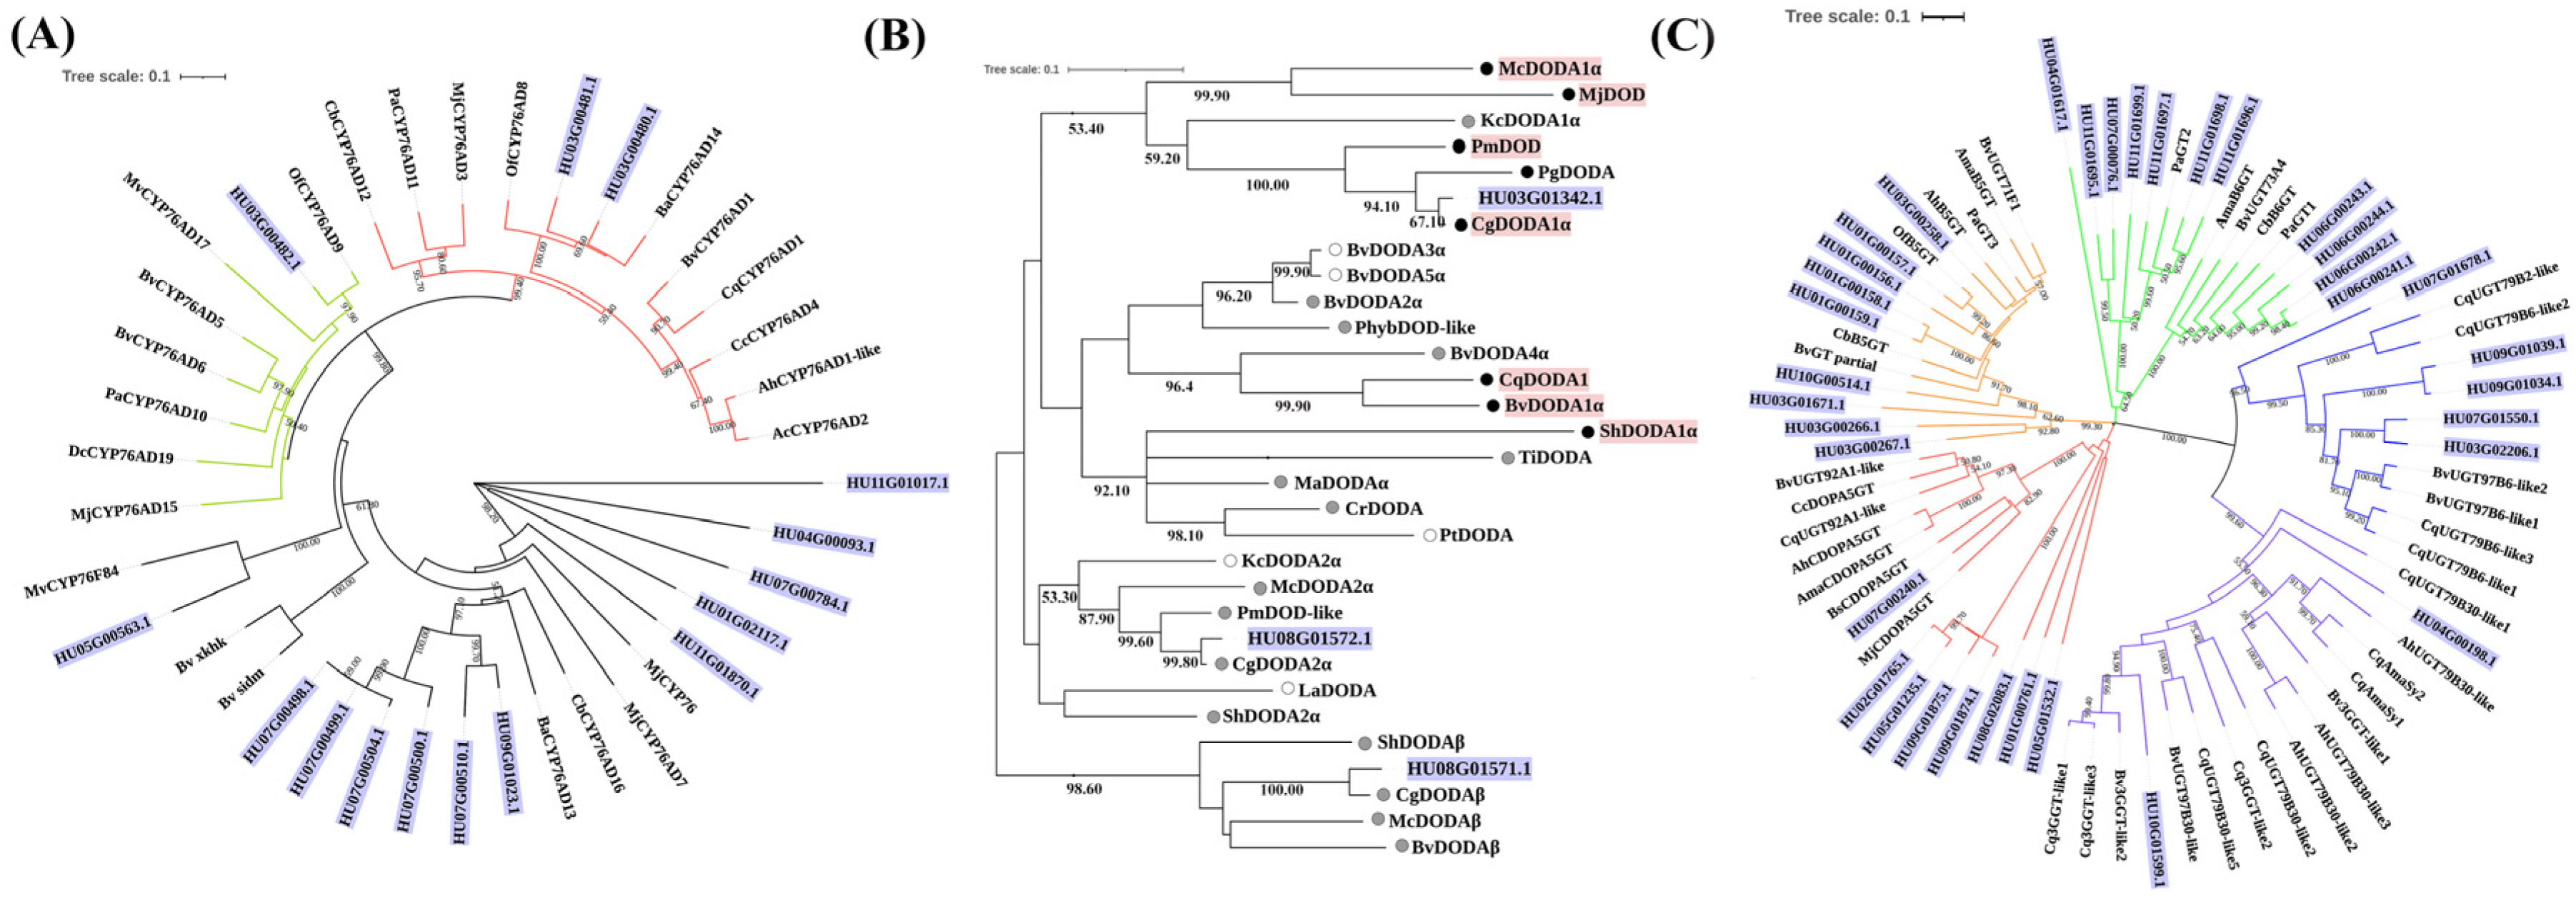
3.1. Identification and Classification of Candidate Genes Involved in Betalain Biosynthesis

Potential encoding genes involved in pitaya betalain biosynthesis were comprehensively screened by alignment using TBtools (Table S1). These candidate genes were further manually screened according to the completeness of conserved domains. A total of 53 candidate genes related to betalain biosynthesis were identified in the pitaya genome (Table S3), including 15 CYP76AD, 3 DODA and 35 GTs genes.
Three phylogenetic trees were generated to analyze the phylogenetic relationships of the 53 candidate genes (Figure 2). The 15 candidate CYP76AD proteins were classified into CYP76AD-α, CYP76AD-β and CYP76AD1-γ clades (Figure 2A). HU03G00480.1 and HU03G00481.1 belonged to the CYP76ADα clade, which synthesize both L-DOPA and cyclo-DOPA. HU03G00482.1 belonged to the CYP76ADβ clade, exhibiting tyrosine hydroxylase activity. The other 12 genes belonged to unknown CYP76AD1-γ clade (Figure 2A). Three DODAs (HU03G01342.1, HU08G01571.1 and HU08G01572.1) and 29 homologous proteins from betalain-producing plants were further analyzed. HU03G01342.1 and HU08G01572.1 belonged to the DODAα clade, while HU08G01571.1 was classified into the DODAβ clade (Figure 2B). GTs were divided into five groups: B5GT, B6GT, cDOPA5GT, UGT79B6 and UGT7B30. Among the 35 GTs proteins, nine belonged to B5GT, 11 to B6GT, eight to cDOPA5GT, five to UGT79B6, and two to UGT7B30 (Figure 2C).

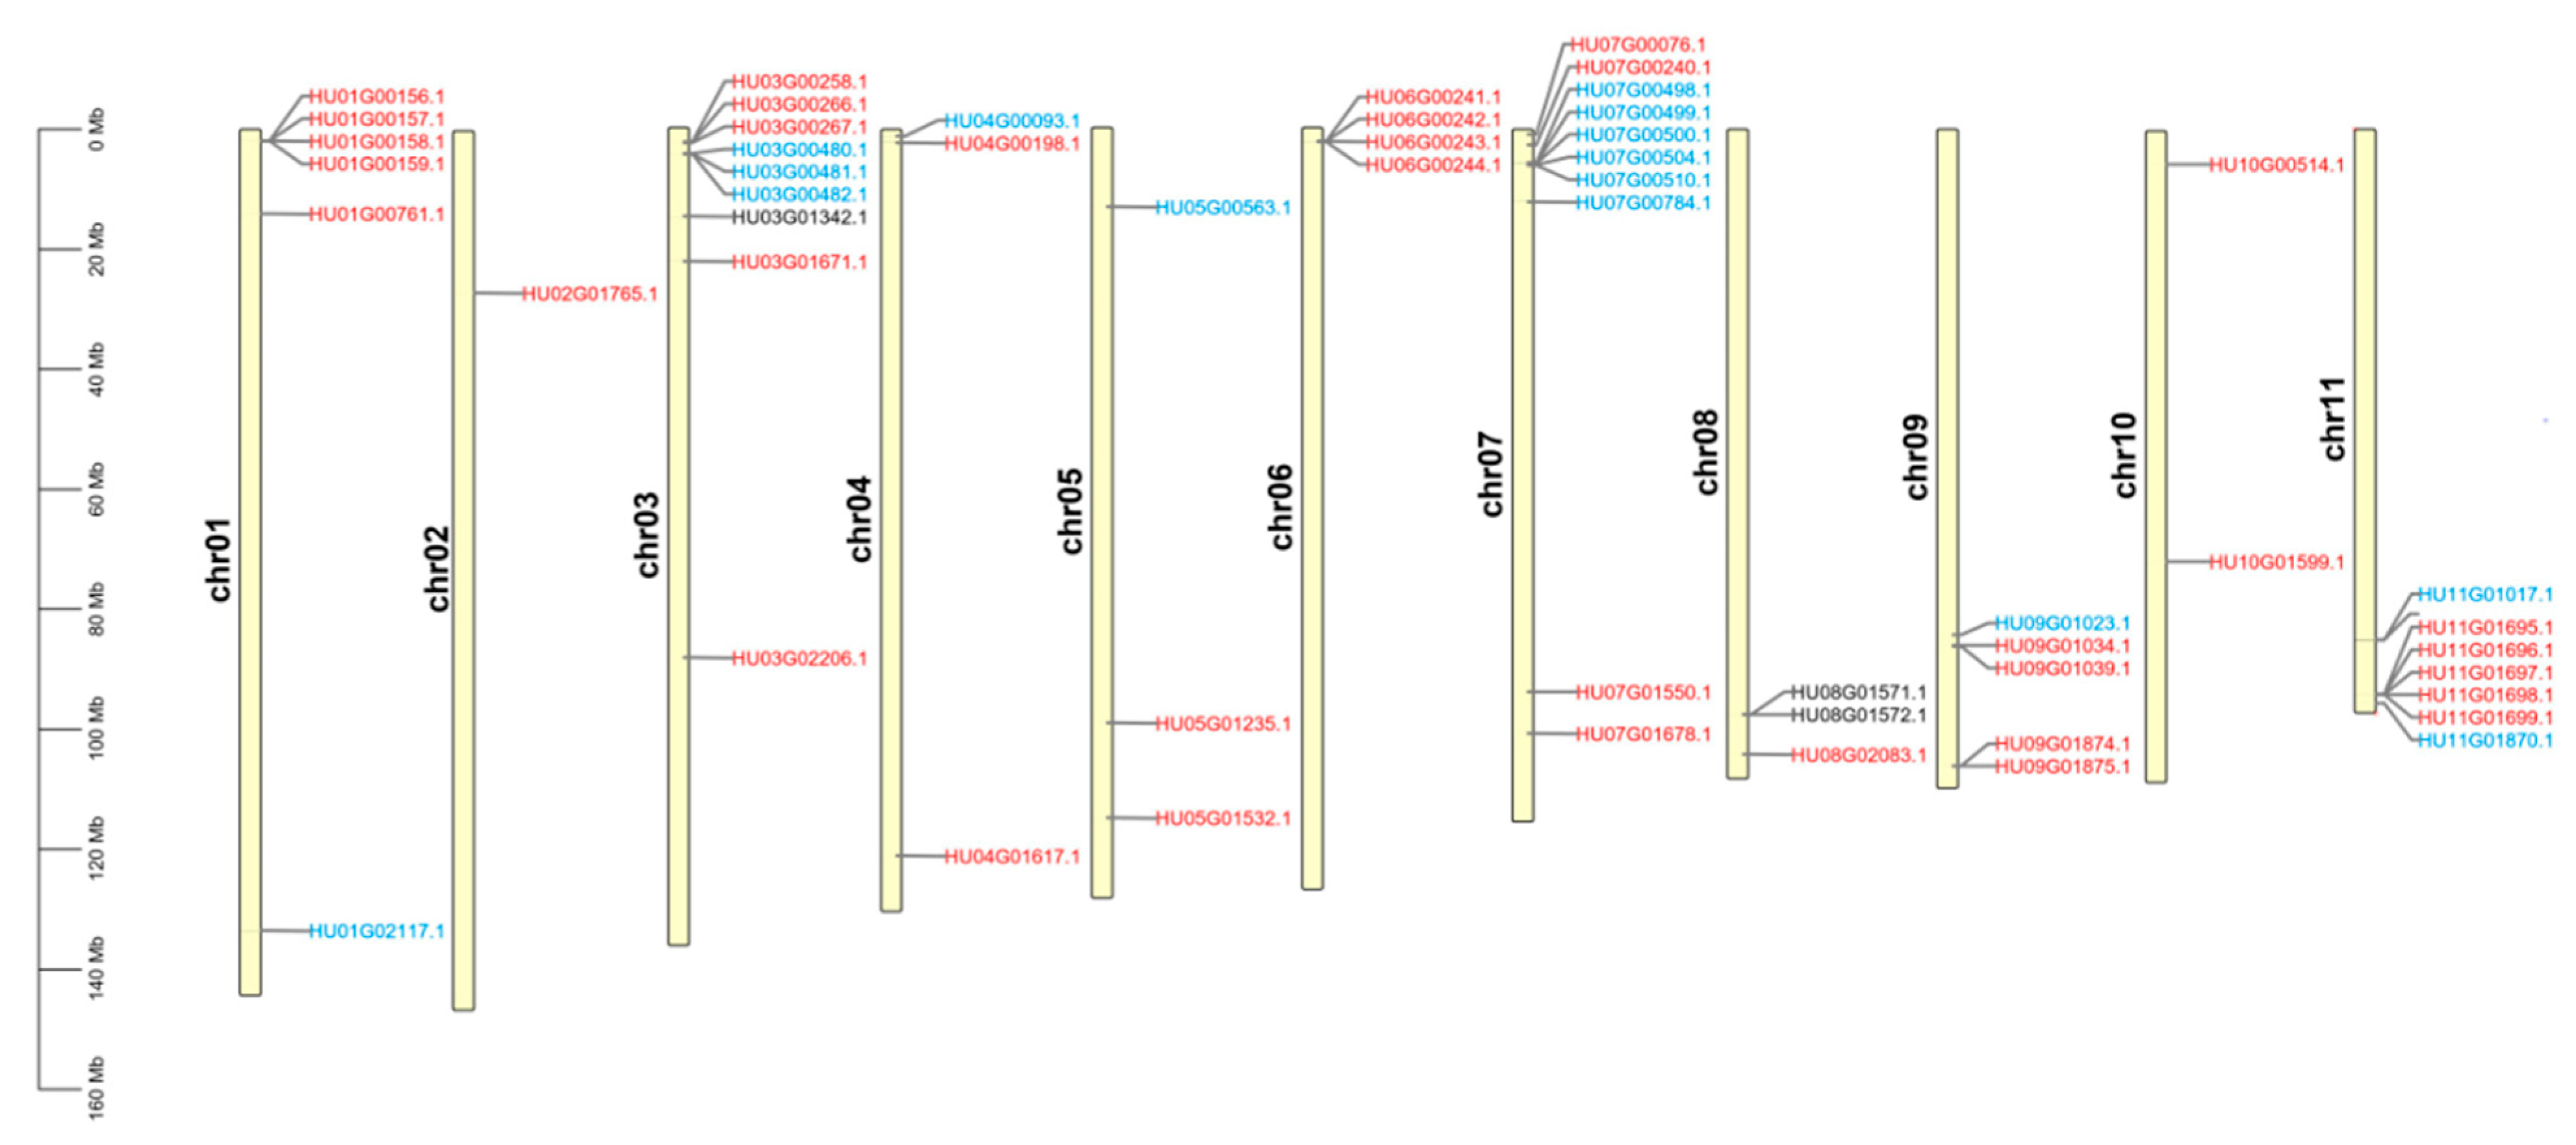
3.2. Genomic Distribution among Pitaya Chromosomes

The 53 candidate genes were mapped on 11 pitaya chromosomes (Figure 3). CYP76AD, DODA, and GTs genes were distributed on different chromosomes. Most of these candidate genes were mapped on Chr 3 (9 genes; 17.0%) and Chr 7 (10 genes; 18.7%). All DODA genes were distributed on Chr 3 and Chr 8. GTs were uniformly distributed on Chr 4 to Chr 11, while no CYP76AD was detected on Chr 2, Chr 6 and Chr 8.

3.3. Gene Characteristics and Structures

The lengths of the genomic and protein sequences, isoelectric point (pI), molecular weight (MW), grand average of hydropathicity (GRAVY), number of exons and instability index of the 53 candidate genes were comprehensively analyzed to obtain more information about the nature of the proteins (Table S3 and Figure S1). The genomic sequence lengths of CYP76ADs ranged from 1796 bp (HU09G01023.1) to 71,367 bp (HU11G01017.1). The protein lengths ranged from 438 amino acids (HU07G00784.1) to 1835 amino acids (HU11G01017.1) with MW 49.88 to 208.48 kDa. The pI ranged from 5.98 (HU07G00784.1) to 9.39 (HU03G00481.1). Twelve proteins had a negative GRAVY score, indicating that they were hydrophilic in nature. Moreover, eight proteins were unstable (Table S3). Most of the full-length CYP76AD genes had two exons, except that HU01G02117.1, HU07G00500.1, HU07G00841.1, HU04G00093.1, and HU11G01017.1 had 3, 4, 4, 5 and 8 exons, respectively (Figure S1).
The genomic full-length sequences of DODAs were 9485 bp (HU03G01342.1), 3921 bp (HU08G01571.1) and 3882 bp (HU08G01572.1), respectively. The protein lengths ranged from 271 amino acids (HU07G00784.1) to 375 amino acids (HU11G01017.1); the MW were from 29.94 kDa to 42.17 kDa. The pI of DODAα (HU03G01342.1 and HU08G01572.1) were lower than that of DODAβ (HU08G01571.1). HU03G01342.1, HU08G01571.1 and HU08G01572.1 were hydrophilic stable proteins (Table S3). DODA genes had the same exon/intron structure: three exons and two introns (Figure S1).
The genomic full-length sequences of GTs ranged from 1392 bp (HU03G02206.1 and HU07G01550.1) to 21,223 bp (HU04G00198.1). The proteins were mainly distributed between 400 bp and 500 bp in length. The average molecular mass of GTs was ~52.70 kDa except for HU04G00198.1 (96.81 kDa). The encoded proteins were weak acidic protein as supported by their pI. Only five GT proteins had hydrophilicity greater than 0 indicating that most of these GT proteins were hydrophilic (Table S3). The 35 GTs genes had an average of 1.3 exons. Among these GTs proteins, 66% proteins were unstable and 77% contained one exon (Figure S1).

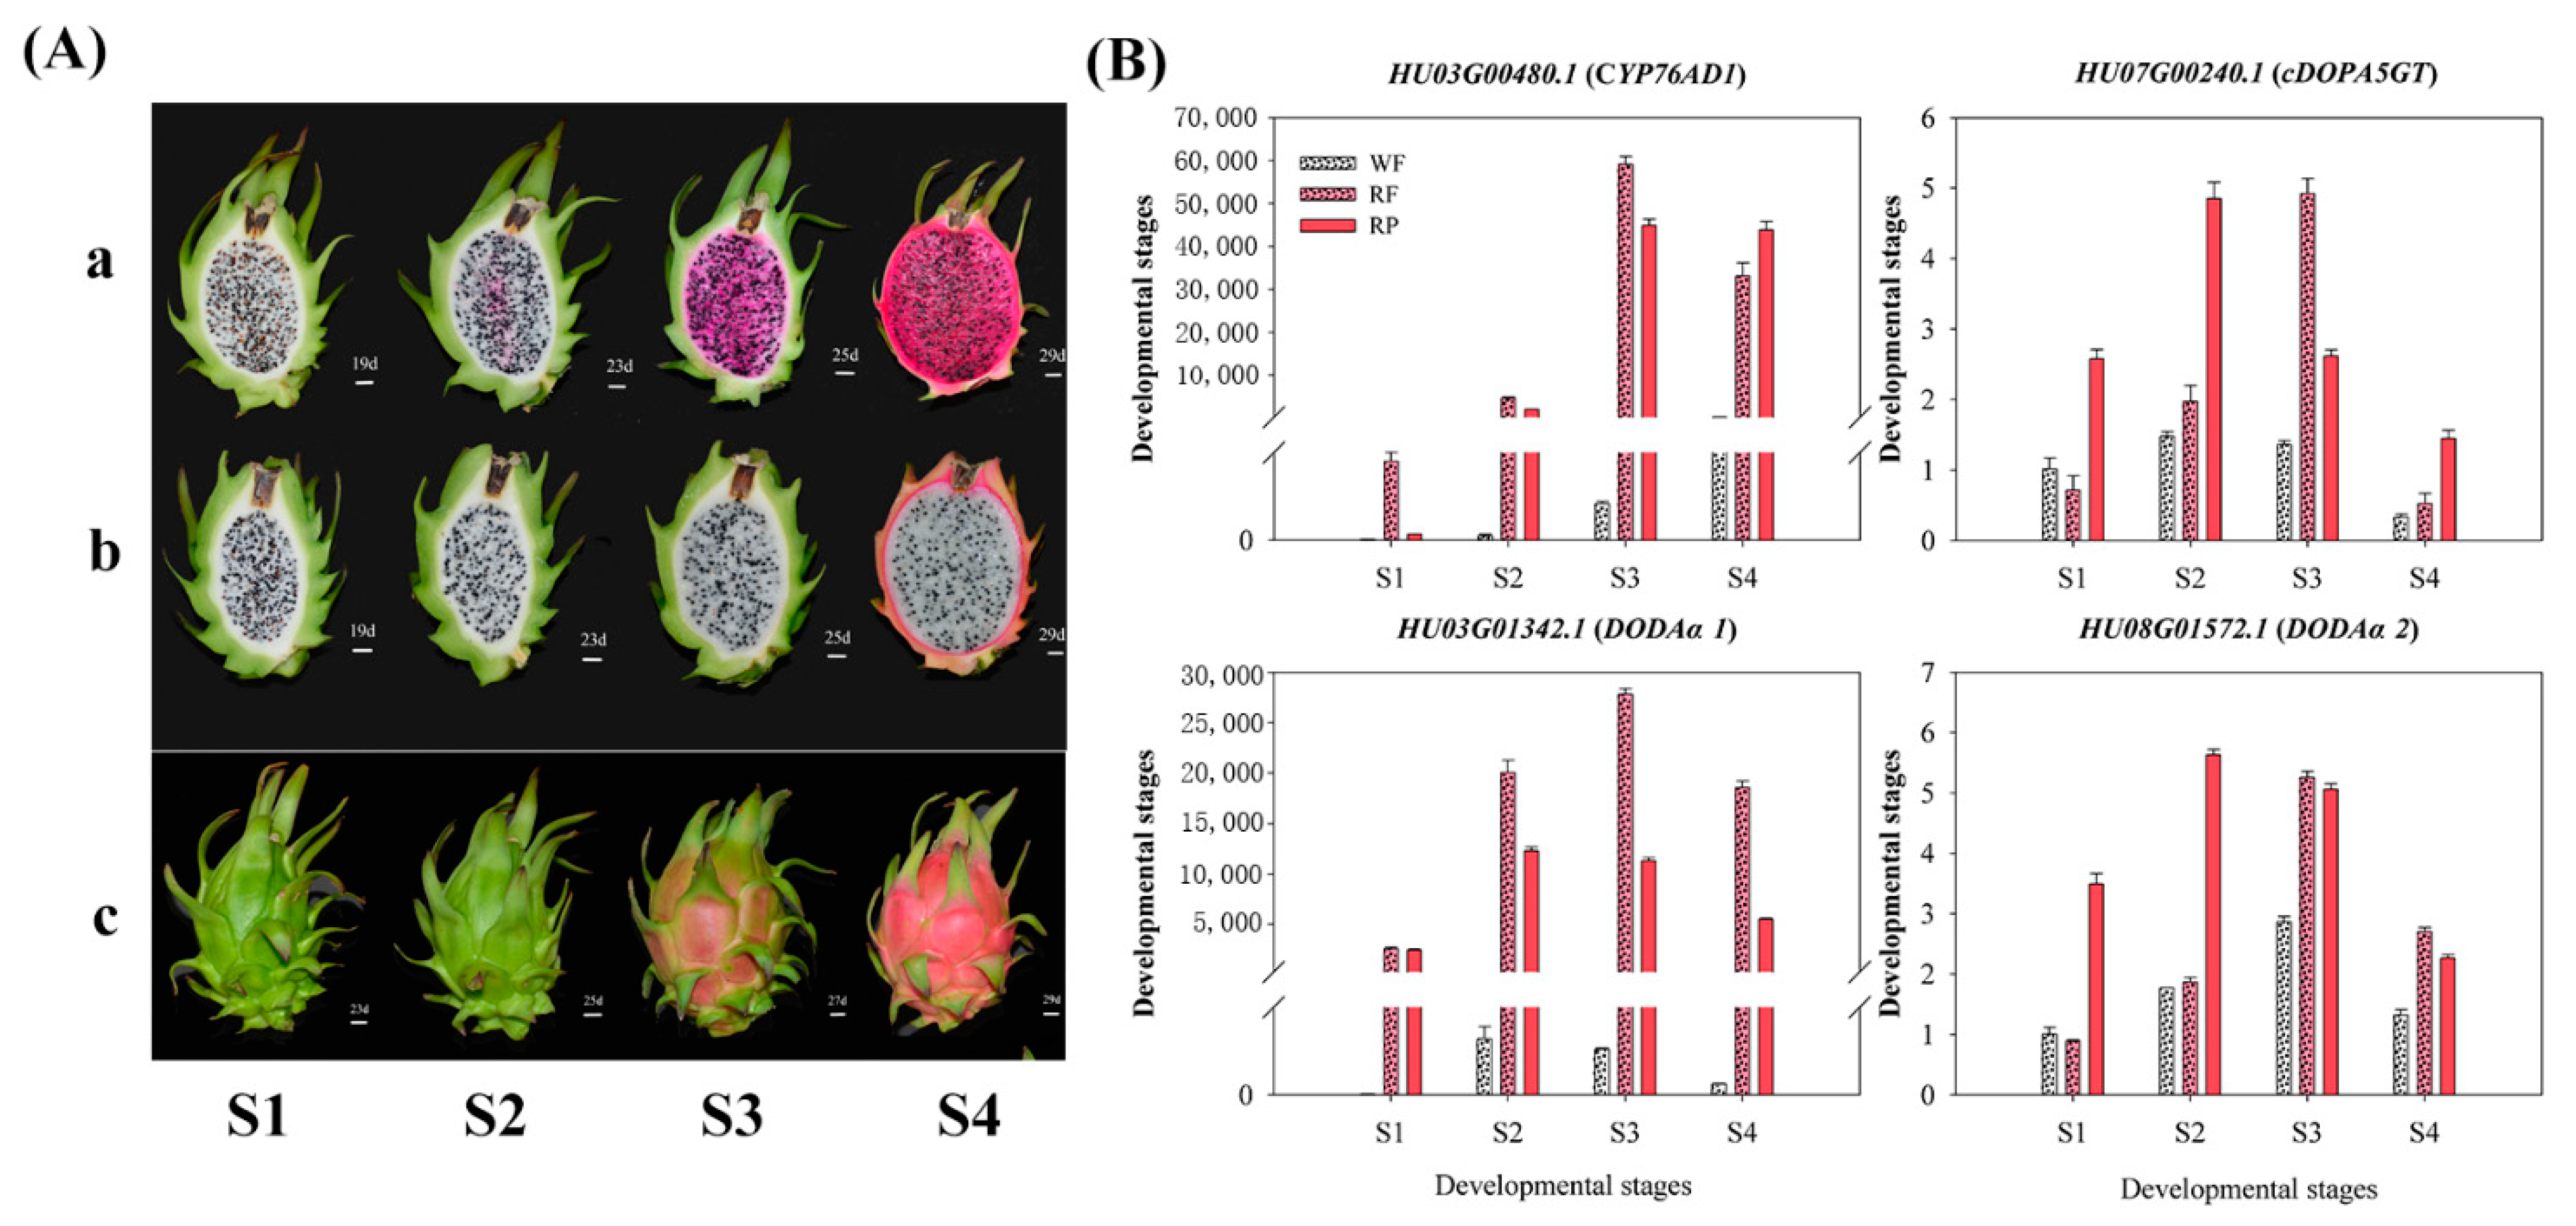
3.4. Expression Patterns of Candidate Genes Involved in Betalain Biosynthesis

The expression patterns of 36 candidate genes (nine CYP76ADs, three DODAs and 24 GTs) involved in pitaya betalain biosynthesis were analyzed during pitaya fruit development by qRT-PCR (Figure S2). cDNA and amino acid sequences of H. monacanthus and H. undatus were provided in the Supplementary Text S1. Amino acid sequence similarities between H. monacanthus and H. undatus were shown in Supplementary Table S4. As shown in Figure 1A, the pulp and peel color of ‘Guanhuahong’ pitaya began to turn red at S2 stage and continuously accumulated towards fully red, while the pulp color of ‘Guanhuabai’ pitaya did not change during fruit maturation. The expression levels of CYP76AD1 (HU03G00480.1, belonging to CYP76AD1-α) in pigmented tissues were higher than those of the white ones throughout fruit developmental stages (Figure 1B). Compared with ‘Guanhuabai’ pitaya, the expression of CYP76AD1 in ‘Guanhuahong’ pitaya displayed a sharp upward trend with pigmentation (Figure 1B). However, no close correlation was observed between the changes in genes belonging to the CYP76AD1-β or CYP76AD1-γ clade and the alterations of pigmentation. L-DOPA 4,5-dioxygenase in betalain-producing plants is encoded by DODA gene. The expression patterns of two DODAα genes (HU03G01342.1 and HU08G01572.1) were correlated with pigment accumulation: increasing during red pigmentation, while constantly low in white pulps. Expression levels of HU03G01342.1 were higher than HU08G01572.1 (Figure 1B). According to the reported betalain-related genes, GTs genes were categorized into B5GT, B6GT, cDOPA5GT, UGT79B6 and UGT7B30 (Figure 2C). The expression levels of cDOPA5GT (HU07G00240.1) increased gradually with betalain accumulation (Figure 1B). The expression patterns of CYP76AD1 (HU03G00480.1), DODAα (HU03G01342.1 and HU08G01572.1) and cDOPA5GT (HU07G00240.1) were consistent with betalain accumulation during pitaya fruit development (Figure 1B), suggesting that they are possibly involved in betalain biosynthesis in pitaya.

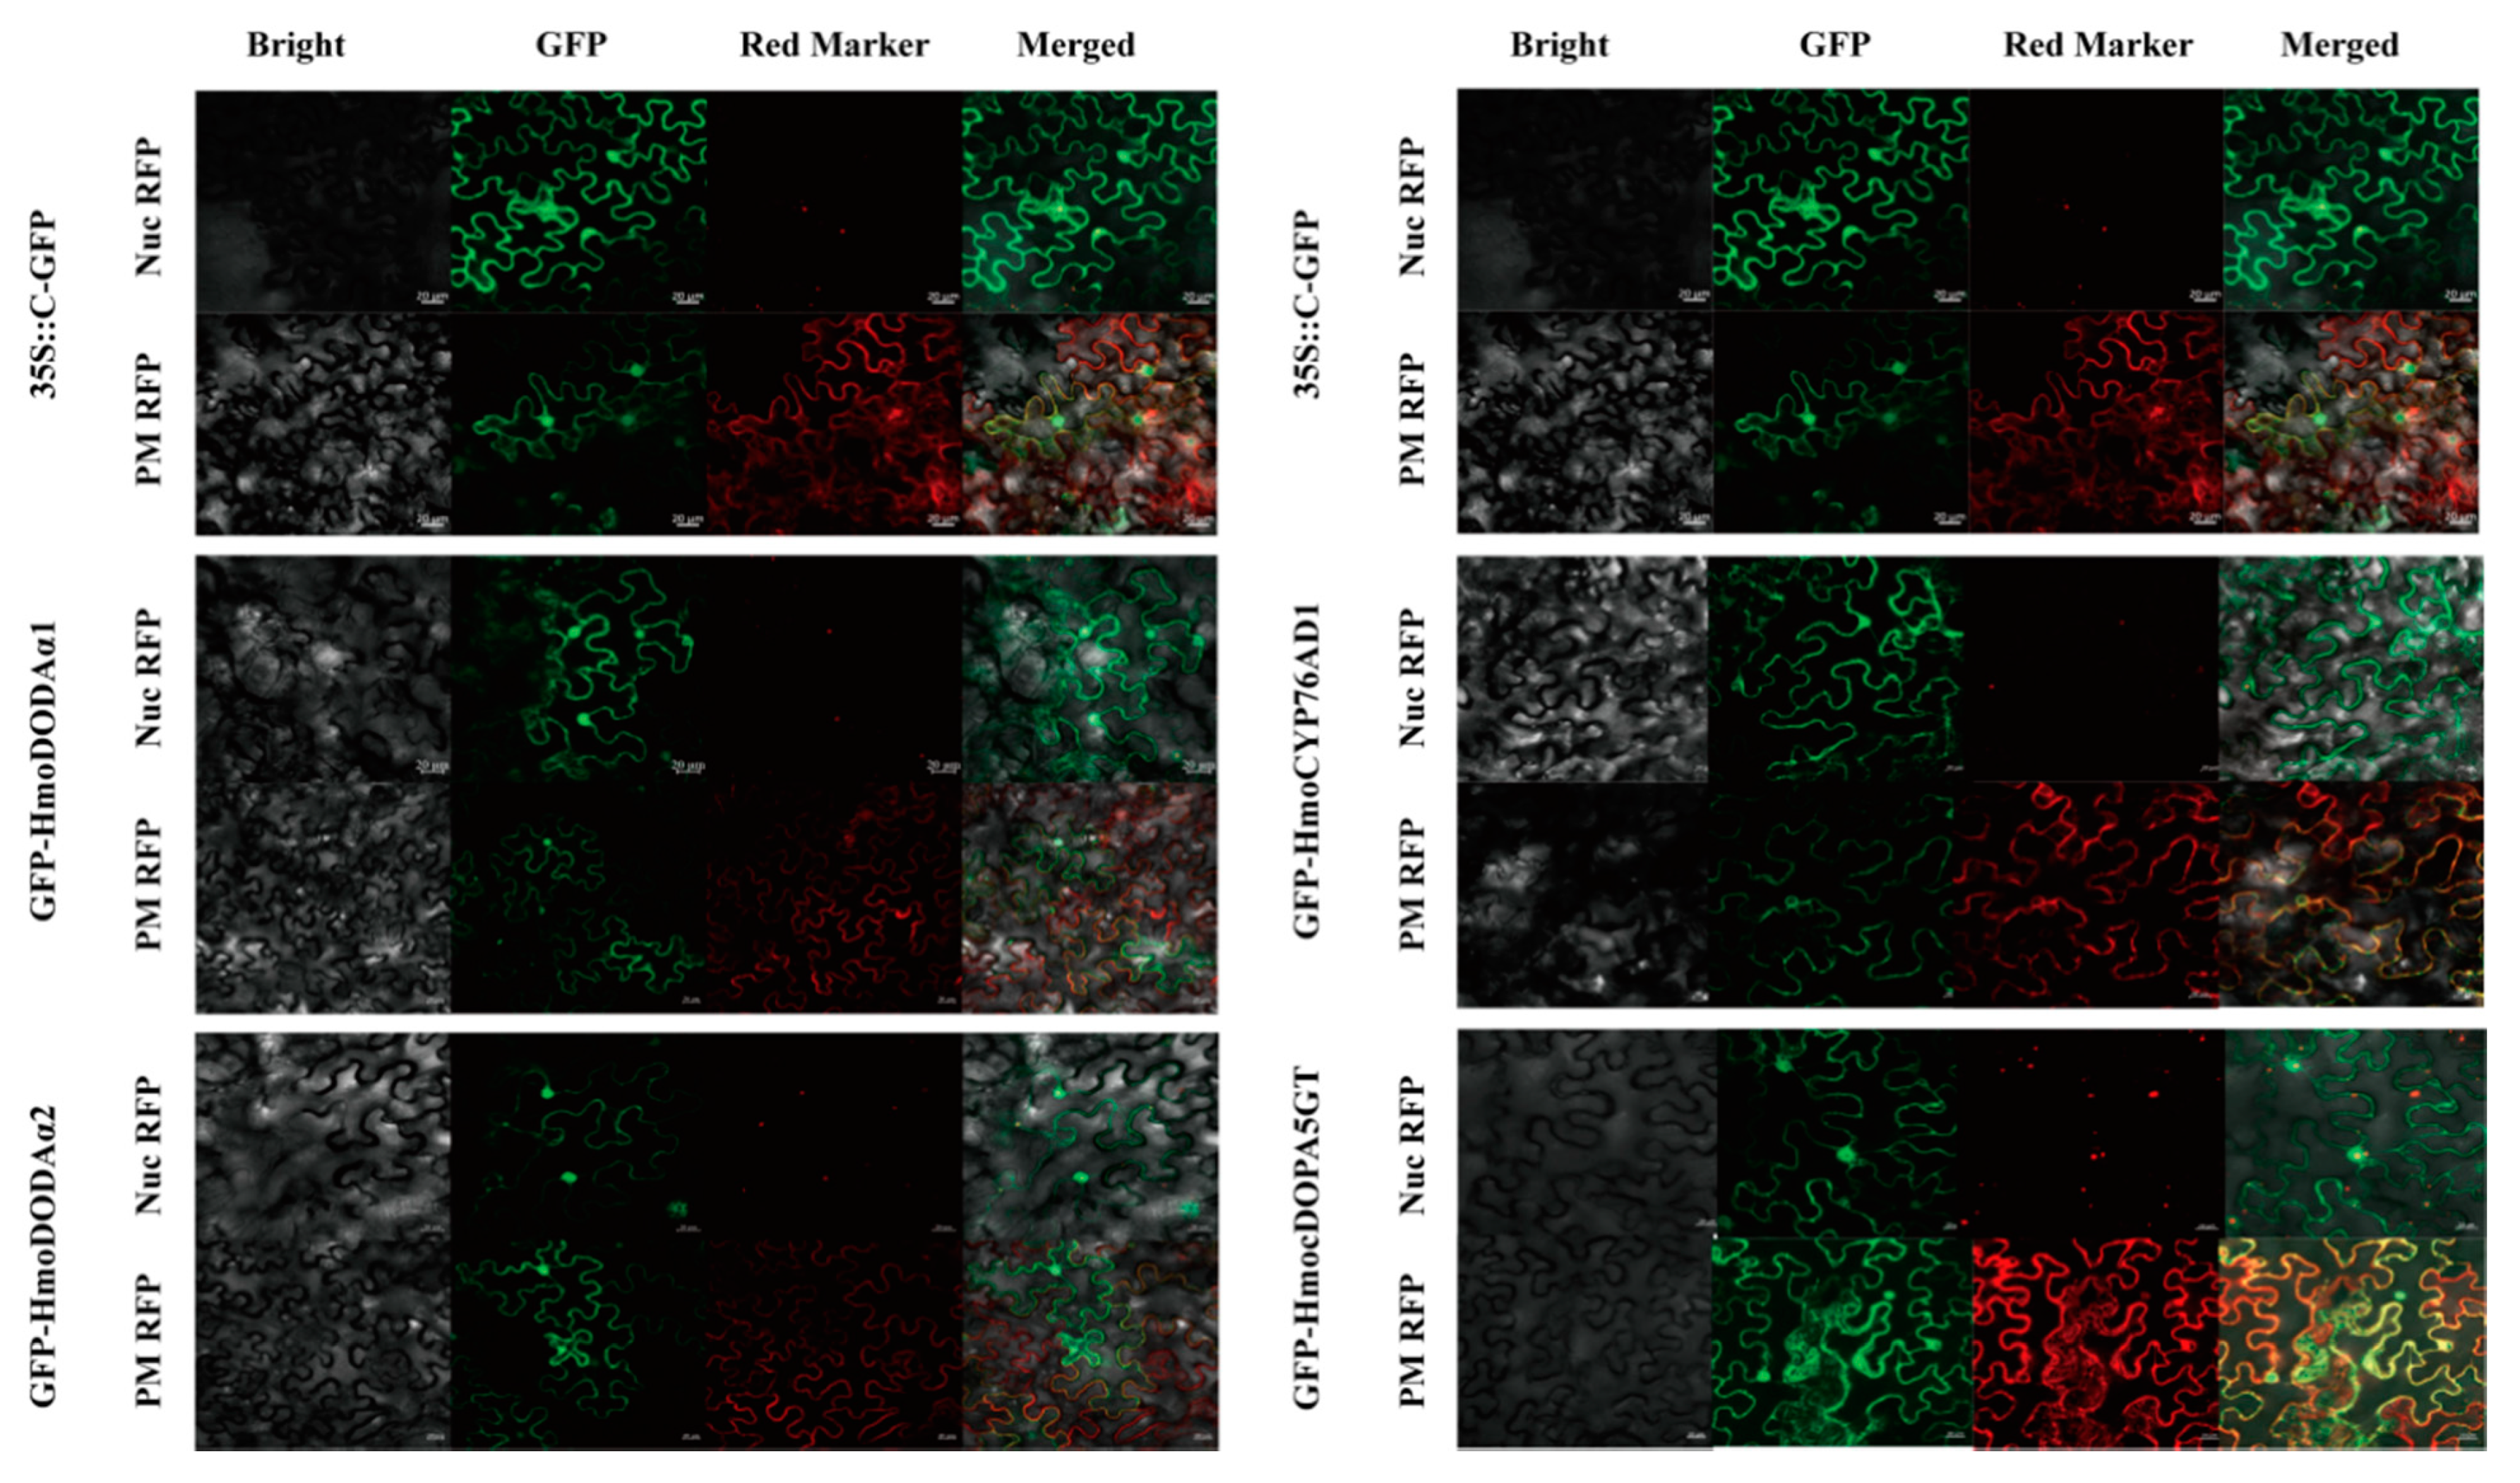
3.5. Subcellular Localizations

Subcellular localizations of HmoCYP76AD1, HmoDODAα1, HmoDODAα2 and HmocDOPA5GT were validated using the GFP tag. As shown in Figure 4, the HmoCYP76AD1-GFP, HmoDODAα1-GFP, HmoDODAα2-GFP and HmocDOPA5GT-GFP were localized to both the cytoplasm and nucleus in terms of stronger green fluorescent signals. These results are in accordance with previously reported studies [52]. The dual localization signals were coincided with those of the PM marker RFP and the nuclear signal matched with that of the nucleolar marker RFP when the fusion protein was co-expressed with the markers.

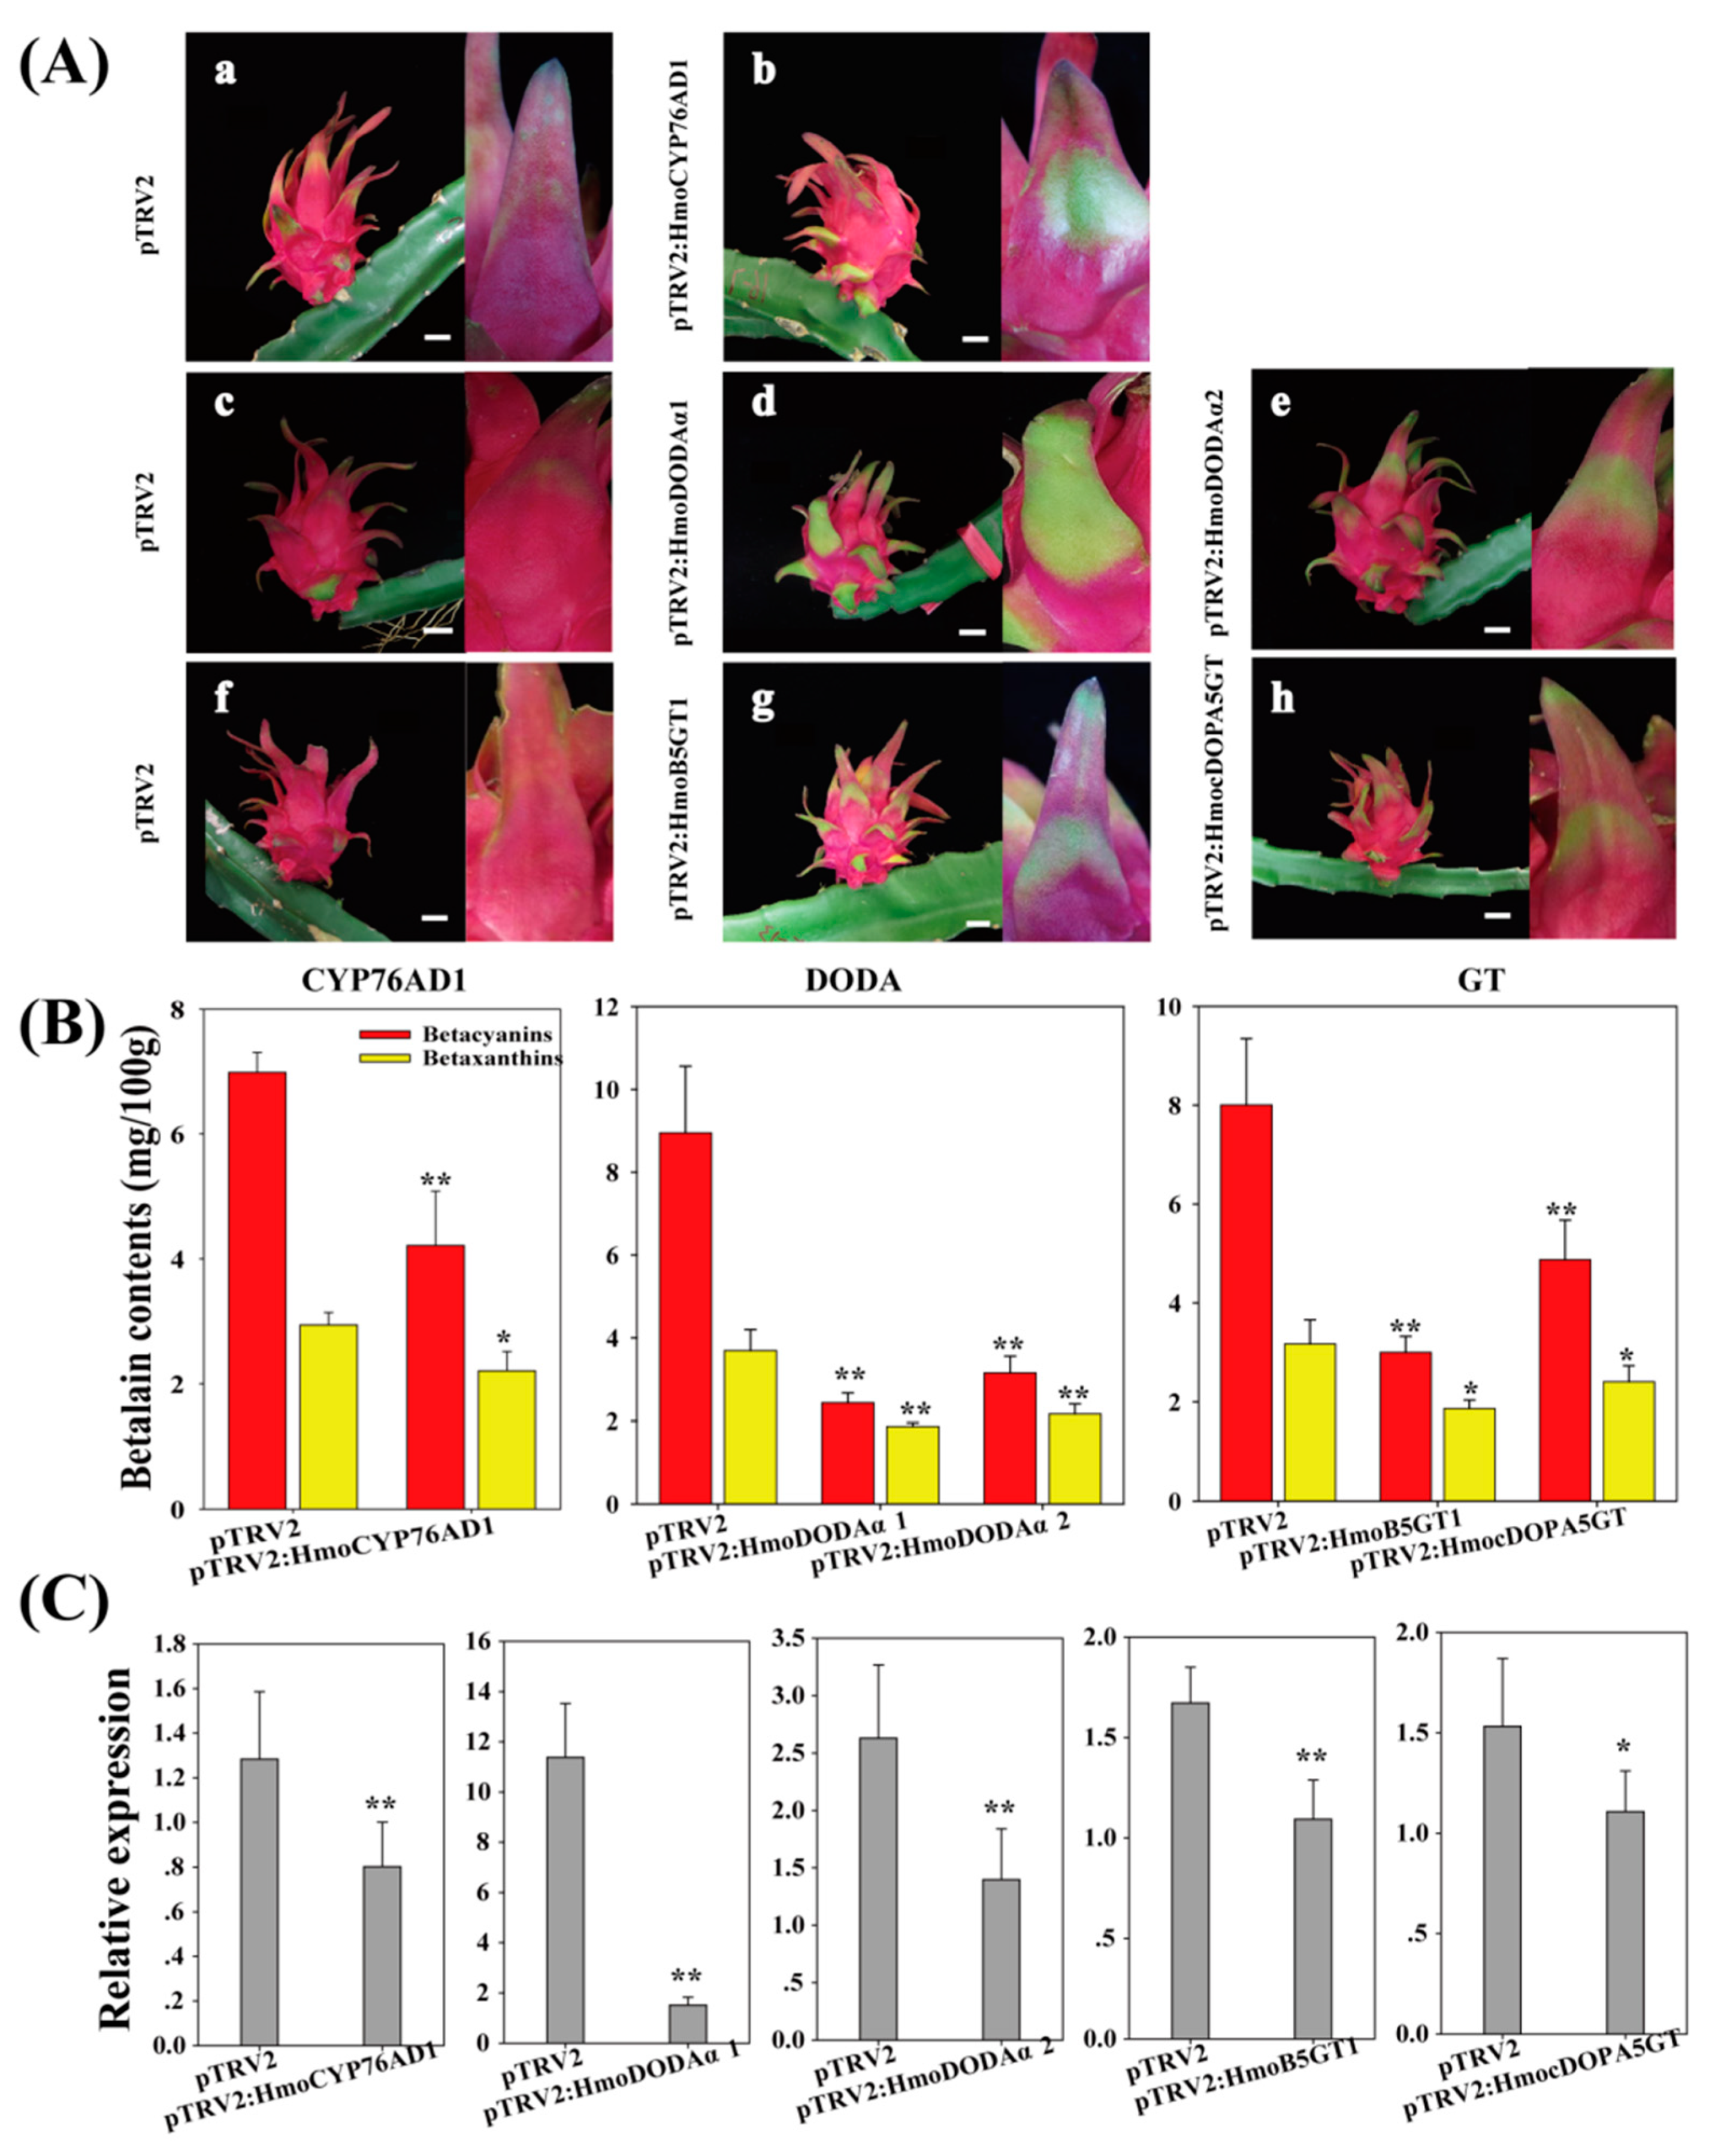
3.6. VIGS Analyses of Candidate Genes

Gene silencing assay was performed to further elucidate the functions of HmoCYP76AD1, HmoDODAα1, HmoDODAα2 and HmocDOPA5GT genes. Silencing HmoB5GT1 resulted in the loss of betalain accumulation in red scales of pitaya [39]. Therefore, pTRV2 and pTRV2-HmoB5GT1 were separately infiltrated pitaya scales and served as the negative and positive controls. Silencing HmoCYP76AD1, HmoDODAα1, HmoDODAα2 or HmocDOPA5GT resulted in the loss of betalain accumulation, which was evidenced by green scales (Figure 5A). Significant differences in contents of betacyanins and betaxanthins were detected in the gene-silenced tissues (Figure 5B). Results from qRT-PCR confirmed that HmoCYP76AD1, HmoDODAα1, HmoDODAα2 and HmocDOPA5GT were silenced (Figure 5C).

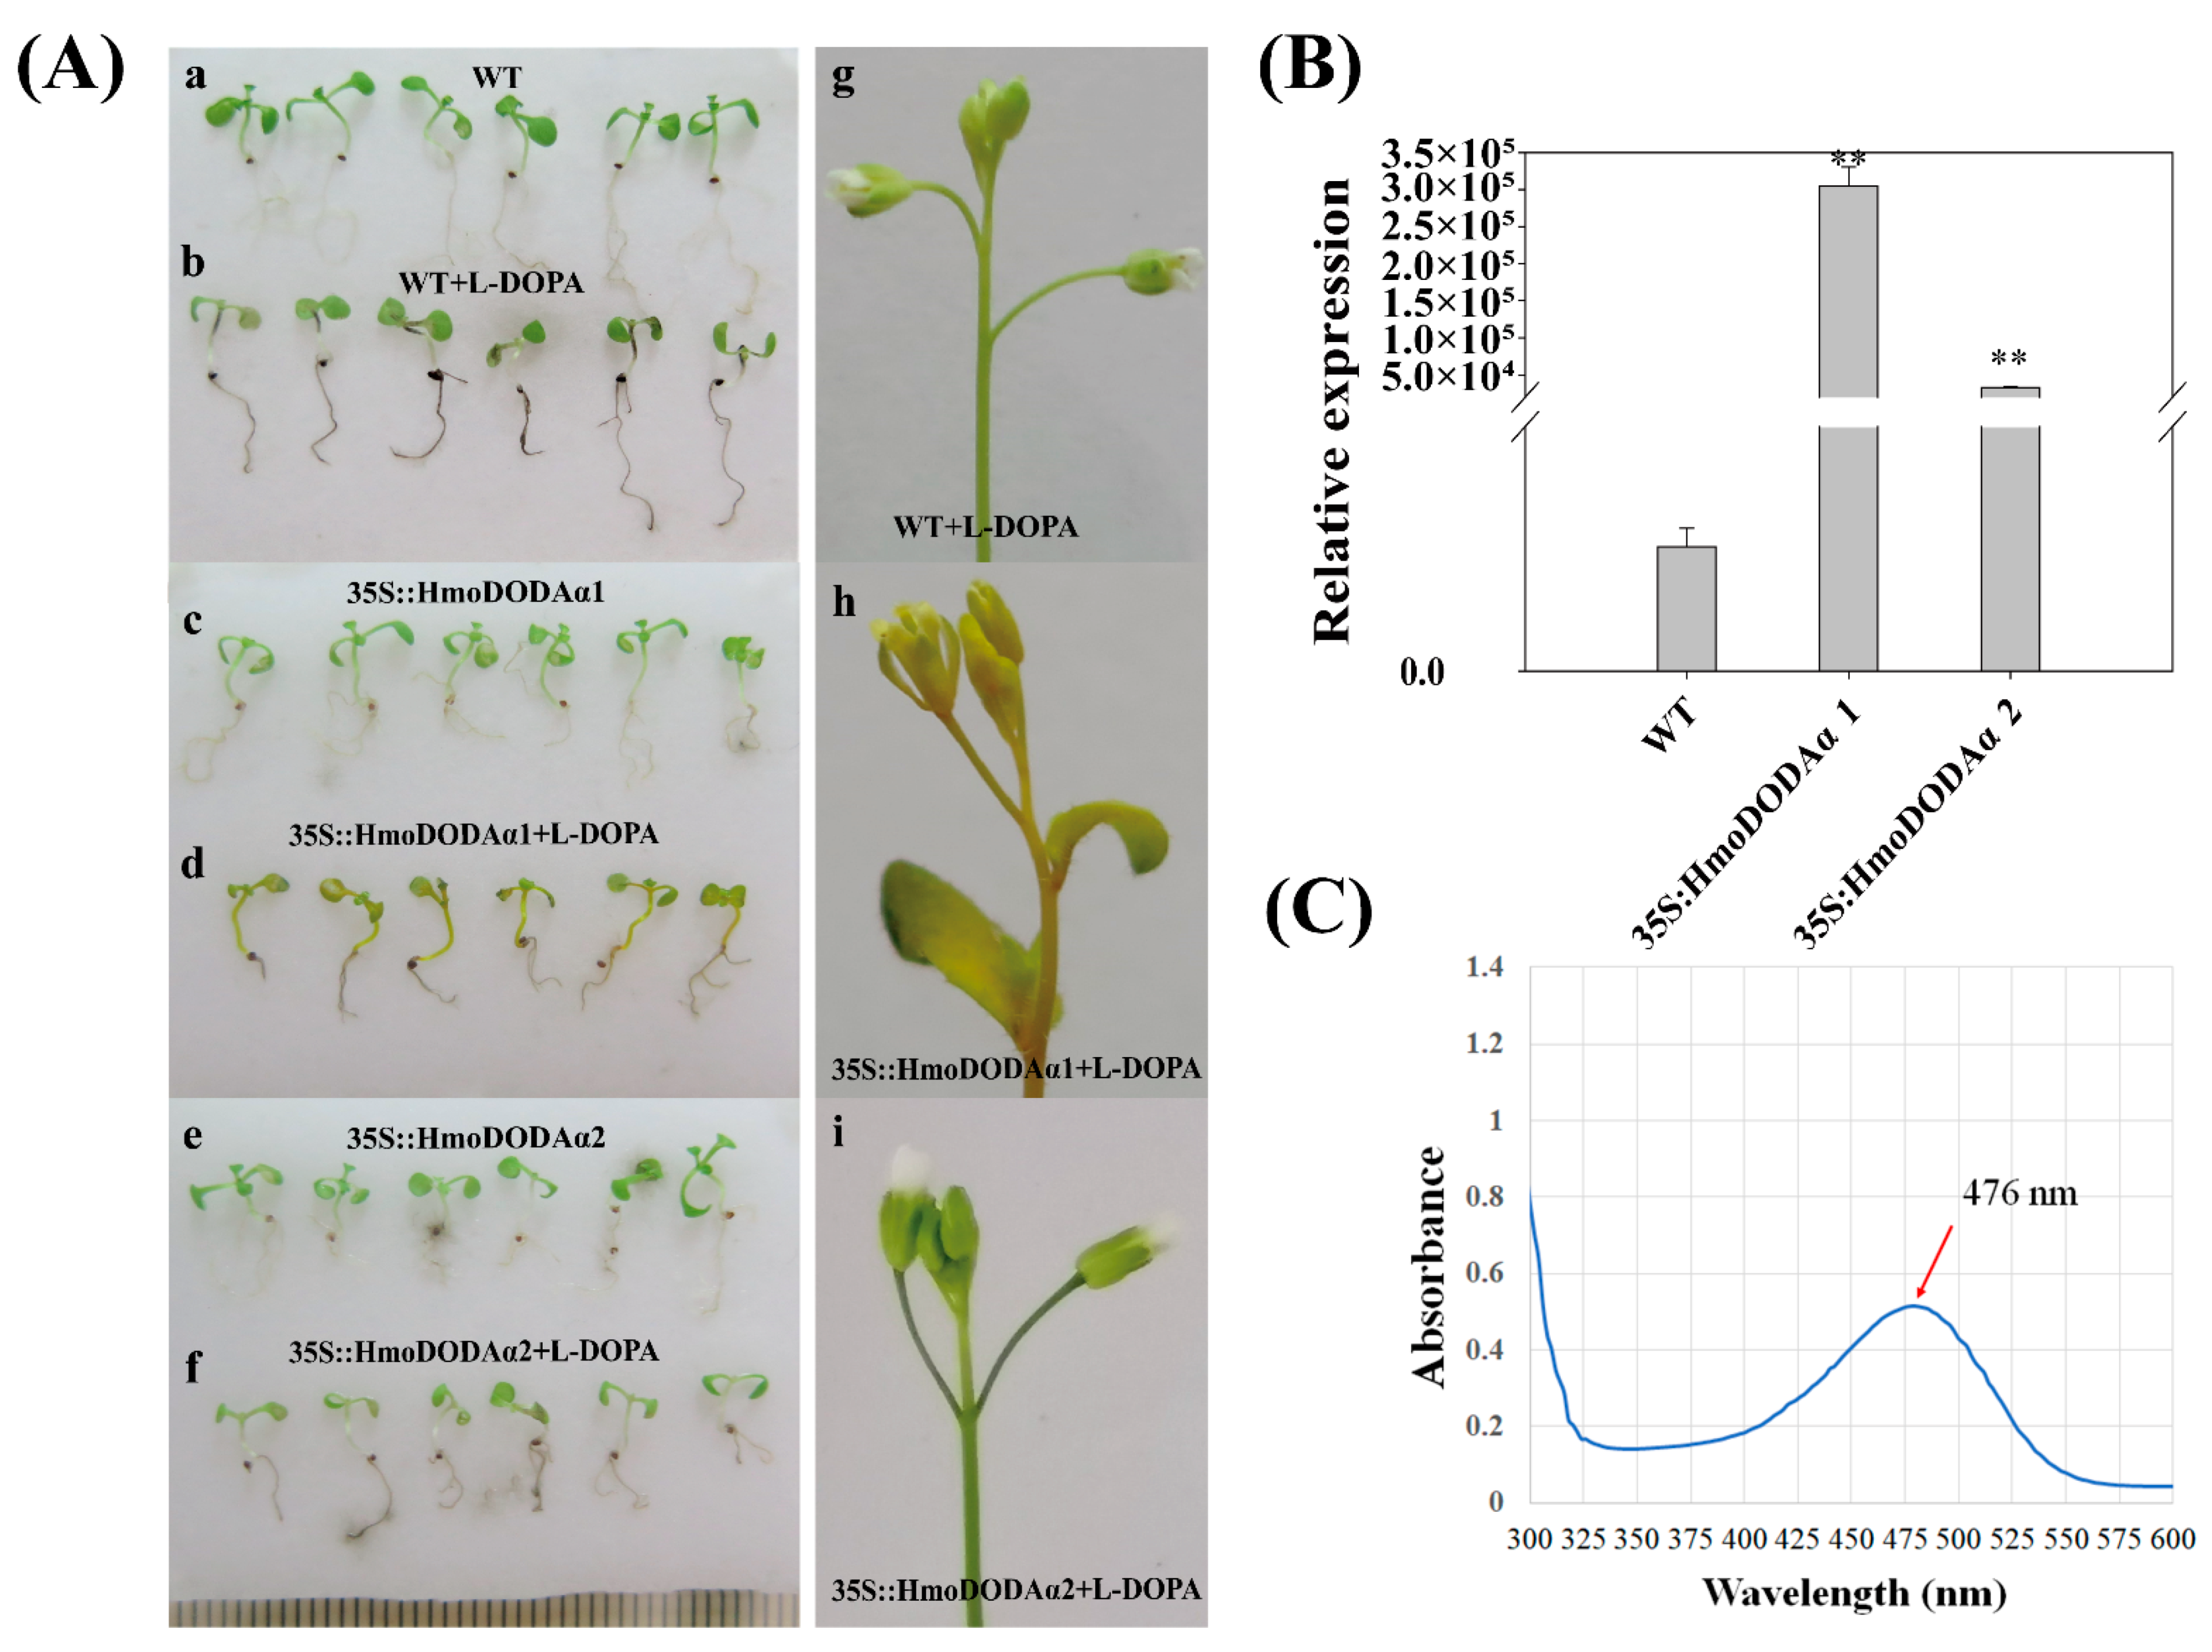
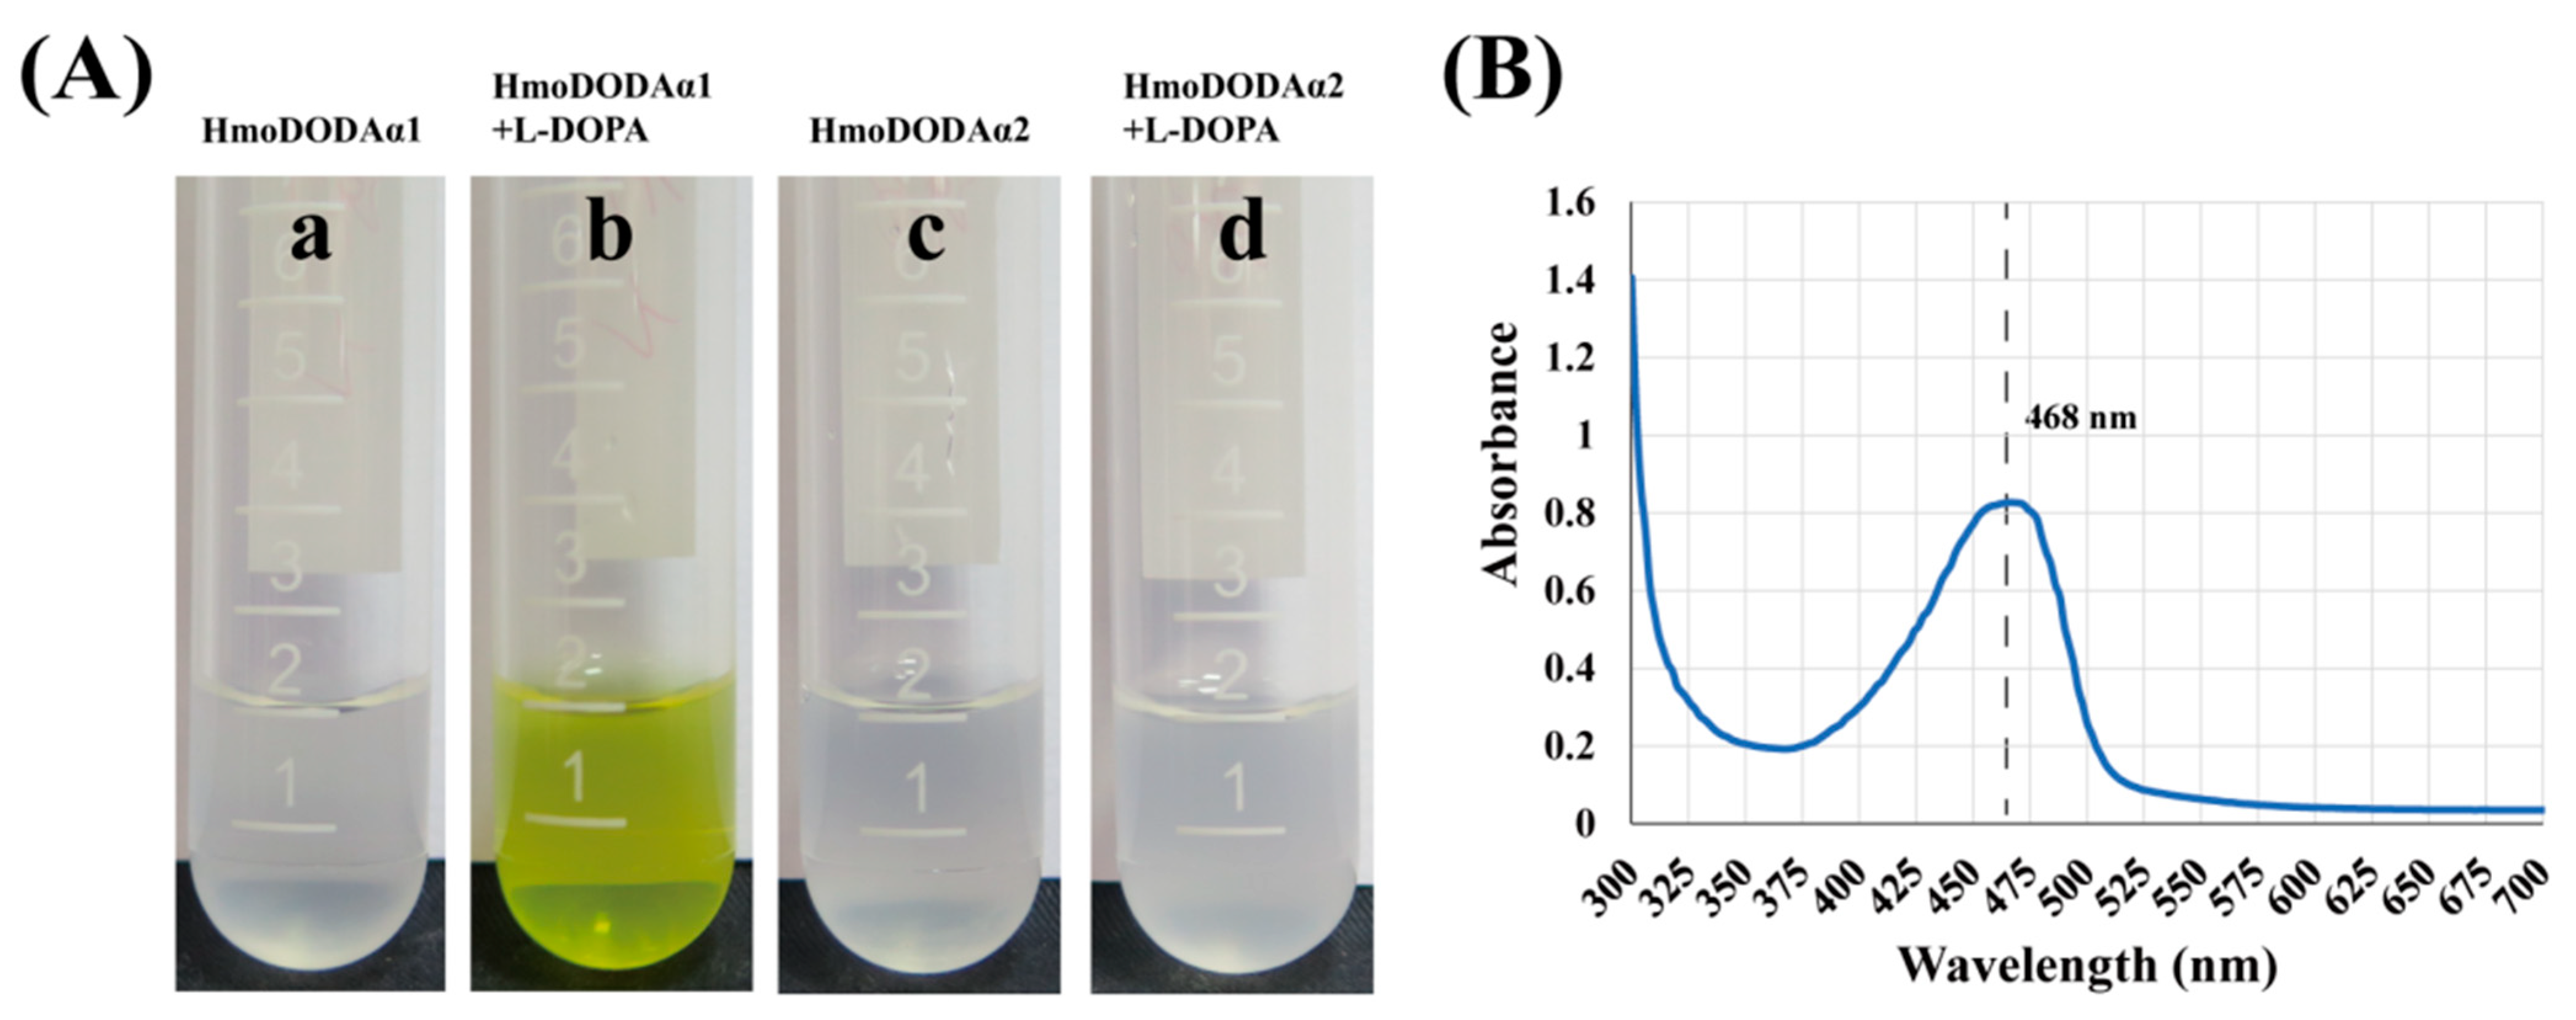
3.7. Overexpression of HmoDODAα1 and HmoDODAα2 in Arabidopsis and Yeast

To further confirm the role of HmoDODAα1 and HmoDODAα2, we generated transgenic A. thalianas plants constitutively expressing HmoDODAα1 and HmoDODAα2 driven by the 35S promoter (Figure 6). No pigmentation was observed in the wild-type and transgenic lines harboring HmoDODAα1/2 without L-DOPA (Figure 6A(a,c,e)). Yellow pigmentation was produced in the 35S::HmoDODAα1 transgenic T3 generation seedlings and inflorescences with the addition of L-DOPA (Figure 6A(d,h)). No yellow pigment was detected in the 35S::moDODAα2 transgenic lines after feeding L-DOPA (Figure 6A(f,i)). The expression levels of HmoDODAα1 and HmoDODAα2 in the transgenic lines were significantly higher than those of wild types (Figure 6B). Similar results were obtained in yeast (Figure 7). The expression of HmoDODAα1 in yeast supplemented with L-DOPA resulted in yellow cultures (Figure 7A(b)). The yellow pigments had a peak absorption at about 468 nm wavelength (Figure 6C and Figure 7B) which was the typical characteristic of betaxanthins [53]. Compared to HmoDODAα1, no visible pigment production in yeast was observed by expressing of HmoDODAα2 with the presence of L-DOPA (Figure 7A(d)).

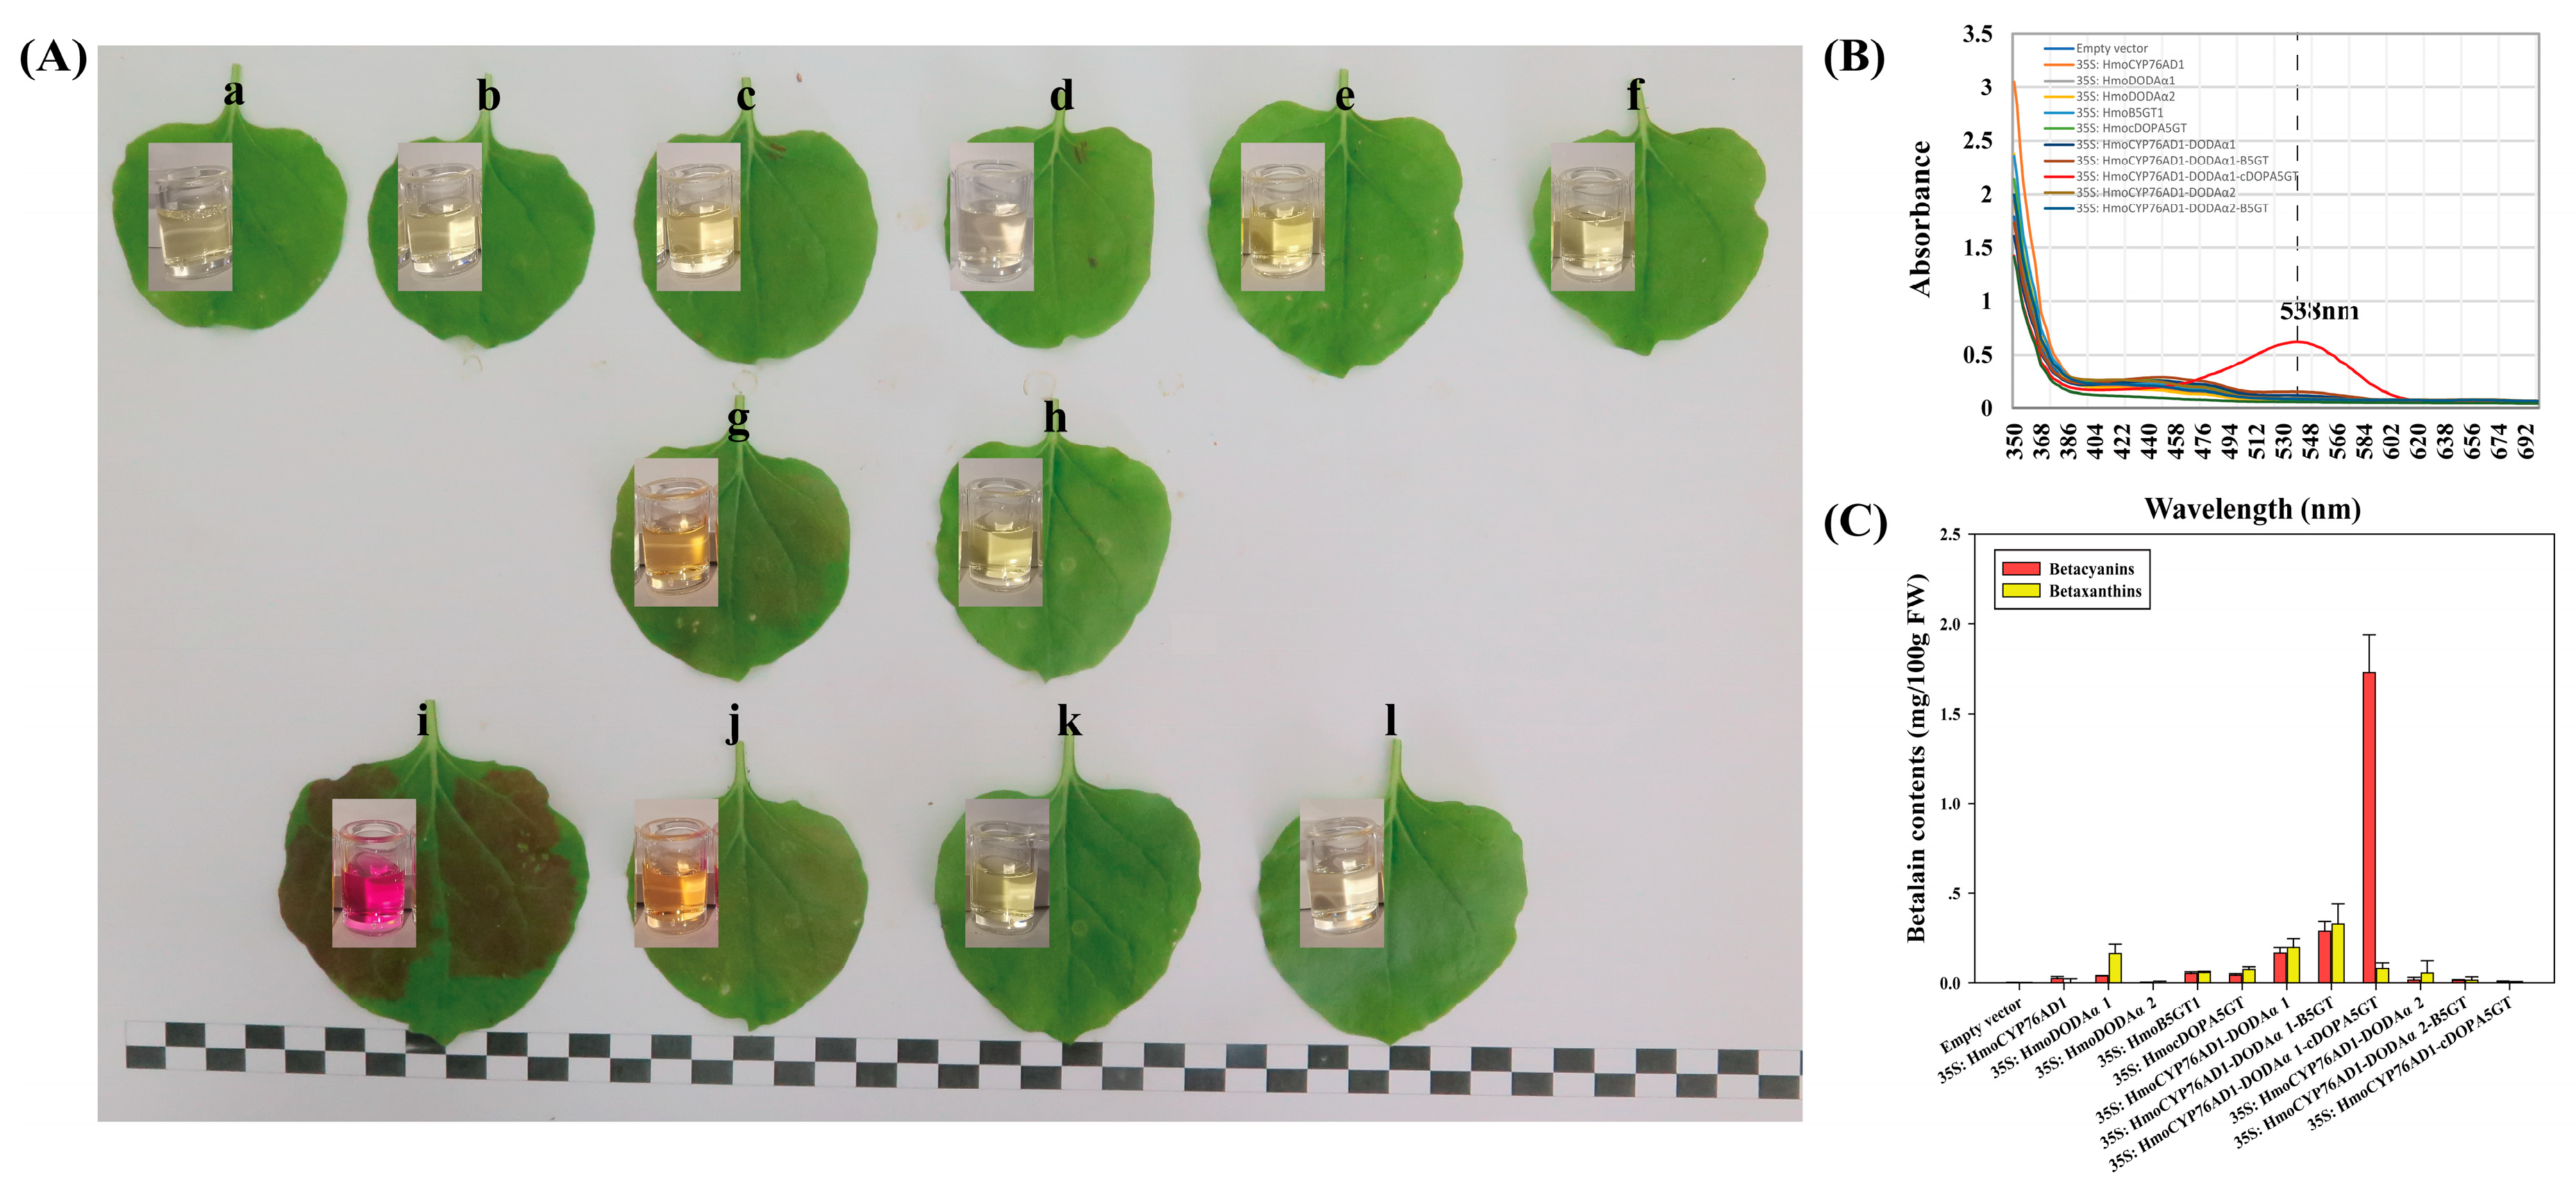
3.8. Co-Expression of HmoCYP76AD1, HmoDODAα1/α2 and HmoB5GT1/HmocDOPA5GT in N. benthamiana

HmoCYP76AD1, HmoDODAα1/α2, and HmoB5GT1/HmocDOPA5GT were transiently overexpressed in N. benthamiana leaves. No visible pigmentation was detected in the infiltrated area of N. benthamiana leaves when single HmoCYP76AD1, HmoDODAα1, HmoDODAα2, HmoB5GT1 or HmocDOPA5GT was overexpressed (Figure 8A(a–f)). Co-infiltration of A. tumefaciens containing HmoCYP76AD1 and HmoDODAα1 resulted in light red pigmentation (Figure 8A(g)). Light red pigment was also observed when HmoCYP76AD1, HmoDODAα1 and HmoB5GT were co-expressed in N. benthamiana (Figure 8A(j)). Dark red pigmentation was only observed in the infiltrated areas after co-expressing HmoCYP76AD1, HmoDODAα1 and HmocDOPA5GT (Figure 8A(i)). However, no pigmentation was detected in the infiltrated areas when HmoCYP76AD1-DODAα2-cDOPA5GT or HmoCYP76AD1-DODAα2-B5GT1 were co-expressed (Figure 8A(k,l)). Moreover, there was no pigment accumulation in N. benthamiana leaves when HmoDODAα1 or HmoDODAα2 was co-expressed with HmocDOPA5GT or HmoB5GT1 without HmoCYP76AD1 (Figure S3). The red pigments had a peak absorption at 538 nm wavelength (Figure 8B) which was the typical characteristic of betacyanins. Co-expression of HmoCYP76AD1-DODAα1-cDOPA5GT resulted in the highest abundance of betacyanins in the infiltrated areas compared to very low levels of betacyanin after co-expressions of the other combinations such as HmoCYP76AD1-DODAα1 and HmoCYP76AD1-DODAα2-B5GT1 (Figure 8C). In addition, the expression levels of these genes significantly increased in the infiltrated areas (Figure S4).

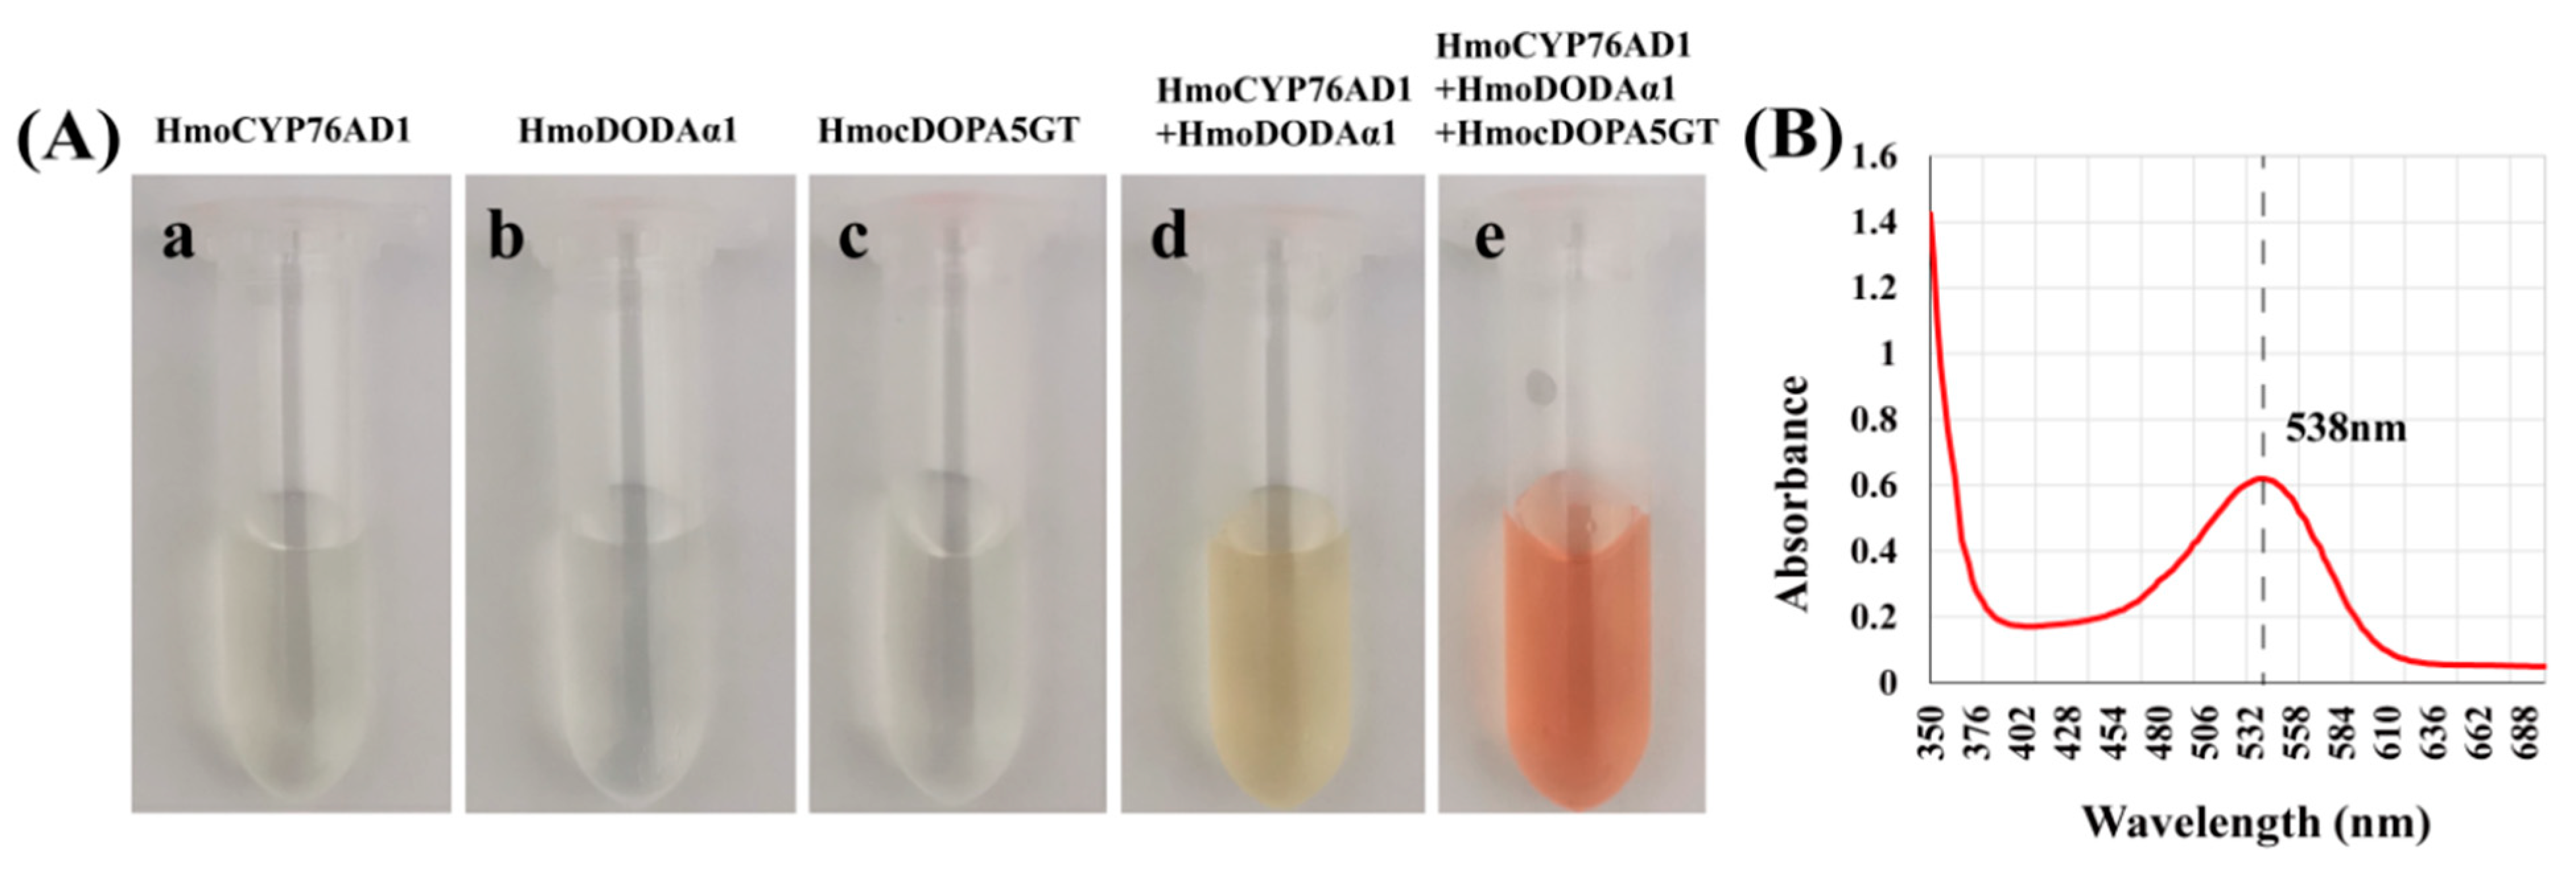
3.9. Recombinant Expression of HmoCYP76AD1, HmoDODAα1 and HmocDOPA5GT in Yeast

Recombinant expression assay was performed to further confirm the function of HmoCYP76AD1, HmoDODAα1 and HmocDOPA5GT genes. No pigment was detected when HmoCYP76AD1, HmoDODAα1 or HmocDOPA5GT was separately expressed in yeast (Figure 9A(a–c)). Yellow pigments were detected in the yeast cultures when HmoCYP76AD1 was co-expressed with HmoDODAα1 (Figure 9A(d)). Red pigments were observed in the yeast cultures containing pYES2-HmoDODAα1 and pESC-HmoCYP76AD1-HmocDOPA5GT vectors (Figure 9A(e)). The peak absorption of red pigments was detected at 538 nm wavelength (Figure 9B) suggesting that betacyanins are produced with co-expression of HmoCYP76AD1, HmoDODAα1 and HmocDOPA5GT in yeast.

4. Discussion

4.1. Identification of Genes Involved in Betalain Biosynthesis

To date, key genes involved in betalain biosynthesis remain to be fully elucidated. It has been reported that CYP76AD, DODA and GT were responsible for betalain biosynthesis [12,13]. However, genome-wide analyses of these genes in betalain biosynthesis are not available in betalain-producing plant species. In the present study, candidate pitaya betalain biosynthesis-related genes were identified and their distribution, structure, conservation, clustering and expression were analyzed. Based on phylogenetic analysis, 15 CYP76AD-encoding genes from pitaya were classified into three categories: CYP76AD-α, CYP76AD-β and CYP76AD1-γ (Figure 2A), which is consistent with the results from Brockington et al. (2015) and Chen et al. (2021) [14,43]. Three DODA genes including one homologue from DODAβ lineage and two paralogues from DODAα lineage have been isolated from betalain-pigmented lineages of Caryophyllales [14,22,43]. In the pitaya genome, three DODA genes assigned to DODAα and DODAβ were obtained from pitaya (Figure 2B) [43]. DODAα1 (HU03G01342.1) and DODAα2 (HU08G01571.1) were clustered in the DODAα clade while DODAβ (HU08G01572.1) belonged to the DODAβ clade. DODAα1 and CYP76AD1 are involved in betalain biosynthesis which have been identified in B. vulgaris [13], C. quinoa and A. hypochondriacus [22]. In this study, CYP76AD1 (HU03G00480.1) and DODAα1 (HU03G01342.1) were localized in Chr 3. These results suggested that H. undatus, B. vulgaris, C. quinoa and A. hypochondriacus may share one putative origin of betalain pigmentation. The diversity of betacyanins in species depends on different GTs [16,25,28,29,30]. Chen et al. (2021) found that GTs involved in betalain biosynthesis were divided into three classes: cDOPA5GT, B5GT and B6GT [43]. In this study, GTs were divided into five groups: B5GT, B6GT, cDOPA5GT, UGT79B6 and UGT7B30 (Figure 2C).
The expression levels of betalain biosynthesis-related genes were increasing with betalain accumulation [13,15,16,18,19,22,43]. Candidate genes such as CYP76AD, DODA and GTs involved in betalain biosynthesis were isolated from pitaya [35,36,39,40,43,54]. In this study, CYP76AD1 (HU03G00480.1), DODAα1 (HU03G01342.1), DODAα2 (HU08G01571.1) and cDOPA5GT (HU07G00240.1) were preferentially expressed in pigmented tissues (Figure 1B). This result was consistent with the results from Chen et al. (2021) [43]. Compared with B. vulgaris [18], no candidate gene that can catalyze the first hydroxylation step in redundancy with CYP76AD1 was obtained in pitaya (Figure 1B). Therefore, we supposed that CYP76AD1 (HU03G00480.1) from pitaya belonging to the CYP76ADα clade maybe a unique gene with both tyrosine hydroxylase and oxidase activities responsible for L-DOPA and cyclo-DOPA formation. The expression pattern of cDOPA5GT was in accordance with the accumulation of betalains (Figure 1B) suggesting that cDOPA5GT maybe a potential gene encoding GT in pitaya.

4.2. HmoCYP76AD1 Catalyzes Tyrosine to L-DOPA and to Cyclo-DOPA

The functions of CYP76ADα and CYP76ADβ clade homologues have been previously reported in betalain-producing plant species [13,15,16,17,18,19]. In B. vulgaris, silencing CYP76AD1 alone blocked the production of betacyanins but not betaxanthins, suggesting that CYP76AD1 and CYP76AD6 catalyze the formation of L-DOPA from tyrosine. However, only CYP76AD1 can catalyze the conversion of L-DOPA to cyclo-DOPA [18]. In this study, HmoCYP76AD1 belonging to the CYP76ADα clade was identified in pitaya. Silencing HmoCYP76AD1 resulted in the reduced accumulation of betacyanins and betaxanthins (Figure 5), suggesting that HmoCYP76AD1 was the enzyme that contributes to L-DOPA formation and the subsequent conversion to cyclo-DOPA in pitaya. Betaxanthins were detected in yeast cultures after co-expression of HmoCYP76AD1 and HmoDODAα1 genes without feeding L-DOPA (Figure 9), suggesting that HmoCYP76AD1 has tyrosine hydroxylase activity for converting tyrosine to L-DOPA. Similar findings were also reported in other studies [17,18,19]. Red pigmentation was detected after expression of HmoCYP76AD1, HmoDODAα1 and HmocDOPA5GT in N. benthamiana and yeast culture (Figure 8 and Figure 9), indicating that HmoCYP76AD1 catalyzes two succeeding steps in the pitaya betalain biosynthesis pathway to produce cyclo-DOPA. Similar results were also found in other betalain-producing plant species such as B. vulgaris, C. quinoa, A. tricolor and M. jalapa [13,16,17,18,22,23].

4.3. HmoDODAα1 Exhibits a High Degree of L-DOPA 4,5-Dioxygenase Activity

L-DOPA 4,5-dioxgenase responsible for synthesis of betalamic acid is considered to be an important betalain-producing enzyme. Betalain-pigmented species have multiple paralogues of DODAα genes, but only one of them in each species encodes the protein with a high degree of L-DOPA 4,5-dioxygenase activity [22,24]. Loss of betalains was observed when the gene encoding DODA was silenced in B. vulgaris [13]. In this study, two candidate genes (HmoDODAα1 and HmoDODAα2) were obtained from H. monacanthus. Silencing HmoDODAα1 and HmoDODAα2 in H. monacanthus resulted in betalain reduction (Figure 5A,C), suggesting that HmoDODAα1 and HmoDODAα2 encode proteins with L-DOPA 4,5-dioxygenase activity. Overexpression of HmoDODAα1 and HmoDODAα2 in A. thaliana, N. benthamiana and yeast revealed that only HmoDODAα1 could synthesize betalamic acid (Figure 6, Figure 7, Figure 8 and Figure 9). Similar findings were also reported in B. vulgaris, C. quinoa and A. hypochondriacus [16,22]. Silencing DODAα2 caused slight decolouration, but DODAα2 is not active in betalain accumulation when DODAα2 was overexpressed in N. benthamiana and yeast. The reason is that the DODAα2 may not have sufficient levels to influence pigment accumulation [22]. Further experiments such as co-silencing DODAα1 and DODAα2 are necessary to elucidate its role in betalain biosynthesis. These results suggested that HmoDODAα1 encodes a protein with a high degree of L-DOPA 4,5-dioxygenase activity involved in pitaya betalain biosynthesis.

4.4. Reconstruction of Heterogenous Production of Betalain Biosynthesis Pathway

Betacyanins are formed through glycosylation by GT [11,12]. In D. bellidiformis, glycosylation on betanidin is directly catalyzed by B5GT and B6GT [12,28,29]. In M. jalapa, A. hypochondriacus and C. quinoa, glycosylation by cDOPA 5-O-GT (cDOPA-5GT) is involved in the betalain biosynthesis [16,25,30]. In our previous study, we found that HmoB5GT1 was involved in the betalain biosynthesis in pitaya [39]. In the present study, low production of betacyanins was observed when HmoCYP76AD1, HmoDODAα1 and HmoB5GT1 were co-expressed in N. benthamiana (Figure 8). In contrast, the co-expression of HmoCYP76AD1, HmoDODAα1 and HmocDOPA5GT resulted in high levels of betalain pigments (Figure 8 and Figure 9). These results suggested that HmocDOPA5GT plays an important role in glycosylation during betalain biosynthesis in H. monacanthus.

5. Conclusions

In summary, this study was the first attempt to identify and validate the key genes involved in pitaya betalain biosynthesis based on the whole genome sequence of H. undatus. Fifteen CYP76AD-encoding genes, three DODA-encoding genes and 35 GTs-encoding genes were obtained from the H. undatus genome. Four candidate genes i.e., HmoCYP76AD1, HmoDODAα1, HmoDODAα2 and HmocDOPA5GT showed upward expression trends, which was consistent with betalain accumulation during pitaya fruit maturation. Furthermore, HmoDODAα1 displayed a high degree of L-DOPA 4,5-dioxygenase activity to produce betalamic acid. Co-expression of HmoCYP76AD1, HmoDODAα1 and HmocDOPA5GT in N. benthamiana and yeast resulted in high abundances of betalain pigments. These results suggested that HmoCYP76AD1, HmoDODAα1, and HmocDOPA5GT play key roles in pitaya betalain biosynthesis. The results of the present study not only shed light on the evolution of betalain biosynthesis pathway in Caryophyllales, but also provide novel genes to genetically improve the fruit quality of pitaya.

Supplementary Materials

The following are available online at https://www.mdpi.com/article/10.3390/genes12121858/s1, Figure S1: Gene structures of 53 genes. Figure S2: Expression analyses of candidate genes in different fruit developmental stages of pitayas by RT-qPCR. Figure S3: Penotype of N. benthamiana leaves after infected. Figure S4: Gene expression of N. benthamiana leaves after infected. Table S1: Th e accession numbers of genes in this study. Table S2: All primers used in this study. Table S3: 53 candidate genes in pitaya. Table S4: Amino acid sequence similarities between H. monacanthus and H. undatus. Text S1: cDNA and amino acid sequences of genes for qPCR in pitaya. Text S2: cDNA sequences of genes for VIGS in red pitaya. Text S3: Vectors used in this study.

Author Contributions

Conceived and designed the experiments: Q.H. and Y.Q. Performed the experiments: Q.H. Analyzed the data: Q.H., C.C. and F.X. Contributed reagents/materials/analysis tools: Z.Z., R.Z., J.Z. and G.H. Wrote and revised the paper: Q.H. and Y.Q. All authors have read and agreed to the published version of the manuscript.

Funding

This work was supported by the National Natural Science Foundation of China (grant Nos. 31972367 and 31960578), Key Science and Technology Planning Project of Guangzhou (grant No. 201904020015), Science and Technology Program of Zhanjiang (grant no. 2019A01003), Science and Technology Program of Guangzhou (grant Nos. 202002020060 and 201704020003), and Key Realm R&D Program of Guangdong Province (grant No. 2018B020202011).

Institutional Review Board Statement

Not applicable.

Informed Consent Statement

Not applicable.

Data Availability Statement

Data is contained within the article and supplementary materials.

Conflicts of Interest

The authors declare no conflict of interest.

References

  1. Tenore, G.C.; Novellino, E.; Basile, A. Nutraceutical potential and antioxidant benefits of red pitaya (Hylocereus polyrhizus) extracts. J. Funct. Foods 2012, 4, 129–136. [Google Scholar] [CrossRef]
  2. Khan, M.I. Plant betalains: Safety, antioxidant activity, clinical efficacy, and bioavailability. Compr. Rev. Food Sci. Food Saf. 2016, 15, 316–330. [Google Scholar] [CrossRef] [Green Version]
  3. Ibrahim, S.R.M.; Mohamed, G.A.; Khedr, A.I.M.; Zayed, M.F.; El-Kholy, A.A.S. Genus Hylocereus: Beneficial phytochemicals, nutritional importance, and biological relevancea review. J. Food Biochem. 2018, 42, e12491. [Google Scholar] [CrossRef]
  4. Belhadj Slimen, I.; Najar, T.; Abderrabba, M. Chemical and antioxidant properties of betalains. J. Agric. Food Chem. 2017, 65, 675–689. [Google Scholar] [CrossRef] [PubMed]
  5. Ibdah, M.; Krins, A.; Seidlitz, H.K.; Heller, W.; Strack, D.; Vogt, T. Spectral dependence of flavonol and betacyanin accumulation in Mesembryanthemum crystallinum under enhanced ultraviolet radiation. Plant Cell Environ. 2002, 25, 1145–1154. [Google Scholar] [CrossRef]
  6. Savitha, B.C.; Thimmaraju, R.; Bhagyalakshmi, N.; Ravishankar, G.A. Different biotic and abiotic elicitors influence betalain production in hairy root cultures of Beta vulgaris in shake-flask and bioreactor. Process Biochem. 2006, 41, 50–60. [Google Scholar] [CrossRef]
  7. D’Andrea, R.M.; Andreo, C.S.; Lara, M.V. Deciphering the mechanisms involved in Portulaca oleracea (C4) response to drought: Metabolic changes including crassulacean acid-like metabolism induction and reversal upon re-watering. Physiol. Plant. 2014, 152, 414–430. [Google Scholar] [CrossRef]
  8. Jain, G.; Gould, K.S. Functional significance of betalain biosynthesis in leaves of Disphyma australe under salinity stress. Environ. Exp. Bot. 2015, 109, 131–140. [Google Scholar] [CrossRef]
  9. Jain, G.; Schwinn, K.E.; Gould, K.S. Betalain induction by L-DOPA application confers photoprotection to saline-exposed leaves of Disphyma australe. New Phytol. 2015, 207, 1075–1083. [Google Scholar] [CrossRef]
  10. Sarker, U.; Oba, S. Salinity stress enhances color parameters, bioactive leaf pigments, vitamins, polyphenols, flavonoids and antioxidant activity in selected Amaranthus leafy vegetables. J. Sci. Food Agric. 2019, 99, 2275–2284. [Google Scholar] [CrossRef]
  11. Strack, D.; Vogt, T.; Schliemann, W. Recent advances in betalain research. Phytochemistry 2003, 62, 247–269. [Google Scholar] [CrossRef]
  12. Gandia-Herrero, F.; Garcia-Carmona, F. Biosynthesis of betalains: Yellow and violet plant pigments. Trends Plant Sci. 2013, 18, 334–343. [Google Scholar] [CrossRef] [PubMed]
  13. Hatlestad, G.J.; Sunnadeniya, R.M.; Akhavan, N.A.; Gonzalez, A.; Goldman, I.L.; McGrath, J.M.; Lloyd, A.M. The beet R locus encodes a new cytochrome P450 required for red betalain production. Nat. Genet. 2012, 44, 130–816. [Google Scholar] [CrossRef] [PubMed]
  14. Brockington, S.F.; Yang, Y.; Gandia-Herrero, F.; Covshoff, S.; Hibberd, J.M.; Sage, R.F.; Wong, G.K.S.; Moore, M.J.; Smith, S.A. Lineage-specific gene radiations underlie the evolution of novel betalain pigmentation in Caryophyllales. New Phytol. 2015, 207, 1170–1180. [Google Scholar] [CrossRef]
  15. Suzuki, M.; Miyahara, T.; Tokumoto, H.; Hakamatsuka, T.; Goda, Y.; Ozeki, Y.; Sasaki, N. Transposon-mediated mutation of CYP76AD3 affects betalain synthesis and produces variegated flowers in four o’clock (Mirabilis jalapa). J. Plant Physiol. 2014, 171, 1586–1590. [Google Scholar] [CrossRef] [PubMed]
  16. Imamura, T.; Takagi, H.; Miyazato, A.; Ohki, S.; Mizukoshi, H.; Mori, M. Isolation and characterization of the betalain biosynthesis gene involved in hypocotyl pigmentation of the allotetraploid Chenopodium quinoa. Biochem. Bioph. Res. Commun. 2018, 496, 280–286. [Google Scholar] [CrossRef] [PubMed]
  17. Chang, Y.C.; Chiu, Y.C.; Tsao, N.W.; Chou, Y.L.; Tan, C.M.; Chiang, Y.H.; Liao, P.C.; Lee, Y.C.; Hsieh, L.C.; Wang, S.Y.; et al. Elucidation of the core betalain biosynthesis pathway in Amaranthus tricolor. Sci. Rep. 2021, 11, 6086. [Google Scholar] [CrossRef]
  18. Polturak, G.; Breitel, D.; Grossman, N.; Sarrion-Perdigones, A.; Weithorn, E.; Pliner, M.; Orzaez, D.; Granell, A.; Rogachev, I.; Aharoni, A. Elucidation of the first committed step in betalain biosynthesis enables the heterologous engineering of betalain pigments in plants. New Phytol. 2016, 210, 269–283. [Google Scholar] [CrossRef] [Green Version]
  19. Sunnadeniya, R.; Bean, A.; Brown, M.; Akhavan, N.; Hatlestad, G.; Gonzalez, A.; Symonds, V.V.; Lloyd, A. Tyrosine hydroxylation in betalain pigment biosynthesis is performed by cytochrome P450 enzymes in beets (Beta vulgaris). PLoS ONE 2016, 11, e0149417. [Google Scholar] [CrossRef] [Green Version]
  20. Bean, A.; Sunnadeniya, R.; Akhavan, N.; Campbell, A.; Brown, M.; Lloyd, A. Gain-of-function mutations in beet DODA2 identify key residues for betalain pigment evolution. New Phytol. 2018, 219, 287–296. [Google Scholar] [CrossRef] [Green Version]
  21. Christinet, L.; Burdet, F.; Zaiko, M.; Hinz, U.; Zryd, J.P. Characterization and functional identification of a novel plant 4,5-extradiol dioxygenase involved in betalain pigment biosynthesis in Portulaca grandiflora. Plant Physiol. 2004, 134, 265–274. [Google Scholar] [CrossRef] [Green Version]
  22. Sheehan, H.; Feng, T.; Walker-Hale, N.; Lopez-Nieves, S.; Pucker, B.; Guo, R.; Yim, W.C.; Badgami, R.; Timoneda, A.; Zhao, L.; et al. Evolution of l-DOPA 4,5-dioxygenase activity allows for recurrent specialisation to betalain pigmentation in Caryophyllales. New Phytol. 2020, 227, 914–929. [Google Scholar] [CrossRef] [Green Version]
  23. Sasaki, N.; Abe, Y.; Goda, Y.; Adachi, T.; Kasahara, K.; Ozeki, Y. Detection of dopa 4,5-dioxygenase (DOD) activity using recombinant protein prepared from Escherichia coli cells harboring cDNA encoding DOD from Mirabilis jalapa. Plant Cell Physiol. 2009, 50, 1012–1016. [Google Scholar] [CrossRef] [PubMed] [Green Version]
  24. Chung, H.; Schwinn, K.E.; Ngo, H.M.; Lewis, D.H.; Massey, B.; Calcottt, K.E.; Crowhurst, R.; Joyce, D.C.; Gould, K.S.; Davies, K.M.; et al. Characterisation of betalain biosynthesis in Parakeelya flowers identifies the key biosynthetic gene DOD as belonging to an expanded LigB gene family that is conserved in betalain-producing species. Front. Plant Sci. 2015, 6, 499. [Google Scholar] [CrossRef] [PubMed] [Green Version]
  25. Casique-Arroyo, G.; Martinez-Gallardo, N.; Gonzalez De La Vara, L.; Delano-Frier, J.P. Betacyanin biosynthetic genes and enzymes are differentially induced by (a)biotic stress in Amaranthus hypochondriacus. PLoS ONE 2014, 9, e99012. [Google Scholar] [CrossRef]
  26. Heuer, S.; Strack, D. Synthesis of betanin from betanidin and UDP-glucose by a protein preparation from cell suspension cultures of Dorotheanthus bellidiformis (Burm. f.) N. E. Br. Planta 1992, 186, 626–628. [Google Scholar] [CrossRef] [PubMed]
  27. Heuer, S.; Vogt, T.; Boehm, H.; Strack, D. Partial purification and characterization of UDP-glucose: Betanidin 5-O- and 6-O-glucosyltransferases from cell suspension cultures of Dorotheanthus bellidiformis (Burm. f.) N.E.Br. Planta 1996, 199, 244–250. [Google Scholar] [CrossRef]
  28. Vogt, T.; Grimm, R.; Strack, D. Cloning and expression of a cDNA encoding betanidin 5-O-glucosyltransferase, a betanidin- and flavonoid-specific enzyme with high homology to inducible glucosyltransferases from the Solanaceae. Plant J. 1999, 19, 509–519. [Google Scholar] [CrossRef] [Green Version]
  29. Vogt, T. Substrate specificity and sequence analysis define a polyphyletic origin of betanidin 5- and 6-O-glucosyltransferase from Dorotheanthus bellidiformis. Planta 2002, 214, 492–495. [Google Scholar] [CrossRef]
  30. Sasaki, N.; Adachi, T.; Koda, T.; Ozeki, Y. Detection of UDP-glucose: Cyclo-DOPA 5-O-glucosyltransferase activity in four o’clocks (Mirabilis jalapa L.). FEBS Lett. 2004, 568, 159–162. [Google Scholar] [CrossRef] [Green Version]
  31. Owen, N.A.; Fahy, K.F.; Griffiths, H. Crassulacean acid metabolism (CAM) offers sustainable bioenergy production and resilience to climate change. GCB Bioenergy 2016, 8, 737–749. [Google Scholar] [CrossRef] [Green Version]
  32. Lina, A.; Eloisa, L. How do young cacti (seeds and seedlings) from tropical xeric environments cope with extended drought periods? J. Arid Environ. 2018, 154, 1–7. [Google Scholar] [CrossRef]
  33. Tel-Zur, N.; Abbo, S.; Bar-Zvi, D.; Mizrahi, Y. Genetic relationships among Hylocereus and Selenicereus vine cacti (Cactaceae): Evidence from hybridization and cytological studies. Ann. Bot. 2004, 94, 527–534. [Google Scholar] [CrossRef] [Green Version]
  34. Ortiz-Hernández, Y.D.; Carrillo-Salazar, J.A. Pitahaya (Hylocereus spp.): A short review. Comun. Sci. 2012, 3, 220–237. [Google Scholar]
  35. Hua, Q.Z.; Chen, C.J.; Chen, Z.; Chen, P.K.; Ma, Y.W.; Wu, J.Y.; Zheng, J.; Hu, G.B.; Zhao, J.T.; Qin, Y.H. Transcriptomic analysis reveals key genes related to betalain biosynthesis in pulp coloration of Hylocereus polyrhizus. Front. Plant Sci. 2016, 6, 1179. [Google Scholar] [CrossRef] [Green Version]
  36. Hua, Q.Z.; Zhou, Q.J.; Gan, S.S.; Wu, J.Y.; Chen, C.B.; Li, J.Q.; Ye, Y.X.; Zhao, J.T.; Hu, G.B.; Qin, Y.H. Proteomic analysis of Hylocereus polyrhizus reveals metabolic pathway changes. Int. J. Mol. Sci. 2016, 17, 1606. [Google Scholar] [CrossRef]
  37. Wu, Y.W.; Xu, J.; Han, X.M.; Qiao, G.; Yang, K.; Wen, Z.; Wen, X.P. Comparative transcriptome analysis combining SMRT- and illumina-based RNA-seq identifies potential candidate genes involved in betalain biosynthesis in pitaya fruit. Int. J. Mol. Sci. 2020, 21, 3288. [Google Scholar] [CrossRef] [PubMed]
  38. Zhou, Z.X.; Gao, H.M.; Ming, J.H.; Ding, Z.L.; Lin, X.E.; Zhan, R.L. Combined transcriptome and metabolome analysis of pitaya fruit unveiled the mechanisms underlying peel and pulp color formation. BMC Genom. 2020, 21, 734. [Google Scholar] [CrossRef]
  39. Xie, F.F.; Hua, Q.Z.; Chen, C.B.; Zhang, L.L.; Zhang, Z.K.; Chen, J.Y.; Zhang, R.; Zhao, J.S.; Hu, G.B.; Zhao, J.T.; et al. Transcriptomics-based identification and characterization of glucosyltransferases involved in betalain biosynthesis in Hylocereus megalanthus. Plant Physiol. Biochem. 2020, 152, 112–124. [Google Scholar] [CrossRef]
  40. Cheng, M.N.; Huang, Z.J.; Hua, Q.Z.; Shan, W.; Kuang, J.F.; Lu, W.J.; Qin, Y.H.; Chen, J.Y. The WRKY transcription factor HPWRKY44 regulates CytP450-like1 expression in red pitaya fruit (Hylocereus polyrhizus). Hortic. Res. 2017, 4, 17039. [Google Scholar] [CrossRef] [Green Version]
  41. Zhang, L.L.; Chen, C.B.; Xie, F.F.; Hua, Q.Z.; Zhang, Z.K.; Zhang, R.; Chen, J.Y.; Zhao, J.T.; Hu, G.B.; Qin, Y.H. A novel WRKY transcription factor HmoWRKY40 associated with betalain biosynthesis in pitaya (Hylocereus monacanthus) through regulating HmoCYP76AD1. Int. J. Mol. Sci. 2021, 22, 2171. [Google Scholar] [CrossRef] [PubMed]
  42. Zheng, J.F.; Meinhardt, L.W.; Goenaga, R.; Zhang, D.P.; Yin, Y.B. The chromosome-level genome of dragon fruit reveals whole-genome duplication and chromosomal co-localization of betacyanin biosynthetic genes. Hortic. Res. 2021, 8, 63. [Google Scholar] [CrossRef] [PubMed]
  43. Chen, J.Y.; Xie, F.F.; Cui, Y.Z.; Chen, C.B.; Lu, W.J.; Hu, X.L.; Hua, Q.Z.; Zhao, J.; Wu, Z.J.; Gao, D.; et al. A chromosome-scale genome sequence of pitaya (Hylocereus undatus) provides novel insights into the genome evolution and regulation of betalain biosynthesis. Hortic. Res. 2021, 8, 164. [Google Scholar] [CrossRef] [PubMed]
  44. Chen, C.J.; Chen, H.; Zhang, Y.; Thomas, H.R.; Frank, M.H.; He, Y.H.; Xia, R. TBtools: An integrative toolkit developed for interactive analyses of big biological data. Mol. Plant 2020, 13, 1194–1202. [Google Scholar] [CrossRef]
  45. Livak, K.J.; Schmittgen, T.D. Analysis of relative gene expression data using realtime quantitative PCR and the 2−ΔΔCT method. Methods 2001, 25, 402–408. [Google Scholar] [CrossRef]
  46. Chen, C.B.; Wu, J.Y.; Hua, Q.Z.; Tel-Zur, N.; Xie, F.F.; Zhang, Z.K.; Chen, J.Y.; Zhang, R.; Hu, G.B.; Zhao, J.T.; et al. Identification of reliable reference genes for quantitative real-time PCR normalization in pitaya. Plant Methods 2019, 15, 70. [Google Scholar] [CrossRef] [Green Version]
  47. Hong, S.M.; Bahn, S.C.; Lyu, A.; Jung, H.S.; Ahn, J.H. Identification and testing of superior reference genes for a starting pool of transcript normalization in Arabidopsis. Plant Cell Physiol. 2010, 51, 1694–1706. [Google Scholar] [CrossRef] [Green Version]
  48. Jailani, A.A.K.; Solanki, V.; Roy, A.; Sivasudha, T.; Mandal, B. A CGMMV genome-replicon vector with partial sequences of coat protein gene efficiently expresses GFP in Nicotiana benthamiana. Virus Res. 2017, 233, 77–85. [Google Scholar] [CrossRef]
  49. Nelson, B.K.; Cai, X.; Nebenführ, A. A multicolored set of in vivo organelle markers for co-localization studies in Arabidopsis and other plants. Plant J. 2007, 51, 1126–1136. [Google Scholar] [CrossRef]
  50. Zhang, X.R.; Henriques, R.; Lin, S.S.; Niu, Q.W.; Chua, N.H. Agrobacterium-mediated transformation of Arabidopsis thaliana using the floral dip method. Nat. Protoc. 2006, 1, 641–646. [Google Scholar] [CrossRef]
  51. Timoneda, A.; Sheehan, H.; Feng, T.; Lopez-Nieves, S.; Maeda, H.A.; Brockington, S. Redirecting primary metabolism to boost production of tyrosine-derived specialised metabolites in planta. Sci. Rep. 2018, 8, 17256. [Google Scholar] [CrossRef] [PubMed]
  52. Chen, N.; Yu, Z.H.; Xiao, X.G. Cytosolic and nuclear co-localization of betalain biosynthetic enzymes in tobacco suggests that betalains are synthesized in the cytoplasm and/or nucleus of betalainic plant cells. Front. Plant Sci. 2017, 8, 831. [Google Scholar] [CrossRef] [PubMed] [Green Version]
  53. Stintzing, F.C.; Schieber, A.; Carle, R. Identification of betalains from yellow beet (Beta vulgaris L.) and cactus pear [Opuntia ficus-indica (L.) Mill.] By high-performance liquid chromatography-electrospray ionization mass spectrometry. J. Agric. Food Chem. 2002, 50, 2302–2307. [Google Scholar] [CrossRef] [PubMed]
  54. Suh, D.H.; Lee, S.; Heo, D.Y.; Kim, Y.; Cho, S.K.; Lee, S.; Lee, C.H. Metabolite profiling of red and white pitayas (Hylocereus polyrhizus and Hylocereus undatus) for comparing betalain biosynthesis and antioxidant activity. J. Agric. Food Chem. 2014, 62, 8764–8771. [Google Scholar] [CrossRef] [PubMed]
Figure 1. Identification of H. undatus CYP76AD, DODA and GTs as candidate betalain biosynthesis-related genes. (A) Pitaya peels and pulps from four developmental stages used for gene expression. (a) pulps of ‘Guanhuahong’ pitaya. (b) pulps of ‘Guanhuabai’ pitaya. (c) peels of ‘Guanhuahong’ pitaya. (B) Expression patterns of betalain biosynthesis-related genes of HmoCYP76AD1, HmoDODAα1, HmoDODAα2 and HmocDOPA5GT. WF, pulps of ‘Guanhuabai’ pitaya; RF, pulps of ‘Guanhuahong’ pitaya; RP, peels of ‘Guanhuahong’ pitaya.
Genes 12 01858 g001
Figure 2. Neighbor-Joining phylogeny of CYP76AD (A), DODA (B) and GTs (C) with the other plant species. (A) The red lines indicate α evolution branch, green lines indicate β evolution branch and the other belong to γ branch; (B) Red background labeled tips show functionally characterized DODAs. Purple rhombus indicates candidate genes from H. undatus. Labeled tips shaded squares correspond to DODA activity (white, no activity; grey, marginal activity; black, high activity); (C) Branches are colored according to the putative characterized GTs (red, CDOPA5GT; orange, B5GT; green, B6GT; blue, UGT79B6; purple, UGT79B30). Purple label backgrounds indicate candidate genes from H. undatus.
Genes 12 01858 g002
Figure 3. Chromosomal localization of CYP76AD, DODA and GTs genes in the H. undatus genome. CYP76AD (Blue): HU01G02117.1, HU03G00480.1, HU03G00481.1, HU03G00482.1, HU04G00093.1, HU05G00563.1, HU07G00498.1, HU07G00499.1, HU07G00500.1, HU07G00504.1, HU07G00510.1, HU07G00784.1, HU09G01023.1, HU11G01017.1 and HU11G01870.1; DODA (Black): HU03G01342.1, HU08G01571.1 and HU08G01572.1; GTs (Red): HU01G00156.1, HU01G00157.1, HU01G00158.1, HU01G00159.1, HU01G00761.1, HU02G01765.1, HU03G00258.1, HU03G00266.1, HU03G00267.1, HU03G01671.1, HU03G02206.1, HU04G00198.1, HU04G01617.1, HU05G01235.1, HU05G01532.1, HU06G00241.1, HU06G00242.1, HU06G00243.1, HU06G00244.1, HU07G00076.1, HU07G00240.1, HU07G01550.1, HU07G01678.1, HU08G02083.1, HU09G01034.1, HU09G01039.1, HU09G01874.1, HU09G01875.1, HU10G00514.1, HU10G01599.1, HU11G01695.1, HU11G01696.1, HU11G01697.1, HU11G01698.1 and HU11G01699.1.
Genes 12 01858 g003
Figure 4. Subcellular localization of HmoDODAα1, HmoDODAα2, HmoCYP76AD1 and HmocDOPA5GT. Every GFP construct and nucleolus-localized RFP marker or dual nucleus and cytoplasm RFP marker were co-transformed to leaf of N. benthamiana. Nuc RFP, Nucleolus-localized RFP marker (pAN95-At1g22590); PM RFP, Plasma membrane RFP marker (pAN-At5g19750); GFP-Gene, GFP tagged at the C-terminus of the gene; Bar = 20 µm.
Genes 12 01858 g004
Figure 5. Virus-induced gene silencing (VIGS) phenotypes in pitaya. (A) Pitaya fruit (left) and ‘scale’ (right) at 14 d after inoculation. (a,c,f) TRV1/TRV2 empty vector–inoculated; (b) TRV1/TRV2-HmoCYP76AD1–inoculated; (d) TRV1/TRV2-HmoDODAα1–inoculated; (e) TRV1/TRV2-HmoDODAα2–inoculated; (g) TRV1/TRV2-HmoB5GT1–inoculated; (h) TRV1/TRV2-HmocDOPA5GT–inoculated. (B) Betalain contents of inoculation pitaya scales; (C) Gene expression of inoculation pitaya scale. **: p < 0.01, *: p < 0.05, Scale bars = 2 cm.
Genes 12 01858 g005
Figure 6. Genotypes of transgenic A. thaliana with HmoDODAα1 and HmoDODAα2. (A) 35S::HmoDODAα1 and 35S::HmoDODAα2 seedlings were grown on moistened filter disks either without (a,c,e) or with (b,d,f) 10 mM L-DOPA. (gi) The flowers of wild type and transformed with 35S::HmoDODAα1 and 35S::HmoDODAα2 feeding with L-DOPA. (B) Expression levels of HmoDODAs in transgenic A. thaliana seedlings. **: p < 0.01. (C) Maximum absorption of the pigment.
Genes 12 01858 g006
Figure 7. Expression of HmoDODAα1 and HmoDODAα2 in yeast. (A) Visual appearance of yeast strains after expression of HmoDODAα1 and HmoDODAα2. The yeast strains only harboring HmoDODAα1 or HmoDODAα2. (a) Yeast expressing HmoDODAα1 without L-DOPA. (b) Yeast expressing HpDODAα1 with L-DOPA. (c) Yeast expressing HmoDODAα2 without L-DOPA. (d) Yeast expressing HmoDODAα2 with L-DOPA. (B) Maximum absorption of the pigment.
Genes 12 01858 g007
Figure 8. Transient expression of candidate genes in N. benthamiana. (A) Phenotype and extract of N. benthamiana leaves after infected. (af) Empty vector, HmoCYP76AD1, HmoDODAα1, HmoDODAα2, HmoB5GT1, HmocDOPA5GT; (g,h) HmoCYP76AD1-HmoDODAα1, HmoCYP76AD1-HmoDODAα2; (il) HmoCYP76AD1-HmoDODAα1-HmocDOPA5GT, HmoCYP76AD1-HmoDODAα1-HmoB5GT1, HmoCYP76AD1-HmoDODAα2-HmoB5GT1, HmoCYP76AD1-HmoDODAα2-HmocDOPA5GT; (B) Maximum absorption of the pigment. (C) Betalain contents in N. benthamiana leaves. Scale bars = 1 cm.
Genes 12 01858 g008
Figure 9. Recombinant expression of HmoCYP76AD1, HmoDODAα1 and HmocDOPA5GT in yeast. (A) Visual appearance of yeast medium from yeast strains. (ac) The yeast strains only harboring HmoCYP76AD1, HmoDODAα1 or HmocDOPA5GT. (d) Co-expressing HmoCYP76AD1 and HmoDODAα1. (e) Co-expressing HmoCYP76AD1, HmoDODAα1 and HmocDOPA5GT. (B) Maximum absorption of the pigment.
Genes 12 01858 g009
Publisher’s Note: MDPI stays neutral with regard to jurisdictional claims in published maps and institutional affiliations.

