
Age Prediction of Human Based on DNA Methylation by Blood Tissues


Department of Information and Computer Science, University of Science and Technology Beijing, Beijing 100083, China
*
Author to whom correspondence should be addressed.
Genes 2021, 12(6), 870; https://doi.org/10.3390/genes12060870
Submission received: 28 April 2021
/
Revised: 27 May 2021
/
Accepted: 5 June 2021
/
Published: 6 June 2021
(This article belongs to the Section Molecular Genetics and Genomics)
Abstract
:In recent years, scientists have found a close correlation between DNA methylation and aging in epigenetics. With the in-depth research in the field of DNA methylation, researchers have established a quantitative statistical relationship to predict the individual ages. This work used human blood tissue samples to study the association between age and DNA methylation. We built two predictors based on healthy and disease data, respectively. For the health data, we retrieved a total of 1191 samples from four previous reports. By calculating the Pearson correlation coefficient between age and DNA methylation values, 111 age-related CpG sites were selected. Gradient boosting regression was utilized to build the predictive model and obtained the R2 value of 0.86 and MAD of 3.90 years on testing dataset, which were better than other four regression methods as well as Horvath’s results. For the disease data, 354 rheumatoid arthritis samples were retrieved from a previous study. Then, 45 CpG sites were selected to build the predictor and the corresponded MAD and R2 were 3.11 years and 0.89 on the testing dataset respectively, which showed the robustness of our predictor. Our results were better than the ones from other four regression methods. Finally, we also analyzed the twenty-four common CpG sites in both healthy and disease datasets which illustrated the functional relevance of the selected CpG sites.
1. Introduction
Aging is a natural and irreversible process that occurs throughout a person’s life, and it is influenced by many factors, such as genetic factors, living environment and diseases [1,2]. It is modified and regulated by a variety of molecular modifications occurred in tissues or organs, including chemical modifications and changes in DNA levels such as DNA methylation [3]. In recent years, it is reported that many aging-related performances are formed in the process of a person’s growth through clinical research [4,5]. DNA methylation is catalyzed by a family of DNA methyltransferases (Dnmts) that transfer a methyl group from S-adenyl methionine (SAM) to the fifth carbon of a cytosine residue to form 5mC [6,7]. DNA methylation is one of the earliest and most common modifications for mammalian genomic DNA. It may exist in all higher organisms and play an important regulatory role in gene expression, involving many complex biological processes [5,8]. In 1967, Berdvshev and his team began to explore the relationship between DNA methylation and aging by studying the hunchback carp in the spawning period [9,10]. Subsequently, Vanyushin, Wilson, Bocklandt and other scientists studied with animal and human tissue cells and confirmed that the degree of DNA methylation in different tissues had a certain correlation with age [11,12]. More recently, different models using the degree of DNA methylation have been built for age prediction in various tissues [5,13,14].
In forensic science, individual age has always been an important research indicator. At present, forensic doctors usually use the well-matched models to estimate and predict the age of the individual by measuring bone morphological indicators [15,16,17]. However, sometimes the perpetrators fled after the crime, only leaving sporadic blood, saliva or semen, and the bone markers cannot be found. Thus, it is not feasible to use the above methods to predict age sometimes. Meanwhile, in molecular biology, characteristics such as the degree of DNA damage, mitochondrial mutations and leukocyte telomere length can be used to predict age [18]. Except, in fact, these models are not very effective in predicting ages, and the results are not very satisfactory. Besides, it is not easy to implement on the technical level. Therefore, it is imperative to find another feasible method to predict age. In recent years, with the development of epigenetics, researchers have found that there is a correlation between DNA methylation and aging. With the gradual improvement in DNA methylation research and more in-depth research in this field, the quantitative statistical relationship between DNA methylation and different ages was well established according to the change of DNA methylation with age [19,20].
Based on previous studies, Horvath et al. used the degree of DNA methylation in various human tissues to predict the actual age of an individual [21]. Horvath et al. selected 7844 samples from different tissues and cell types, and performed an intensive analysis on relevant experiments and information data to study the correlation between the degree of DNA methylation and age. Finally, they selected 353 CpG sites common in several different tissues and identified that DNA methylation levels of these 353 CpG sites were predictive for estimating human age. Specifically, they used this set of sites to successfully construct an age predictor across different tissue types, with a mean absolute deviation (MAD) value of 3.6 years [13,21,22]. Following Horvath’s seminal study, a large number of scientists began to engage in and contribute to this field. For instance, in 2014, Dr. Yi and his team used blood samples to predict age with a multiple linear regression, and the MAD was about 4 years [23]. Zbiec-Piekarska et al. built an age predictor by using human blood CpG sites with a multiple linear regression model in 2015 [24,25,26,27]. Different from their strategies where linear regression models were used, we adopted a nonlinear regression model called gradient boosting regression to build the age predictor. Through comparing R2, MAD, MSE and RMSE (four performance indicators for regression) on training sets and testing sets, our non-linear age predictor performed better than linear regression models.
2. Materials and Methods
2.1. Data Collection and Processing
We downloaded four datasets from the National Center for Biotechnology Information (NCBI) Gene Expression Omnibus (GEO). All of these datasets were selected from Illumina Human Methylation 450 BeadChip. Here are some details about healthy and disease dataset (Table 1). The healthy datasets contain a total of 1191 healthy individuals and the disease dataset has a total of 354 rheumatoid arthritis patients.
β values of DNA methylation were used in all experiments. For each CpG site the β value ranged between 0 and 1 indicates the ratio of methylation. Where 1 represents complete methylation, and 0 represents complete demethylation. The data processing was following: (1) extract relevant information (including age and the β value) from the original datasets downloaded from GEO; (2) merge four datasets and impute in the missing value. For each CpG site if there were ≥30 samples missing, we removed it. Otherwise, we imputed the missing values with the average of that CpG site.
2.2. Selection of Age-Related CpG Sites for Healthy Blood and Rheumatoid Arthritis Disease Dataset
To illustrate the performance of different models, we randomly divided the benchmark dataset into training and testing in a ratio of 7:3. CpG sites were selected as following: (1) calculate Pearson correlations between human age and DNA methylation value of each CpG site in the training; (2) choose the CpG sites whose Pearson correlation was more than 0.6 or less than −0.6. According to Pearson correlation analysis, 111 highly age-related CpG sites [32,33] were selected (Supplementary S1). The disease data were dealt with the same scheme as healthy samples. 45 CpG sites were selected with Pearson correlation absolute values greater than 0.6 (Supplementary S2).
2.3. Operation Algorithm
Based on the idea of boosting algorithm, Friedman came up with the gradient boosting regression (GBR) algorithm [34]. Nowadays, GBR is widely applied in the field of biology. It is precisely because GBR can effectively process data with noise and support different loss function. In addition to this, GBR also provides better accuracy for predicting data, especially in terms of non-linear data. GBR is a non-parametric supervised machine learning algorithm, and it approximates the unknown functional mapping from input explanatory variables to corresponding output variables [35]. The key of GBR is to use the negative gradient of the loss function in the current model [36]. Besides, we chose the minimum absolute deviation as the loss function, .
where is the input vectors, is the output vector, and the regression function is;
where is the number of basic functions, is the ordinal number ( from 1 to ), is the expansion coefficient, represents the node branch variable and is the basis function with fewer parameters and simple. We utilized the sklearn package in python and the parameters are as following:
learning_rate = 0.03, n_estimators = 400, subsample = 0.6, min_samples_split = 2, max_depth = 4, alpha = 0.6, verbose = 0.
2.4. Statistical Measurement
In machine learning, performance indicators are the key to measure the quality of a predictor. Performance indicators reflect the task requirements. When comparing the capabilities of different predictors, different performance indicators often lead to different evaluation results. What kind of model is good, not only depends on algorithms and data but also task requirements. In this work, we used the common following performance indicators for regression [20,25]:
where represents the number of samples, is the actual age and is the predicted age. The MAD is the mean absolute deviation between the predicted age and the actual age, MSE is mean square error, RMSE is root mean square error and R2 is correlation coefficient.
3. Results
3.1. Results of Healthy Blood Tissues
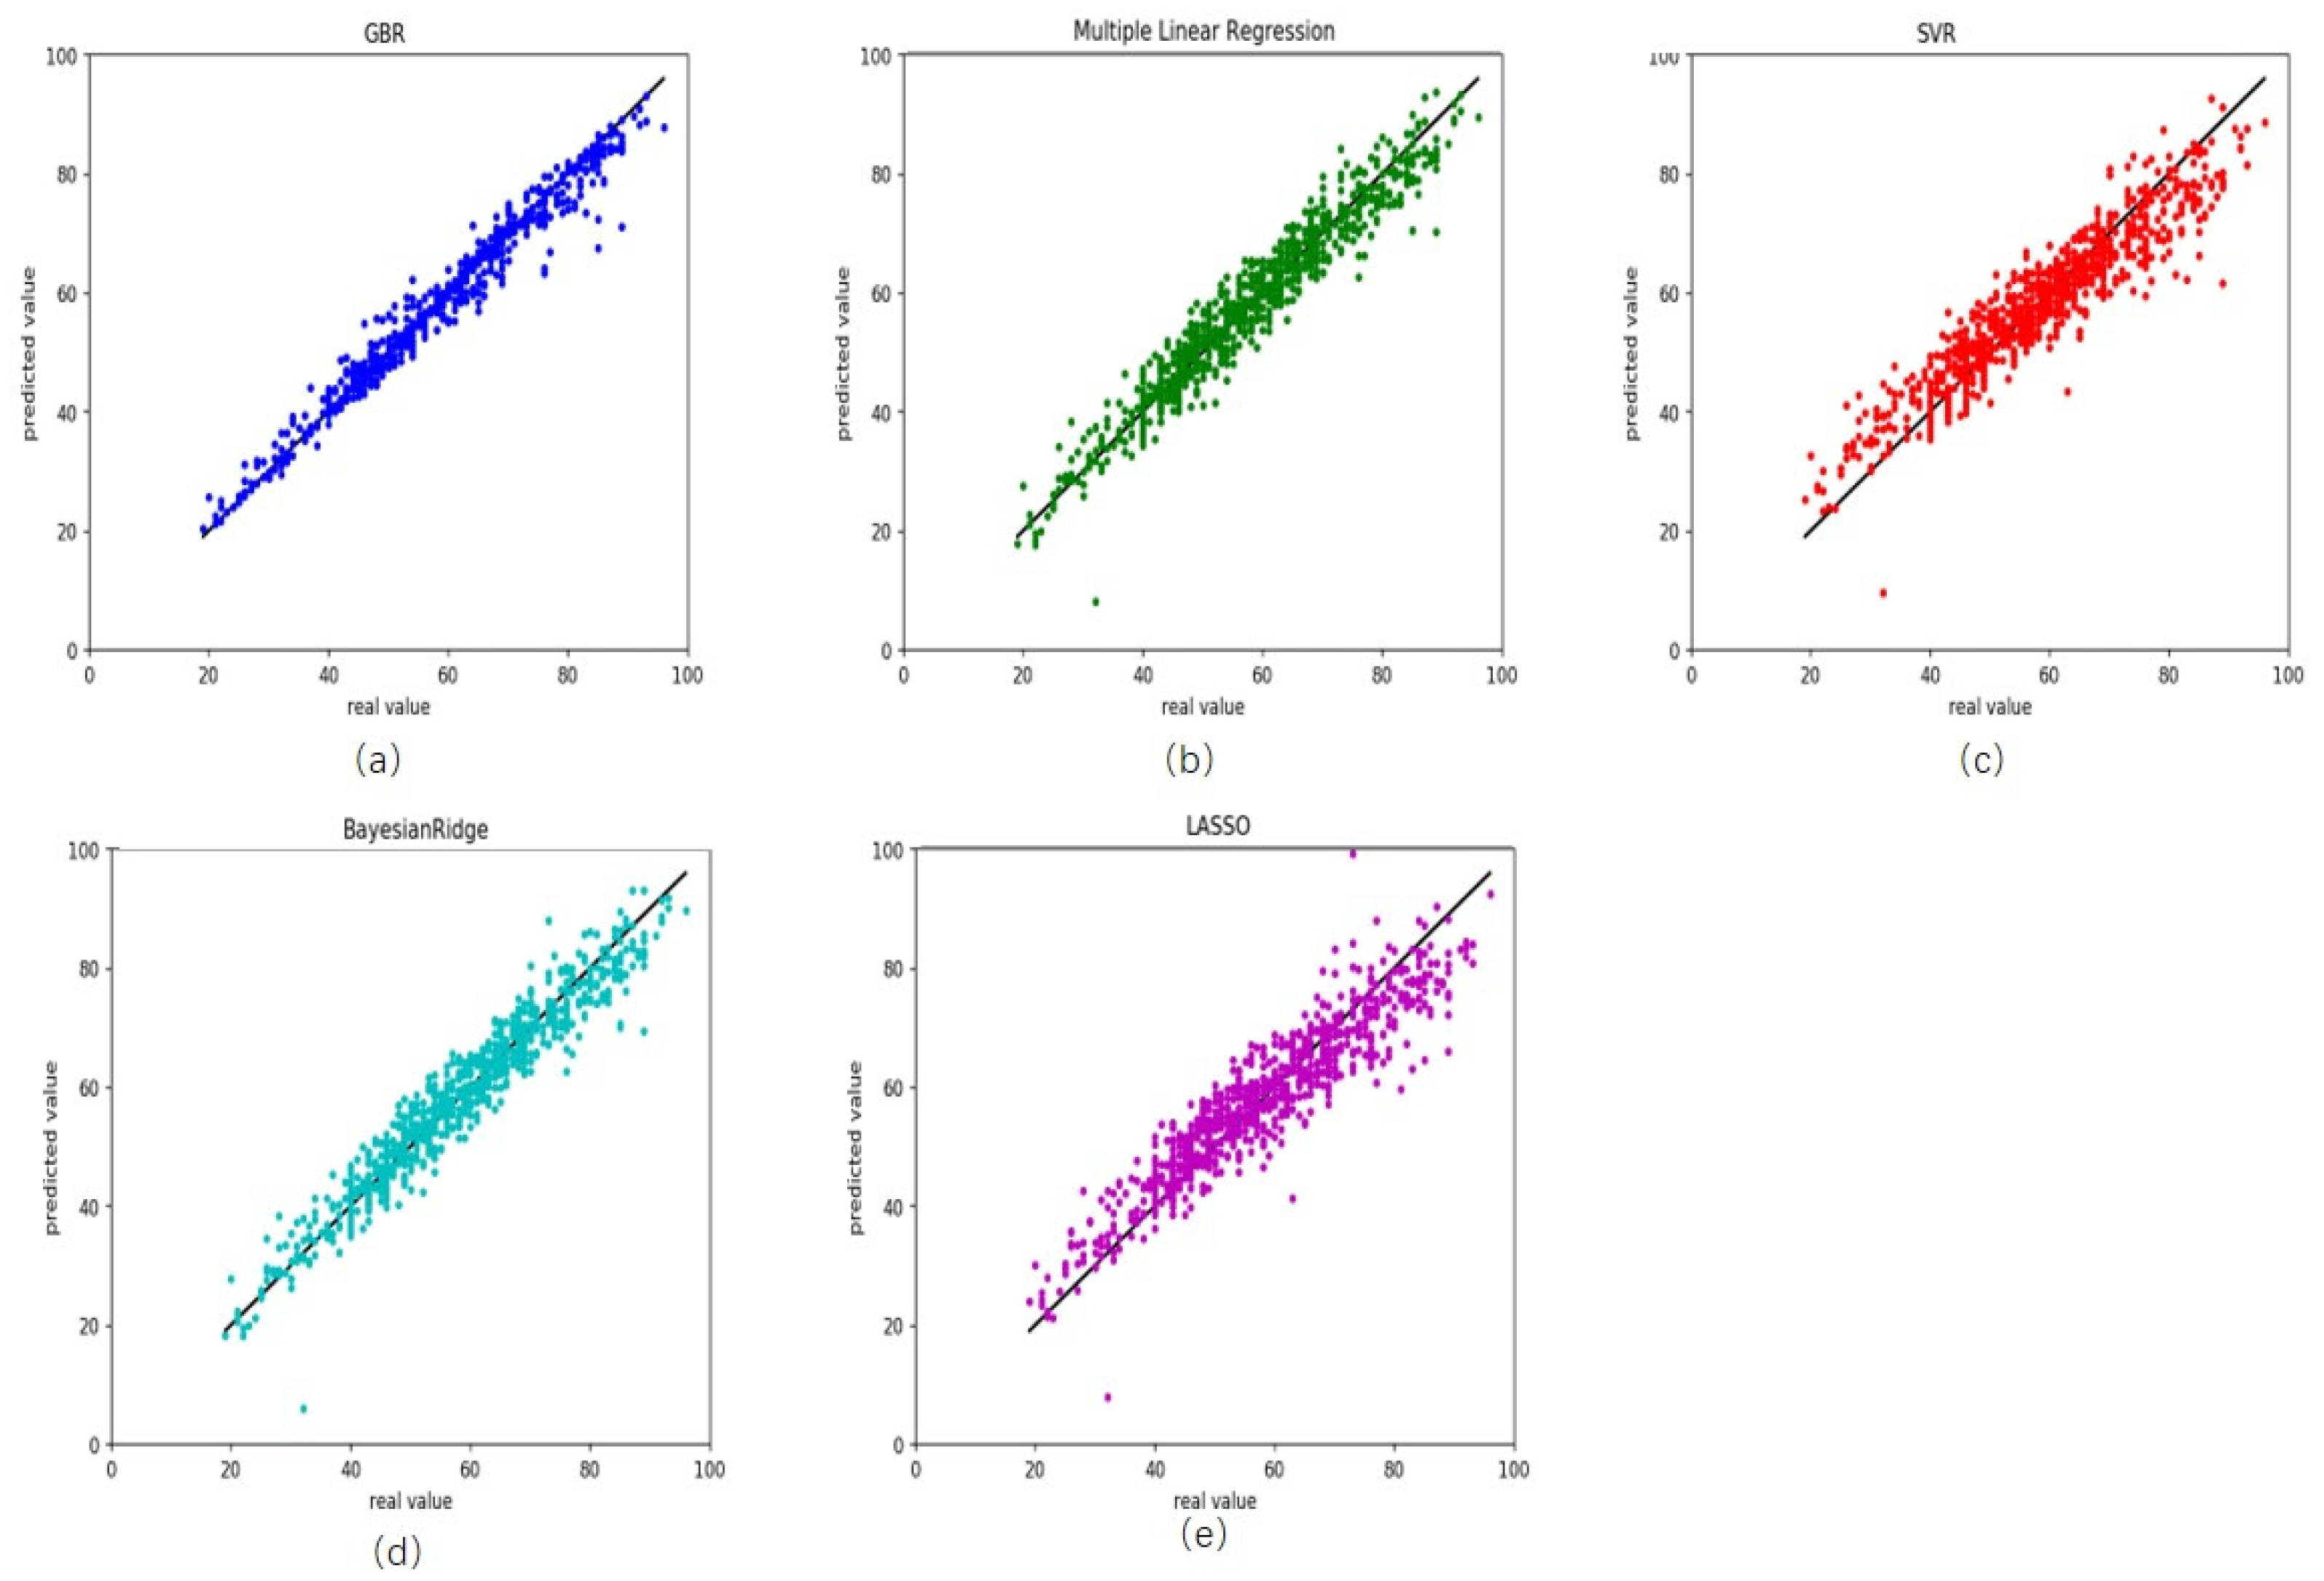
To illustrate the performance of gradient boosting regression, we compare it with other four common regression models multiple linear regression [37,38], support vector regression [39], Bayesian ridge regression [40] and lasso regression [41]. On the training, R2 was 0.97 for gradient boosting regression, with root mean square error (RMSE) and MAD being 2.46 and 1.40 years, respectively (Figure 1a and Table 2). The RMSE and MAD were 3.83 and 2.91 years for multiple linear regression (Figure 1b), 5.54 and 4.20 years for support vector regression (Figure 1c), 3.88 and 2.94 years for Bayesian ridge regression (Figure 1d), 5.57 and 4.19 years for lasso regression (Figure 1e).
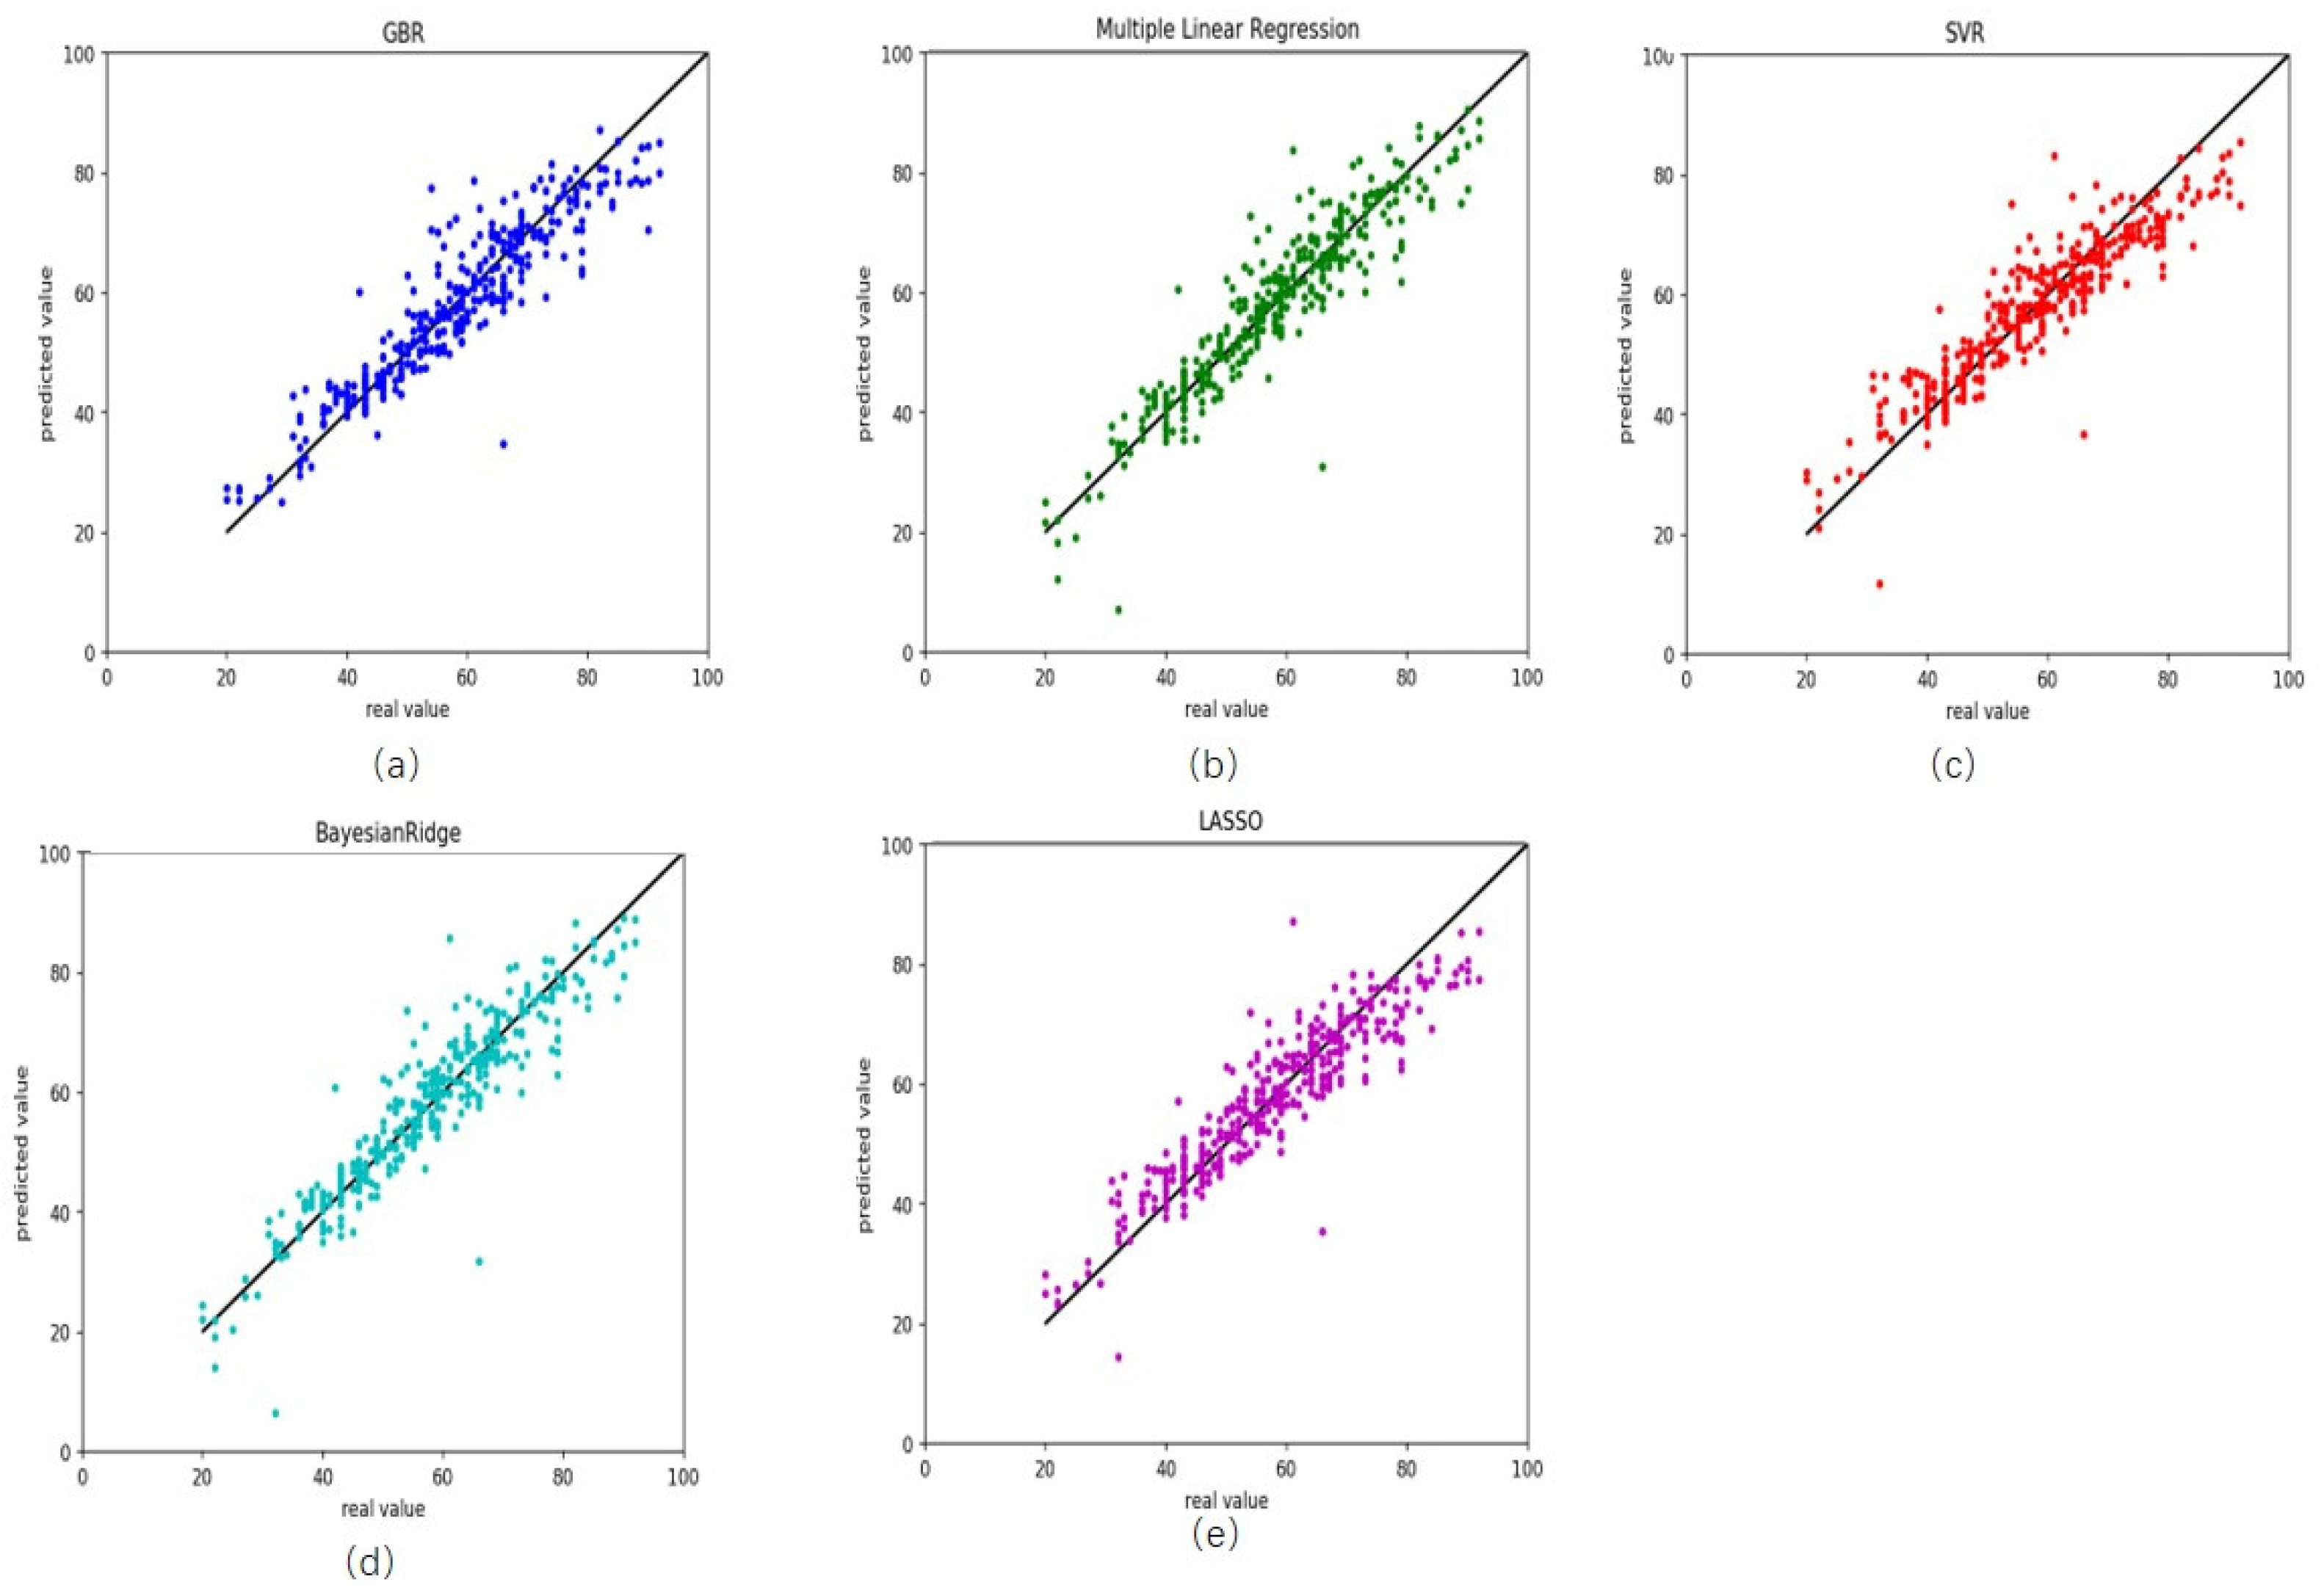
On the testing dataset, these results were similar to those in training (Table 2). R2 was 0.86 for gradient boosting regression, with RMSE and MAD being 5.54 and 3.90 years, respectively (Figure 2a). The RMSE and MAD were 5.49 and 2.92 years for multiple linear regression (Figure 2b), 5.94 and 4.44 years for support vector regression (Figure 2c), 5.33 and 3.67 years for Bayesian ridge regression (Figure 2d) and 5.82 and 4.34 years for lasso regression (Figure 2e). In this work, we also compared our results with that of Horvath [21] (hereinafter referred to as Horvath’s), the current state-of-the-art. Horvath’s MAD was 4.9441 and RMSE 6.4119. Our results were better than those ones which showed the performance and robustness of our predictor on healthy blood tissues.
3.2. Results of Rheumatoid Arthritis Disease
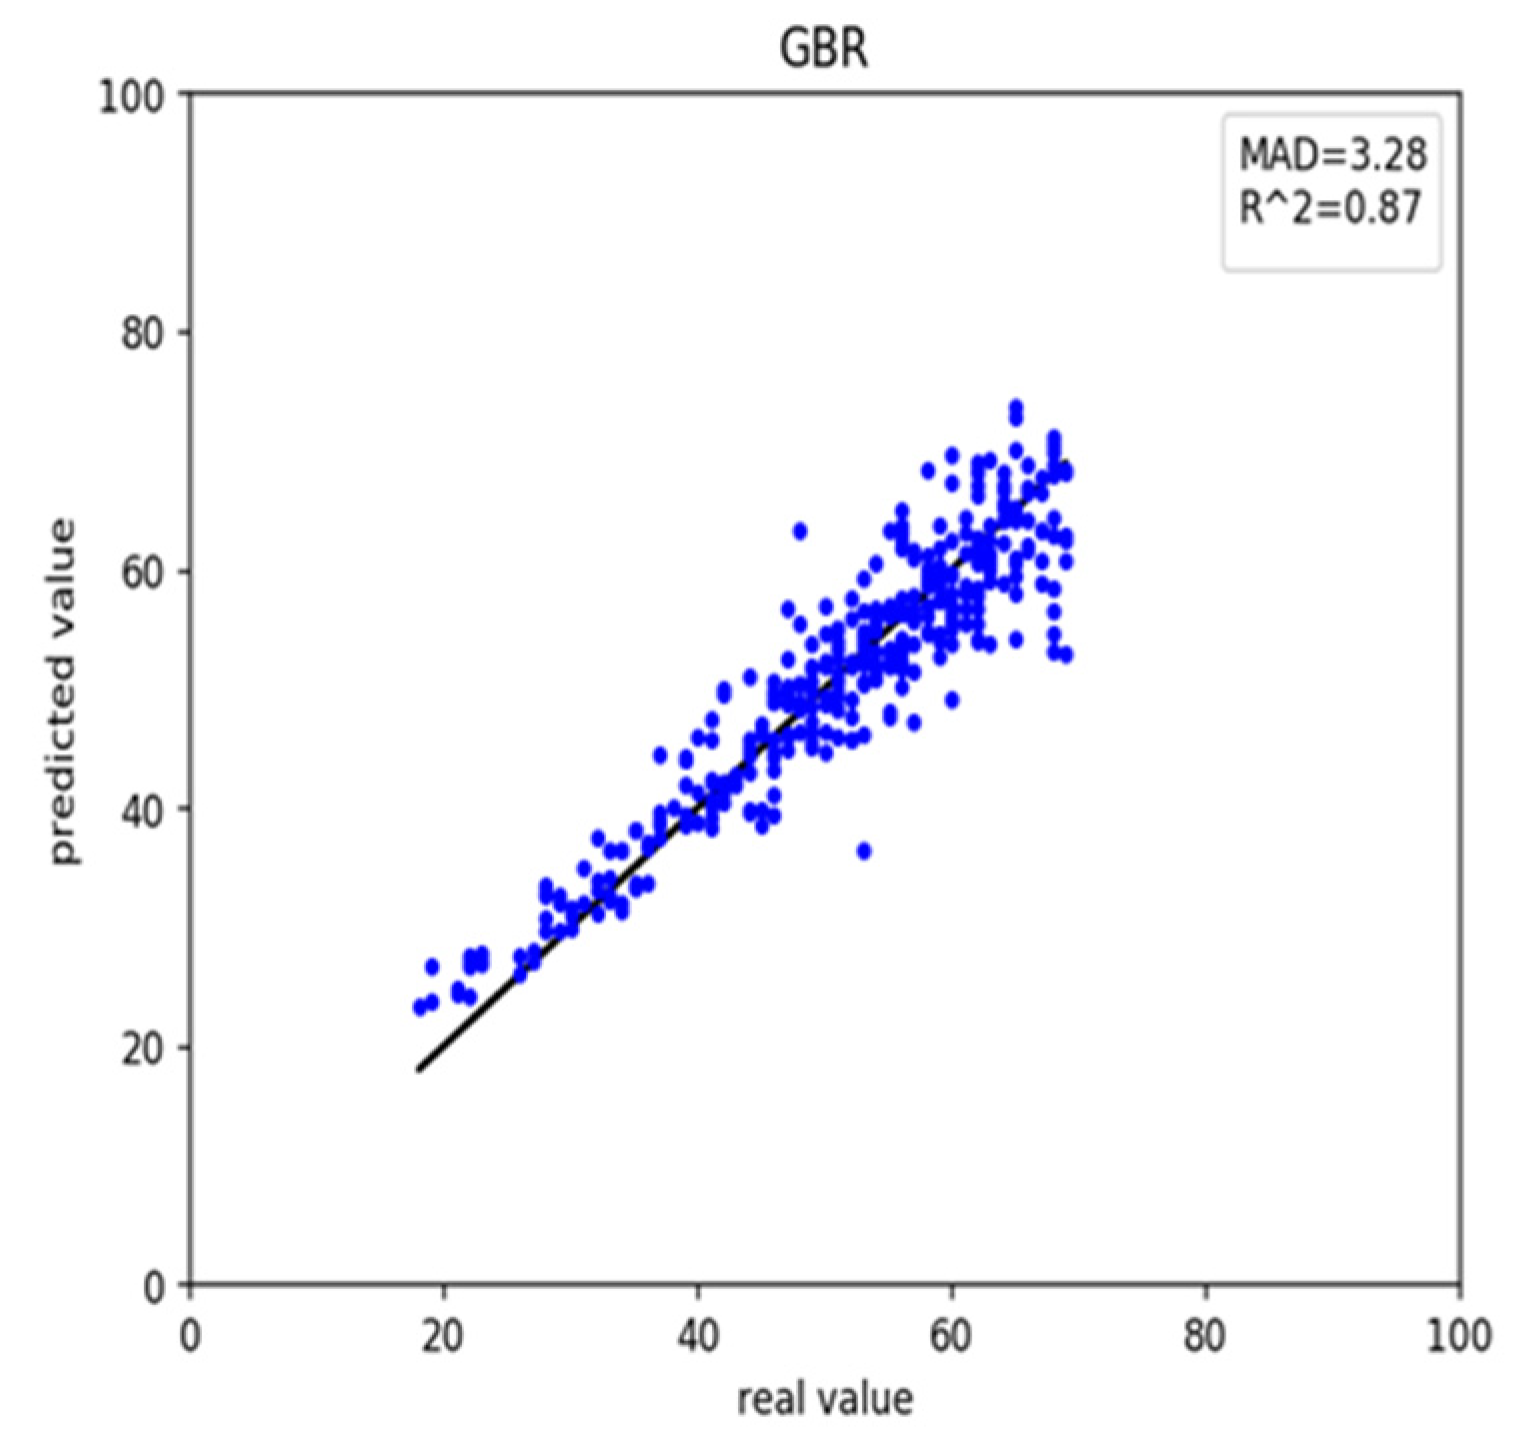
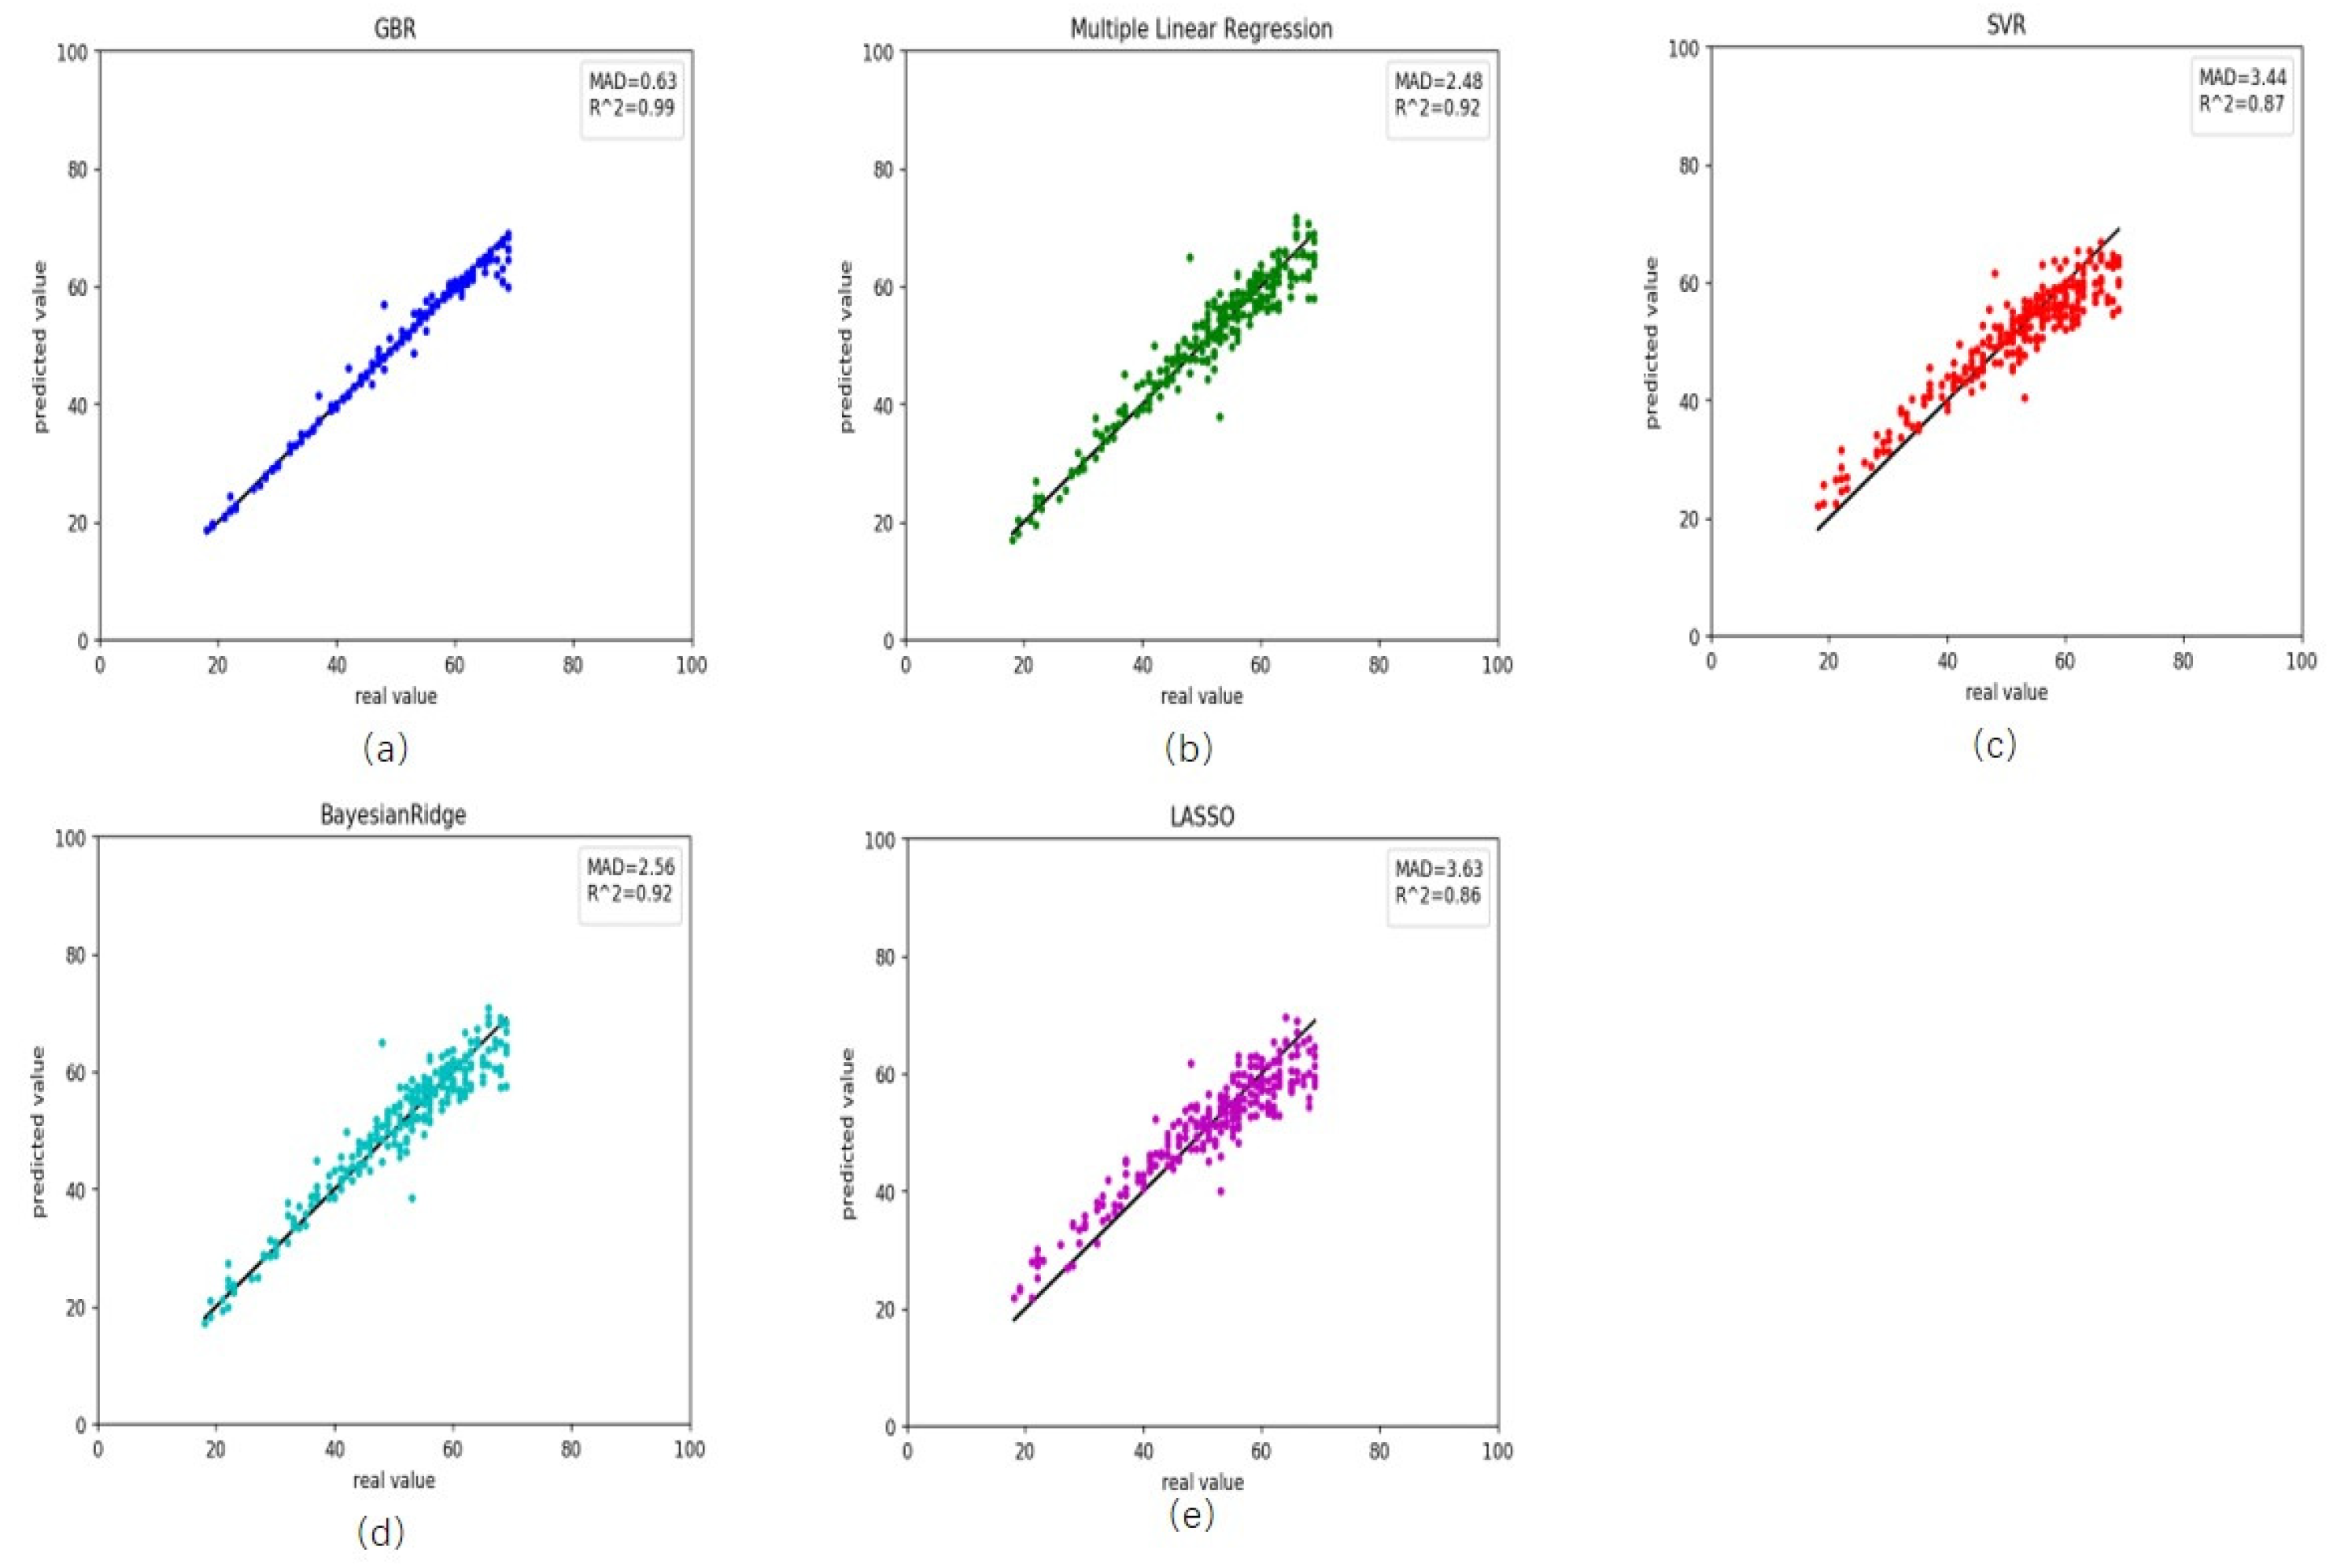
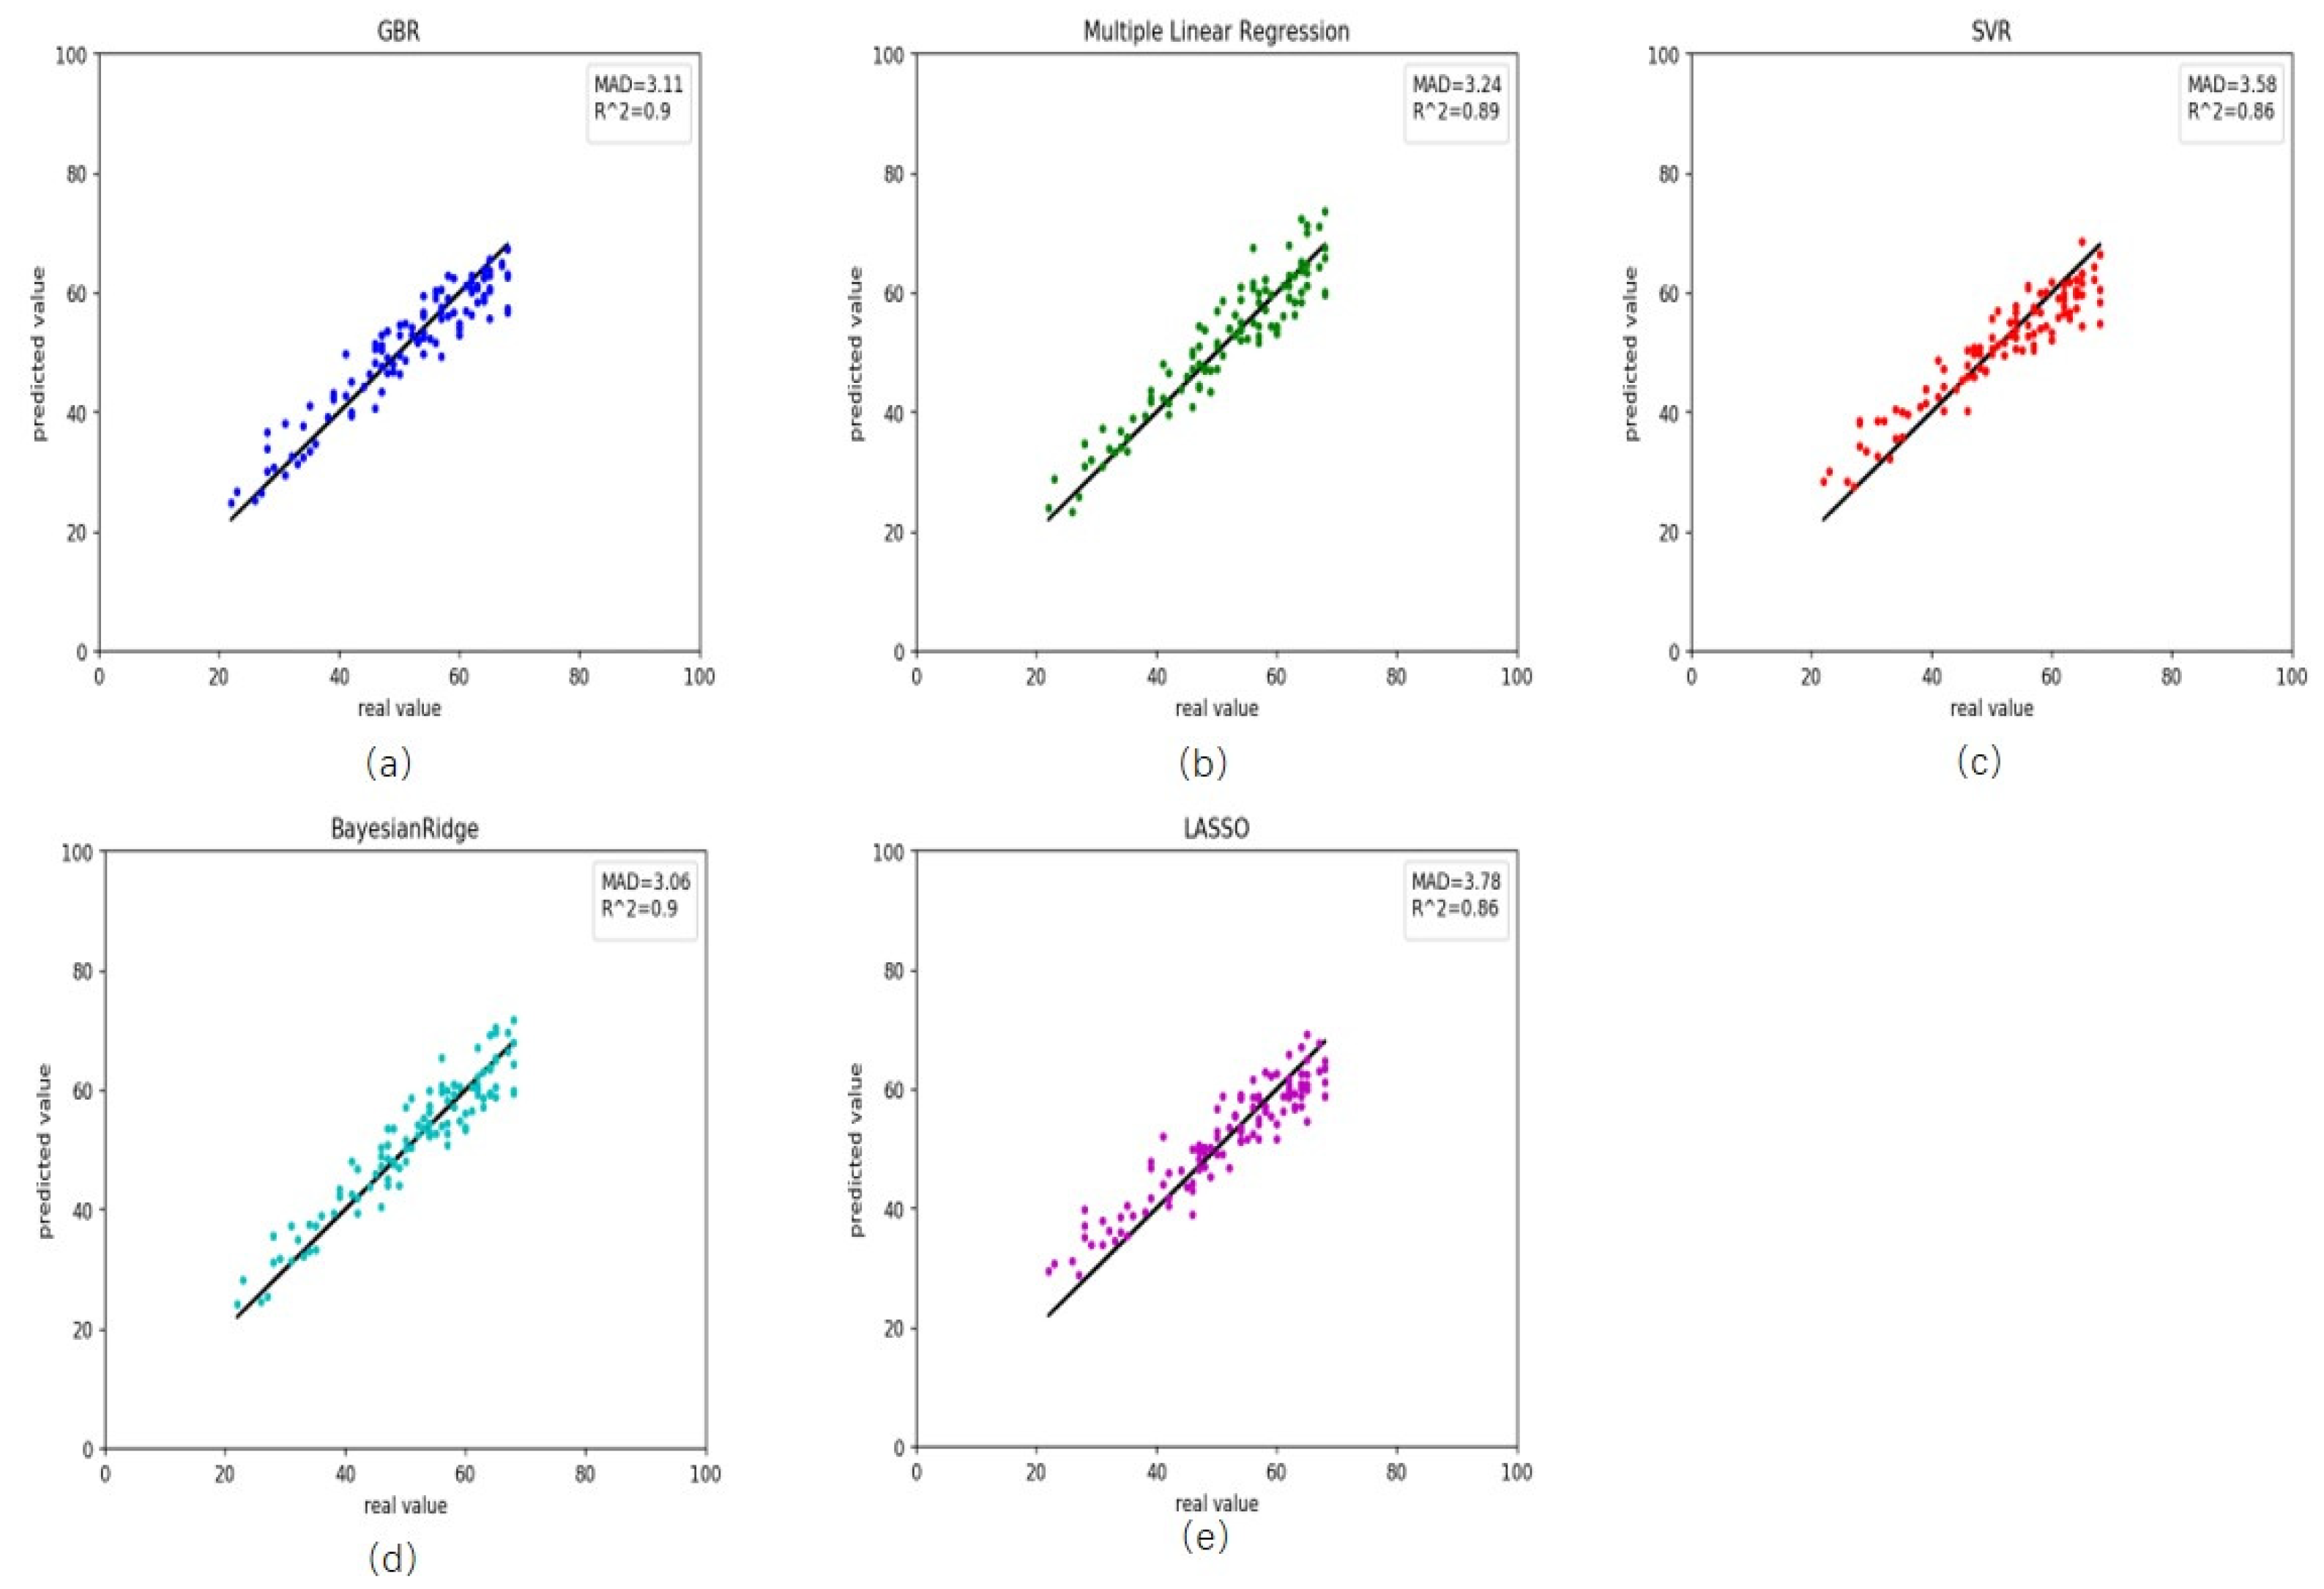
We also retrieved rheumatoid arthritis disease data from GEO. First, we used the healthy predictor to predict the rheumatoid arthritis data. The RMSE and MAD were 18.69 and 3.28 years, respectively (Table 3). These results and scatter plot (Figure 3) which samples were near the central straight line could be accepted. However, rheumatoid arthritis data could have its characters and a specific impact on DNA methylation. As a result, we recalculated the Pearson correlation and select 45 CpG sites, then retrained the GBR. On the training, the RMSE and MAD were 1.46 and 0.63 years for gradient boosting regression (Figure 4a), 3.34 and 2.48 years for multiple linear regression (Figure 4b), 4.40 and 3.44 years for support vector regression (Figure 4c), 3.42 and 2.56 years for Bayesian ridge regression (Figure 4d) and 4.56 and 3.63 years for lasso regression (Figure 4e). These results improved greatly (Table 4). Meanwhile, on the testing the RMSE and MAD were 3.90 and 3.11 years for gradient boosting regression (Figure 5a), 4.06 and 3.24 years for multiple linear regression (Figure 5b), 4.47 and 3.58 years for support vector regression (Figure 5c), 3.82 and 3.06 years for Bayesian ridge regression (Figure 5d) and 4.57 and 3.78 years for lasso regression (Figure 5e). The RMSE and MAD for gradient boosting regression improved 14.79 and 0.17, respectively. The performance of the retrained predictor was better than the former healthy ones on rheumatoid arthritis data.
3.3. Impact of Disease on Age Prediction
As we all know, some genes are linked to age-related diseases, such as cancer and Alzheimer’s disease. DNA methylation is not regular in these diseases. Dr. Horvath’s experiment showed that the predicted age of cancer patients had poor correlation with the actual age [21]. Park and his team found that the correlation between the degree of methylation and age of three CpG sites in patients with acute myeloid leukemia disappeared [24,42]. There were also studies showing that Alzheimer’s disease had a certain correlation with some age-related DNA methylation [43,44]. In this work, the impact of disease on age prediction was mainly reflected in the repeated twenty-four CpG sites (Table 5). The twenty-four common CpG sites between healthy and disease dataset indicated that arthritis disease affected DNA methylation and had a correlation with age. However, other twenty-one new sites have obtained this correlation.
3.4. Analysis of Selected Twenty-Four CpG Sites
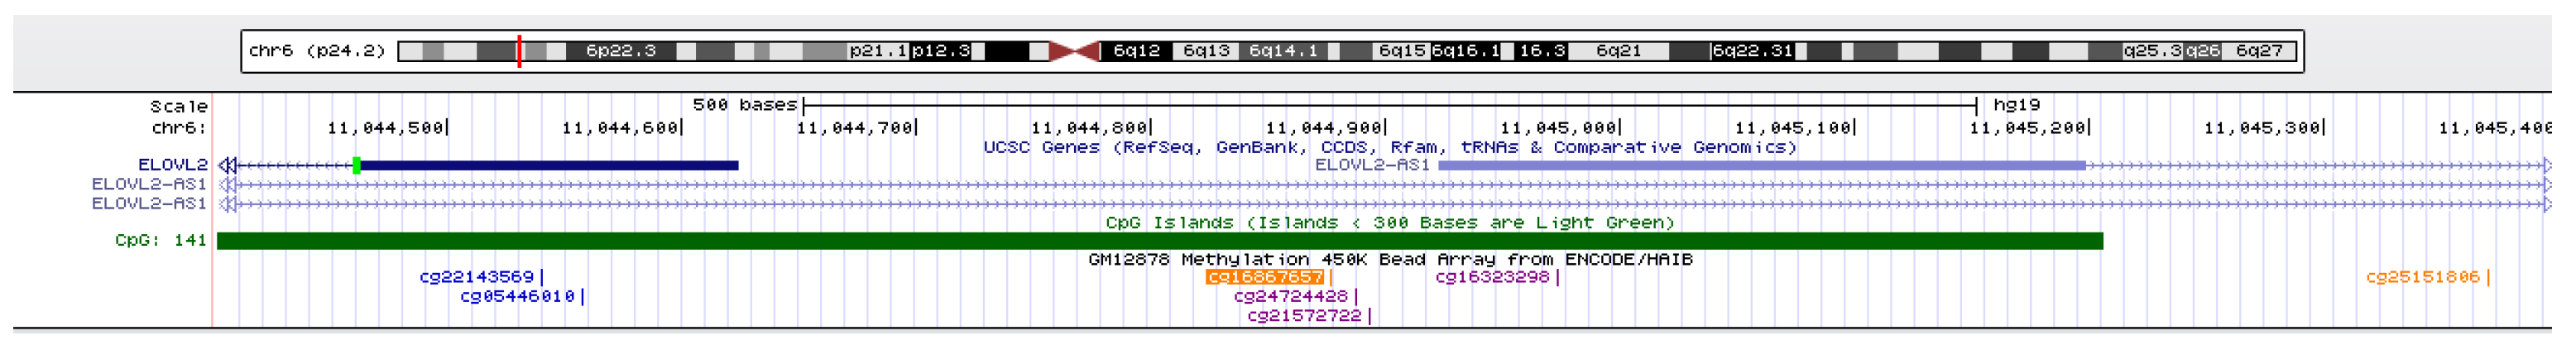
A total of twenty-four CpG sites in the rheumatoid arthritis disease were identical to the healthy dataset which may be the reason why disease dataset can also be applied to healthy predictor and obtained accepted performance. In order to find out the effect of these twenty-four CpG sites on age, we performed biological analysis on these sites and visualized them on UCSC genome browser (https://genome.ucsc.edu/, accessed on 20 October 2020). For example, it can be seen from the Figure 6 that cg16867657 was located in Human Gene ELOVL2. Besides, from the Table 5, we can see that several CpG sites mainly locate in Human Gene ELOVL2 and FHL2, which are considered as age-related genes, and play important roles in the process of human aging [42,45,46,47]. In fact, we observed that all these 24 CpGs were basically located on the age-related genes, implied their functional relevance with age.
4. Discussion
At present, age prediction becomes more and more popular in the field of DNA methylation. In the last decade, many studies have been conducted in the field, and there were several age predictors. In 2009, based on human blood sample data, Bekaert et al. established a quadratic regression model of age predictor, and accuracy of the predictor reached the high level at that time. Interestingly, they found the accuracy decreased with age increasing [48]. From 2013 to 2015, Horvath, Yi and Zbiec-Piekarska built linear models to predict age [21,23,24]. The advantage of linear models was that they were fast and easy to use. In 2017, Alisch et al. brought in non-linear models and built non-linear age predictor. Since they only used children dataset (3–17 years old), their model could not be applied to all age groups. They also found that the DNA methylation did not change at a constant rate with age in life [49]. Here, we intend to establish an age predictor that uses a nonlinear model and is suitable for all age groups.
In this work, we selected 111 CpG sites through calculating Pearson correlation in the healthy datasets. The predictor based on gradient boosting regression has better performance than other four models. In the disease dataset, we used a dataset of rheumatoid arthritis patients with a total of 354 samples. There were twenty-four common CpG sites between healthy and disease dataset, indicating that age-related diseases may have some effects on DNA methylation. The performance of new predictor improved greatly with disease CpG sites which showed rheumatoid disease having its certain correlation with age-related DNA methylation.
Of course, there were still some limitations in this study. First, the impact of gender on DNA methylation and age was not considered. In the past, scientists held two very different perspectives on gender research. Zaghlool SB showed that age-related methylation levels may differ in gender performance [48]. However, in Bram’s study [24], between men and women, age-related methylation levels seemed to be similar. Secondly, we did not consider the effects of environmental factors. Jenkins et al. studied DNA methylation in male sperm, found that long-term smoking and harsh environments (such as severe cold) accelerate the aging of gametes, making the predicted age often higher than the actual age [13,47,49]. Thirdly, we only used blood tissue, did not use data from other organs, such as skin, lungs and so on. Song et al. found each tissue had a different methylation pattern [21,50], implied that tissue-specific age predictors might achieve better performance than the multiple-tissue one. Finally, some age-related diseases and cancers were shown to accelerate or slow down the degree of DNA methylation [51]. Our disease dataset only contained one disease, leaving it being less explored whether other diseases affect age. In future, we will continue the work from the above aspects.
5. Conclusions
Age prediction based on DNA methylation was rapidly evolving in the field of epigenetics. In this work, we collected four healthy datasets and selected 111 highly age-associated CpG sites by calculating the Pearson correlation between age and DNA methylation value of each CpG site. Through comparing with other four regression algorithms, our proposed GBR was optimal which achieved R2 value of 0.97 and MAD of 1.40 years on training datasets, and R2 of 0.86 and MAD of 3.90 years on testing datasets, respectively. For the rheumatoid arthritis disease dataset, we identified 45 CpG sites showing highest Pearson correlations. The MAD and R2 were 0.63 years and 0.98 with GBR on the training dataset, and 3.11 years and 0.89 on the testing dataset. In addition, the deep analysis of twenty-four common CpG sites for both healthy and rheumatoid arthritis disease datasets illustrated the importance of the selected CpG sites.
Supplementary Materials
The following are available online at https://www.mdpi.com/article/10.3390/genes12060870/s1, Supplementary S1: 111 selected CpG sites on the healthy dataset, Supplementary S2: 45 selected CpG sites on the disease dataset.
Author Contributions
Y.X. designed the whole experiments and revised the manuscript. J.Z. performed the experiments and did the data analysis. J.Z. and H.F. wrote the manuscript. All authors have read and agreed to the published version of the manuscript
Funding
This research is funded by the National Natural Science Foundation grant number No.12071024 and the Ministry of Science and Technology of China 2020AAA0105103.
Institutional Review Board Statement
Not applicable.
Informed Consent Statement
Not applicable.
Data Availability Statement
Not applicable.
Acknowledgments
The authors wish to thank Xingyan Li who helped processing the data.
Conflicts of Interest
The authors declare no conflict of interest.
References
- Del Din, S.; Godfrey, A.; Galna, B.; Lord, S.; Rochester, L. Free-Living Gait Characteristics in Ageing and Parkinson’s Disease: Impact of Environment and Ambulatory Bout Length. J. Neuroeng. Rehabil. 2016, 13, 46. [Google Scholar] [CrossRef] [PubMed] [Green Version]
- Luigi, F.; Partridge, L.; Longo, V.D. Extending Healthy Life Span—From Yeast to Humans. Science 2010, 328, 321–326. [Google Scholar]
- Vidaki, A.; Ballard, D.; Aliferi, A.; Miller, T.H.; Barron, L.P.; Court, D.S. DNA Methylation-Based Forensic Age Prediction Using Artificial Neural Networks and Next Generation Sequencing. Forensic Sci. Int. Genet. 2017, 28, 225–236. [Google Scholar] [CrossRef] [PubMed] [Green Version]
- Philipp, O.; Sinclair, D.A. The Role of Nuclear Architecture in Genomic Instability and Ageing. Nat. Rev. Mol. Cell Biol. 2007, 8, 692–702. [Google Scholar] [CrossRef]
- Weidner, C.I.; Lin, Q.; Koch, C.M.; Eisele, L.; Beier, F.; Ziegler, P.; Bauerschlag, D.O.; Jöckel, K.-H.; Erbel, R.; Mühleisen, T.W.; et al. Aging of Blood Can Be Tracked by DNA Methylation Changes at Just Three Cpg Sites. Genome Biol. 2014, 15, R24. [Google Scholar] [CrossRef] [PubMed] [Green Version]
- Moore, L.D.; Le, T.; Fan, G. DNA Methylation and Its Basic Function. Neuropsychopharmacology 2013, 38, 23–38. [Google Scholar] [CrossRef] [Green Version]
- Bruce, R. Impact of Aging on DNA Methylation. Ageing Res. Rev. 2003, 2, 245–261. [Google Scholar]
- Maegawa, S.; Lu, Y.; Tahara, T.; Lee, J.T.; Madzo, J.; Liang, S.; Jelinek, J.; Colman, R.J.; Issa, J.-P. Caloric Restriction Delays Age-Related Methylation Drift. Nat. Commun. 2017, 8, 539. [Google Scholar] [CrossRef]
- Berdyshev, G.D.; Korotaev, G.K.; Boiarskikh, G.V.; Vaniushin, B.F. Nucleotide Composition of DNA and Rna from Somatic Tissues of Humpback and Its Changes During Spawning. Biokhimiia 1967, 32, 988–993. [Google Scholar]
- Browne, M.J.; Burdon, R.H. The Sequence Specificity of Vertebrate DNA Methylation. Nucleic Acids Res. 1977, 4, 1025–1037. [Google Scholar] [CrossRef] [Green Version]
- Vanyushin, B.F.; Nemirovsky, L.E.; Klimenko, V.V.; Vasiliev, V.K.; Belozersky, A.N. The 5-Methylcytosine in DNA of Rats. Tissue and Age Specificity and the Changes Induced by Hydrocortisone and Other Agents. Gerontologia 1973, 19, 138–152. [Google Scholar] [CrossRef] [PubMed]
- Bocklandt, S.; Lin, W.; Sehl, M.E.; Sanchez, F.J.; Sinsheimer, J.S.; Horvath, S.; Vilain, E. Epigenetic Predictor of Age. PLoS ONE 2011, 6, e14821. [Google Scholar] [CrossRef] [Green Version]
- Jenkins, T.G.; Aston, K.I.; Cairns, B.; Smith, A.; Carrell, D.T. Paternal Germ Line Aging: DNA Methylation Age Prediction from Human Sperm. BMC Genom. 2018, 19, 763. [Google Scholar] [CrossRef] [PubMed] [Green Version]
- Yi, S.H.; Jia, Y.S.; Mei, K.; Yang, R.Z.; Huang, D.X. Age-Related DNA Methylation Changes for Forensic Age-Prediction. Int. J. Leg. Med. 2015, 129, 237–244. [Google Scholar] [CrossRef]
- Thevissen, P.W.; Kaur, J.; Willems, G. Human Age Estimation Combining Third Molar and Skeletal Development. Int. J. Leg. Med. 2012, 126, 285–292. [Google Scholar] [CrossRef] [Green Version]
- Kayser, M. Forensic DNA Phenotyping: Predicting Human Appearance from Crime Scene Material for Investigative Purposes. Forensic Sci. Int. Genet. 2015, 18, 33–48. [Google Scholar] [CrossRef] [PubMed]
- Toom, V.; Wienroth, M.; M’Charek, A.; Prainsack, B.; Williams, R.; Duster, T.; Heinemann, T.; Kruse, C.; Machado, H.; Murphy, E. Approaching Ethical, Legal and Social Issues of Emerging Forensic DNA Phenotyping (Fdp) Technologies Comprehensively: Reply to ‘Forensic DNA Phenotyping: Predicting Human Appearance from Crime Scene Material for Investigative Purposes’ by Manfred Kayser. Forensic Sci. Int. Genet. 2016, 22, e1–e4. [Google Scholar] [CrossRef] [Green Version]
- Williams, S.L.; Mash, D.C.; Zuchner, S.; Moraes, C.T. Somatic Mtdna Mutation Spectra in the Aging Human Putamen. PLoS Genet. 2013, 9, e1003990. [Google Scholar] [CrossRef]
- Spólnicka, M.; Pośpiech, E.; Pepłońska, B.; Zbieć-Piekarska, R.; Makowska, Ż.; Pięta, A.; Karłowska-Pik, J.; Ziemkiewicz, B.; Wężyk, M.; Gasperowicz, P.; et al. DNA Methylation in Elovl2 and C1orf132 Correctly Predicted Chronological Age of Individuals from Three Disease Groups. Int. J. Leg. Med. 2018, 132, 1–11. [Google Scholar] [CrossRef]
- Li, X.; Li, W.; Xu, Y. Human Age Prediction Based on DNA Methylation Using a Gradient Boosting Regressor. Genes 2018, 9, 424. [Google Scholar] [CrossRef] [Green Version]
- Horvath, S. DNA Methylation Age of Human Tissues and Cell Types. Genome Biol. 2013, 14, R115. [Google Scholar] [CrossRef] [PubMed] [Green Version]
- Horvath, S.; Gurven, M.; Levine, M.E.; Trumble, B.C.; Kaplan, H.; Allayee, H.; Ritz, B.R.; Chen, B.; Lu, A.T.; Rickabaugh, T.M.; et al. An Epigenetic Clock Analysis of Race/Ethnicity, Sex, and Coronary Heart Disease. Genome Biol. 2016, 17, 1–23. [Google Scholar] [CrossRef] [PubMed] [Green Version]
- Yi, S.H.; Xu, L.C.; Mei, K.; Yang, R.Z.; Huang, D.X. Isolation and Identification of Age-Related DNA Methylation Markers for Forensic Age-Prediction. Forensic Sci. Int. Genet. 2014, 11, 117–125. [Google Scholar] [CrossRef]
- Zbiec-Piekarska, R.; Spolnicka, M.; Kupiec, T.; Makowska, Z.; Spas, A.; Parys-Proszek, A.; Kucharczyk, K.; Ploski, R.; Branicki, W. Examination of DNA Methylation Status of the Elovl2 Marker May Be Useful for Human Age Prediction in Forensic Science. Forensic Sci. Int. Genet. 2015, 14, 161–167. [Google Scholar] [CrossRef]
- Xu, Y.; Li, X.; Yang, Y.; Li, C.; Shao, X. Human Age Prediction Based on DNA Methylation of Non-Blood Tissues. Comput. Methods Programs Biomed. 2019, 171, 11–18. [Google Scholar] [CrossRef]
- Daunay, A.; Baudrin, L.G.; Deleuze, J.-F.; How-Kit, A. Evaluation of Six Blood-Based Age Prediction Models Using DNA Methylation Analysis by Pyrosequencing. Sci. Rep. 2019, 9, 8862. [Google Scholar] [CrossRef] [Green Version]
- Anastasia, A.; Ballard, D.; Gallidabino, M.D.; Thurtle, H.; Barron, L.; Court, D.S. DNA Methylation-Based Age Prediction Using Massively Parallel Sequencing Data and Multiple Machine Learning Models. Forensic Sci. Int. Genet. 2018, 37, 215–226. [Google Scholar]
- Hannum, G.; Guinney, J.; Zhao, L.; Zhang, L.; Hughes, G.; Sadda, S.; Klotzle, B.; Bibikova, M.; Fan, J.-B.; Gao, Y.; et al. Genome-Wide Methylation Profiles Reveal Quantitative Views of Human Aging Rates. Mol. Cell 2013, 49, 359–367. [Google Scholar] [CrossRef] [PubMed] [Green Version]
- Liu, Y.; Aryee, M.J.; Padyukov, L.; Fallin, M.D.; Hesselberg, E.; Runarsson, A.; Reinius, L.; Acevedo, N.; Taub, M.; Ronninger, M.; et al. Epigenome-Wide Association Data Implicate DNA Methylation as an Intermediary of Genetic Risk in Rheumatoid Arthritis. Nat. Biotechnol. 2013, 31, 142–147. [Google Scholar] [CrossRef]
- Xu, C.; Qu, H.; Wang, G.; Xie, B.; Shi, Y.; Yang, Y.; Zhao, Z.; Hu, L.; Fang, X.; Yan, J.; et al. A Novel Strategy for Forensic Age Prediction by DNA Methylation and Support Vector Regression Model. Sci. Rep. 2015, 5, 17788. [Google Scholar] [CrossRef] [Green Version]
- Kananen, L.; Marttila, S.; Nevalainen, T.; Jylhävä, J.; Mononen, N.; Kähönen, M.; Raitakari, O.T.; Lehtimäki, T.; Hurme, M. Aging-Associated DNA Methylation Changes in Middle-Aged Individuals: The Young Finns Study. BMC Genom. 2016, 17, 103. [Google Scholar] [CrossRef] [Green Version]
- Issa Jean-Pierre, J.; Ahuja, N.; Toyota, M.; Bronner, M.P.; Brentnall, T.A. Accelerated Age-Related Cpg Island Methylation in Ulcerative Colitis. Cancer Res. 2001, 61, 3573. [Google Scholar]
- Pan, C.; Yi, S.; Xiao, C.; Huang, Y.; Chen, X.; Huang, D. The Evaluation of Seven Age-Related Cpgs for Forensic Purpose in Blood from Chinese Han Population. Forensic Sci. Int. Genet. 2020, 46, 102251. [Google Scholar] [CrossRef]
- Friedman, J.H. Greedy Function Approximation: A Gradient Boosting Machine. Ann. Stat. 2001, 29, 1189–1232. [Google Scholar] [CrossRef]
- Ayaru, L.; Ypsilantis, P.-P.; Nanapragasam, A.; Choi, R.C.-H.; Thillanathan, A.; Min-Ho, L.; Montana, G. Prediction of Outcome in Acute Lower Gastrointestinal Bleeding Using Gradient Boosting. PLoS ONE 2015, 10, e0132485. [Google Scholar] [CrossRef]
- Alexey, N.; Knoll, A. Gradient Boosting Machines, a Tutorial. Front. Neurorobot. 2013, 7, 21. [Google Scholar]
- Andrews, D.F. A Robust Method for Multiple Linear Regression. Technometrics 1974, 16, 523–531. [Google Scholar] [CrossRef]
- Eberly, L.E. Multiple Linear Regression. Methods Mol. Biol. 2007, 404, 165–187. [Google Scholar]
- Yuan, Z.; Huang, B. Prediction of Protein Accessible Surface Areas by Support Vector Regression. Proteins 2004, 57, 558–564. [Google Scholar] [CrossRef] [PubMed]
- Chen, T.; Martin, E. Bayesian Linear Regression and Variable Selection for Spectroscopic Calibration. Anal. Chim. Acta 2009, 631, 13–21. [Google Scholar] [CrossRef] [PubMed] [Green Version]
- Roth, V. The Generalized Lasso. IEEE Trans. Neural Netw. 2004, 15, 16–28. [Google Scholar] [CrossRef] [PubMed]
- Park, J.L.; Kim, J.H.; Seo, E.; Bae, D.H.; Kim, S.Y.; Lee, H.C.; Woo, K.M.; Kim, Y.S. Identification and Evaluation of Age-Correlated DNA Methylation Markers for Forensic Use. Forensic Sci. Int. Genet. 2016, 23, 64–70. [Google Scholar] [CrossRef]
- Lane, C.A.; Hardy, J.; Schott, J.M. Alzheimer’s Disease. Eur. J. Neurol. 2018, 25, 59–70. [Google Scholar] [CrossRef]
- Sandipan, B.; Patanwala, A.E.; Lo-Ciganic, W.-H.; Malone, D.C.; Lee, J.K.; Knapp, S.M.; Warholak, T.; Burke, W.J. Alzheimer’s Disease Medication and Risk of All-Cause Mortality and All-Cause Hospitalization: A Retrospective Cohort Study. Alzheimer’s Dement. Transl. Res. Clin. Interv. 2019, 5, 294–302. [Google Scholar]
- Slieker, R.C.; Relton, C.L.; Gaunt, T.R.; Slagboom, P.E.; Heijmans, B.T. Age-Related DNA Methylation Changes Are Tissue-Specific with Elovl2 Promoter Methylation as Exception. Epigenetics Chromatin 2018, 11, 25. [Google Scholar] [CrossRef] [PubMed] [Green Version]
- Steegenga, W.T.; Boekschoten, M.V.; Lute, C.; Hooiveld, G.J.; de Groot, P.J.; Morris, T.J.; Teschendorff, A.E.; Butcher, L.M.; Beck, S.; Müller, M. Genome-Wide Age-Related Changes in DNA Methylation and Gene Expression in Human PBMCs. Age 2014, 36, 1523–1540. [Google Scholar] [CrossRef] [PubMed]
- Jenkins, T.G.; Aston, K.I.; Pflueger, C.; Cairns, B.R.; Carrell, D.T. Age-Associated Sperm DNA Methylation Alterations: Possible Implications in Offspring Disease Susceptibility. PLoS Genet. 2014, 10, e1004458. [Google Scholar] [CrossRef]
- Zaghlool, S.B.; Al-Shafai, M.; al Muftah, W.A.; Kumar, P.; Falchi, M.; Suhre, K. Association of DNA Methylation with Age, Gender, and Smoking in an Arab Population. Clin. Epigenetics 2015, 7, 6. [Google Scholar] [CrossRef] [PubMed] [Green Version]
- Jenkins, T.G.; James, E.R.; Alonso, D.F.; Hoidal, J.R.; Murphy, P.J.; Hotaling, J.M.; Cairns, B.R.; Carrell, D.T.; Aston, K.I. Cigarette Smoking Significantly Alters Sperm DNA Methylation Patterns. Andrology 2017, 5, 1089–1099. [Google Scholar] [CrossRef] [PubMed]
- Song, F.; Mahmood, S.; Ghosh, S.; Liang, P.; Smiraglia, D.J.; Nagase, H.; Held, W.A. Tissue Specific Differentially Methylated Regions (Tdmr): Changes in DNA Methylation During Development. Genomics 2009, 93, 130–139. [Google Scholar] [CrossRef] [Green Version]
- Kresovich, J.K.; Xu, Z.; O’Brien, K.M.; Weinberg, C.R.; Sandler, D.P.; Taylor, J.A. Methylation-Based Biological Age and Breast Cancer Risk. J. Natl. Cancer Inst. 2019, 111, 1051–1058. [Google Scholar] [CrossRef] [PubMed]
Figure 1.
Comparison results between the actual age and predicted age by five different models on the training health data. (a) gradient boosting regression, (b) multiple linear regression, (c) support vector regression, (d) Bayesian ridge regression and (e) lasso regression.
Figure 1.
Comparison results between the actual age and predicted age by five different models on the training health data. (a) gradient boosting regression, (b) multiple linear regression, (c) support vector regression, (d) Bayesian ridge regression and (e) lasso regression.

Figure 2.
Comparison results between the actual age and predicted age by five different models on the testing healthy data. (a) gradient boosting regression, (b) multiple linear regression, (c) support vector regression, (d) Bayesian ridge regression and (e) lasso regression.
Figure 2.
Comparison results between the actual age and predicted age by five different models on the testing healthy data. (a) gradient boosting regression, (b) multiple linear regression, (c) support vector regression, (d) Bayesian ridge regression and (e) lasso regression.

Figure 3.
The scatter plot of the rheumatoid arthritis dataset with the healthy predictor.

Figure 4.
Comparison results between the actual age and predicted age by five different models on the training rheumatoid arthritis data. (a) gradient boosting regression, (b) multiple linear regression, (c) support vector regression, (d) Bayesian ridge regression and (e) lasso regression.
Figure 4.
Comparison results between the actual age and predicted age by five different models on the training rheumatoid arthritis data. (a) gradient boosting regression, (b) multiple linear regression, (c) support vector regression, (d) Bayesian ridge regression and (e) lasso regression.

Figure 5.
Comparison results between the actual age and predicted age by five different models on the testing rheumatoid arthritis data. (a) gradient boosting regression, (b) multiple linear regression, (c) support vector regression, (d) Bayesian ridge regression and (e) lasso regression.
Figure 5.
Comparison results between the actual age and predicted age by five different models on the testing rheumatoid arthritis data. (a) gradient boosting regression, (b) multiple linear regression, (c) support vector regression, (d) Bayesian ridge regression and (e) lasso regression.

Figure 6.
UCSC genome browser view of the genomic location of the CpG cg16867657.


Table 1.
Four healthy and one disease DNA methylation datasets.
| Series | DNA Origin | Platform | Author and Publication Year | Disease | Number |
|---|---|---|---|---|---|
| GSE40279 | Blood | 450k | Zhang K [28] (2012) | -- | 656 |
| GSE42861 | Blood | 450k | Liu Y [29] (2013) | -- | 335 |
| GSE65638 | Blood | 450k | Xu C [30] (2015) | -- | 16 |
| GSE69270 | Blood | 450k | Kananen L [31] (2016) | -- | 184 |
| GSE42861 | Blood | 450k | Liu Y [29] (2013) | Rheumatoid arthritis | 354 |
Table 2.
Comparison results of our predictor with other four regression models and Horvath’s model on healthy datasets.
Table 2.
Comparison results of our predictor with other four regression models and Horvath’s model on healthy datasets.
| R2 | MAD | MSE | RMSE | |
|---|---|---|---|---|
| Training | ||||
| Multiple Linear Regression | 0.9363 | 2.9150 | 14.647 | 3.8271 |
| Support Vector Regression | 0.8667 | 4.1965 | 30.636 | 5.5350 |
| Bayesian Ridge Regression | 0.9345 | 2.9376 | 15.064 | 3.8813 |
| Lasso Regression | 0.8652 | 4.1925 | 30.982 | 5.5661 |
| Gradient Boosting Regression | 0.9737 | 1.4034 | 6.0335 | 2.4563 |
| Testing | ||||
| Multiple Linear Regression | 0.8649 | 3.8228 | 30.1042 | 5.4867 |
| Support Vector Regression | 0.8417 | 4.4448 | 35.2690 | 5.9387 |
| Bayesian Ridge Regression | 0.8727 | 3.6679 | 28.3670 | 5.3260 |
| Lasso Regression | 0.8478 | 4.3360 | 33.9035 | 5.8226 |
| Gradient Boosting Regression | 0.8625 | 3.8988 | 30.6367 | 5.5350 |
| Horvath’s model | 0.8110 | 4.9441 | 41.1128 | 6.4119 |
Table 3.
Performance of the healthy predictor on rheumatoid arthritis dataset.
| R2 | MAD | MSE | RMSE |
|---|---|---|---|
| 0.870958 | 3.284863 | 18.691550 | 4.323373 |
Table 4.
Comparison results of our predictor with other four common regression models on rheumatoid arthritis dataset.
Table 4.
Comparison results of our predictor with other four common regression models on rheumatoid arthritis dataset.
| R2 | MAD | MSE | RMSE | |
|---|---|---|---|---|
| Training | ||||
| Multiple Linear Regression | 0.922834 | 2.477032 | 11.16546 | 3.341476 |
| Support Vector Regression | 0.866253 | 3.439445 | 19.35249 | 4.399147 |
| Bayesian Ridge Regression | 0.919139 | 2.564907 | 11.70018 | 3.420553 |
| Lasso Regression | 0.856411 | 3.625878 | 20.77659 | 4.558135 |
| Gradient Boosting Regression | 0.985262 | 0.625448 | 2.132504 | 1.460310 |
| Testing | ||||
| Multiple Linear Regression | 0.886814 | 3.242406 | 16.46903 | 4.058205 |
| Support Vector Regression | 0.862663 | 3.582393 | 19.98303 | 4.470239 |
| Bayesian Ridge Regression | 0.899453 | 3.064368 | 14.62997 | 3.824914 |
| Lasso Regression | 0.856548 | 3.780038 | 20.87289 | 4.568686 |
| Gradient Boosting Regression | 0.895673 | 3.114274 | 15.18006 | 3.896159 |
Table 5.
Information about the twenty-four common CpG sites for healthy and rheumatoid arthritis datasets.
Table 5.
Information about the twenty-four common CpG sites for healthy and rheumatoid arthritis datasets.
| CpG Sites | Pearson Correlation Coefficient in Healthy Datasets | Pearson Correlation Coefficient in Disease Datasets | Physical Position in GRCh37/hg19 (Chromosome: Position) | Gene Names |
|---|---|---|---|---|
| cg16867657 | 0.8715 | 0.8240 | chr6:11044877 | ELOVL2 |
| cg22454769 | 0.7892 | 0.8107 | chr2:106015768 | FHL2 |
| cg19283806 | −0.7646 | −0.7112 | chr18:66389420 | CCDC102B |
| cg04875128 | 0.7412 | 0.6803 | chr15:31775896 | OTUD7A |
| cg10501210 | −0.7381 | −0.7302 | chr1:207997020 | - |
| cg24079702 | 0.7328 | 0.6829 | chr2:106015772 | FHL2 |
| cg06639320 | 0.7265 | 0.8027 | chr2:106015740 | FHL2 |
| cg08097417 | 0.7019 | 0.6814 | chr7:130419134 | KLF14 |
| cg07082267 | −0.6933 | −0.6650 | chr16:85429036 | - |
| cg24724428 | 0.6788 | 0.6607 | chr6:11044888 | ELOVL2 |
| cg09809672 | −0.6723 | −0.6005 | chr1:236557683 | - |
| cg11649376 | −0.6667 | −0.6361 | chr12:81473234 | ACSS3 |
| cg23078123 | −0.6587 | −0.6089 | chr1:68577796 | GNG12 |
| cg08262002 | −0.6525 | −0.6530 | chr4:16575323 | LDB2 |
| cg21572722 | 0.6503 | 0.8270 | chr6:11044894 | ELOVL2 |
| cg18933331 | −0.6463 | −0.6085 | chr1:110186419 | - |
| cg06784991 | 0.6427 | 0.6287 | chr1:53308769 | ZYG11A |
| cg22736354 | 0.6370 | 0.6769 | chr6:18122719 | NHLRC1 |
| cg01528542 | −0.6250 | −0.6350 | chr12:81468232 | - |
| cg23500537 | 0.6093 | 0.7347 | chr5:140419820 | - |
| cg06819923 | −0.6087 | −0.6300 | chr16:21214509 | ZP2 |
| cg17110586 | 0.6035 | 0.6934 | chr19:36454623 | - |
| cg00481951 | 0.6031 | 0.6107 | chr3:187387651 | SST |
| cg03473532 | −0.6012 | −0.6310 | chr7:131008744 | MKLN1 |
Publisher’s Note: MDPI stays neutral with regard to jurisdictional claims in published maps and institutional affiliations. |
© 2021 by the authors. Licensee MDPI, Basel, Switzerland. This article is an open access article distributed under the terms and conditions of the Creative Commons Attribution (CC BY) license (https://creativecommons.org/licenses/by/4.0/).
Share and Cite
MDPI and ACS Style
Zhang, J.; Fu, H.; Xu, Y. Age Prediction of Human Based on DNA Methylation by Blood Tissues. Genes 2021, 12, 870. https://doi.org/10.3390/genes12060870
AMA Style
Zhang J, Fu H, Xu Y. Age Prediction of Human Based on DNA Methylation by Blood Tissues. Genes. 2021; 12(6):870. https://doi.org/10.3390/genes12060870
Chicago/Turabian StyleZhang, Jiansheng, Hongli Fu, and Yan Xu. 2021. "Age Prediction of Human Based on DNA Methylation by Blood Tissues" Genes 12, no. 6: 870. https://doi.org/10.3390/genes12060870
Note that from the first issue of 2016, this journal uses article numbers instead of page numbers. See further details here.