Article

Distinct Changes in Metabolic Profile and Sensory Quality with Different Varieties of Chrysanthemum (Juhua) Tea Measured by LC-MS-Based Untargeted Metabolomics and Electronic Tongue

1
TCM and Ethnomedicine Innovation & Development International Laboratory, Innovative Material Medical Research Institute, School of Pharmacy, Hunan University of Chinese Medicine, Changsha 410208, China
2
Department of Food and Drug Engineering, School of Pharmacy, Hunan University of Chinese Medicine, Changsha 410208, China
3
Engineering Technology Research Center of Hunan Province Xiangnan Area Authentic Chinese Medicinal Materials, Yongzhou 425600, China
4
Confucius Institute, Wonkwang University, 460 Iksandae-ro, Iksan 54538, Republic of Korea
*
Author to whom correspondence should be addressed.
Foods 2024, 13(7), 1080; https://doi.org/10.3390/foods13071080
Submission received: 13 March 2024 / Revised: 26 March 2024 / Accepted: 29 March 2024 / Published: 1 April 2024
(This article belongs to the Special Issue Advances in Tea Chemistry)

Abstract

:
Chrysanthemum tea, a typical health tea with the same origin as medicine and food, is famous for its unique health benefits and flavor. The taste and sensory quality of chrysanthemum (Juhua) tea are mainly determined by secondary metabolites. Therefore, the present research adopted untargeted metabolomics combined with an electronic tongue system to analyze the correlation between the metabolite profiles and taste characteristics of different varieties of chrysanthemum tea. The results of sensory evaluation showed that there were significant differences in the sensory qualities of five different varieties of chrysanthemum tea, especially bitterness and astringency. The results of principal component analysis (PCA) indicated that there were significant metabolic differences among the five chrysanthemum teas. A total of 1775 metabolites were identified by using untargeted metabolomics based on UPLC-Q-TOF/MS analysis. According to the variable importance in projection (VIP) values of the orthogonal projections to latent structures discriminant analysis (OPLS-DA), 143 VIP metabolites were found to be responsible for metabolic changes between Huangju and Jinsi Huangju tea; among them, 13 metabolites were identified as the key metabolites of the differences in sensory quality between them. Kaempferol, luteolin, genistein, and some quinic acid derivatives were correlated with the “astringency” attributes. In contrast, l-(-)-3 phenyllactic acid and L-malic acid were found to be responsible for the “bitterness” and “umami” attributes in chrysanthemum tea. Kyoto Encyclopedia of Genes and Genomes pathway enrichment analysis showed that the flavonoid and flavonol biosynthesis pathways had important effects on the sensory quality of chrysanthemum tea. These findings provide the theoretical basis for understanding the characteristic metabolites that contribute to the distinctive sensory qualities of chrysanthemum tea.

1. Introduction

Dietary herbal teas, defined as water-based immersions or decoctions prepared with herbal ingredients, have been used in healthcare and as part of a healthy diet [1]. As a traditional medicine- and food-homologous plant, Chrysanthemum morifolium Ramat. (Juhua) has been used for over 3000 years as a herbal tea-based drink, the third-most widely consumed drink after tea and coffee [2]. Notably, drinking chrysanthemum tea or beverages was thought to have similar preventive or therapeutic effects on high blood pressure, sore throat, and eye diseases [3]. Modern pharmacological studies have shown that flavonoids, anthocyanins, alkaloids, phenolic acids, and other phytochemicals in chrysanthemum, which have antimicrobial, antioxidant, anti-inflammatory, anti-cancer, anti-obesity, nerve-protective, and other functions, provide a theoretical basis for the development of chrysanthemum tea and its deeply processed products [4]. However, the literature on chrysanthemums mainly focuses on the biological activity, vegetative propagation, and cultivation technology of medicinal chrysanthemum [5]. In contrast, there are few reports on edible chrysanthemum’s flavor and sensory qualities in dietary herbal teas.
The taste and sensory qualities of chrysanthemum (Juhua) tea are mainly determined by secondary metabolites, such as flavonols, anthocyanins, amino acids, alkaloids, and organic acids [6]. Generally, the variety, region, climate, soil type, and production process of chrysanthemum tea determine its sensory qualities, related to its chemical composition [7]. At present, many researchers have systematically analyzed the flavor components of edible chrysanthemum using GC-MS, HS-GC-IMS, GC-O, HPLC, sensory evaluation, and other methods [8,9,10]. However, to the best of our knowledge, numerous studies on the sensory qualities and flavor substances of edible chrysanthemum have some problems, such as a single method and lack of multi-omics research [11]. In addition, few studies have been conducted on the core metabolites that influence the sensory qualities of chrysanthemum tea.
Metabolomics, as a method of omics, is the science of studying the species, quantity, and changes of metabolites (endogenous metabolites) with molecular weights less than 1500 Da caused by the response of organisms to external stimuli, pathophysiological changes, and gene mutations [12]. Through plant metabolomics, a variety of analysis platforms can be used to study the metabolites of different plant samples after physical or chemical treatment and obtain different meanings, including geographical traceability, food processing, biological activity, etc. [1,13]. In addition, as an intelligent instrument to simulate human taste, electronic tongue systems have been reported to be able to quantitatively and qualitatively analyze the taste of different foods and Chinese herbs [14,15,16]. Thus, the combined analysis of untargeted metabolomics and food flavomics based on LC-MS/MS and an electronic tongue is an excellent method to establish the relationship between chrysanthemum tea’s chemical constituents and sensory qualities. However, as far as we know, this multi-omics analysis has not been applied to reveal the key flavor metabolites of different varieties of chrysanthemum tea.
The chemical composition, metabolites, and taste of chrysanthemum (Juhua) tea may vary somewhat depending on its variety [17]. The objective of this study builds on previous studies [15]. It aims to compare the metabolites and sensory qualities of five different varieties of chrysanthemum tea by using LC-MS-based untargeted metabolomics combined with electronic tongue analysis, investigating key differential metabolites associated with sensory quality differences in chrysanthemum tea. Importantly, the implementation of this study offers a high-resolution marker for the sensory quality evaluation of chrysanthemum tea. This study will provide insight into ascertaining the characteristic metabolites in different varieties of chrysanthemum tea.

2. Materials and Methods

2.1. Chrysanthemum Tea Samples

The 5 varieties of chrysanthemum tea selected in this study were selected from local producers in Hunan, Anhui, and Hangzhou Provinces, and the 6 biological replicates were found for each variety of chrysanthemum tea in the metabolomics study. “JinshihuangJu” (J) and “HuangJu” (X) were selected from local producers in Yongzhou, Hunan Province; “BaoJu” (B) and “GongJu” (G) were collected in the region of Bozhou, Anhui Province; and ”HanbaiJu”(H) was collected from Hangzhou, Zhejiang Province. Detailed information on the chrysanthemum tea samples is provided in Figure 1.

2.2. Sensory Evaluation for Chrysanthemum Tea Samples

Ten study participants (n = 10, 3 males and 7 females, 18–21 years of age) were recruited from the Hunan University of Chinese Medicine’s internal student panel without any exclusion parameters aside from being in good health, nonsmoking, and not currently taking medication. In order to eliminate the influence of environmental factors on the sensory evaluation results, sensory testing experiments were conducted in a single room at 20–25 °C and were performed in the morning (9:00 to 11:00 a.m.). According to the National Standards of China (GB/T23776-2018) [18], all subjects were trained 4 times in 2 weeks, and the sensory attributes used for the sensory quality evaluation of chrysanthemum tea samples were screened and identified. Briefly, the different varieties of chrysanthemum tea were weighed (2.00 ± 0.05 g), brewed with 150 mL of boiling water for 30 min, and then filtered out with gauze to prepare samples to be immediately evaluated by the panel. Each chrysanthemum tea sample was triplicated and randomly coded at room temperature, and each sensory participant tasted a total of 15 tea samples. Each sensory participant scored the chrysanthemum tea samples for aroma, astringent sensation, and three taste characteristics (bitterness, umami, and sweetness). The intensity of the sensory attributes was scored on a six-point scale from “0” (unobservable) to “5” (the strongest observable) [19,20]. Still pure water was used as a neutralizer between the chrysanthemum tea samples. All participants signed a written informed consent form to participate in this study before the evaluation, and the sensory panels did not communicate with each other during the whole sensory evaluation.

2.3. Electronic Tongue Analysis for Chrysanthemum Tea Samples

The taste attributes of the five different varieties of chrysanthemum tea were determined using a TS-sa402b electronic tongue system (Intelligent Sensor Technology Co., Ltd., Atsugi, Japan) with wide-area selection-specific artificial lipid membrane sensors. The changes in the membrane potential caused by electrostatic interactions or hydrophobic interactions between various flavor substances and artificial lipid membranes were detected to evaluate the eight sensory attributes (saltiness, bitterness, sourness, umami, umami aftertaste, astringency, bitter aftertaste, and astringency aftertaste) of each sample. The taste sensory index data in the samples to be tested were calculated according to the absolute value of the lipid membrane potential of each artificial sensor on the basis of the potential of the solution, in which the output value of the reference solution is called the tasteless point. In this study, as shown by the tasteless blank sample, the tasteless points for different taste components were 0, and values higher than these tasteless points were considered to be meaningful. Specifically, the (2.00 ± 0.05 g) chrysanthemum tea sample was accurately weighed and brewed with 150 mL of boiling water for 30 min. Then, the tea broth was filtered through 3 layers of gauze to obtain the sample to be cooled to room temperature before being detected by the TS-sa402b electronic tongue system. In this study, each sample was cycled 4 times, and the mean values of the last three cycles were used for the statistical analysis and analyzed using TS-sa402b library search software (Intelligent Sensor Technology Co., Ltd., Atsugi, Japan). Data collected by the electronic tongue were calculated according to the formula as described. In order to ensure that the sensors were working in the correct mV range, each sensor was checked before measurement, according to the manufacturer’s instructions.

2.4. HPLC Analysis for Chrysanthemum Tea Samples

All chrysanthemum tea samples were ground separately into 100-mesh-size fine powders. A 25 ± 0.01 mg sample of each chrysanthemum tea was extracted using ultrasonic extraction (power: 300 W, frequency: 45 kHz) (SB-5200DTD; Scientz, Ningbo, China) with 25 mL of ultrapure water at room temperature for 40 min. The available range for extraction temperature was from 0 to 80 °C. After ultrasonic extraction, the sample was centrifuged at 3000 rpm for 10 min to collect the supernatant. Subsequently, the sample was shaken and filtered to obtain the filtrate through a 0.22 μm microfiltration membrane before HPLC analysis.
The contents of chlorogenic acid, luteolin, and 3,5-O-dicaffeyl quinin acid in the chrysanthemum tea samples were analyzed using a high-performance liquid chromatography (HPLC) analytical method, following the Pharmacopoeia of the People’s Republic of China. The HPLC system had pumps and an autosampler (Agilent 1260 Infinity II Prime liquid chromatography system, Agilent Technologies, Inc., Palo Alto, CA, USA). An HPLC column (250 × 4.6 mm, 5 μm particle size, Welch Technologies, Shanghai, China) was used. An auto-injector injected 10 μL of the test solution into the HPLC system, and the flow rate was 1.0 mL/min. The mobile phase consisted of mobile phase A [H2O containing 0.05% (v/v) phosphoric acid] and mobile phase B [0.1% (v/v) acetonitrile]. Additionally, the gradient elution was as follows: 0–11 min, the gradient of phase B increased from 10% to 18%, 11–30 min, the gradient of phase B increased to 20%, 30–40 min, the gradient of phase B was maintained at 20% for 10 min, 40–45 min, the gradient of phase B continued to rise to 95%, 45–60 min, and the gradient of phase B was maintained at 90% for 15 min. Furthermore, samples (10 μL) were eluted at 0.8–1.0 mL/min, and the column oven was kept at 30 °C. The HPLC chromatograms of the five different varieties of chrysanthemum tea can be found in the Supplementary Materials (Figure S1).

2.5. Measurement of Total Polyphenols and Total Flavonoids in Chrysanthemum Tea

To determine total polyphenols and total flavonoids, 3.0 ± 0.01 g of each chrysanthemum tea powder sample was mixed with 120 mL of distilled water in a 250 mL round-bottomed flask and extracted at 90 °C for 40 min in a water bath. After extraction, each extracted solution was centrifuged at 5000 r/min for 5 min, concentrated at 65 °C under reduced pressure for 1 h, and then freeze-dried. After drying, the extracted powder was stored immediately at −20 °C for future analysis. The total polyphenol contents of the chrysanthemum tea samples were measured according to the Folin-Denis method. Briefly, 0.01 g of each extracted chrysanthemum tea powder was mixed with 1.0 mL of Folin-Ciocâlteu reagent (1.0 mol/L) and reacted at room temperature for 1 min. Then, 8 mL of 10% sodium carbonate (100 g/L) was mixed well, and the mixture was left in a dark place for 2 h. The absorbance was measured at 760 nm using a spectrophotometer (UV-1700, Shimadzu, Kyoto, Japan). The results were expressed as milligrams of gallic acid equivalents per gram of dry matter (mg GAE/g), using gallic acid as a reference standard. The total flavonoid contents of the chrysanthemum tea samples were determined according to the aluminum chloride complex formation method and expressed as milligrams of rutin equivalents per gram of extracted chrysanthemum tea powder in dry weight (mg RE/g).

2.6. LC-MS/MS-Based Untargeted Metabolomics Analysis

The chrysanthemum tea samples (80 ± 0.1 mg) were immediately frozen in liquid nitrogen and ground into fine powder with a mortar and pestle. Then, 1000 μL of methanol/acetonitrile/H2O (2:2:1, v/v/v) was added to the homogenized solution for metabolite extraction. The mixture was centrifuged for 20 min (14,000× g, 4 °C). The supernatant was dried in a vacuum centrifuge. For LC-MS analysis, the samples were re-dissolved in 100 μL of acetonitrile/water (1:1, v/v) as a solvent and centrifuged at 14,000× g and 4 °C for 15 min, after which the supernatant was injected. The untargeted metabolomics analysis of the chrysanthemum tea samples was performed using a UHPLC system (1290 Infinity LC, Agilent Technologies, Santa Clara, CA, USA) equipped with a binary pump and a C18 column (2.1 mm × 100 mm, i.d., 1.8 μm, Agilent) operated at 40 °C. Mobile phase A consisted of 25 mmol L ammonium acetate and 0.5% formic acid in water, and mobile phase B was methanol. Additionally, the gradient elution was as follows: 0–0.5 min, 5% B; then B changed to 100% linearly from 0.5 to 10 min; 10–12.0 min, B was maintained at 100%; from 12.0 to 12.1 min, B changed linearly from 100% to 5%; 12.1–16 min, B was maintained at 5%. The sample was placed in an automatic sampler at 4 °C during the analysis. The separated components were then detected with a quadrupole time-of-flight device (AB Sciex TripleTOF 6600, Shanghai Applied Protein Technology Co., Ltd., Shanghai, China). To avoid the effects of instrument fluctuations, a random sequence was used to analyze the samples. QC samples were inserted into the sample queue to monitor and evaluate the stability and reliability of the data.
The ESI source parameters were set as follows: ion source gas 1 (Gas1) as 60, ion source gas 2 (Gas2) as 60, curtain gas (CUR) as 30, source temperature 600 °C, ion spray voltage floating (ISVF) ± 5500 V. In MS-only acquisition, the instrument was set to acquire over the m/z range 60–1000 Da, and the accumulation time for the TOF MS scan was set to 0.20 s/spectrum. In auto MS/MS acquisition, the instrument was set to acquire over the m/z range 25–1000 Da, and the accumulation time for the product ion scan was set to 0.05 s/spectrum. Moreover, the product ion scan was acquired using information-dependent acquisition (IDA), with high-sensitivity mode selected. The parameters were set as follows: the collision energy (CE) was fixed at 35 V with ±15 eV; the declustering potential (DP) was 60 V (+) and −60 V (−); we excluded isotopes within 4 Da; 10 candidate ions were monitored per cycle.

2.7. Metabolomics Data Acquisition and Analysis

The TIC diagram in the ESI-positive and -negative modes for the five different varieties of chrysanthemum tea is shown in Figure S2. The raw MS data were converted to MzXML files using ProteoWizard MSConvert before importing them into the freely available XCMS plus software (https://sciex.com/cl/products/software/xcms-plus-software, accessed on 12 March 2024) (Sciex, Framingham, MA, USA). For peak picking, the following parameters were used: centWave m/z = 10 ppm, peak width = c (10, 60), prefilter = c (10, 100). For peak grouping, bw = 5, mzwid = 0.025, minfrac = 0.5 were used. The R-package CAMERA (Collection of Algorithms for MEtabolite pRofile Annotation) was used for annotating isotopes and adducts. In the extracted ion features, only the variables with more than 50% of the nonzero measurement values in at least one group were kept. Compound identification of metabolites was performed by comparing the accuracy of m/z values (<10 ppm) and MS/MS spectra with an in-house database established with available authentic standards.
After normalizing to total peak intensity, the processed data were analyzed using an R package (ropls), where they were subjected to multivariate data analysis, including Pareto-scaled principal component analysis (PCA) and orthogonal partial least squares discriminant analysis (OPLS-DA). The 7-fold cross-validation and response permutation testing were used to evaluate the robustness of the model. Furthermore, the variable importance in projection (VIP) value of each variable in the OPLS-DA model was calculated to indicate its contribution to the classification. In this study, metabolites with VIP values > 1.0 were further subjected to Student’s t-test (p-value < 0.05) at the univariate level to measure the significance of each metabolite.

2.8. Bioinformatics Analysis

The statistically significant differences in metabolites among the varieties of chrysanthemum tea (VIP values > 1 in the OPLS-DA model and p < 0.05) were screened for bioinformatics analysis, including hierarchical clustering analysis, correlation analysis and pathway analysis. The hierarchical clustering analysis was also carried out using TBtools software V2.2030 (TBtools, Guangzhou, China). Moreover, the differentially expressed metabolites were matched against the Kyoto Encyclopedia of Genes and Genomes (KEGG) database by the KEGG Automatic Annotation Server (KAAS; website: https://www.genome.jp/tools/kaas/, accessed on 30 July 2023). Values of p < 0.05 in Fisher’s exact test were considered statistically significant.

2.9. Statistical Analysis

Each experiment was conducted in triplicate, and the results are presented as the mean ± standard deviation. The multiple comparisons of the five varieties of chrysanthemum tea groups were calculated by one-way analysis of variance (ANOVA) with Duncan’s test for Statistics 25.0 software (IBM, Chicago, IL, USA). The hierarchical clustering analysis was carried out using TBtools software (TBtools, Guangzhou, China). SIMCA-P 14.1 multivariate statistical software (Umetrics, Umea, Sweden) was specifically used for radar plot generation, PCA, OPLS-DA, and other graphical presentations.

3. Results and Discussion

3.1. Sensory Quality of the Five Different Varieties of Chrysanthemum Tea

The differences in sensory attributes of the five different varieties of chrysanthemum tea were detected by the electronic tongue system. As shown in Table 1, the astringency, bitterness, and umami of the five different varieties of chrysanthemum tea were significantly higher than the tasteless point (p < 0.05). Therefore, the astringency, bitterness, and umami indices could be used as effective sensory indices for the five chrysanthemum tea varieties. As a unique-scented tea health drink, chrysanthemum tea has gradually entered the field of view of more consumers. However, chrysanthemum tea has astringency, which cannot provide some consumers with oral pleasure, resulting in the low market recognition of simple chrysanthemum tea products [15]. It is worth noting that astringent sensation is an important sensory perception of chrysanthemum tea, with hydrolyzed and concentrated tannins responsible for this property [21]. Moreover, astringent sensation, one of the most complex oral sensations, is an important essential affecting the sensory quality of food, tea, and other beverages [22]. The astringency index of the HuangJu sample (X) was significantly higher than that of the other three species except for the BaoJu sample (B) (p < 0.05). Meanwhile, the umami aftertaste of the HuangJu sample (X) was also significantly higher than that of the other four varieties of chrysanthemum tea (p < 0.05). In fact, astringent sensation is not a basic taste but, rather, a feeling of convergence caused by the coagulation of proteins in the oral mucosa, which is the result of stimulating the oral nerve endings [22]. Notably, this dry, wrinkled taste occurs when drinking tea or consuming g other foods containing polyphenols.
In addition, the three taste qualities (including bitterness, umami, and sweetness), astringency, and aroma intensity of the five different varieties of chrysanthemum tea were quantified using a sensory evaluation panel consisting of ten trained individuals (Table 2). The results showed no significant differences in umami taste among the five different varieties of chrysanthemum tea (p < 0.05), while the astringency, bitterness, and aroma of “HuangJu” (X) were significantly (p < 0.05) higher than those of the other four species of chrysanthemum. Additionally, the results of sensory evaluation also showed that astringency and bitterness could be used as effective sensory attributes of chrysanthemum tea. The astringent sensation is mainly caused by the precipitation or aggregation of polyphenols associated with proteins in saliva. In fact, chlorogenic acid and other phenolic acids are easily soluble in chrysanthemum tea brewing, thus enhancing acidity and influencing the tasting process of other polyphenols [16]. Therefore, further analysis of the main active compounds and untargeted metabolomics analysis of the five different varieties of chrysanthemum tea were carried out.

3.2. Comparison of the Contents of Main Active Compounds

Flavonoids are phenolic compounds that are widely present in chrysanthemum tea. As shown in Table 3, among the five different varieties of chrysanthemum tea, both total polyphenols and total flavonoids had the highest concentrations in HuangJu (X), which were 58.91 ± 0.02 mg GAE/g dw and 201.07 ± 0.05 mg RE/g dw, respectively, significantly higher than in the other four kinds of chrysanthemum tea (p < 0.05). In contrast, the lowest content of phenolic acids was found in BaoJu (B), which was significantly lower than that of the other four chrysanthemum teas (p < 0.05). According to Table 2 and Table 3, the results also confirmed that the contents of flavonoids and polyphenols were positively correlated with bitterness and astringent sensation. In fact, chlorogenic acid, luteolin, isochlorogenic acid, and other phenolic acids are the major components of chrysanthemum tea [23]. Phenolic acids are responsible for chrysanthemum tea’s distinctive color and taste, and the bioactive components contribute to its antibacterial, antiviral, antioxidant, antihypertension, and hypolipidemic activities [24]. Notably, the astringent sensation produced by drinking chrysanthemum tea is caused by the polyphenol–protein complex reaction [25]. HuangJu (X) had the highest contents of three phenolic acids and astringent sensation, indicating that the major bioactive substances in the five varieties of chrysanthemum tea showed highly comparable curves with the sensory quality data. In fact, due to these differences in variety and origin, HuangJu (X) may be quite different from other types of chrysanthemum tea in terms of chemical compounds and sensory characteristics. Hence, follow-up untargeted metabolomics analysis was conducted to provide in-depth information regarding the relationships between the characteristic metabolites and sensory qualities of chrysanthemum tea by identifying metabolites in five different varieties.

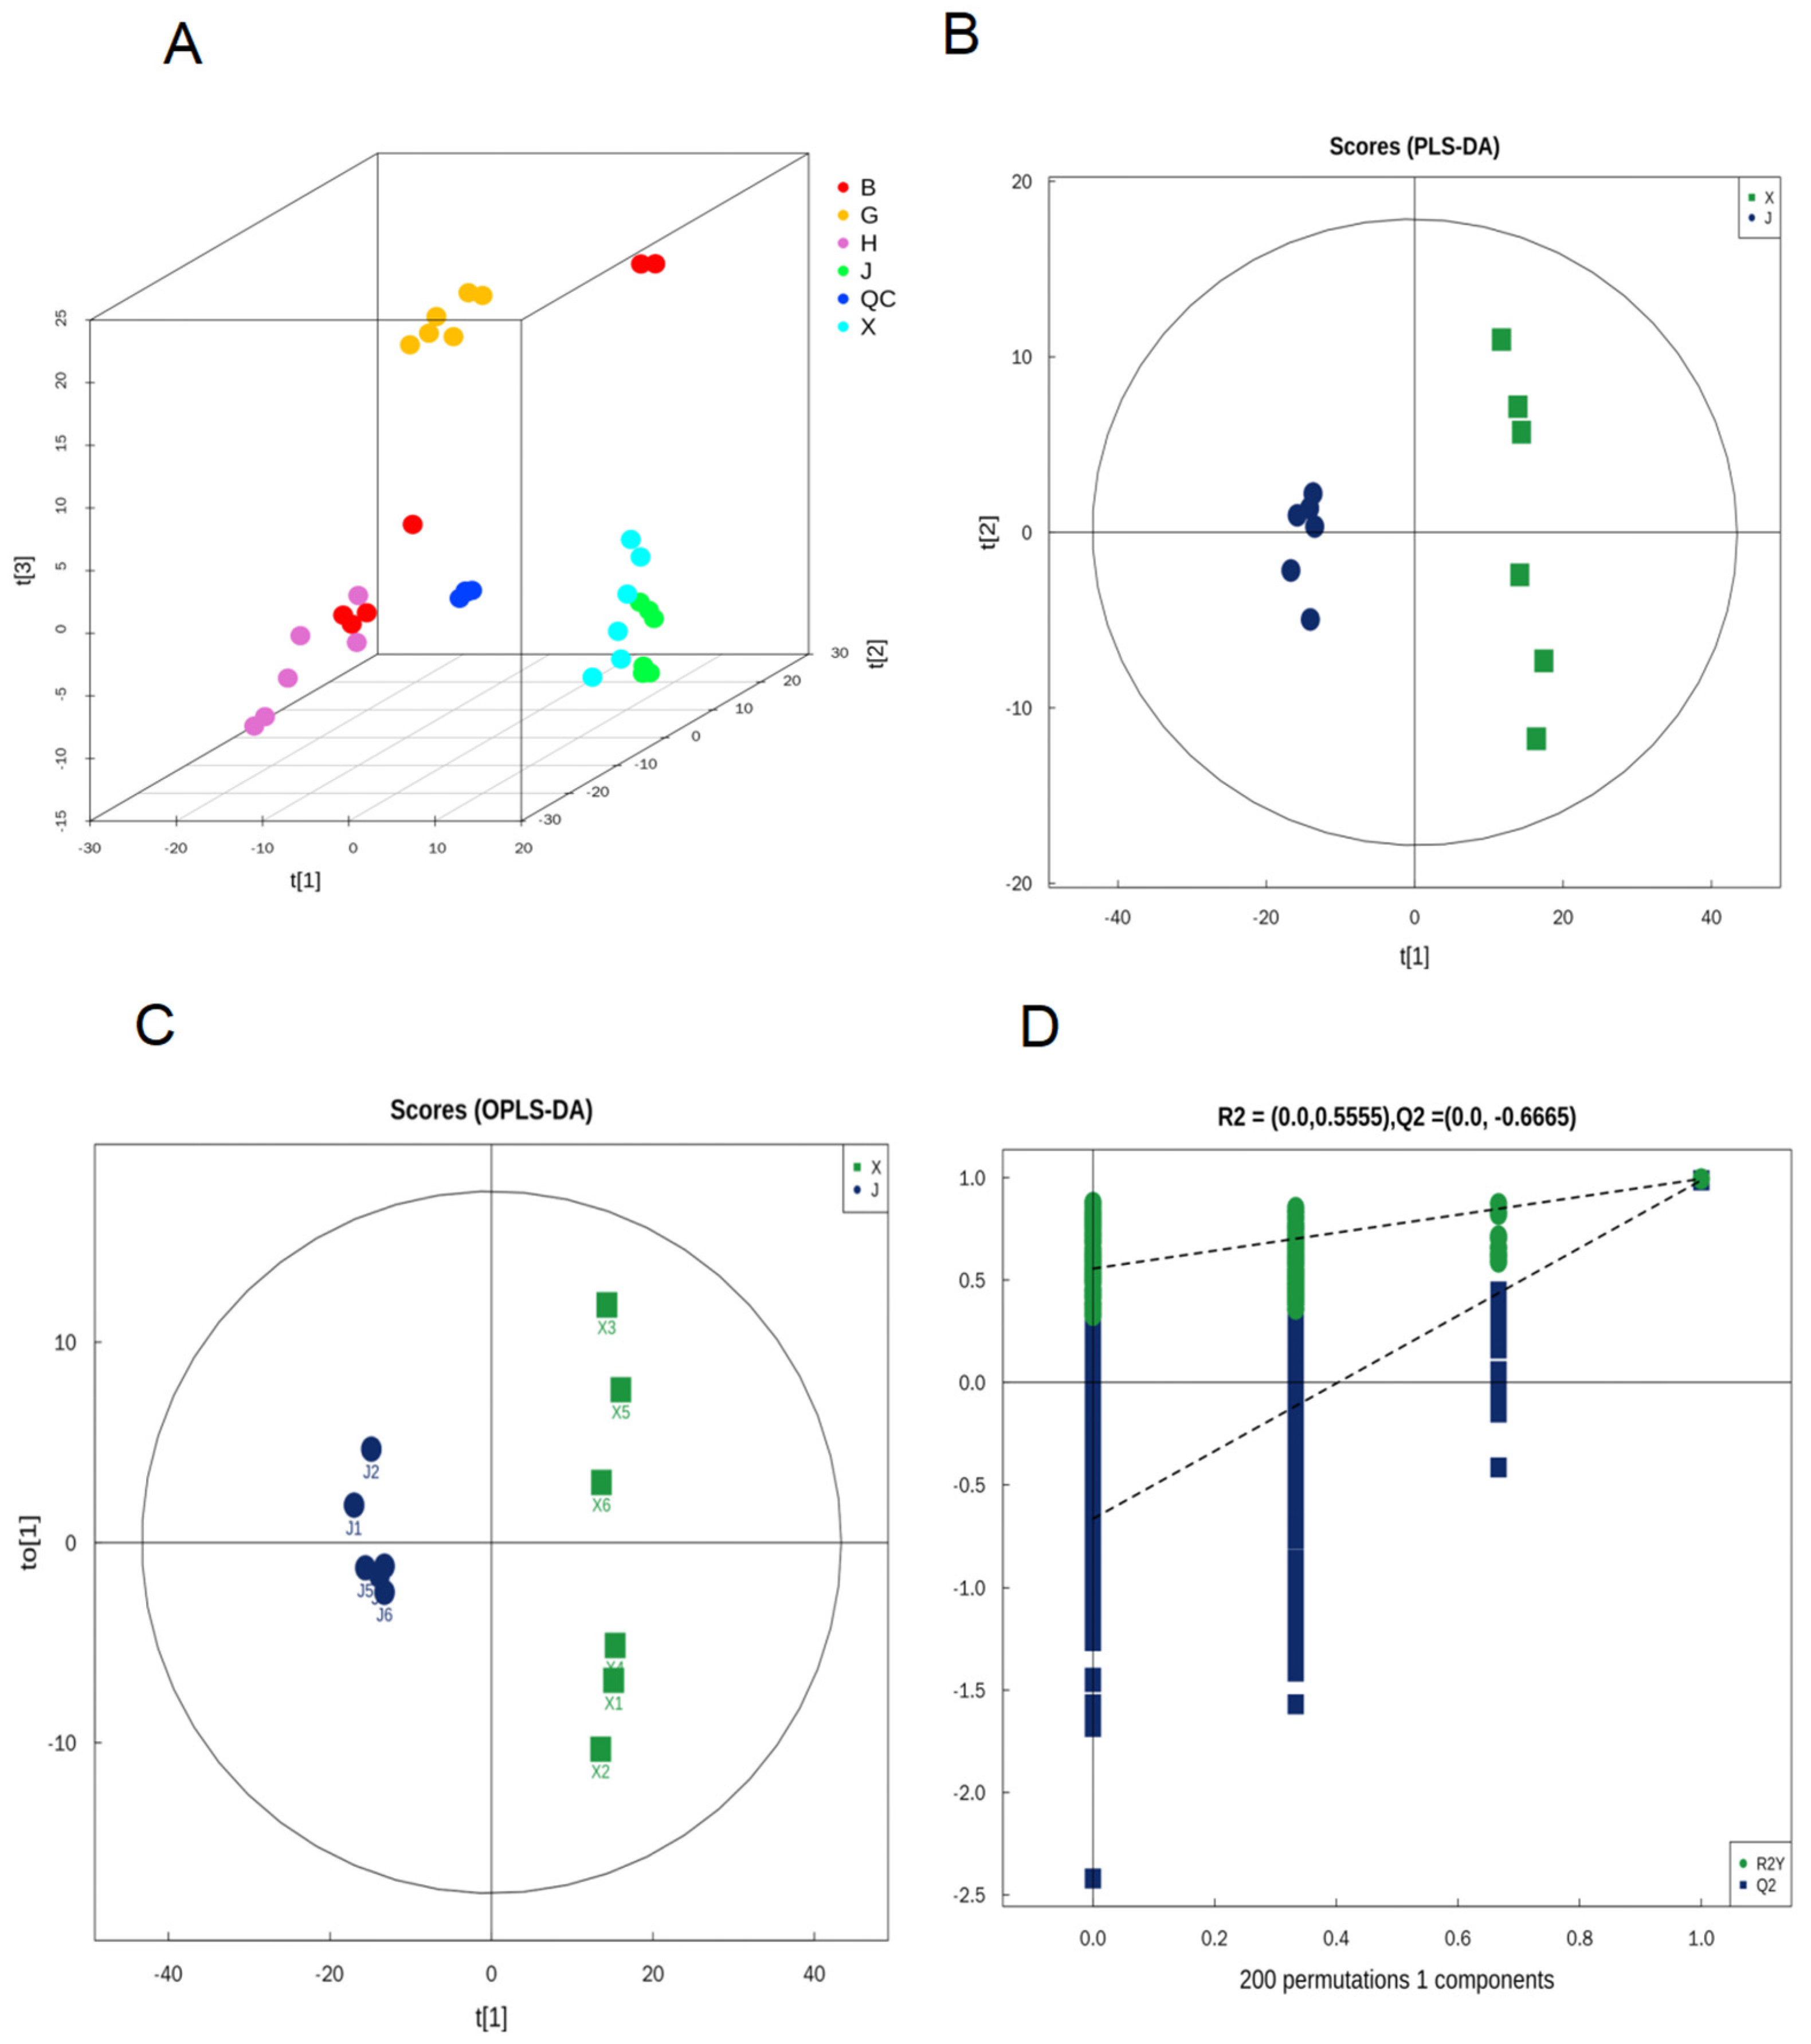
3.3. Untargeted Metabolomics Analysis

Untargeted metabolomics combined with multivariate analysis was applied to investigate the differences in metabolites between the five varieties of chrysanthemum tea, and to identify critical metabolites responsible for metabolomic variations caused by different varieties of chrysanthemum tea. This study identified metabolites in chrysanthemum tea samples according to the in-house database (Shanghai Applied Protein Technology, Shanghai, China) [26]. After pre-treatment and data normalization, 1105 and 670 metabolites were identified from the total ion chromatogram of UPLC-QTOF-MS in positive and negative ion modes, respectively. According to their chemical taxonomy, all metabolites (identified by combining positive and negative ions) were classified and performed on the attribution information. The proportions of the various metabolites are shown in Figure 2, including 473 lipids and lipid-like molecules (25.918%), 361 phenylpropanoids and polyketides (19.781%), 184 organoheterocyclic compounds (10.082%), 173 benzenoids (9.479%), 148 organic oxygen compounds (8.11%), 109 organic acids and derivatives (5.973%), 40 alkaloids and derivatives (2.192%), 32 nucleosides and analogs (1.753%), 26 lignans, neolignans, and related compounds (1.425%), 21 organic nitrogen compounds (1.151%), 1 hydrocarbon derivative (0.055%), and 257 other undefined compounds (14.082%).
The principal component analysis (PCA), partial least squares discriminant analysis (PLS-DA), and orthogonal projections to latent structures discriminant analysis (OPLS-DA) methods have been used to identify combinations of metabolites accounting for the most variance, and to visualize sample cluster trends in tea [27]. All metabolites were subjected to multivariate analysis using SIMCA-P 14.1 multivariate statistical software. As an unsupervised data analysis method, the PCA can reflect variability between and within sample groups. As shown in Figure 3A, when using all of the data on the metabolite ion features of five chrysanthemum tea samples, the QCs were clustered together on the PCA score plots, which revealed that the data variability was small. It is noteworthy that the X (“HuangJu”) and J (“JinshihuangJu”) chrysanthemum tea samples were similar in the PCA but were separated in PLS-DA (Figure 3A,B). In addition, these two kinds of chrysanthemum tea samples are from the same origin in Yongzhou, Hunan Province. Therefore, to obtain a higher level of population separation and better understand the differences between different varieties of chrysanthemum tea, OPLS-DA was used for classification and to confirm the separation between the “JinshihuangJu” (J) and “HuangJu” (X) tea samples in terms of the various significant parameters. Based on OPLS-DA, the separation trends between J and X samples showed more obvious variations (Figure 3C), and the cross-validation with 200 permutation tests indicated that this OPLS-DA model was reliable, with the intercepts of R2 and Q2 being 0.5555 and −0.6665, respectively (Figure 3D). Differential metabolites of J and X samples were found by OPLS-DA, and variable importance in projection (VIP > 1, p < 0.01) and |log2 (fold change)| values > 1.5 were used for screening. In both positive and negative ion modes, 143 VIP metabolites were responsible for metabolic changes between the J and X samples, including 13 metabolites, 40 flavonoids and flavone glycosides, 31 acids, 22 ketones, 8 esters, 7 amino acids, 7 glycosides, 6 alkaloids, 6 alcohols, and 16 other metabolites. (Table S1).
A multiple analysis was applied to visualize the differences in these critical metabolites between the “JingshihuangJu” (J) and “HuangJu” (X) samples (Figure 4). The x-coordinate represents the log2 FC value of the differential metabolite, and each row represents a critical metabolite. The red and green bar charts correspond to differential metabolites up and down, visually showing the changes in the multiple metabolic differences identified as significant.
Polyphenols are phytonutrients, the most abundant contents in chrysanthemum tea, containing flavonoids, phenolic acids, lignans, and stilbenes [3]. Isochlorogenic acid C, luteolin, apigenin-7-glucoside, chlorogenic acid, apigenin, and cryptochlorogenic acid play important roles in distinguishing different chrysanthemum varieties [11]. According to Figure 4, the most abundant marker metabolites in J and X samples were flavonoids and flavone glycosides. For example, the abundance of thunalbene, isoschaftoside, delphinidin 3-glucoside, primeverin, genistein, astragalin, bracteatin, maritimein, apigenin, kaempferol, luteolin, naringenin-7-O-glucoside, apigenin-7-O-glucoside, apigenin-7-O-glucuronide, naringenin, orientin, luteolin-7-O-glucoside, baicalinEriodictyol-7-O-glucoside, and quercetin 3-O-sophoroside was upregulated, while the contents of kaempferol-3,7-O-bis-alpha-L-rhamnoside, rutarensin, violanthin, luteolin 7-O-rutinoside,3′,5-dneohesperidoside, chrysosplenetin, acacetin-7-O-rutinoside, jaceidin, 5,7,3′,4′-tetrahydroxy-6,8-dimethoxyflavone, vitexin, cirsimaritin, and eupatilin were downregulated. In fact, flavonoids and flavonoid glycosides play a central role in all aspects of plant life, particularly in the interactions between the plant and the environment, and determine taste and biological activity [13]. The flavonoid glycoside is an important astringency compound in chrysanthemum teas, with a velvety taste and an oral coating sensation [16]. In this study, the data of untargeted metabolomics analysis showed a correlation with the taste index of the electronic tongue analysis, where the luteolin and apigenin had the highest contributions to the differences between these chrysanthemum teas, as indicated by high VIP values, which were responsible for tea infusion’s bitterness and astringency [28]. Moreover, the abundance of luteolin and apigenin in X (“HuangJu”) samples was significantly different that in J (“JinshihuangJu”) samples (Figure 4, p < 0.01). Thus, the degradation of flavonols and flavonoids in different chrysanthemum varieties may play a crucial role in forming chrysanthemum tea’s flavor. In practice, chrysanthemum tea contains extraordinarily high levels of flavonoids that contribute to the tea’s health benefits and flavor characteristics [29]. In fact, phenolic compounds, such as flavonoids and isoflavonoids, are the focus of health research. However, many flavonoids and xenoflavones have bitterness and astringency, which are undesirable and unavoidable to consumers, hindering their use as bioactive substances in foods and beverages [30]. Understanding edible chrysanthemum’s “bitterness and astringency motif” might prevent the introduction of bitter taste and astringent sensation in the design of functional foods enriched in bioactive (iso)flavonoids. Therefore, improving the bioavailability and reducing the bitterness and astringency of chrysanthemum tea by modifying its flavonoids without affecting its sensory quality will be one of the directions of in-depth, comprehensive research in the future.

3.4. Identifying the Core Metabolites

Since different metabolites coordinate their biological functions, the KEGG pathway-based analysis would be helpful to further understand their biological function [31]. A KEGG analysis was conducted to correlate the core metabolites identified between X and J samples (Kyoto Encyclopedia of Genes and Genomes, http://www.kegg.jp/, accessed on 30 July 2023). The KEGG pathway enrichment analysis is based on the KEGG pathway as the unit and the metabolic pathways involved in this species or closely related species as the background. Fisher’s exact test was used to analyze and calculate the significance level of metabolite enrichment in each pathway to identify the metabolic and signal transduction pathways that were significantly affected. Additionally, the KEGG enrichment pathway map between X and J samples is shown in Figure 5A. Most of the identified metabolites were mainly related to flavone and flavonol biosynthesis, flavonoid biosynthesis, isoflavonoid biosynthesis, and other pathways identified by the KEGG enrichment analysis (p < 0.05). The important secondary metabolites, flavones, and flavonols were also detected in all chrysanthemum cultivars.
The flavonoid biosynthesis pathway has been extensively investigated in different chrysanthemum species [32]. Flavonols belong to polyphenols, which mainly exist as glycosides in chrysanthemum tea, contributing to the tea’s bioactivities, bitterness, and astringency [33]. Considering the detection of flavonoids in chrysanthemum and previous studies on flavonoid biosynthesis pathways [34], a hypothesized chrysanthemum biosynthesis pathway was detected for flavonoids and flavonols (Figure 5B). As shown in Figure 5B, this pathway includes the mutual synthesis and transformation of apigenin, luteolin, two flavonoid components (glycosides), and their derivatives, along with the mutual synthesis and transformation of kaempferol, quercetin, myricetin, three flavonol components, and their derivatives. At the same time, apigenin and kaempferol can also be synthesized and transformed through the flavonoid biosynthesis pathway. To facilitate the observation of the expression of different metabolites annotated in the KEGG metabolic pathway, heatmaps of the different metabolites in the flavone and flavonol biosynthesis pathways were plotted, as shown in Figure 5C. Furthermore, quinic acid, genistein, 5-O-caffeoylshikimic acid, luteolin, apigenin, kaempferol, and naringenin were found to be the top marker metabolites for X (“HuangJu”) samples, where they were significantly more abundant than in J (“JingshihuangJu”) samples. D-malate, tryptophan, L-(-)-3-phenyllactic acid, L-malic acid, and proline were found to be the top marker metabolites for J (“JinshihuangJu”) samples, where they were significantly abundant than in X (“HuangJu”) samples.
Numerous studies have shown that flavonols and flavones are key contributors to tea infusions’ astringency and bitterness and can also significantly enhance the bitterness of caffeine [35,36]. Therefore, to statistically calculate the relationship between core metabolite compounds and taste intensity, Spearman’s correlation analysis coefficient was utilized, as shown in Figure 5D. There was a significant correlation between sensory characteristics (astringency and bitterness) and some core metabolites. According to Figure 5D, 13 core metabolites were found for the first time that could be used as quick markers for the difference in taste between the X (“HuangJu”) and J (“JinshihuangJu”) chrysanthemum teas, including 5-O-caffeoylshikimic acid, apigenin, D-glucosamine, D-malate, genistein, kaempferol, L-(-)-3-phenyllactic acid, L-malic acid, luteolin, naringenin, proline, quinic acid, and tryptophan. The main astringency contributors with tight correlations were kaempferol, luteolin, genistein, and some quinic acid derivatives. As the more common taste characteristics of chrysanthemum tea, these key metabolites can form various flavonol glycosides with various sugar groups to bring an astringent and convergent taste to the tea [16]. Most noteworthy, astringency is a tactile sensation caused by the interaction of astringent substances (such as polyphenols) with salivary proteins, resulting in protein precipitation and decreased lubrication in the mouth. Saliva was proven to be an oxidative agent that leads to the formation of corresponding phenolic acids [37,38]. As important bitter and astringent compounds, phenolic acid derivatives dissolve easily during oral processing, thus enhancing acidity and affecting the taste of other polyphenols. Therefore, studies on the flavonol metabolism of chrysanthemum tea should take into consideration that the decomposition of flavonols starts in the oral cavity. Furthermore, L-(-)-3 phenyllactic acid and L-malic acid were found to be bitter compounds in chrysanthemum tea. Interestingly, these compounds are also associated with the umami flavor of chrysanthemum tea. Umami substances have been proposed in human sensory evaluation to inhibit the bitter taste of various chemicals [39]. However, bitterness and astringency are generally undesirable; still, they are important for providing the complex sensory perceptions of chrysanthemum teas. Therefore, all of these are essential tasting elements of a delicious drink. According to Table 1 and Table 2 there was no significant difference in umami taste between J (“JinshihuangJu”) samples and X (“HuangJu”) samples (p > 0.05). In contrast, they obviously differed in bitterness and astringency (p < 0.05). Metabolic pathway analysis (Figure 5A,B) showed significant differences in flavonoid metabolism levels between the two varieties of chrysanthemum tea, which may be the reason for the difference in taste quality between the two varieties. In fact, the taste of chrysanthemum tea is closely related to some core chemical constituents, as shown in Figure 5D, and forms sensory qualities. Therefore, this study advances our understanding of metabolic changes, bitter taste, and astringent sensation in different varieties of chrysanthemum tea, and these data provide a theoretical basis for the control of sensory qualities.

4. Conclusions

Chrysanthemum tea is rich in many secondary metabolites related to its sensory qualities. This study used an untargeted metabolomics and sensory evaluation method based on UPLC-QTOF-MS and an electronic tongue to investigate key differential metabolites associated with sensory quality differences among five chrysanthemum (Juhua) tea varieties. A total of 1775 metabolites were identified in five varieties of Chrysanthemum tea by using UPLC-Q-TOF/MS analysis. The PCA, PLS-DA, and OPLS-DA results indicated significant differences in metabolome between X (“HuangJu”) samples and J (“JinshihuangJu”) samples.
To the best of our knowledge, this is the first report to reveal key taste metabolites of chrysanthemum tea. Of these metabolites, the contents of 13 key taste metabolites could be used for the first time as quick markers of the differences in taste between the X (“HuangJu”) and J (“JinshihuangJu”) chrysanthemum teas. Kaempferol, luteolin, genistein, and some quinic acid derivatives were correlated with the “astringent” attributes, while l-(-)-3 phenyllactic acid and L-malic acid were found to be responsible for the “bitterness” and “umami” in chrysanthemum tea. Additionally, KEGG pathway enrichment analysis showed that there were significant differences in flavonoids’ metabolism levels between X (“HuangJu”) and J (“JinshihuangJu”) chrysanthemum tea samples, and the pathways involved in flavonoid metabolism had important effects on the sensory qualities of different chrysanthemum tea varieties. Notably, this study enriches our understanding of the relationships between the key metabolites and the bitterness and astringency of chrysanthemum tea varieties. Untargeted metabolomics combined with electronic tongue analysis based on LC-MS can be effectively used to evaluate the differences in the sensory qualities of different varieties of chrysanthemum tea cultivars, which is essential for improving the quality of the finished chrysanthemum tea and the effective utilization of edible chrysanthemum. Further studies are ongoing in the authors’ lab, focusing on the formation mechanism of the key flavor components and the functional components in chrysanthemum tea during oral processing. We hope to report more about these advancements in the future.

Supplementary Materials

The following supporting information can be downloaded at: https://www.mdpi.com/article/10.3390/foods13071080/s1, Figure S1: The HPLC chromatogram of the five different varieties of chrysanthemum tea; Figure S2: The TIC diagram in the ESI positive and negative modes for the five different varieties of chrysanthemum tea; Table S1: Contents of main bioactive substances of five different varieties of chrysanthemum tea; Table S2: Critical Compounds Metabolites Responsible for the Metabolomics Variation Caused between X and J Samples (VIP > 1, p < 0.01).

Author Contributions

X.T.: conceptualization, methodology, formal analysis, investigation, writing—original draft, writing—review and editing. H.W.: formal analysis, investigation, writing—original draft. W.W.: supervision, writing—review and editing, funding acquisition. H.Y.: methodology, conceptualization, data curation. L.C.: visualization, data curation. C.P.: supervision, writing—review and editing. All authors have read and agreed to the published version of the manuscript.

Funding

This study was supported by the “Project of Hunan Province Enterprise Science and Technology Commissioner Plan (2021–2022)” (Project No. 2021GK5087), “Hunan Natural Science Foundation Program” (Project No. 2023JJ30445), “Hunan Provincial Department of Education Outstanding Youth Project” (Project No. 22B0378), “The Central Government Guides Local Funds for Science and Technology Development Program” Project No. 2022ZYT029), and “Hunan University of Chinese Medicine ‘double first-class’ Construction Discipline open ranking” Program (Project No. 22JB2053). The authors thank Hunan Kangdejia Forestry Technology Co., Ltd. for providing the chrysanthemum raw materials.

Data Availability Statement

The original contributions presented in the study are included in the article/supplementary material, further inquiries can be directed to the corresponding author.

Conflicts of Interest

The authors declare no conflicts of interest.

Abbreviations

Liquid Chromatography-tandem Mass Spectrometry (LC-MS/MS); Mass Spectrometry (MS); High-Performance Liquid Chromatography (HPLC); False Discovery Rate (FDR); Principal Component Analysis (PCA); Kyoto Encyclopedia of Genes and Genomes (KEGG); Traditional Chinese medicine (TCM); Gas Chromatography-Mass Spectrography (GC-MS); Headspace-gas Chromatography-ion Mobility Spectrometry (HS-GC-IMS); Gas chromatography olfactometry (GC-O); Electron Spray Ionization (ESI).

References

  1. Li, Y.; Quan, H.; Liang, L.; Yang, T.; Feng, L.; Mao, X.; Wang, Y. Nontargeted metabolomics reveals the discrimination of Cyclocarya paliurus leaves brewed by different methods. Food Res. Int. 2021, 142, 110221. [Google Scholar] [CrossRef]
  2. Yuan, H.; Jiang, S.; Liu, Y.; Daniyal, M.; Jian, Y.; Peng, C.; Shen, J.; Liu, S.; Wang, W. The flower head of Chrysanthemum morifolium Ramat. (Juhua): A paradigm of flowers serving as Chinese dietary herbal medicine. J. Ethnopharmacol. 2020, 261, 113043. [Google Scholar] [CrossRef]
  3. Han, A.R.; Nam, B.; Kim, B.R.; Lee, K.C.; Song, B.S.; Kim, S.H.; Kim, J.B.; Jin, C.H. Phytochemical Composition and Antioxidant Activities of Two Different Color Chrysanthemum Flower Teas. Molecules 2019, 24, 329. [Google Scholar] [CrossRef] [PubMed]
  4. Jiang, S.; Wang, M.; Jiang, Z.; Zafar, S.; Xie, Q.; Yang, Y.; Liu, Y.; Yuan, H.; Jian, Y.; Wang, W. Chemistry and Pharmacological Activity of Sesquiterpenoids from the Chrysanthemum Genus. Molecules 2021, 26, 3038. [Google Scholar] [CrossRef] [PubMed]
  5. Xiang-Wei, C.; Dan-Dan, W.; Dong-Jie, C.; Hui, Y.; Xiao-Dong, S.; Wen-Bin, Z.; Jin-Ao, D. Historical Origin and Development of Medicinal and Tea Chrysanthemum morifolium Resources. Mod. Chin. Med. 2019, 1, 116–123. [Google Scholar] [CrossRef]
  6. Liao, Y.; Zhou, X.; Zeng, L. How does tea (Camellia sinensis) produce specialized metabolites which determine its unique quality and function: A review. Crit. Rev. Food Sci. Nutr. 2022, 62, 3751–3767. [Google Scholar] [CrossRef] [PubMed]
  7. Yang, L.; Cheng, P.; Wang, J.H.; Li, H. Analysis of Floral Volatile Components and Antioxidant Activity of Different Varieties of Chrysanthemum morifolium. Molecules 2017, 22, 1790. [Google Scholar] [CrossRef]
  8. Choi, H.; Kim, G. Volatile flavor composition of gamguk (Chrysanthemum indicum) flower essential oils. Food Sci. Biotechnol. 2011, 20, 319–325. [Google Scholar] [CrossRef]
  9. Wang, Z.; Yuan, Y.; Hong, B.; Zhao, X.; Gu, Z. Characteristic Volatile Fingerprints of Four Chrysanthemum Teas Determined by HS-GC-IMS. Molecules 2021, 26, 7113. [Google Scholar] [CrossRef]
  10. Kaneko, S.; Chen, J.; Wu, J.; Suzuki, Y.; Ma, L.; Kumazawa, K. Potent Odorants of Characteristic Floral/Sweet Odor in Chinese Chrysanthemum Flower Tea Infusion. J. Agric. Food Chem. 2017, 65, 10058–10063. [Google Scholar] [CrossRef]
  11. Wang, X.; Zhang, J.; Liu, Z.; Wang, S.; Huang, B.; Hu, Z.; Liu, Y. Comparative transcriptome analysis of three chrysanthemums provides insights into flavonoid and terpenoid biosynthesis. J. Plant Biol. 2021, 64, 389–401. [Google Scholar] [CrossRef]
  12. Sumner, L.W.; Mendes, P.; Dixon, R.A. Plant metabolomics: Large-scale phytochemistry in the functional genomics era. Phytochemistry 2003, 62, 817–836. [Google Scholar] [CrossRef] [PubMed]
  13. Zhao, J.; Liu, W.; Chen, Y.; Zhang, X.; Wang, X.; Wang, F.; Qian, Y.; Qiu, J. Identification of markers for tea authenticity assessment: Non-targeted metabolomics of highly similar oolong tea cultivars (Camellia sinensis var. sinensis). Food Control 2022, 142, 109223. [Google Scholar] [CrossRef]
  14. Phat, C.; Moon, B.; Lee, C. Evaluation of umami taste in mushroom extracts by chemical analysis, sensory evaluation, and an electronic tongue system. Food Chem. 2016, 192, 1068–1077. [Google Scholar] [CrossRef] [PubMed]
  15. Xing, T.; Hui-jie, Y.E.; Shi-feng, L.; Yao-li, O. Study on the interaction between the astringent constituents of different varieties of Chrysanthemum and saliva. Food Mach. 2022, 4, 42–46. [Google Scholar] [CrossRef]
  16. Zhang, L.; Cao, Q.; Granato, D.; Xu, Y.; Ho, C. Association between chemistry and taste of tea: A review. Trends Food Sci. Technol. 2020, 101, 139–149. [Google Scholar] [CrossRef]
  17. Li, J.; Wang, J.; Yao, Y.; Hua, J.; Zhou, Q.; Jiang, Y.; Deng, Y.; Yang, Y.; Wang, J.; Yuan, H.; et al. Phytochemical comparison of different tea (Camellia sinensis) cultivars and its association with sensory quality of finished tea. LWT 2020, 117, 108595. [Google Scholar] [CrossRef]
  18. GB/T 23776-2018; Methodology for Sensory Evaluation of Tea. Standardization Administration of China: Beijing, China, 2018. Available online: http://down.foodmate.net/standard/sort/3/52614.html (accessed on 2 February 2024).
  19. Cheng, L.; Yang, Q.; Chen, Z.; Zhang, J.; Chen, Q.; Wang, Y.; Wei, X. Distinct Changes of Metabolic Profile and Sensory Quality during Qingzhuan Tea Processing Revealed by LC-MS-Based Metabolomics. J. Agric. Food Chem. 2020, 68, 4955–4965. [Google Scholar] [CrossRef] [PubMed]
  20. Cheng, L.; Yang, Q.; Peng, L.; Xu, L.; Chen, C.J.; Zhu, Y.; Wei, X. Exploring core functional fungi driving the metabolic conversion in the industrial pile fermentation of Qingzhuan tea. Food Res. Int. 2024, 178, 113979. [Google Scholar] [CrossRef]
  21. Granato, D.; Grevink, R.; Zielinski, A.A.F.; Nunes, D.S.; van Ruth, S.M. Analytical Strategy Coupled with Response Surface Methodology to Maximize the Extraction of Antioxidants from Ternary Mixtures of Green, Yellow, and Red Teas (Camellia sinensis var. sinensis). J. Agric. Food Chem. 2014, 62, 10283–10296. [Google Scholar] [CrossRef]
  22. Rudge, R.E.D.; Fuhrmann, P.L.; Scheermeijer, R.; van der Zanden, E.M.; Dijksman, J.A.; Scholten, E. A tribological approach to astringency perception and astringency prevention. Food Hydrocoll. 2021, 121, 106951. [Google Scholar] [CrossRef]
  23. Yuan, H.; Luo, J.; Lyu, M.; Jiang, S.; Qiu, Y.; Tian, X.; Liu, L.; Liu, S.; Ouyang, Y.; Wang, W. An integrated approach to Q-marker discovery and quality assessment of edible Chrysanthemum flowers based on chromatogram–effect relationship and bioinformatics analyses. Ind. Crop. Prod. 2022, 188, 115745. [Google Scholar] [CrossRef]
  24. Gibbins, H.L.; Carpenter, G.H. Alternative Mechanisms of Astringency—What is the Role of Saliva. J. Texture Stud. 2013, 44, 364–375. [Google Scholar] [CrossRef]
  25. Ma, S.; Lee, H.; Liang, Y.; Zhou, F. Astringent Mouthfeel as a Consequence of Lubrication Failure. Angew. Chem. (Int. Ed. Engl.) 2016, 55, 5793–5797. [Google Scholar] [CrossRef] [PubMed]
  26. Luo, D.; Deng, T.; Yuan, W.; Deng, H.; Jin, M. Plasma metabolomic study in Chinese patients with wet age-related macular degeneration. BMC Ophthalmol. 2017, 17, 165. [Google Scholar] [CrossRef] [PubMed]
  27. Fraser, K.; Lane, G.A.; Otter, D.E.; Hemar, Y.; Quek, S.; Harrison, S.J.; Rasmussen, S. Analysis of metabolic markers of tea origin by UHPLC and high resolution mass spectrometry. Tea—From bushes to mugs: Composition, stability and health aspects. Food Res. Int. 2013, 53, 827–835. [Google Scholar] [CrossRef]
  28. Yang, C.; Hu, Z.; Lu, M.; Li, P.; Tan, J.; Chen, M.; Lv, H.; Zhu, Y.; Zhang, Y.; Guo, L.; et al. Application of metabolomics profiling in the analysis of metabolites and taste quality in different subtypes of white tea. Food Res. Int. 2018, 106, 909–919. [Google Scholar] [CrossRef] [PubMed]
  29. Lin, N.; Liu, X.; Zhu, W.; Cheng, X.; Wang, X.; Wan, X.; Liu, L. Ambient Ultraviolet B Signal Modulates Tea Flavor Characteristics via Shifting a Metabolic Flux in Flavonoid Biosynthesis. J. Agric. Food Chem. 2021, 69, 3401–3414. [Google Scholar] [CrossRef] [PubMed]
  30. Roland, W.S.U.; van Buren, L.; Gruppen, H.; Driesse, M.; Gouka, R.J.; Smit, G.; Vincken, J. Bitter Taste Receptor Activation by Flavonoids and Isoflavonoids: Modeled Structural Requirements for Activation of hTAS2R14 and hTAS2R39. J. Agric. Food Chem. 2013, 61, 10454–10466. [Google Scholar] [CrossRef]
  31. Nakaya, A.; Katayama, T.; Itoh, M.; Hiranuka, K.; Kawashima, S.; Moriya, Y.; Okuda, S.; Tanaka, M.; Tokimatsu, T.; Yamanishi, Y.; et al. KEGG OC: A large-scale automatic construction of taxonomy-based ortholog clusters. Nucleic Acids Res. 2013, 41, D353–D357. [Google Scholar] [CrossRef]
  32. Hodaei, M.; Rahimmalek, M.; Arzani, A.; Talebi, M. The effect of water stress on phytochemical accumulation, bioactive compounds and expression of key genes involved in flavonoid biosynthesis in Chrysanthemum morifolium L. Ind. Crop. Prod. 2018, 120, 295–304. [Google Scholar] [CrossRef]
  33. Li, Q.; Jin, Y.; Jiang, R.; Xu, Y.; Zhang, Y.; Luo, Y.; Huang, J.; Wang, K.; Liu, Z. Dynamic changes in the metabolite profile and taste characteristics of Fu brick tea during the manufacturing process. Food Chem. 2021, 344, 128576. [Google Scholar] [CrossRef]
  34. Falcone Ferreyra, M.L.; Rius, S.P.; Casati, P. Flavonoids: Biosynthesis, biological functions, and biotechnological applications. Front. Plant Sci. 2012, 3, 222. [Google Scholar] [CrossRef] [PubMed]
  35. Cao, Q.Q.; Zou, C.; Zhang, Y.H.; Du, Q.Z.; Yin, J.F.; Shi, J.; Xue, S.; Xu, Y.Q. Improving the taste of autumn green tea with tannase. Food Chem. 2019, 277, 432–437. [Google Scholar] [CrossRef] [PubMed]
  36. Liu, W.; Feng, Y.; Yu, S.; Fan, Z.; Li, X.; Li, J.; Yin, H. The Flavonoid Biosynthesis Network in Plants. Int. J. Mol. Sci. 2021, 22, 12824. [Google Scholar] [CrossRef] [PubMed]
  37. Malgorzata, R.; Magdalena, B. Decomposition of Flavonols in the Presence of Saliva. Appl. Sci. 2020, 10, 7511. [Google Scholar] [CrossRef]
  38. Yuan, J.; Huang, J.; Wu, G.; Tong, J.; Xie, G.; Duan, J.; Qin, M. Multiple responses optimization of ultrasonic-assisted extraction by response surface methodology (RSM) for rapid analysis of bioactive compounds in the flower head of Chrysanthemum morifolium Ramat. Industrial Crops and Products. Ind. Crop. Prod. 2015, 74, 192–199. [Google Scholar] [CrossRef]
  39. Kim, M.; Son, H.; Kim, Y.; Misaka, T.; Rhyu, M. Umami–bitter interactions: The suppression of bitterness by umami peptides via human bitter taste receptor, Biochem. Biophys. Res. Commun. 2015, 456, 586–590. [Google Scholar] [CrossRef]
Figure 1. Appearance and origin of five different species of chrysanthemum. Notes: (J) JinshihuangJu; (X) HuangJu; (H) HanbaiJu; (B) BaoJu; (G) GongJu; (F) diagram of the source of five different varieties of chrysanthemum tea.
Foods 13 01080 g001
Figure 2. The proportions of the various metabolites in chrysanthemum tea samples. Notes: Different color blocks represent items belonging to different chemical classifications, and the percentage represents the items belonging to each chemical classification. The number of metabolites is given as a percentage of all identified metabolites. Metabolites that have no chemical classification are defined as undefined.
Foods 13 01080 g002
Figure 3. Multivariate analysis of chrysanthemum tea samples: (A) The 3D PCA of five different species of chrysanthemum. (B) The PLS-DA plot (X vs. J), R2X = 0.751, R2Y = 0.994, Q2 = 0.979. (C) The OPLS-DA score plot (X vs. J), R2X = 0.753, R2Y = 0.994, Q2 = 0.987. (D) Permutation plot of OPLS-DA, R2 = (0.0, 0.5555), Q2 = (0.0, − 0.6665). Notes: (J) JinshihuangJu; (X) HuangJu; (H) HanbaiJu; (B) BaoJu; (G) GongJu.
Foods 13 01080 g003
Figure 4. Multiple analysis of significant differences in metabolite expression between X and J samples (VIP > 1, p < 0.01): (A) In positive ion mode. (B) In negative ion mode. Notes: the x-coordinate represents the log2 FC value of the differential metabolite, that is, the logarithmic value of the differential multiple of the differential metabolite is taken as the base 2, and the ordinate axis represents significant differential metabolites. The red indicates upregulated differential metabolites, while green indicates downregulated differential metabolites.
Foods 13 01080 g004
Figure 5. Identifying the core metabolites: (A) The KEGG enrichment pathway bubble map between X and J samples. (B) The flavone and flavonol biosynthesis pathways. (C) Heatmap analysis of critical metabolites in the flavone and flavonol biosynthesis pathways. (D) Associations between taste characteristics and metabolite data. Note: (A) Each bubble in the figure represents a metabolic pathway (the top 20 with the highest significance were selected according to p-value). The horizontal coordinate where the bubble is located and the bubble size represent the influence factor size of the path in the topology analysis, and the larger the size, the larger the influence factor. The vertical coordinate where the bubble is located and the bubble color represent the p-value of enrichment analysis (take the negative common logarithm, i.e., −log10 p-value); the darker the color, the smaller the p-value, and the more significant the enrichment degree; the enrichment factor represents the proportion of the number of differential metabolites in this pathway in the total number of annotated metabolites in this pathway. (B) The small circular nodes in the metabolic pathway diagram represent metabolites; the metabolites labeled in red are the significantly upregulated differential metabolites detected in the experiment (VIP > 1, p < 0.05, fold change > 1), while the metabolites labeled in blue are the significantly downregulated differential metabolites detected experimentally (VIP > 1, p < 0.05, fold change > 1). The depth of the color indicates the degree of downward adjustment.
Foods 13 01080 g005
Table 1. Determination of taste characteristics of different varieties of chrysanthemum tea by electronic tongue.
Chrysanthemum Varieties
Taste
Characteristics
JinshihuangJu (J)HuangJu (X)HanbaiJu (H) BaoJu (B)GongJu (G)
Sourness−25.02 ± 0.00 d−21.36 ± 0.09 a−24.06 ± 0.09 c−21.38 ± 0.08 a−23.36 ± 0.05 b
Bitterness11.11 ± 0.00 b7.36 ± 0.01 e11.34 ± 0.01 a9.33 ± 0.01 d9.63 ± 0.02 c
Astringency13.60 ± 0.00 d15.79 ± 0.07 b14.89 ± 0.05 c16.79 ± 0.04 a14.96 ± 0.03 c
Bitter Aftertaste1.89 ± 0.00 a0.58 ± 0.03 e0.90 ± 0.05 c1.03 ± 0.05 b0.69 ± 0.02 d
Astringency Aftertaste2.79 ± 0.00 c3.36 ± 0.02 a2.03 ± 0.06 e3.00 ± 0.07 b2.60 ± 0.02 d
Umami11.88 ± 0.00 a11.79 ± 0.02 a9.55 ± 0.02 e10.25 ± 0.01 d10.30 ± 0.02 c
Umami Aftertaste 2.17 ± 0.00 c3.19 ± 0.06 a1.54 ± 0.06 e2.33 ± 0.09 b1.87 ± 0.01 d
Saltiness−7.32 ± 0.00 b−2.97 ± 0.03 a−13.25 ± 0.01 e−7.74 ± 0.01 c−9.82 ± 0.06 d
Standard error of means (n = 3). a–e Means within the same row with different superscripts differ significantly (p < 0.05).
Table 2. Traditional sensory evaluation of different varieties of chrysanthemum tea.
Chrysanthemum Varieties
Sensory
Attributes
JinshihuangJu (J)HuangJu (X)HanbaiJu (H) BaoJu (B)GongJu (G)
Bitterness2.90 ± 0.72 b4.13 ± 0.53 a2.70 ± 0.60 bc3.13 ± 0.67 b2.23 ± 0.65 c
Astringent2.47 ± 0.69 b3.37 ± 0.95 a2.33 ± 0.50 b2.50 ± 0.45 b2.27 ± 0.68 b
Umami1.93 ± 0.75 a1.47 ± 0.85 a2.06 ± 0.93 a1.57 ± 0.39 a2.10 ± 0.75 a
Sweetness1.60 ± 0.54 ab1.07 ± 0.14 c1.77 ± 0.57 a1.23 ± 0.42 bc1.93 ± 0.66 a
Aroma2.17 ± 0.57 c3.43 ± 0.83 a3.07 ± 0.72 ab2.23 ± 0.72 c2.43 ± 0.97 bc
Each value is expressed as the mean ± SD (n = 10). a–c Different letters within a column indicate a significant difference (p < 0.05). The taste strength of each sample was evaluated using a standard scale (0, no taste; 1 to 2, slightly strong; 3 to 4, strong; 5, very strong).
Table 3. Contents of main bioactive substances of different varieties of chrysanthemum tea.
Chrysanthemum VarietiesDetection Index
Chlorogenic Acid (%)Galuteolin
(%)
Isochlorogenic Acid (%)Total Flavonoid Content
(mg GAE/g)
Total Polyphenol
(mg RE/g)
JinshihuangJu (J)1.23 ± 0.03 c1.82 ± 0.01 b2.13 ± 0.04 d116.95 ± 0.59 a53.88 ± 0.08 b
HuangJu (X)2.11 ± 0.01 a2.62 ± 0.01 a0.18 ± 0.01 e201.07 ± 0.05 c58.91 ± 0.02 a
HanbaiJu (H) 1.55 ± 0.02 b0.18 ± 0.01 e4.01 ± 0.10 b106.76 ± 0.42 d38.39 ± 0.08 d
BaoJu (B)0.66 ± 0.05 e0.67 ± 0.05 d5.93 ± 0.02 a100.56 ± 0.05 b29.69 ± 0.05 a
GongJu (G)1.01 ± 0.01 d0.83 ± 0.02 c4.01 ± 0.10 b106.49 ± 0.18 d44.37 ± 0.03 c
Standard error of means (n = 3), a–e Means within the same row with different superscripts differ significantly (p < 0.05).
Disclaimer/Publisher’s Note: The statements, opinions and data contained in all publications are solely those of the individual author(s) and contributor(s) and not of MDPI and/or the editor(s). MDPI and/or the editor(s) disclaim responsibility for any injury to people or property resulting from any ideas, methods, instructions or products referred to in the content.

