Article

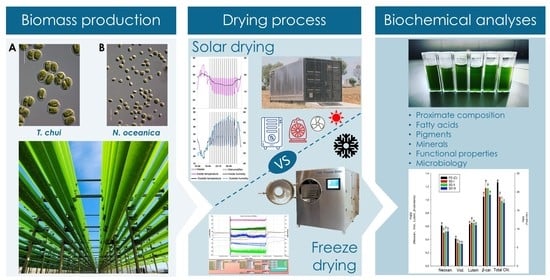
Drying Microalgae Using an Industrial Solar Dryer: A Biomass Quality Assessment

1
Necton S.A., Belamandil s/n., 8700-152 Olhao, Portugal
2
Centre of Marine Sciences, Faculty of Sciences and Technology, Campus of Gambelas, University of Algarve, 8005-139 Faro, Portugal
3
GreenCoLab—Associação Oceano Verde, Campus of Gambelas, University of Algarve, 8005-139 Faro, Portugal
4
ILVO Flanders Research Institute for Agriculture, Fisheries and Food, Technology & Food Science, Brusselsesteenweg 370, 9090 Melle, Belgium
5
German Institute of Food Technologies (DIL e.V.), Prof.-von-Klitzing Str. 7, 49610 Quakenbrück, Germany
*
Author to whom correspondence should be addressed.
Foods 2022, 11(13), 1873; https://doi.org/10.3390/foods11131873
Submission received: 27 May 2022 / Revised: 20 June 2022 / Accepted: 22 June 2022 / Published: 24 June 2022

Abstract

:
Microalgae are considered a promising resource of proteins, lipids, carbohydrates, and other functional biomolecules for food and feed markets. Competitive drying solutions are required to meet future demands for high-quality algal biomass while ensuring proper preservation at reduced costs. Since often used drying methods, such as freeze or spray drying, are energy and time consuming, more sustainable processes remain to be developed. This study tested an indirect and hybrid solar dryer as an alternative to conventional freeze drying of industrially produced Tetraselmis chui and Nannochloropsis oceanica wet paste. The effects of the drying method on biomass quality parameters, including biochemical profiles, functional properties, and microbial safety, were assessed. No significant differences were found between the applied drying technologies for total proteins, carbohydrates, lipids, and fatty acid profiles. On the other hand, some pigments showed significant differences, displaying up to 44.5% higher contents in freeze-dried samples. Minor differences were also registered in the mineral profiles (<10%). Analyses of microbial safety and functional properties of the solar-dried biomass appear adequate for food and feed products. In conclusion, industrial solar drying is a sustainable technology with a high potential to preserve high-quality microalgal biomass for various markets at expected lower costs.

Graphical Abstract

1. Introduction

The global food demand will increase by up to 70% due to the growing human population, reaching over 9.7 billion by 2050 [1]. Exploiting conventional food and feed sources intensifies critical environmental issues such as land degradation, deforestation, water pollution, greenhouse gas emissions, and water consumption [2,3,4]. Hence, finding sustainable and circular alternatives for global food industries is of utmost importance [5,6]. Large-scale productions of microalgae appear as a promising solution since they can be sited on non-arable land and do not necessarily require potable water sources, as seawater or wastewaters can be used [7,8,9]. Moreover, microalgae have a wide tolerance to environmental conditions and a relatively low carbon footprint, which can be further reduced using energy-efficient solutions and flue gases rich in CO2 [10,11].
Microalgae gained popularity as functional and “superfoods” due to their content in high-value biomolecules such as polyunsaturated fatty acids (PUFAs), pigments, and vitamins, among others [12,13]. These biomolecules are also valued for livestock, poultry, or aquaculture feed ingredients, making microalgae one of the most promising bioresources for sustainable mass production of foods and feeds [14,15]. For example, eukaryotic microalgal species such as Chlorella vulgaris, Tetraselmis chui, or Nannochloropsis oceanica are known for their potential as sustainable and innovative food and/or feed ingredients [16,17,18]. Moreover, photosynthetic prokaryotes such as the cyanobacterium Spirulina (Arthrospira platensis) are widely used in food- and feed-related industries [19]. Although the industrial production of these species is still developing, areal biomass productivities have already exceeded those of commercial terrestrial plants such as soybean by 2 to 20 times [20].
Within the production process of microalgal biomass, drying is considered one of the most cost-intensive and energy-requiring steps [21,22]. Freeze drying (lyophilization) is a commonly used technique to preserve biomass quality [23,24] but requires a high energy demand [23,25]. Furthermore, apart from the considerable acquisition costs, freeze drying involves energy-demanding steps, including low temperatures and pressure [26]. Similarly, spray drying also involves high energetic costs, and its use of high temperatures is known to affect biomass quality [27,28]. Therefore, alternative drying technologies are required to lower the current costs of microalgal biomass while ensuring high quality [29].
Solar drying is considered a more sustainable and cost-effective method [30,31], although direct biomass exposure to sunlight usually leads to the loss of functional properties [22,30,32]. Therefore, indirect solar-drying methods were developed, pairing the sustainable aspects of using the sun indirectly (heated air) while maintaining a good biomass quality [30,32]. Further process stability can be obtained by applying an indirect and hybrid solar dryer that uses sun irradiance as the primary heat source, coupled with a fan heater, a dehumidifier, and a ventilation system. If the external conditions are not favourable to reach the defined set points, the hybrid drying system consumes energy (dehumidifier and heater) to ensure optimum values. This setup provides constant temperatures and humidity inside the solar drier with low energy consumption. However, to our knowledge, no studies have been performed to assess the performance of these particular systems to dry microalgal biomass.
This study compared the biochemical compositions and physical properties of solar- and freeze-dried T. chui and N. oceanica biomass. Moreover, microbial food safety analyses of the dried biomass were performed to evaluate the suitability for food products. Finally, functional properties (water- and oil-holding properties, foaming properties, emulsifying properties, solubility) were determined to assess food applicability further since these functionalities describe how an ingredient can provide and maintain food structure [33].

2. Materials and Methods

2.1. Microalgal Biomass Cultivation and Harvesting

Tetraselmis chui and Nannochloropsis oceanica biomass was obtained from Necton S.A. and grown in industrial tubular photobioreactors as part of a regular commercial production. Afterwards, wet biomass (paste) was packed in 1 kg plastic bags (310 × 220 × 30 mm), shaped into a flat plate, and stored at −20 °C.

2.2. Drying Procedures and Moisture Analyses

The same production batches of T. chui and N. oceanica were used for solar and freeze drying. After drying, samples were milled with a commercial grinder (Drogheria MCD4, Eureka, Italy) to obtain a particle size < 300 µm. Afterwards, the biomass was packed and stored under a vacuum until further analyses.

2.2.1. Freeze-Drying Trials

Freeze drying was used as the control (FDc) for both T. chui and N. oceanica biomass. Frozen plates of T. chui and N. oceanica (1 kg each) were freeze dried in a single drying procedure, according to the internal protocol of Necton S.A., in an industrial freeze dryer (F-50, FrozenInTime Ltd., York, UK). The frozen microalgal plates were loaded into the freeze dryer, which reached −18 °C after 38 min. Then, the pressure was decreased to 0.9 mbar and the temperature further decreased to −27 °C within 12 min. In the next step, the plates were dehydrated for 39 h with a gradual transition between −27 and 28.5 °C, keeping the vacuum at 0.9 mbar. The drying ended after five additional hours at 28.5–28.9 °C. In the last step, the plates were cooled to 4.8 °C and maintained in a vacuum for ~15 h. The total time of the freeze-drying procedure was approximately 60 h with a maximum load of 63 kg microalgal biomass.

2.2.2. Solar Drying

Solar drying (SD) was performed in three separate trials (SD I, SD II, and SD III), starting on 25, 29, and 31 March 2021, lasting approximately 26 h each. Weather conditions (temperature, humidity, and radiation) were measured with Necton’s weather station (Watchdog Weather Station WD-2700, Spectrum Technologies Inc., Aurora, IL, USA) in 5 min intervals. Photosynthetically active radiation (PAR, in µmol/m2/s), provided by the weather station, was converted to solar radiation (Rs, in W/m2) by dividing by the conversion factor of 2.02 [34]. Radiation averages were calculated from the values obtained during the trials, including the night period.

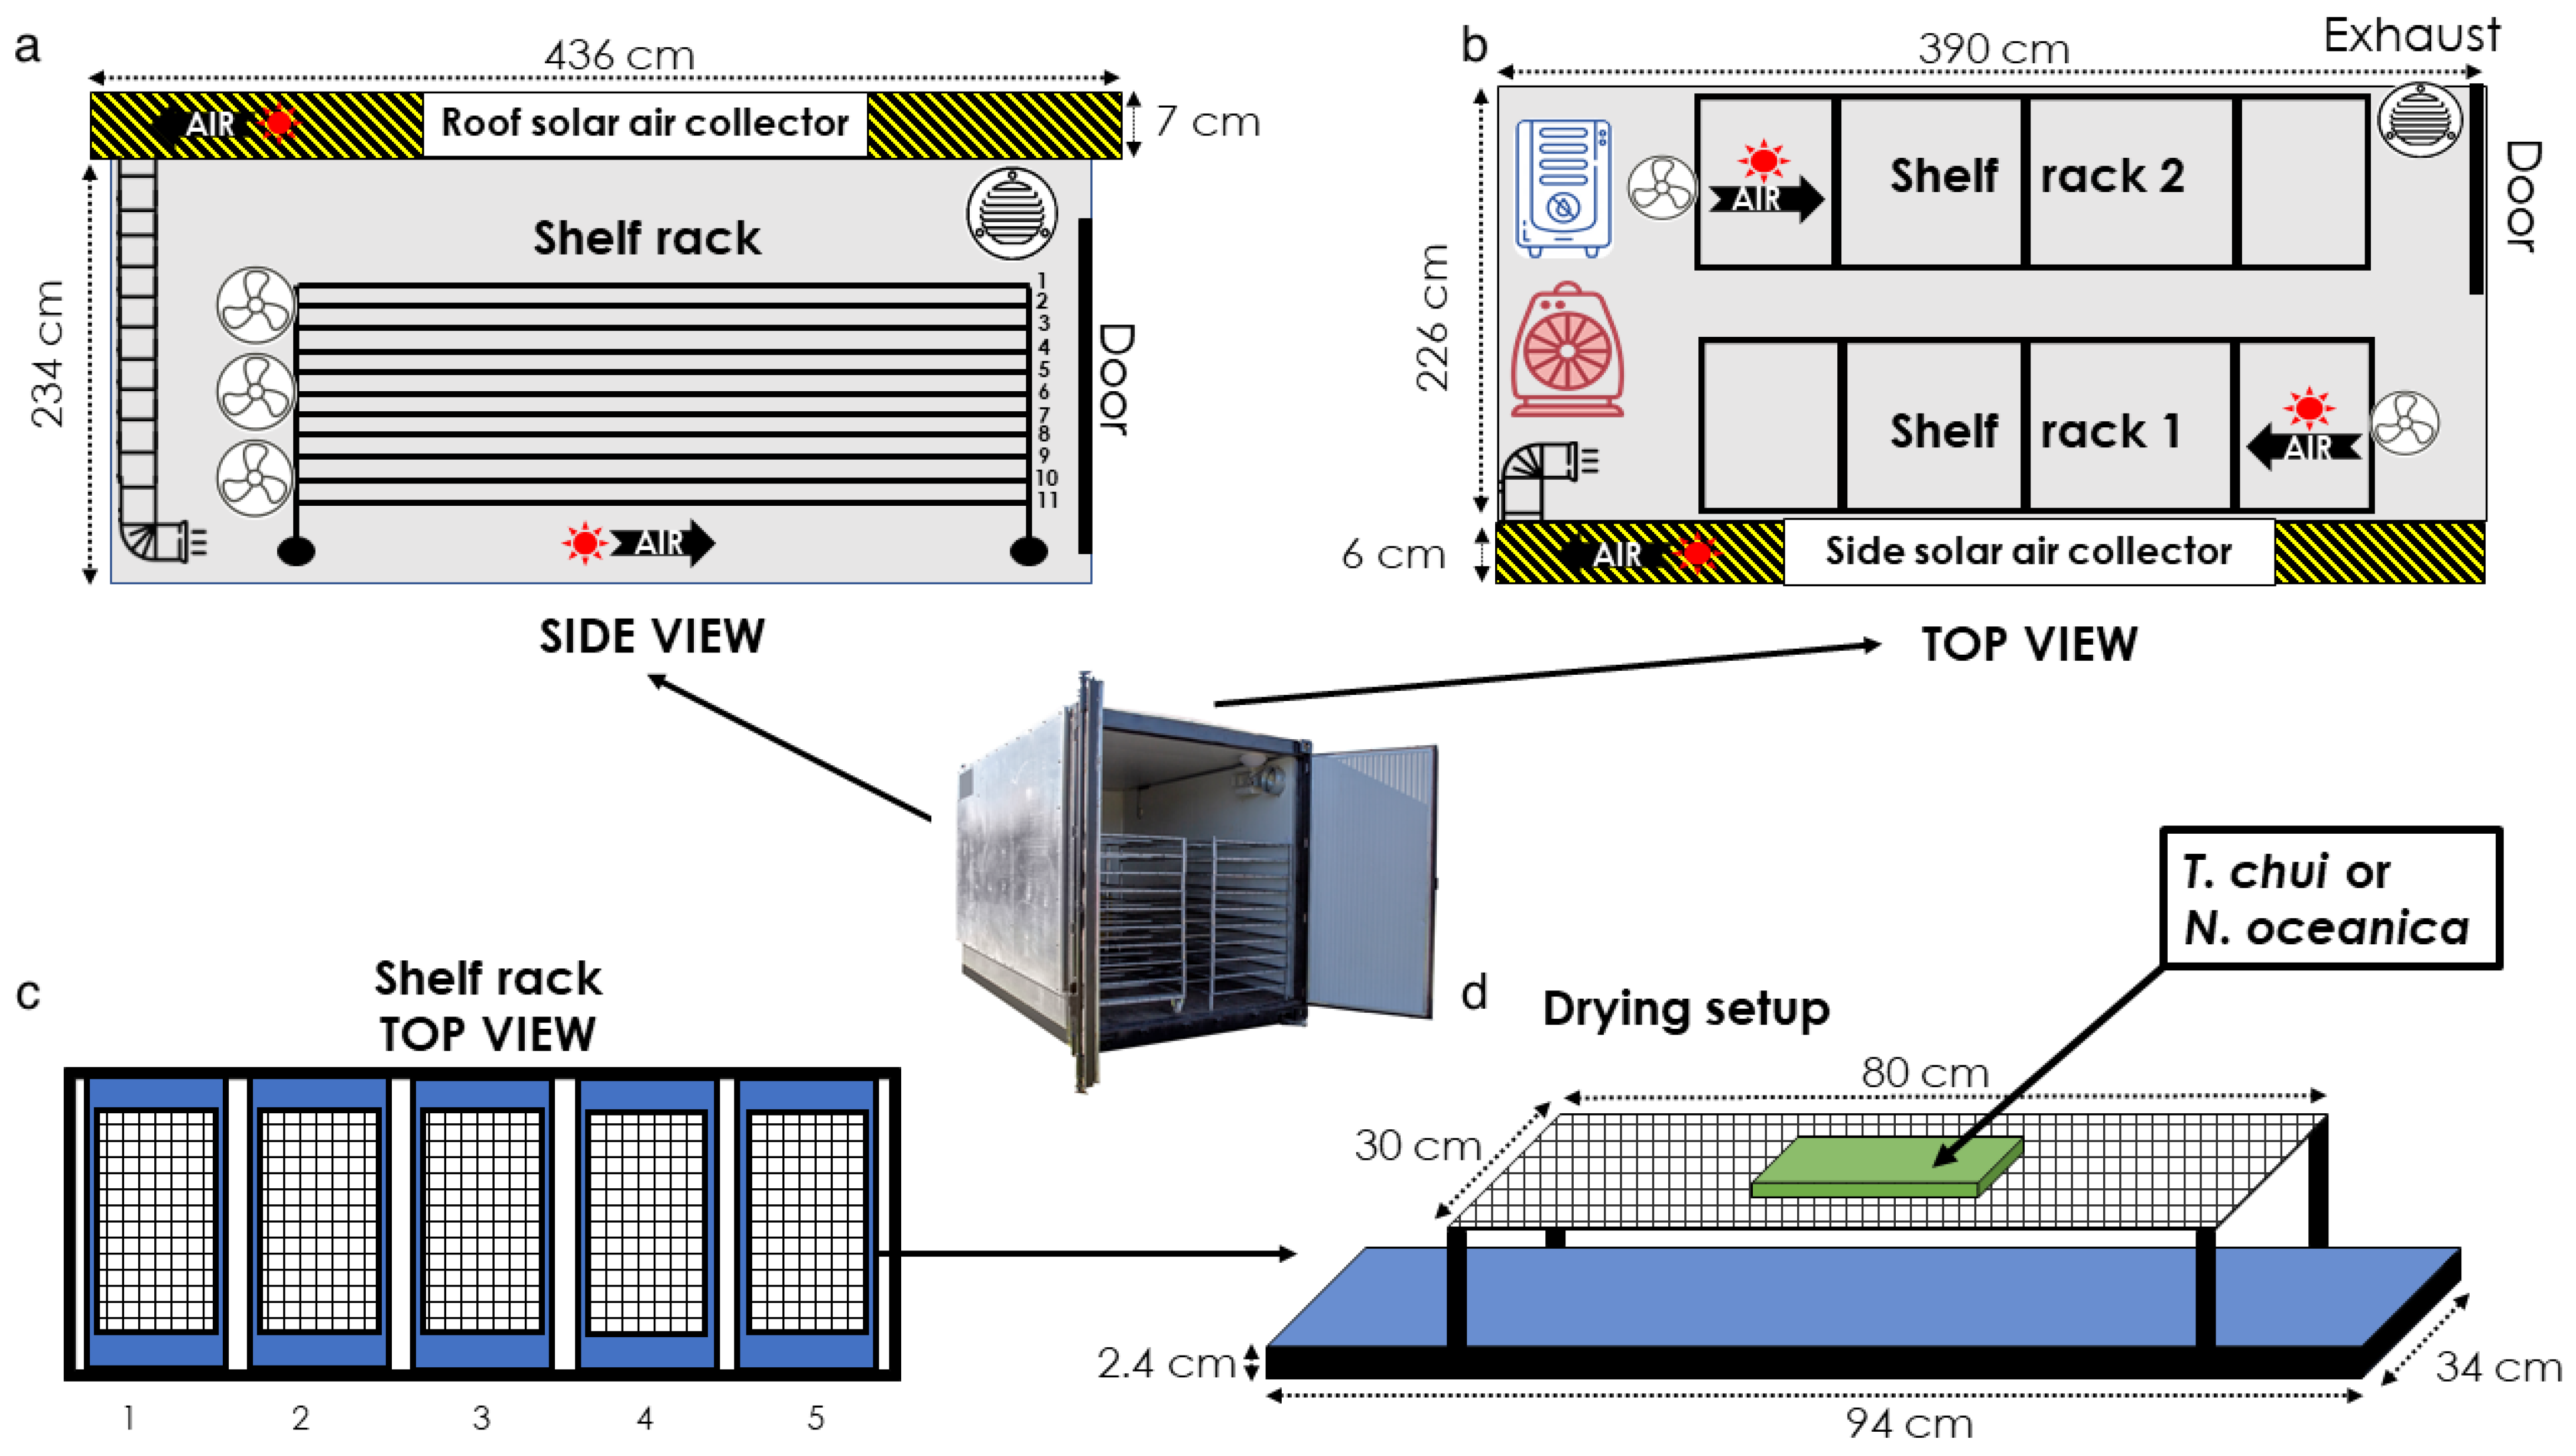
Hybrid Solar Dryer Characteristics and Operation

The solar dryer and its software were designed and built by BBKW Drying Solutions (Portugal). Ambient air was captured by two collectors (roof and wall collector) attached to the black-painted roof and the southwards-oriented sidewall of the dryer (Figure 1a,b). With solar irradiance, the air was warmed up. In-line duct fans blew the hot air from the collectors into the drying chamber while six other fans (TVM 24 D; 124 W, Trotec GmbH, Heinsberg, Germany) circulated the air inside the drying chamber. The drying operation was controlled by an algorithm that ensured the most effective drying process based on various temperature and humidity sensors (indoor and outdoor). This algorithm regulated air intake and discharge and the activation or deactivation of a dehumidifier (TTK 350 S; 70 L/ 24 h, 1.3 kW, Trotec GmbH, Heinsberg, Germany) and fan heater (TDS 20; 3.3 kW, Trotec GmbH, Heinsberg, Germany). After defining the set points for minimum humidity (25%, value above which the dehumidifier would start running) and maximum temperature (40 °C, value above which the heater would stop running), the system worked autonomously until the end of the drying process. BBKW specialised software provided indoor data (humidity and temperature) and the activity log for the dehumidifier and fan heater.

Experimental Setup

For each of the three solar-drying trials, frozen plates of T. chui (3 × 1 kg) and N. oceanica (3 × 1 kg) were dried. Therefore, wet biomass of 9 kg was used per species in the three trials. The plates were placed inside an industrial hybrid solar dryer (BlackBlock, BBKW Solutions, Portugal) on top of plastic nets (1 mm2 mesh; Figure 1d). The nets were attached with paper clips to stainless-steel grids (9 mm2 mesh), elevated 8 cm above stainless-steel trays (94 × 34 × 2.4 cm). This structure ensured maximum airflow above and below the microalgal plates for efficient drying. In addition, foldable nets facilitated the final collection of the dried biomass. Biomass plates were placed in position 1 (Figure 1c) on shelves 1, 3, and 5 (Figure 1a) and were swapped during the drying process.

2.2.3. Moisture Analyses

The moisture loss was measured during the solar-drying experiments by weighing the trays with the biomass plates at different time points until no mass change was detected (BM 100M, Marques, Portugal). The algal biomass’s initial and final moisture content was then determined by drying the samples at 60 °C in a drying chamber (model no. 52301-45, Cole-Parmer Instrument Co., Chicago, IL, USA) until complete drying (approximately 36 h). Finally, the moisture contents (%) at a given time point during solar drying were calculated by fitting the weight loss to the initial and final moisture values.

2.3. Biochemical Analyses and Physical Properties

Proximate composition, pigment, and fatty acid profiles were carried out at GreenCoLab (Associação Oceano Verde, Faro, Portugal). The German Institute of Food Technologies (DIL e.V.; Quakenbrück, Germany) analyzed mineral element contents, while the Flanders Research Institute for Agriculture, Fisheries and Food (ILVO; Melle, Belgium) determined functional properties and microbial safety.

2.3.1. Proximate Composition

Protein Content

Protein content was determined by elemental analysis through the measurement of total nitrogen. Approximately 1 mg of dried biomass was weighed, and an element analyzer (Vario EL III, Elementar Analysensysteme GmbH, Langenselbold, Germany) was used to analyze C, H, and N according to the manufacturer’s methodology. Total nitrogen contents of solar- and freeze-dried T. chui and N. oceanica biomass were multiplied by the standard conversion factor of 6.25 to determine total protein contents [35,36,37].

Lipid Content

Lipid contents were determined according to a modified Bligh and Dyer method [38], described in Pereira et al. [39]. First, dried microalgal biomass (10–20 mg) was homogenized with a mixture of methanol, chloroform, and water (2:2:1), at 25,000 rpm for 2 min using an IKA T18 Ultra-Turrax disperser (IKA-Werke GmbH, Staufen, Germany). Afterwards, the samples were centrifuged (5000× g for 10 min) to allow phase separation. The organic phase (chloroform) was then collected and transferred into new glass tubes. Next, a volume of 0.7 mL of lipid extract was poured into pre-weighed tubes and moved to a dry bath (60 °C) for overnight evaporation. After evaporation, the tubes were weighed and total lipid content was gravimetrically determined.

Ash Content

The ash content was determined by burning 50–60 mg of dried microalgal biomass in a muffle furnace (Sel horn R9-L, J.P. Selecta, Spain) at 525 °C for 8 h. The content was calculated according to Barreira et al. [35].

Carbohydrate Content

Carbohydrate content was obtained from mass balance after subtracting the protein, lipid, and ash contents.

2.3.2. Pigments’ Analyses

The extraction and analysis of pigments were performed according to Schüler et al. [40]. About 5–10 mg of dried microalgal biomass was resuspended in 1 mL of methanol, and about 0.6 mL of glass beads (425–600 µm) were added. The cells were disrupted in a Retsch MM 400 mixer mill (30 Hz for 3 min) followed by centrifugation (21,000× g, 3 min) to collect the supernatant. After transferring the supernatant to a new tube, the previous process was repeated until the pellet and the supernatant were colorless. Then, the extracts were combined, dried under a gentle nitrogen flow, resuspended in a known volume of MeOH, and filtered (0.22 µm). Total chlorophyll contents were determined spectrophotometrically using the sum of Equations (1) and (2) for T. chui [41] and Equation (3) for N. oceanica [42]:
Chl a = 15.65 (A666–A750) − 7.34 (A653–A750)
Chl b = 27.05 (A653–A750) − 11.21 (A666–A750)
Chl a = 13.9 (A665–A750)
Carotenoids were analyzed and quantified by a Dionex 580 HPLC System (DIONEX Corporation, Sunnyvale, CA, USA) consisting of a PDA 100 Photodiode-array detector, STH 585 column oven set to 20 °C, and a LiChroCART RP-18 (5 µm, 250 × 4 mm, LiChrospher) column. To this end, calibration curves of neoxanthin, violaxanthin, lutein, zeaxanthin, and β-carotene standards (Sigma-Aldrich, Lisbon, Portugal) were performed. The carotenoids were separated by a solvent gradient composed of solvent A, acetonitrile:water (9:1), and solvent B, ethyl acetate. The gradient program used was as follows: for 0–16 min increasing from 0–60% of solvent B, 16–30 min hold 60% of solvent B, 30–32 min increase to 100% of solvent B, and 32–35 min to 100% of solvent A. The injection volume of the extract and the standard was 100 µL. All carotenoids were detected at 450 nm and analyzed using the Chromeleon Chromatography Data System software (Version 6.3, ThermoFisher Scientific, Waltham, MA, USA).

2.3.3. Fatty Acid Profile

The fatty acid profile was determined according to Lepage et al. [43] and further developed by Pereira et al. [44]. Briefly, 20–40 mg of freeze-dried microalgal biomass was weighed into derivatization vessels and resuspended in 1.5 mL of a solution of methanol:acetyl chloride (20:1, v/v). The samples were disrupted and homogenized with an IKA Ultra-Turrax disperser (2 min at 25,000 rpm), and 1 mL of n-hexane was added afterwards. All samples were heat treated in a water bath at 70 °C for 60 min. After cooling, they were transferred into centrifuge tubes, and 4 mL of n-hexane and 1 mL of distilled water were added. After vortexing the samples, they were centrifuged (2000× g for 5 min) for phase separation. The hexane fraction was transferred into new tubes and the process was repeated once again. Anhydrous sodium sulphate was used in excess to remove residual water. The samples were filtered through 0.22 µm PFTE filters and the solvent was evaporated under a gentle nitrogen flow until dry. Finally, all samples were resuspended in 0.5 mL of chromatography-grade hexane.
Fatty acid methyl esters (FAME) were analyzed by a Bruker gas chromatographer coupled to a mass spectrometry system (Bruker SCION 456-GC, SCION TQ MS) equipped with a ZB-5MS capillary column (30 × 0.25 mm of internal diameter with 0.25 μm film thickness; Phenomenex), with helium as carrier gas (1 mL/min). The temperature program was set to 1 min at 60 °C, 30 °C/min to 120 °C, 4 °C/min to 250 °C, and 20 °C/min to 300 °C, held for 4 min, with an injection temperature of 300 °C in splitless mode. Supelco® 37 component FAME Mix (Sigma-Aldrich, Sintra, Portugal) was used as a standard to prepare different calibration curves for FAME identification. The results are expressed as a percentage of total fatty acid (% TFA) contents.

2.3.4. Mineral Element Content

Mineral elements were determined by inductively coupled plasma optic emission spectrometry (ICP-OES iCap 7200 Duo, Thermo Fisher Scientific, Dreieich, Germany). The method was modified according to BVL method F 0042 [45], adopted from DIN EN 15510:2007 [46]. After incinerating 5 g of microalgal biomass at 550 °C (for P, Na, Mg, Ca, Fe, Cu, Mn) or 450 °C (for K), ash residues were dissolved in 10 mL nitric acid (20%; 65% Nitric acid, Cat. No. 1.00456.2500, Merck KGaA, Darmstadt, Germany) under slight boiling. After cooling, the solution was transferred into a 100 mL volumetric flask and topped up to the mark with demineralized water. P, Na, K, Mg, and Ca contents were determined by external calibration (phosphate standard solution, 1000 mg/L, Cat. No. 1.19898.0500; potassium standard solution, 1000 mg/L, Cat. No. 1.70230.0500; sodium standard solution, 1000 mg/L, Cat. No. 1.70238.0500; standard magnesium solution, 1000 mg/L, Cat. No. 1.70331.0100; calcium standard solution, 1000 mg/L, Cat. No. 1.19778.0500). Standard addition was performed to determine Fe, Cu, and Mn (iron standard solution, 1000 mg/L, Cat. No. 1.19781.0100; copper standard solution, 1000 mg/L, Cat. No. 1.19786.0100; manganese standard solution, 1000 mg/L, Cat. No. 1.19789.0100; Merck KGaA, Darmstadt, Germany). The measurement was performed with the following wavelengths: P, 213.618 nm; Na, 589.590 nm; Mg, 279.079 nm, Ca; 318.128 nm; Fe, 259.940 nm; Cu, 324.754 nm; Mn, 257.610 nm; and K, 766.490 nm.

2.3.5. Microbial Safety Analyses

Microbial safety analyses were performed to investigate the total counts and the presence of (xerophilic) yeasts, molds, and Escherichia coli contaminations. Microalgal biomass (10 g) was suspended in 90 g of Maximum Recovery Diluent (MRD, Oxoid, Basingstoke, UK), followed by homogenization. The suspensions were diluted several times (10−1–10−4), and agar plates were inoculated with 100 µL of each dilution using the spread plate method. Only plates with 10 to 200 colonies were counted. Total counts were performed on plate count agar (PCA, Oxoid, Basingstoke, UK), and plates were incubated at 30 °C for 5 days following ISO 4833 [47]. Yeasts and molds were determined by incubating Oxytetracycline-Glucose Yeast Extract (OGYE, Oxoid, Basingstoke, UK) agar plates at 25 °C for 5 days, following the ISO 7954 guidelines [48]. Xerophilic yeasts and molds were determined by incubating Dichloran-glycerol 18% (DG18, Oxoid, Basingstoke, UK) agar plates at 25 °C for 5 days according to ISO 21527-2 [49]. The presence of E. coli was determined using RAPID’ E. coli 2 agar (Bio-Rad, Hercules, CA, USA), incubated at 44 °C for 24 h [50].

2.3.6. Functional Properties

Water- and Oil-Holding Capacities

Water- and oil-holding capacities were determined according to Stone et al. [51] with minor modifications. Briefly, 0.5 g of microalgal powder was suspended in 10 mL of distilled water or sunflower oil in a 50 mL Falcon tube. During a time period of 30 min, samples were vortexed for 10 s every 5 min, followed by centrifugation at 1000× g for 15 min at room temperature (Sorvall LYNX 6000, Thermo Fisher Scientific, Waltham, MA, USA). After centrifugation, the supernatant was carefully decanted to remove any unbound water or oil, and the remaining pellet was weighed. The results were expressed as g of water or oil per g of powder (Equation (4)).
W H C   o r   O H C = w w 0 w 0
where w is the weight of the pellet and w0 is the weight of microalgae powder.

Foaming Properties

Foaming properties were determined according to Xiong et al. [52] with minor modifications. Briefly, 0.15 g of microalgal powder was suspended in 15 mL of distilled water. Samples were stirred magnetically for 30 min and whipped with a rotor-stator disperser Ultra-Turrax T25 (Ika, Staufen, Germany) at 8000 rpm for 1 min. Immediately after whipping, the foam was transferred to a 25 mL graduated cylinder. Foaming capacity (FC) was defined by the ratio of foam volume after 2 min and the initial sample volume (Equation (5)), while foaming stability (FS) was determined by the ratio of the foam volume after 10, 20, 40, or 60 min and the initial foam volume (Equation (6)).
FC   [ % ] = V 0 15 × 100
FS   [ % ] = V t V 0 × 100
where V0 is the foam volume after 2 min and Vt is the foam volume at 10, 20, 40. or 60 min.

Water Solubility Index

Microalgae cell solubility was determined according to Calderón-Castro et al. [53] with modifications. Briefly, 0.5 g of dried microalgae powder was suspended in 10 mL of distilled water in a 50 mL Falcon tube. Samples were magnetically stirred for 30 min, followed by centrifugation at 1800× g for 15 min at room temperature (Sorvall LYNX 6000, Thermo Fisher Scientific, Waltham, MA, USA). After centrifugation, the supernatant was decanted in a metal dish and the residue was weighed after drying for 12 h at 105 °C.
W S I   [ % ] = w S w 0 × 100
where wS is the weight of the dried supernatant and w0 is the dry weight of the sample.

Emulsion Capacity

Emulsifying capacity (EC) was determined according to Benelhadj et al. [54] with modifications. Suspensions containing 0.5%, 1%, and 2% (w/v) microalgae in distilled water were magnetically stirred for 30 min. For each concentration, 30 mL of suspension was added to 30 mL of sunflower oil (obtained from a local supermarket) and homogenized at 15,000 rpm with a rotor-stator disperser Ultra-Turrax T25 (Ika, Staufen, Germany) to form an oil-in-water emulsion. After homogenization, 10 mL of the emulsion was transferred into a 15 mL Falcon tube and immediately centrifuged at 1500× g for 5 min (Sorvall LYNX 6000, Thermo Fisher Scientific, Waltham, MA, USA). After centrifugation, the volume of the emulsified fraction was recorded and EC was expressed as a percentage of the emulsified volume.
EC   [ % ] = V E V T × 100
where VE is the volume of the emulsified fraction and VT is the total volume.

2.4. Statistical Analyses

ANOVA with Tukey’s post hoc test was used to detect significant effects between the drying methods (FDc and SD I, II, and III) on response variables (proximate composition, pigments, fatty acids, minerals, microbial safety analyses, and functional properties) for each microalgal species. A significance level (α) of 0.05 was used for all performed tests. Statistical categories are represented with letters in graphs and tables. Data points are reported as means ± standard deviations.

3. Results

3.1. Drying Process

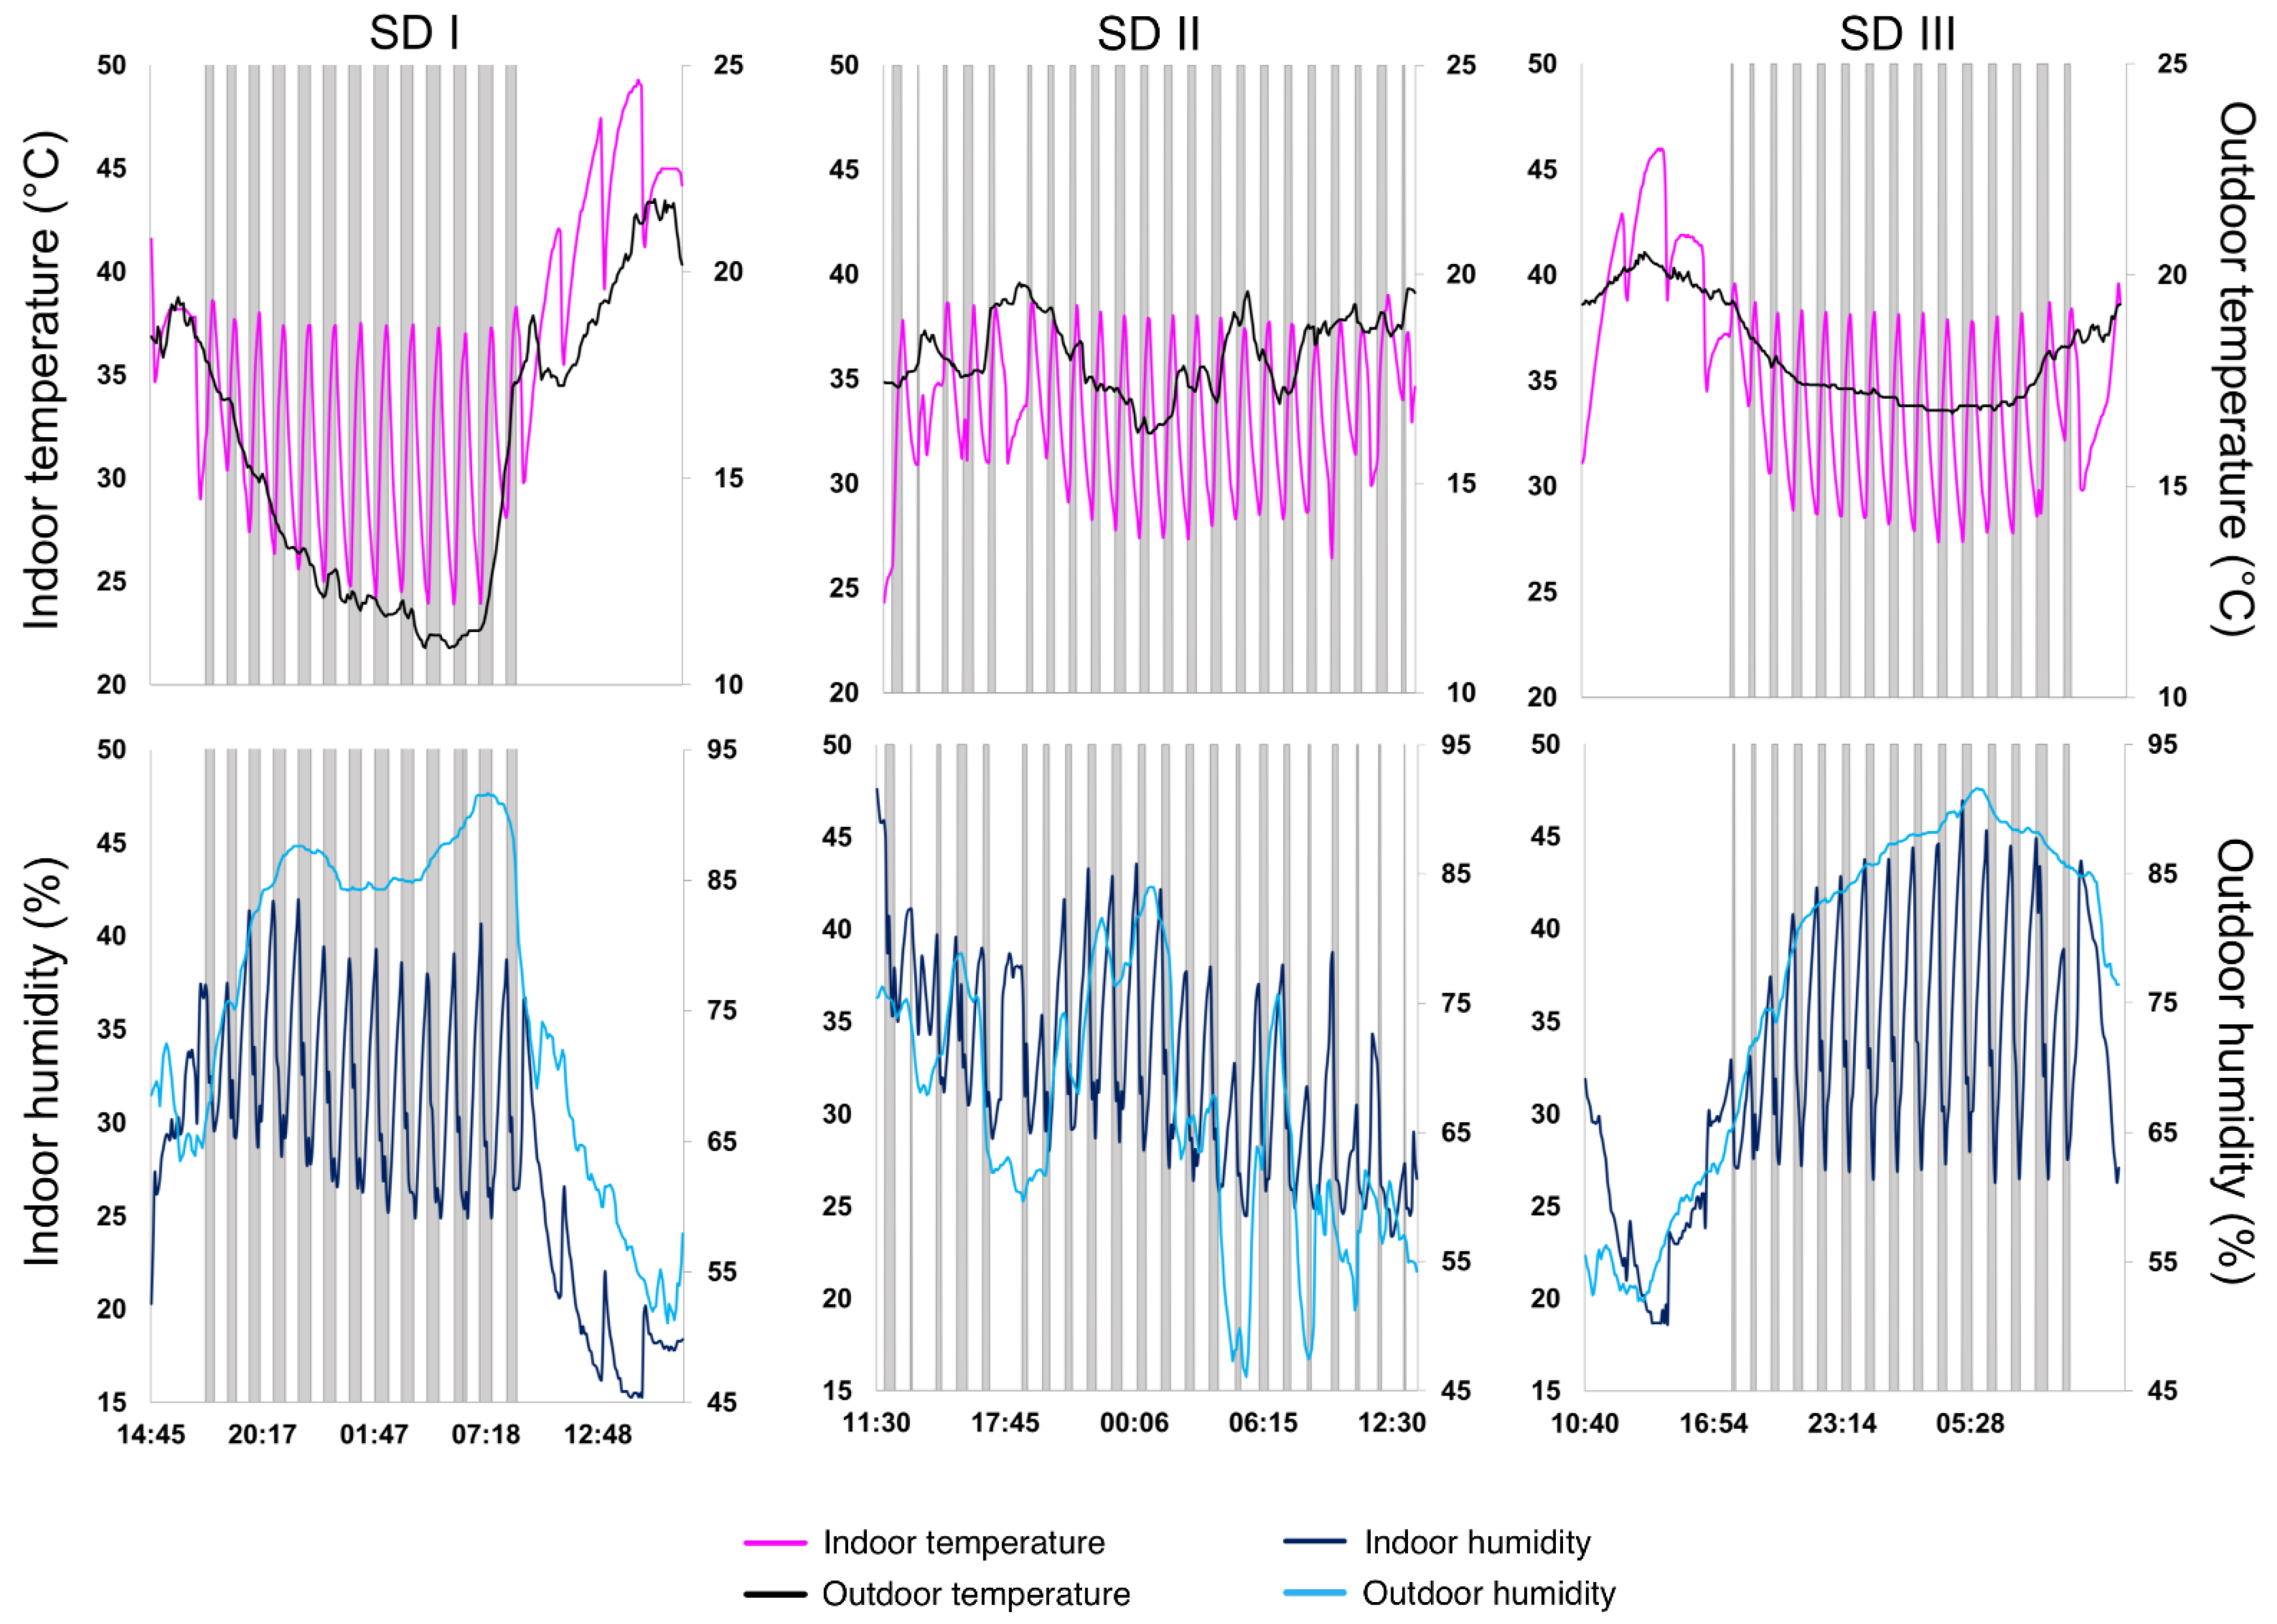
3.1.1. Solar-Drying Conditions

Solar-drying trials were performed within weeks 12 and 13 of 2021, where average outdoor temperatures ranged between 15.6 and 18.2 °C. No major environmental differences were observed except for solar radiation between the trials (Rs; Table 1). Rs measurements revealed 58.66 and 45.63% lower average values during SD II compared to SD I and SD III, respectively. The average outdoor humidity ranged between 65.8 and 76.6% during the trials, while the average indoor humidity ranged from 28.4 to 32.2%. Automatic measurements of humidity and temperature are illustrated in Figure 2. Moreover, Figure 2 shows activities of the heater and the dehumidifier inside the hybrid solar dryer, correlated with average outdoor temperature and humidity. The customized algorithm maintained indoor temperatures between 23.9 and 49.3 °C during all trials (SD I, II, and III).

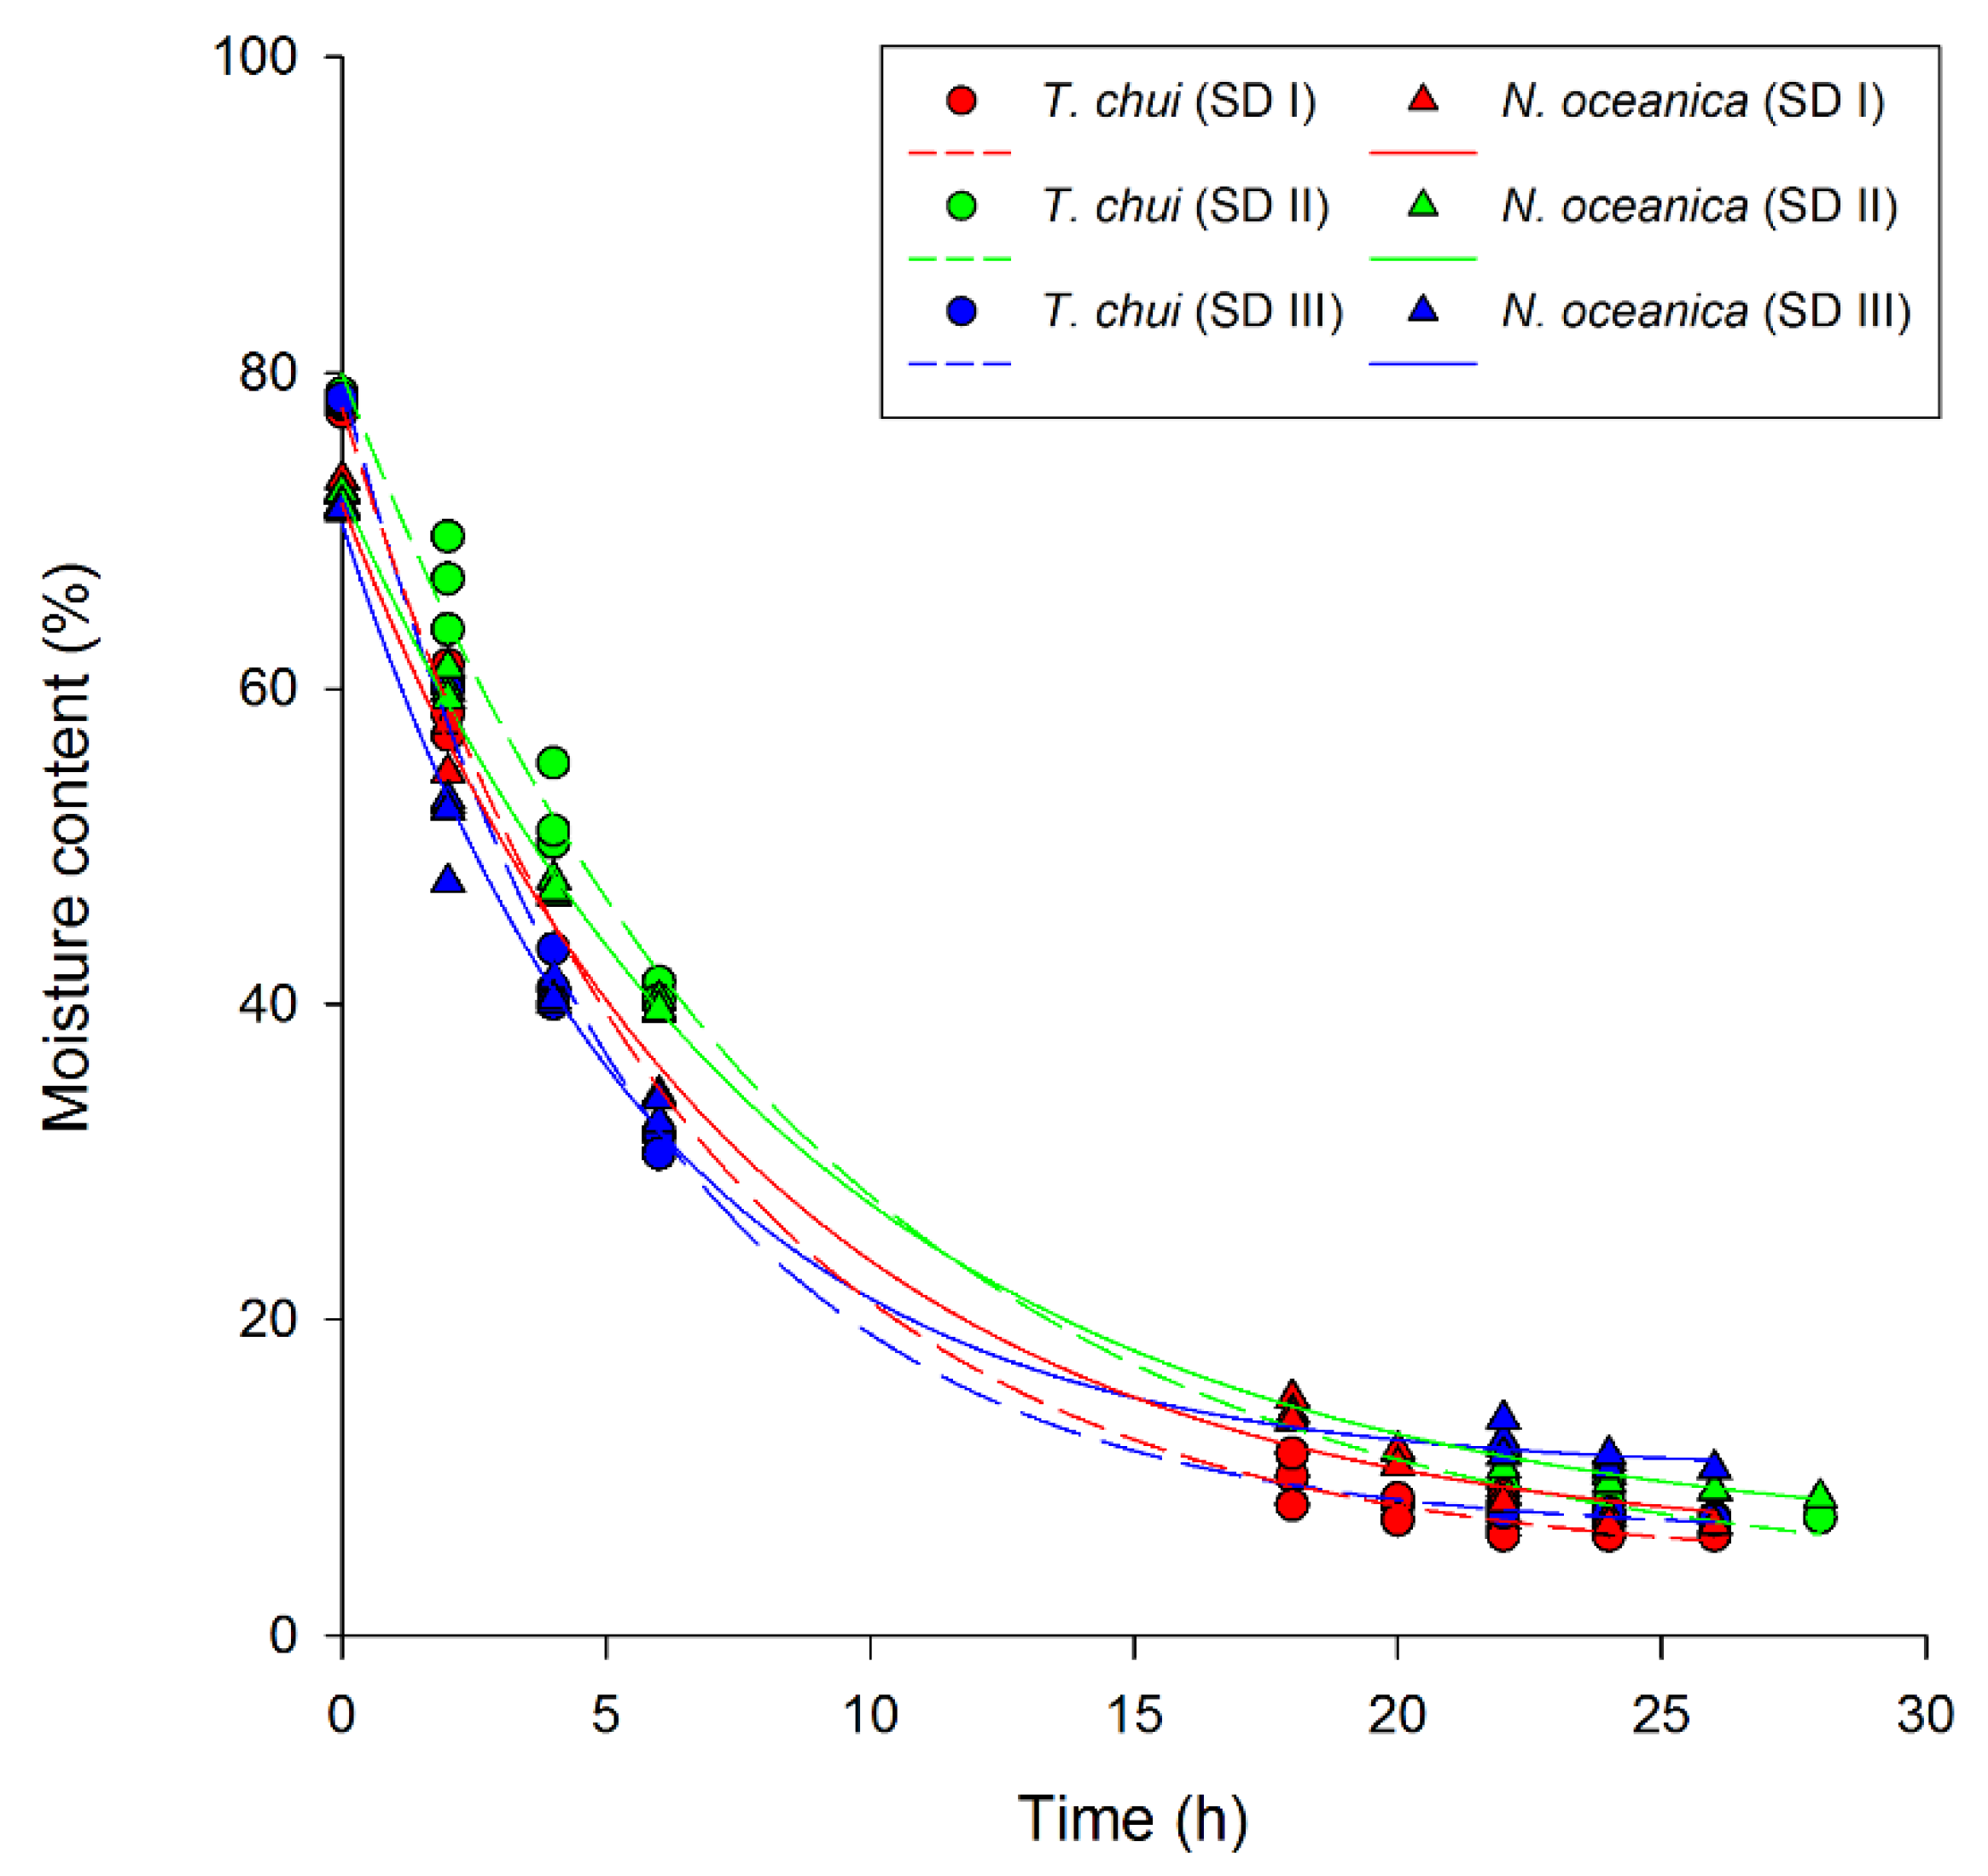
3.1.2. Moisture Analyses

Regarding relative moisture loss during solar drying, significant differences were found between T. chui and N. oceanica biomass (Figure 3). Despite higher initial moisture contents of frozen T. chui biomass (78.22 ± 0.01%), N. oceanica (72.09 ± 0.01%) showed a significantly higher final moisture content, ranging between 7.02 ± 0.49 and 10.54 ± 0.15%, compared to that of T. chui (6.34 ± 0.07–7.46 ± 0.07%; Figure 3). On the other hand, moisture contents of freeze-dried samples were 3.51 ± 0.41% for T. chui and 0.66 ± 0.03 for N. oceanica.

3.2. Biomass Analyses

3.2.1. Proximate Composition

Proteins, lipids, and carbohydrates revealed no significant differences between the different drying technologies for both species (Table 2). However, N. oceanica FDc showed a significant lower ash content than all solar-dried biomass.

3.2.2. Pigment Analyses

The carotenoids neoxanthin, violaxanthin, lutein, and β-carotene as well as total chlorophyll contents of T. chui biomass were analyzed (Figure 4a). For N. oceanica biomass, the pigment analyses comprised violaxanthin, zeaxanthin, β-carotene, and total chlorophylls (Figure 4b). Freeze-dried T. chui biomass revealed the highest contents of the pigments neoxanthin (0.61 ± 0.02 mg/g) and violaxanthin (0.41 ± 0.01 mg/g), which were 14.33–19.09% higher (p < 0.05) compared with solar-dried T. chui biomass (SD I, II, and III; p < 0.05). On the other hand, lutein and β-carotene showed no statistically significant differences. However, when comparing total chlorophylls, significantly higher contents were found for FDc (23.24 ± 0.28 mg/g) than for SD I, II, and III (average: 19.06 ± 0.75 mg/g).
Similar to T. chui, species-typical pigments of N. oceanica (Figure 4b) were affected by the drying methods. The contents of the major pigments violaxanthin and zeaxanthin were significantly higher in the FDc (0.29 ± 0.01 and 0.15 ± 0.00 mg/g, respectively), when compared with all SD samples (up to 0.20 ± 0.01 and 0.12 ± 0.01 mg/g, respectively). The contents of β-carotene of SD and FDc were not significantly different. In contrast, the total chlorophyll contents for all SD samples (ranging from 12.28 ± 0.16–14.33 ± 0.42 mg/g) were significantly lower than those of the FDc (20.56 ± 0.53 mg/g).

3.2.3. Fatty Acid Profile

The fatty acid profile of T. chui was mainly composed of palmitic (C16:0), palmitidonic (C16:4n-3), oleic (C18:1n-9), and eicosapentaenoic (C20:5n-3, EPA) acids, while N. oceanica presented mainly eicosapentaenoic, palmitoleic (C16:1n-9), and palmitic (C16:0) acids. At concentrations below 10% of TFA, T. chui showed stearidonic (C18:4n-3), linoleic (C18:2n-6), γ-linolenic (C18:3n-6), palmitoleic, arachidonic (C20:4n-6), palmitolinolenic (C16:3n-3), heneicosylic (C20:1), and myristic (C14:0) acids, while N. oceanica presented arachidonic, myristic, linoleic, and oleic acids. However, there were no significant differences detected between the fatty acid profile of solar- (SD I, II, and III) and freeze-dried (FDc) T. chui and N. oceanica biomass (Table 3).

3.2.4. Mineral Contents

The analyses of minerals (total P, Na, K, Mg, Ca, total Fe, Cu, and Mn) revealed statistically significant differences between the two tested drying methodologies for some elements (Table 4). Potassium contents of freeze-dried T. chui (18.54 ± 0.03 mg/g) differed significantly from all solar-dried samples (17.28–17.73 mg/g), although the relative differences were only 4.6–7.3%. Freeze-dried N. oceanica (5.42 ± 0.03 mg/g) biomass showed minor differences in comparison with potassium contents of all solar-dried samples (4.92–5.09 mg/g). Moreover, magnesium quantities in freeze-dried T. chui biomass (11.46 mg/g) exceeded those of the solar-drying trials (10.91–11.04 mg/g) significantly. The most abundant mineral in T. chui and N. oceanica biomass was sodium, with 56.67–68.99 mg/g and 27.14–37.58 mg/g, respectively.

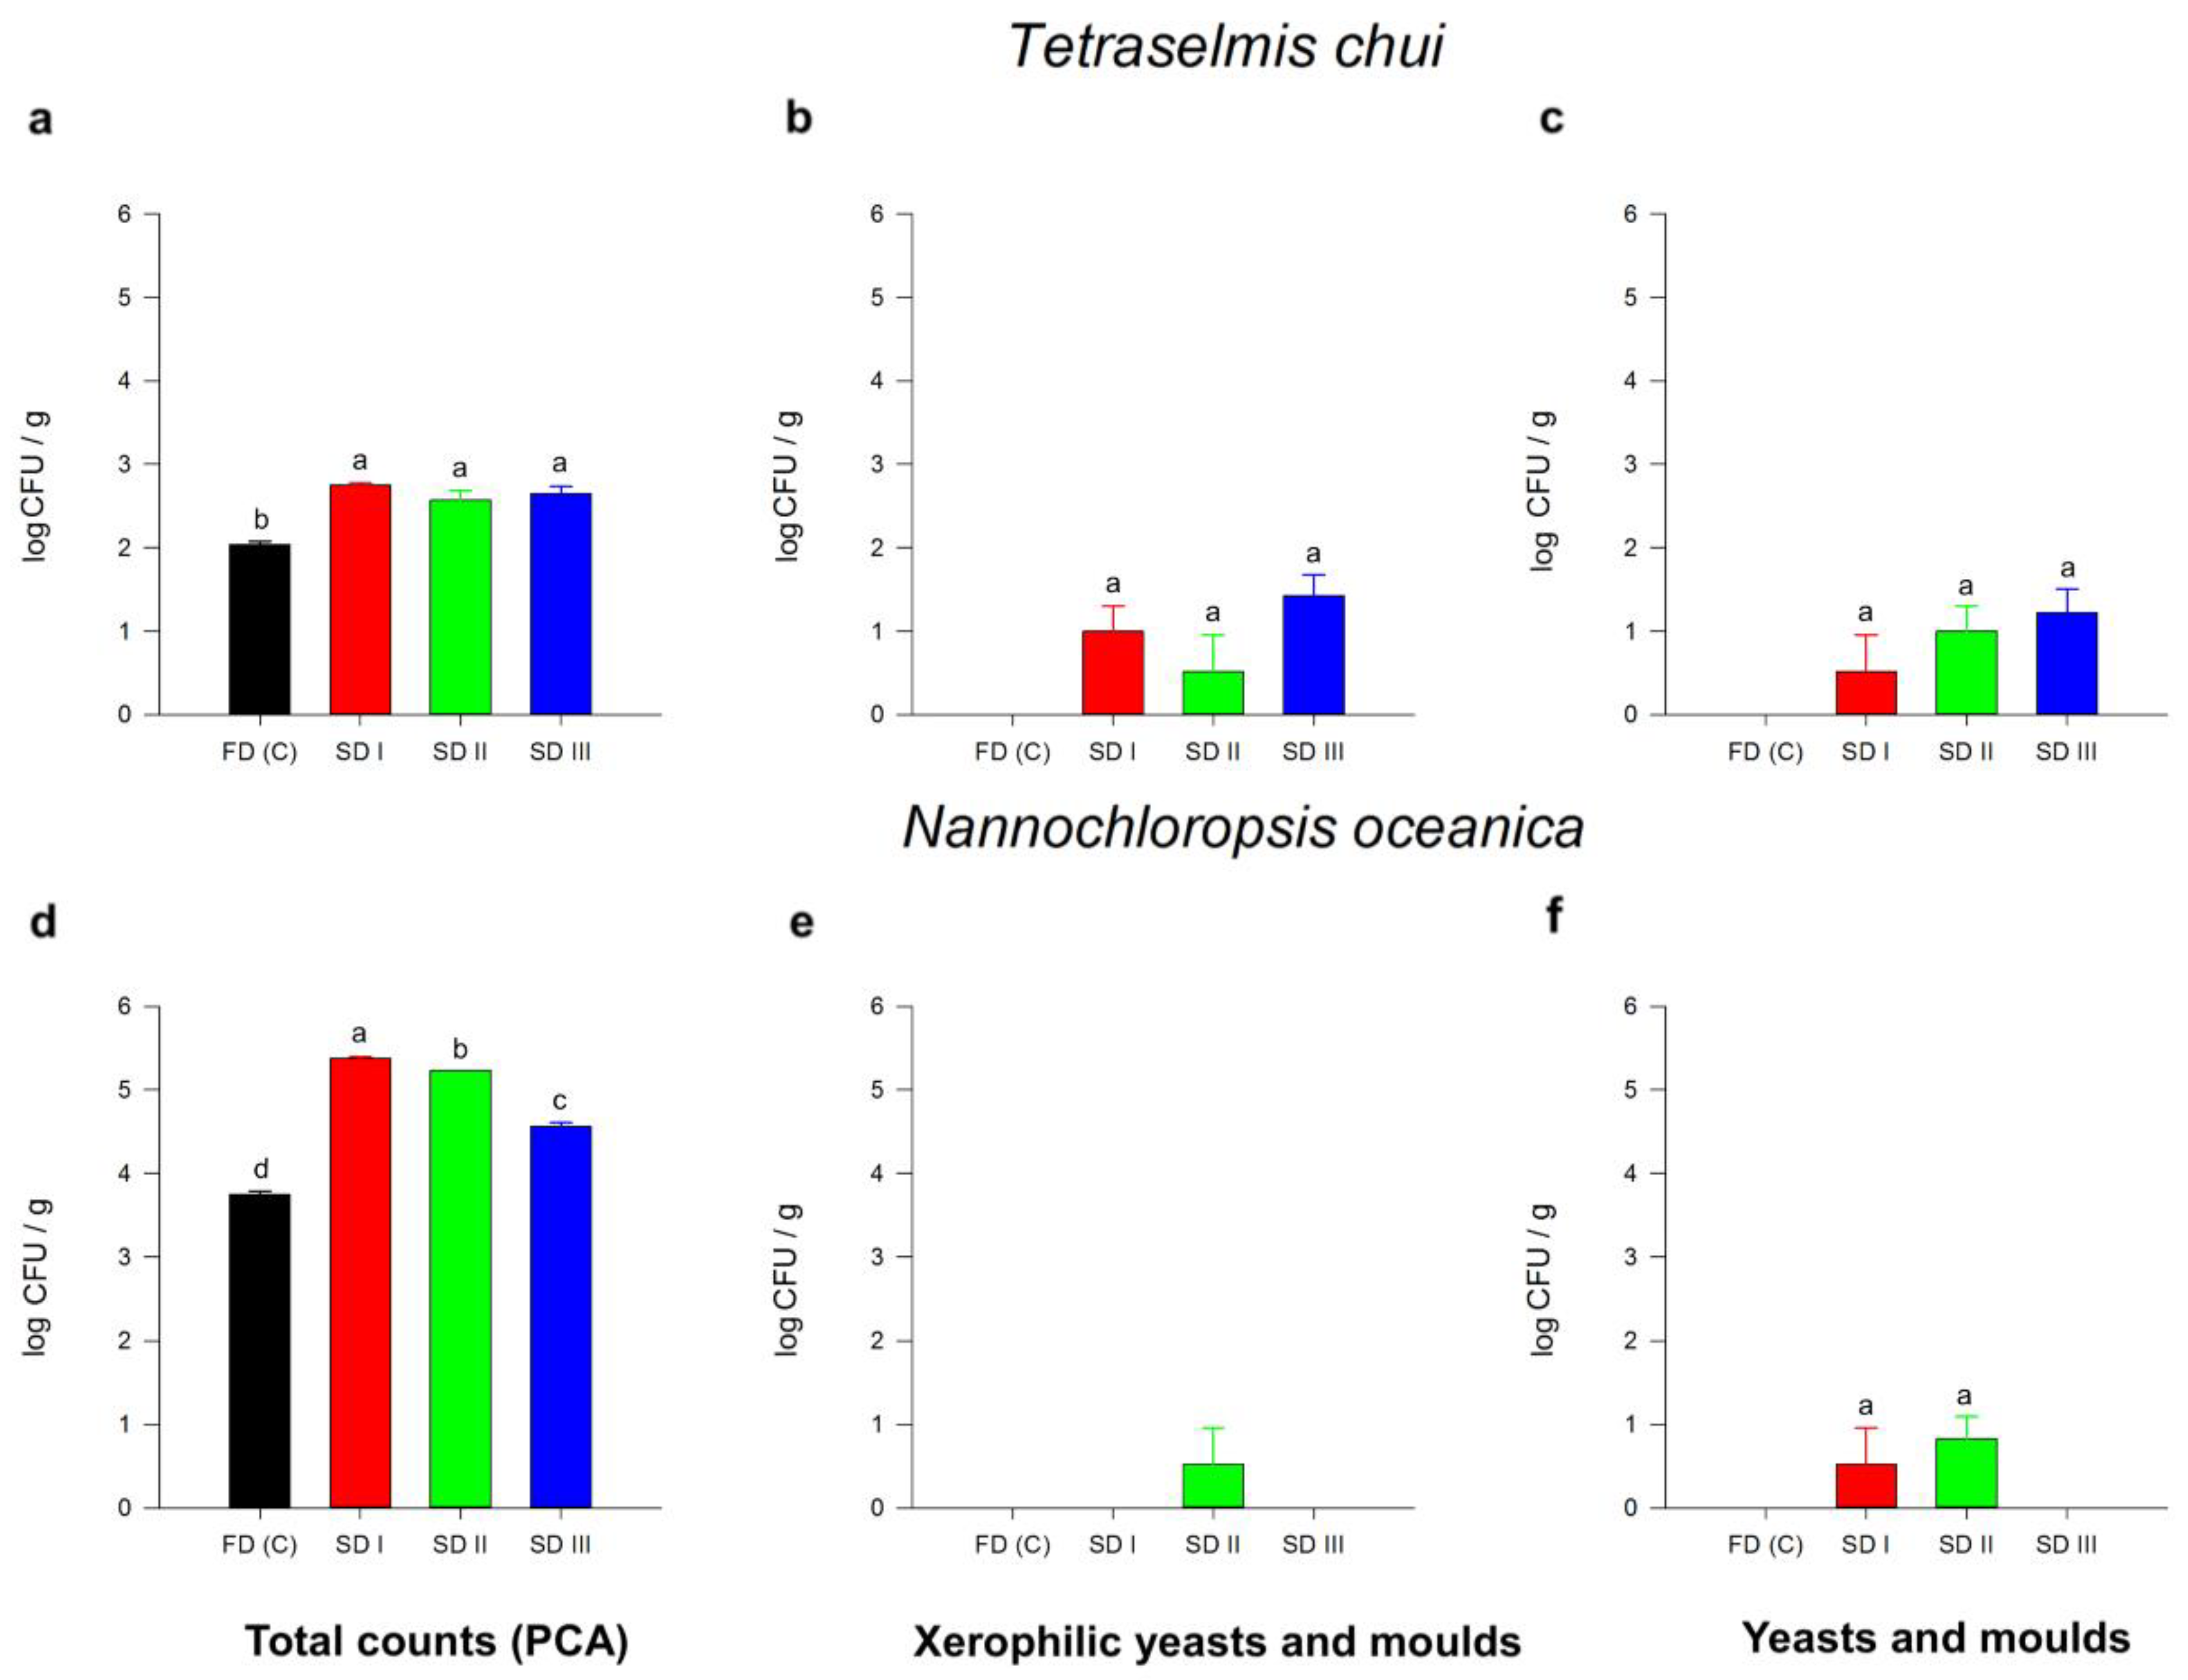
3.2.5. Microbial Safety Analyses

Significant differences in microbial safety parameters between solar-dried samples (SD I, II, and III) and the freeze-dried control group (FDc) were detected. For T. chui biomass, total counts (PCA) were higher in all SDs (3.73 and 5.70 × 10² CFU) compared to freeze-dried samples (1.10 × 10² ± 1.00 × 10). Low numbers of (xerophilic) molds (<102 CFU/g, no yeasts) were detected in both T. chui and N. oceanica SD samples. In the freeze-dried control sample, yeasts and molds were not detected above the limit of quantification (10 CFU/g). The total counts (PCA) for N. oceanica indicated significant differences between solar-drying trials (SD I, II, and III) and the FDc (Figure 5d). Total counts (PCA) for all treatments ranged between 5.57 × 10³ ± 5.13 × 10² (FDc) and 2.40 × 10⁵ ± 1.00 × 10⁴. Molds detected in SD I and SD II did not present significant differences (p < 0.05, Figure 5f). The presence of E. coli was determined and revealed no detection above the limit of detection (10 CFU/g) for all solar- and freeze-dried samples.

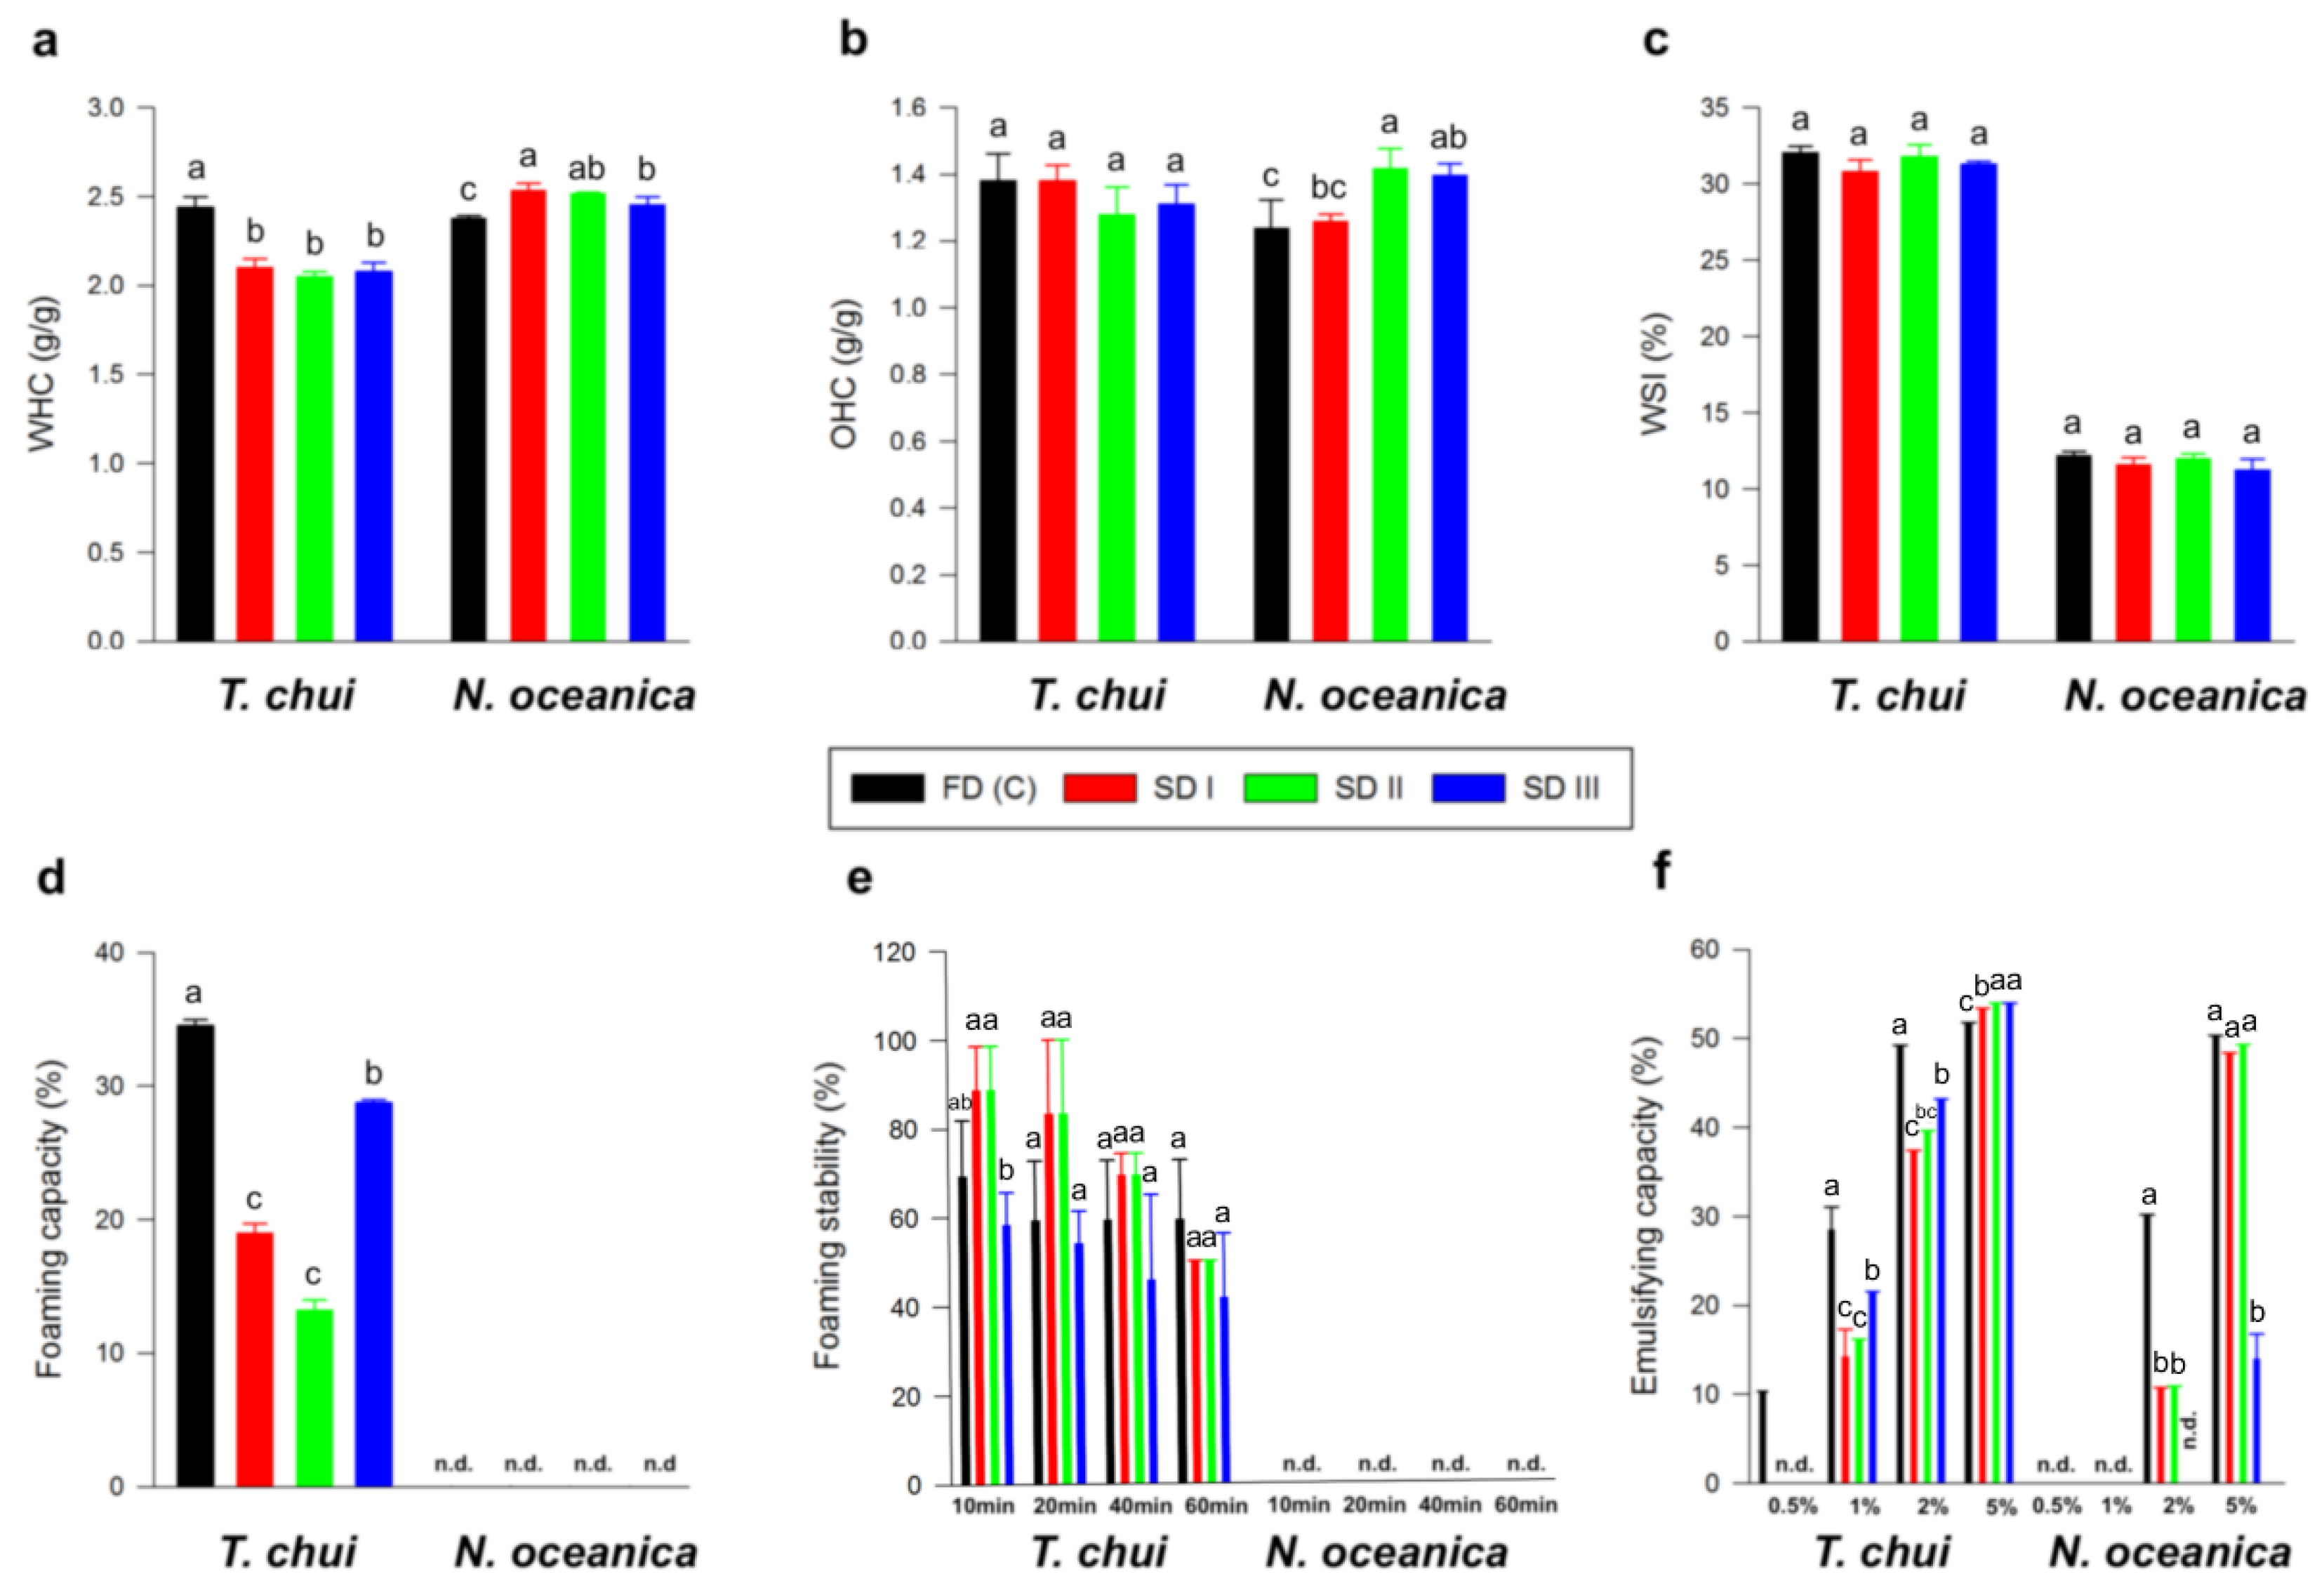
3.2.6. Functional Properties

Analysis of variances (ANOVA) fitted to functional properties (Figure 6) of solar- (SD I, II, and III) and freeze-dried (FDc) biomass revealed minor differences when comparing solar with freeze drying, except for the foaming capacity of T. chui samples. Concerning water-holding capacities (WHC), the FDc of T. chui (2.44 ± 0.06 g/g) was significantly higher than SD (between 2.05 and 2.10 g/g), while, for N. oceanica biomass, the opposite trend was observed, namely, SD samples represented higher values than the FDc. However, for oil-holding capacities (OHC), significant differences were only found for the FDc N. oceanica samples (1.26 ± 0.02 g/g) as compared with SD II (1.42 ± 0.06 g/g) and III (1.40 ± 0.03 g/g). The water-solubility index (WSI) showed no significant differences between each algae sample. Regarding foaming capacity, freeze-dried T. chui biomass showed significantly higher values (34.55 ± 3.33%) than SD I (18.98 ± 3.44%), SD II (18.98 ± 0.00%), and SD III (28.77 ± 0.00%). No foaming-capacity values were detected for solar- and freeze-dried N. oceanica biomass. Foaming stability decreased with time, and only non-significant differences were detected between the samples. For N. oceanica, no foaming-stability values were detected. Regarding emulsifying capacity, only the FDc of T. chui showed detectable values (10.36 ± 0.00%) at suspensions with 0.5% (g/100 mL) microalgal biomass. Emulsifying capacities for all SD and FDc samples of T. chui and N. oceanica increased gradually from suspensions with 1% to 5%. The FDc of T. chui showed significantly higher values for suspensions with 1 and 2% (28.50 ± 2.59% and 49.23 ± 0.00%, respectively) than all SD aliquots, ranging between 14.24–21.58% and 37.37–43.16%, respectively. Statistical analyses for suspensions with 5% T. chui biomass showed significantly lower values for the FDc group (51.82 ± 0.00%) than SD. Emulsifying capacities for 0.5% and 1% suspension of N. oceanica were not detected. Regarding suspensions with 2%, the FDc of N. oceanica showed significantly higher values (30.20 ± 0.00%) than SD I (10.75 ± 0.00%) and SD II (10.96 ± 0.00%). Moreover, minor differences between 5% suspensions of FDc and SD I and II (49.31–50.33%) compared with SD III (13.97 ± 2.79%) were found.

4. Discussion

Solar dryers of different types are gaining considerable attention for being economical and sustainable options for drying microalgal biomass [8,30,55,56]. Hence, this study investigated the effect of an indirect and hybrid solar dryer on biomass quality compared to a conventional freeze dryer (control), known to be one of the gentlest drying technologies for microalgae, preserving micro- and macronutrients [26,57]. Solar drying reduced moisture contents of Tetraselmis chui (initially 78.22 ± 0.01%) and Nannochloropsis oceanica (initially 72.09 ± 0.01%) down to 7.04 ± 0.61 and 8.76 ± 1.76%, respectively. This moisture reduction required a maximum residence time of 28 h, while freeze drying required 2-fold longer residence times (60 h). On the other hand, freeze-dried T. chui biomass showed significantly lower moisture contents (3.51 ± 0.41%), whereas N. oceanica biomass averaged 0.66 ± 0.33%. Since the drying process of frozen microalgal paste is controlled by the diffusion rate of internal moisture to the surface layer [58,59], species-dependent variations in biochemical profiles and rheological properties most likely influenced the drying behavior of the tested biomass. Moreover, case hardening of the biomass, which prevents core moisture from evaporating, might have also influenced the drying rates [57,59]. These phenomena could also explain the significantly higher final moisture contents of solar-dried N. oceanica than T. chui and of all solar-dried samples compared to freeze-dried.
No significant differences between the applied drying technologies were detected when comparing protein, lipid, and carbohydrate contents of T. chui and N. oceanica biomass. These observations vary from Stramarkou et al. [60], who found higher protein contents in freeze-dried Chlorella vulgaris biomass, or Desmorieux and Hernandez [61], who found lower protein contents in freeze-dried Spirulina sp. biomass as compared to solar-dried biomass. Nevertheless, our results highlight the potential of the indirect and hybrid solar-drying technology as a preferred option to dry biomass for general uses, such as human nutrition.
Conversely, significant differences were found for pigment contents when comparing solar- and freeze-dried biomass. Violaxanthin, neoxanthin, and zeaxanthin contents in solar-dried biomass were significantly lower than freeze-dried biomass, which might be an effect of heat-induced degradation of these xanthophylls [62]. Certain pigments are generally sensitive to heat, oxygen, and light, leading to degradation [63]. These differences were not found for lutein and β-carotene, which could be related to the higher heat resistance of these carotenoids and the higher concentrations present in the biomass [64]. Compared to the freeze-dried control group, higher lutein amounts were detected for SD I and SD II, whereas all solar-dried samples showed higher β-carotene contents. This suggests that dehydration in an indirect, hybrid solar dryer may improve the carotenoid extractability of microalgal biomass [64]. However, significantly lower total chlorophyll contents were recovered from solar-dried T. chui and N. oceanica biomass compared with the freeze-dried control group, which is in accordance with the studies done by Shekarabi et al. [65]. Chlorophyll degradation is probably a result of oxidative degradation and has previously been found in other studies that evaluated different drying technologies for Chlorella vulgaris, Chlorella (Auxenochlorella) pyrenoidosa, and Nannochloropsis (Microchloropsis) salina [60,64].
Regarding the fatty acid profile, the solar-dried biomass showed no significant differences for saturated, monounsaturated, and polyunsaturated (PUFAs) fatty acids compared to the freeze-dried control. In particular, no significant differences were found for the omega-3 fatty acid EPA, suggesting that no oxidation of this PUFA occurred during the solar-drying process. Therefore, the indirect and hybrid solar-drying technology appears promising for preserving high-value fats.
Except for sodium contents, only minor differences among the mineral profiles of solar- (SD I, II, and III) and freeze-dried T. chui and N. oceanica biomass were detected (<10% among all samples). This may be explained by the high-temperature stabilities of the analyzed macro- and micronutrients. These minor differences may originate from the high accuracy of the ICP-OES method used or the natural variance across the different dryings (significant differences between trials). Sodium was the most abundant mineral in T. chui and N. oceanica biomass, with 56.67–68.99 mg/g and 27.14–37.58 mg/g, respectively. According to the European Regulation (EC) No. 1169/2011 [66], this results in salt contents of approx. 14.17–17.25 g/100 g for T. chui and 6.78–9.40 g/100 g for N. oceanica. These amounts are relatively high compared to other foods, e.g., cheddar cheese (6.54 mg/g sodium, 1.64 g/100 g salt) or tortilla chips (4.29 mg/g sodium, 1.1 g/100 g salt) [67]. Adults’ daily salt reference intake is 6.00 g, limiting marine microalgae consumption. Nevertheless, biomass can be pre-treated to remove the excess salt (diafiltration, for instance). The significant differences of up to 27.80% in sodium contents between solar- and freeze-dried biomass are most likely related to the experimental drying setups and the used materials. While plain stainless-steel trays were used for freeze drying, elevated grids (on top of stainless-steel trays) were used for solar drying. Since exudate can run off through the grids, sodium ions in the water might have separated from the remaining biomass by gravity. However, the results suggest that hybrid solar-drying technologies can be applied to preserve mineral element contents along the drying process of microalgal biomasses.
Since the solar-drying device uptakes unfiltered ambient air through the intake ventilation, the risk of external contamination was given. Compared to freeze drying, total counts of microbial activities were significantly higher for the solar-dried biomass of both microalgae species. Moreover, no (xerophilic) molds were detected in the freeze-dried samples, contrary to some solar-dried samples, albeit in low numbers (<102 CFU/g). These differences in microbial load might be attributed to higher temperatures during the solar-drying process (23.91–49.30 °C), which are optimal conditions for mesophilic microbial growth compared to sub-zero temperatures during freeze drying [68]. Varying weather conditions during the solar-drying experiment could also explain the significant differences in total counts between the solar-dried samples (SD I, II, and III) for N. oceanica. Although the solar-dried biomass generally revealed higher microbial activity, no E. coli was detected in any sample, which is usually a primary indicator for (fecal) food contaminations [69]. According to Uyttendaele et al. [70], dried plant products (Category 4F) are considered safe if xerophilic mold counts do not exceed 3 × 10⁵ CFU/g (target: 3 × 10⁴ CFU/g) and E. coli counts are below 3 × 10³ CFU/g (target: 3 × 10² CFU/g). Therefore, this study’s solar- and freeze-dried microalgal biomass can be considered food safe because they meet the aforementioned target guidelines.
Regarding techno-functional properties, T. chui and N. oceanica biomass showed significant differences in their water- and oil-holding capacities, which can be explained by slight differences in their composition (protein and water contents) [71]. The foaming and emulsifying capacities of freeze-dried T. chui samples were significantly higher than those of SD samples. In addition, N. oceanica biomass did not show any foaming and emulsifying properties at low concentrations. The stabilization of foams and emulsions is achieved by proteins and long-chain carbohydrates interacting with hydrophobic and hydrophilic groups, which causes a reduction in the interfacial tension between air and water or water and oil, respectively [72,73,74]. In addition to the adsorption of a sufficient concentration on the interface, which depends on the viscosity of the system and the solubility of the molecules, the emulsification technique, the surface hydrophobicity, and the molecular flexibility also have an impact on the formation of stable interfacial films [75,76]. Furthermore, the density and distribution of charge at the interface influence the electrostatic repulsion, which must be in balance with attractive forces, such as van der Waals forces, for the emulsion or foam to remain stable [77]. From this, it can be deduced that N. oceanica may (1) be less adsorbed at the interphase than T. chui due to the lower water solubility index, (2) have lower long-chain carbohydrate or protein contents on its cell wall, (3) have an improper surface charge, and/or (4) be too inflexible or unable to form several bonds along the interface due to its small size. Additionally, Guil-Guerrero et al. [78] found significantly lower emulsification capacities for defatted Nannochloropsis spp. compared to soybean flower, Porphyridium cruentum, and Phaeodactylum tricornutum. Interestingly, differences in foaming capacity and emulsion capacity resulting from solar drying cannot be related to the higher drying temperature compared to freeze drying because higher temperatures are known to yield better foaming and emulsifying properties as a result of protein unfolding exposing hydrophobic sites, which improves interfacial activity [79,80]. Slight differences between the FDc and SD samples again may be explained by compositional differences and changes on the molecular surface. Further analyses, e.g., determination of molecular hydrophobicity, surface charge, and interfacial tension, are needed to clarify if conformational changes in the cell walls were caused by the different drying techniques. Overall, solar drying can be considered a promising technology to provide high-quality biomass for food and feed markets.

5. Conclusions

The present study showed the promising application of an indirect and hybrid solar dryer to dehydrate microalgal paste. Since freeze drying is a reliable technology in the microalgae industry, multiple quality parameters of solar-dried Tetraselmis chui and Nannochloropsis oceanica biomass were compared with freeze-dried samples (control). We investigated the effect of both drying methods and observed that total proteins, carbohydrates, fats, and fatty acid profiles showed no significant differences. Conversely, freeze-dried samples showed significantly higher contents of certain pigments (e.g., total chlorophylls), while deviations of mineral profiles remained minor. Microbial safety analyses indicated that solar-dried microalgal biomass could be considered food grade. In comparison with freeze-dried biomass, solar-dried biomass showed significant differences in water- and oil-holding capacities, as well as in foaming and emulsifying capacities. Moreover, the foaming stability of T. chui biomass differed significantly between the SD and FDc. In summary, the obtained results appear promising for using solar-dried T. chui and N. oceanica biomass for innovative and sustainable food and feed products. Further research should address the energy efficiency of the solar dryer since only approx. 1.36% of the maximum capacity of the solar dryer was used in this study. Nevertheless, our study demonstrates that indirect hybrid solar drying holds a high potential to be a viable alternative to conventional drying technologies, such as freeze or spray drying.

Author Contributions

Conceptualization, B.S., S.N., P.S.C.S., A.C., H.P., J.V., J.N. and A.M.C.R.; methodology, B.S., S.N., P.S.C.S., A.C., H.P., J.N. and A.M.C.R.; investigation, B.S., S.N., S.V.D.W., I.B.M., C.R.V.B., M.-C.B., E.J., A.C. and A.M.C.R.; data curation, B.S., P.S.C.S., S.V.D.W., G.V.R., L.M.S., I.B.M., C.R.V.B., M.-C.B., E.J. and A.M.C.R.; writing—original draft preparation, B.S., S.N., P.S.C.S., S.V.D.W., G.V.R., L.M.S., I.B.M., C.R.V.B., M.-C.B., E.J. and A.M.C.R.; writing—review and editing, B.S., P.S.C.S., S.V.D.W., G.V.R., L.M.S., I.B.M., C.R.V.B., M.-C.B., E.J., A.C., H.P.; J.V., J.N. and A.M.C.R.; visualization, B.S.; supervision, P.S.C.S., G.V.R., A.C., H.P., J.V., J.N. and A.M.C.R. All authors have read and agreed to the published version of the manuscript.

Funding

The present work was funded by the ProFuture project (2019–2023 “Microalgae protein-rich ingredients for the food and feed of the future”). ProFuture project has received funding from the European Union’s Horizon 2020 research and innovation programme under grant agreement No 862980.

Institutional Review Board Statement

Not applicable.

Informed Consent Statement

Not applicable.

Data Availability Statement

Data is contained within the article.

Acknowledgments

We would like to acknowledge the production and R&D teams of Necton S.A. for assisting the study.

Conflicts of Interest

The authors declare no conflict of interest.

References

  1. FAO. The State of Food Security and Nutrition in the World. Available online: www.fao.org.http://www.fao.org/state-of-food-security-nutrition/en/ (accessed on 13 February 2022).
  2. Crist, E.; Mora, C.; Engelman, R. The Interaction of Human Population, Food Production, and Biodiversity Protection. Science 2017, 356, 260–264. [Google Scholar] [CrossRef] [PubMed]
  3. Lynch, H.; Johnston, C.; Wharton, C. Plant-Based Diets: Considerations for Environmental Impact, Protein Quality, and Exercise Performance. Nutrients 2018, 10, 1841. [Google Scholar] [CrossRef] [PubMed] [Green Version]
  4. Joyce, A.; Dixon, S.; Comfort, J.; Hallett, J. Reducing the Environmental Impact of Dietary Choice: Perspectives from a Behavioural and Social Change Approach. J. Environ. Public Health 2012, 2012, 1–7. [Google Scholar] [CrossRef] [PubMed]
  5. Rzymski, P.; Kulus, M.; Jankowski, M.; Dompe, C.; Bryl, R.; Petitte, J.N.; Kempisty, B.; Mozdziak, P. COVID-19 Pandemic Is a Call to Search for Alternative Protein Sources as Food and Feed: A Review of Possibilities. Nutrients 2021, 13, 150. [Google Scholar] [CrossRef] [PubMed]
  6. Sexton, A.E.; Garnett, T.; Lorimer, J. Framing the Future of Food: The Contested Promises of Alternative Proteins. Environ. Plann. E 2019, 2, 47–72. [Google Scholar] [CrossRef] [Green Version]
  7. Dragone, G.; Fernandes, B.; Vicente, A.A.; Teixeira, J.A. Third Generation Biofuels from Microalgae. In Current Research, Technology and Education Topics in Applied Microbiology and Microbial Biotechnology; Mendez-Vilas, A., Ed.; Formatex: Badajos, Spain, 2010; pp. 1355–1366. [Google Scholar]
  8. Guo, Z.; Liu, Y.; Guo, H.; Yan, S.; Mu, J. Microalgae Cultivation Using an Aquaculture Wastewater as Growth Medium for Biomass and Biofuel Production. J. Environ. Sci. 2013, 25, S85–S88. [Google Scholar] [CrossRef]
  9. Lam, M.K.; Lee, K.T. Microalgae Biofuels: A Critical Review of Issues, Problems and the Way Forward. Biotechnol. Adv. 2012, 30, 673–690. [Google Scholar] [CrossRef] [PubMed]
  10. Coêlho, D.d.F.; Tundisi, L.L.; Cerqueira, K.S.; da Silva Rodrigues, J.R.; Mazzola, P.G.; Tambourgi, E.B.; de Souza, R.R. Microalgae: Cultivation Aspects and Bioactive Compounds. Braz. Arch. Biol. Technol. 2019, 62, e19180343. [Google Scholar] [CrossRef]
  11. Yadav, G.; Dubey, B.K.; Sen, R. A Comparative Life Cycle Assessment of Microalgae Production by CO2 Sequestration from Flue Gas in Outdoor Raceway Ponds under Batch and Semi-Continuous Regime. J. Clean. Prod. 2020, 258, 120703. [Google Scholar] [CrossRef]
  12. Vrenna, M.; Peruccio, P.P.; Liu, X.; Zhong, F.; Sun, Y. Microalgae as Future Superfoods: Fostering Adoption through Practice-Based Design Research. Sustainability 2021, 13, 2848. [Google Scholar] [CrossRef]
  13. Yadav, D.K.; Singh, A.; Agrawal, V.; Yadav, N. Algal Biomass: A Natural Resource of High-Value Biomolecules. In Bioprospecting of Plant Biodiversity for Industrial Molecules; Upadhyay, S.K., Singh, S.P., Eds.; Wiley: Hoboken, NJ, USA, 2021; pp. 303–334. [Google Scholar]
  14. Barkia, I.; Saari, N.; Manning, S.R. Microalgae for High-Value Products Towards Human Health and Nutrition. Mar. Drugs 2019, 17, 304. [Google Scholar] [CrossRef] [PubMed] [Green Version]
  15. Torres-Tiji, Y.; Fields, F.J.; Mayfield, S.P. Microalgae as a Future Food Source. Biotechnol. Adv. 2020, 41, 107536. [Google Scholar] [CrossRef] [PubMed]
  16. Lafarga, T. Effect of Microalgal Biomass Incorporation into Foods: Nutritional and Sensorial Attributes of the End Products. Algal Res. 2019, 41, 101566. [Google Scholar] [CrossRef]
  17. Pereira, H.; Sardinha, M.; Santos, T.; Gouveia, L.; Barreira, L.; Dias, J.; Varela, J. Incorporation of Defatted Microalgal Biomass (Tetraselmis sp. CTP4) at the Expense of Soybean Meal as a Feed Ingredient for Juvenile Gilthead Seabream (Sparus Aurata). Algal Res. 2020, 47, 101869. [Google Scholar] [CrossRef]
  18. Cavonius, L.R.; Albers, E.; Undeland, I. In Vitro Bioaccessibility of Proteins and Lipids of PH-Shift Processed Nannochloropsis Oculata Microalga. Food Funct. 2016, 7, 2016–2024. [Google Scholar] [CrossRef] [Green Version]
  19. Ye, C.; Mu, D.; Horowitz, N.; Xue, Z.; Chen, J.; Xue, M.; Zhou, Y.; Klutts, M.; Zhou, W. Life Cycle Assessment of Industrial Scale Production of Spirulina Tablets. Algal Res. 2018, 34, 154–163. [Google Scholar] [CrossRef]
  20. Pienkos, P.T.; Darzins, A. The Promise and Challenges of Microalgal-Derived Biofuels. Biofuel. Bioprod. Bior. 2009, 3, 431–440. [Google Scholar] [CrossRef]
  21. Porcelli, R.; Dotto, F.; Pezzolesi, L.; Marazza, D.; Greggio, N.; Righi, S. Comparative Life Cycle Assessment of Microalgae Cultivation for Non-Energy Purposes Using Different Carbon Dioxide Sources. Sci. Total Environ. 2020, 721, 137714. [Google Scholar] [CrossRef] [PubMed]
  22. Fasaei, F.; Bitter, J.H.; Slegers, P.M.; van Boxtel, A.J.B. Techno-Economic Evaluation of Microalgae Harvesting and Dewatering Systems. Algal Res. 2018, 31, 347–362. [Google Scholar] [CrossRef]
  23. Chen, C.-L.; Chang, J.-S.; Lee, D.-J. Dewatering and Drying Methods for Microalgae. Dry. Technol. 2015, 33, 443–454. [Google Scholar] [CrossRef]
  24. Ryckebosch, E.; Muylaert, K.; Eeckhout, M.; Ruyssen, T.; Foubert, I. Influence of Drying and Storage on Lipid and Carotenoid Stability of the Microalga Phaeodactylum tricornutum. J. Agric. Food Chem. 2011, 59, 11063–11069. [Google Scholar] [CrossRef] [PubMed]
  25. Medipally, S.R.; Yusoff, F.M.; Banerjee, S.; Shariff, M. Microalgae as Sustainable Renewable Energy Feedstock for Biofuel Production. Biomed. Res. Int. 2015, 2015, 519513. [Google Scholar] [CrossRef] [PubMed]
  26. Nail, S.L.; Jiang, S.; Chongprasert, S.; Knopp, S.A. Fundamentals of Freeze-Drying. In Development and Manufacture of Protein Pharmaceuticals; Nail, S.L., Akers, M.J., Eds.; Springer: Boston, MA, USA, 2002; Volume 14, pp. 281–360. [Google Scholar] [CrossRef]
  27. Nelson, J.A. Postharvest Degradation of Microalgae: Effect of Temperature and Water Activity. Masters’ Thesis, Utah State University, Logan, UT, USA, 2015. [Google Scholar] [CrossRef]
  28. Hosseinizand, H.; Lim, C.J.; Webb, E.; Sokhansanj, S. Economic Analysis of Drying Microalgae Chlorella in a Conveyor Belt Dryer with Recycled Heat from a Power Plant. Appl. Therm. Eng. 2017, 124, 525–532. [Google Scholar] [CrossRef]
  29. Uduman, N.; Qi, Y.; Danquah, M.K.; Forde, G.M.; Hoadley, A. Dewatering of Microalgal Cultures: A Major Bottleneck to Algae-Based Fuels. J. Renew. Sustain. Energy 2010, 2, 012701. [Google Scholar] [CrossRef]
  30. Silva, J.P.S.; Veloso, C.R.R.; de Souza Barrozo, M.A.; Vieira, L.G.M. Indirect Solar Drying of Spirulina Platensis and the Effect of Operating Conditions on Product Quality. Algal Res. 2021, 60, 102521. [Google Scholar] [CrossRef]
  31. Lingayat, A.B.; Chandramohan, V.P.; Raju, V.R.K.; Meda, V. A Review on Indirect Type Solar Dryers for Agricultural Crops—Dryer Setup, Its Performance, Energy Storage and Important Highlights. Appl. Energy. 2020, 258, 114005. [Google Scholar] [CrossRef]
  32. Mohammed, S.; Edna, M.; Siraj, K. The Effect of Traditional and Improved Solar Drying Methods on the Sensory Quality and Nutritional Composition of Fruits: A Case of Mangoes and Pineapples. Heliyon 2020, 6, e04163. [Google Scholar] [CrossRef] [PubMed]
  33. Foegeding, E.A.; Davis, J.P. Food Protein Functionality: A Comprehensive Approach. Food Hydrocoll. 2011, 25, 1853–1864. [Google Scholar] [CrossRef]
  34. dos Reis, M.G.; Ribeiro, A. Conversion Factors and General Equations Applied in Agricultural and Forest Meteorology. Agrom. 2020, 27, 227–258. [Google Scholar] [CrossRef] [Green Version]
  35. Barreira, L.; Resek, E.; Rodrigues, M.J.; Rocha, M.I.; Pereira, H.; Bandarra, N.; da Silva, M.M.; Varela, J.; Custódio, L. Halophytes: Gourmet Food with Nutritional Health Benefits? J. Food Compos. Anal. 2017, 59, 35–42. [Google Scholar] [CrossRef]
  36. Uslu, L.; Durmaz, Y.; Duyar, H.A.; Bandarra, N.M. Fatty Acids, α-Tocopherol and Proximate Composition of Four Red Macroalgae in the Sinop Bay (Turkey). J. Anim. Vet. Adv. 2013, 12, 29–33. [Google Scholar]
  37. AOAC. Official Methods of Analysis of the Association of Analytical, 21st ed.; AOAC: Washington, DC, USA, 2019. [Google Scholar]
  38. Bligh, E.G.G.; Dyer, W.J.J. A Rapid Method of Total Lipid Extraction and Purification. Can. J. Biochem. Phys. 1959, 37, 911–917. [Google Scholar] [CrossRef]
  39. Pereira, H.; Barreira, L.; Mozes, A.; Florindo, C.; Polo, C.; Duarte, C.V.; Custódio, L.; Varela, J. Microplate-Based High Throughput Screening Procedure for the Isolation of Lipid-Rich Marine Microalgae. Biotechnol. Biofuels. 2011, 4, 61. [Google Scholar] [CrossRef] [PubMed] [Green Version]
  40. Schüler, L.M.; Bombo, G.; Duarte, P.; Santos, T.F.; Maia, I.B.; Pinheiro, F.; Marques, J.; Jacinto, R.; Schulze, P.S.C.; Pereira, H.; et al. Carotenoid Biosynthetic Gene Expression, Pigment and n-3 Fatty Acid Contents in Carotenoid-Rich Tetraselmis striata CTP4 Strains under Heat Stress Combined with High Light. Bioresource Technol. 2021, 337, 125385. [Google Scholar] [CrossRef] [PubMed]
  41. Lichtenthaler, H.K.; Wellburn, A.R. Determinations of Total Carotenoids and Chlorophylls a and b of Leaf Extracts in Different Solvents. Biochem. Soc. Trans. 1983, 11, 591–592. [Google Scholar] [CrossRef] [Green Version]
  42. Vollenweider, R.A. Photosynthetic pigments. In A Manual on Methods for Measuring Primary Production in Aquatic Environments; Vollenweider, R.A., Ed.; Blackwell Scientific Pub.: Oxford, UK, 1974; pp. 21–26. [Google Scholar]
  43. Lepage, G.; Roy, C.C. Improved Recovery of Fatty Acid through Direct Transesterification without Prior Extraction or Purification. J. Lipid Res. 1984, 25, 1391–1396. [Google Scholar] [CrossRef]
  44. Pereira, H.; Barreira, L.; Figueiredo, F.; Custódio, L.; Vizetto-Duarte, C.; Polo, C.; Rešek, E.; Engelen, A.; Varela, J. Polyunsaturated Fatty Acids of Marine Macroalgae: Potential for Nutritional and Pharmaceutical Applications. Mar. Drugs 2012, 10, 1920–1935. [Google Scholar] [CrossRef] [PubMed] [Green Version]
  45. Bundesamt für Verbraucherschutz und Lebensmittelsicherheit (BVL). Amtliche Sammlung von Untersuchungsverfahren Nach § 64 LFGB; Bundesamt für Verbraucherschutz und Lebensmittelsicherheit: Braunschweig, Germany, 2014. [Google Scholar]
  46. EN 15510:2007; Animal Feeding Stuffs—Determination of Calcium, Sodium, Phosphorus, Magnesium, Potassium, Iron, Zinc, Copper, Manganese, Cobalt, Molybdenum, Arsenic, Lead and Cadmium by ICP-AES. Beuth Verlag: Berlin, Germany, 2007. (In German)
  47. ISO 4833-2:2013; Microbiology of the Food Chain—Horizontal Method for the Enumeration of Microorganisms—Part 2: Colony Count at 30 °C by the Surface Plating Technique. ISO: Geneva, Switzerland, 2013. Available online: Https://Www.Iso.Org/Standard/59509.Html (accessed on 17 January 2022).
  48. ISO 7954:1987; Microbiology—General Guidance for Enumeration of Yeasts and Moulds—Colony Count Technique at 25 °C. ISO: Geneva, Switzerland, 1987. Available online: Https://Www.Iso.Org/Standard/14931.Html (accessed on 17 January 2022).
  49. ISO 21527-2:2008; Microbiology of Food and Animal Feeding Stuffs—Horizontal Method for the Enumeration of Yeasts and Moulds—Part 2: Colony Count Technique in Products with Water Activity Less than or Equal to 0.95. ISO: Geneva, Switzerland, 2008. Available online: Https://Www.Iso.Org/Standard/38276.Html (accessed on 17 January 2022).
  50. ISO 16649-2:2001; Microbiology of Food and Animal Feeding Stuffs—Horizontal Method for the Enumeration of Beta-Glucuronidase-Positive Escherichia Coli—Part 2: Colony-Count Technique at 44 °C Using 5-Bromo-4-Chloro-3-Indolyl Beta-D-Glucuronide. ISO: Geneva, Switzerland, 2001. Available online: Https://Www.Iso.Org/Standard/29824.Html (accessed on 17 January 2022).
  51. Stone, A.K.; Avarmenko, N.A.; Warkentin, T.D.; Nickerson, M.T. Functional Properties of Protein Isolates from Different Pea Cultivars. Food Sci. Biotechnol. 2015, 24, 827–833. [Google Scholar] [CrossRef]
  52. Xiong, T.; Xiong, W.; Ge, M.; Xia, J.; Li, B.; Chen, Y. Effect of High Intensity Ultrasound on Structure and Foaming Properties of Pea Protein Isolate. Food Res. Int. 2018, 109, 260–267. [Google Scholar] [CrossRef] [PubMed]
  53. Calderón-Castro, A.; Vega-García, M.O.; de Jesús Zazueta-Morales, J.; Fitch-Vargas, P.R.; Carrillo-López, A.; Gutiérrez-Dorado, R.; Limón-Valenzuela, V.; Aguilar-Palazuelos, E. Effect of Extrusion Process on the Functional Properties of High Amylose Corn Starch Edible Films and Its Application in Mango (Mangifera indica L.) Cv. Tommy Atkins. J. Food Sci. Technol. 2018, 55, 905–914. [Google Scholar] [CrossRef] [PubMed]
  54. Benelhadj, S.; Gharsallaoui, A.; Degraeve, P.; Attia, H.; Ghorbel, D. Effect of P.H. on the Functional Properties of Arthrospira (Spirulina) Platensis Protein Isolate. Food Chem. 2016, 194, 1056–1063. [Google Scholar] [CrossRef]
  55. Gouveia, L.; Graça, S.; Sousa, C.; Ambrosano, L.; Ribeiro, B.; Botrel, E.P.; Neto, P.C.; Ferreira, A.F.; Silva, C.M. Microalgae Biomass Production Using Wastewater: Treatment and Costs. Algal Res. 2016, 16, 167–176. [Google Scholar] [CrossRef]
  56. Balasubramanian, R.K.; Yen Doan, T.T.; Obbard, J.P. Factors Affecting Cellular Lipid Extraction from Marine Microalgae. Chem. Eng. J. 2013, 215–216, 929–936. [Google Scholar] [CrossRef]
  57. Lin, L.P. Microstructure of Spray-Dried and Freeze-Dried Microalgal Powders. Food Struct. 1985, 4, 17. [Google Scholar]
  58. Agbede, O.O.; Oke, E.O.; Akinfenwa, S.I.; Wahab, K.T.; Ogundipe, S.; Aworanti, O.A.; Arinkoola, A.O.; Agarry, S.E.; Ogunleye, O.O.; Osuolale, F.N.; et al. Thin Layer Drying of Green Microalgae (Chlorella sp.) Paste Biomass: Drying Characteristics, Energy Requirement and Mathematical Modeling. Bioresource Technol. Rep. 2020, 11, 100467. [Google Scholar] [CrossRef]
  59. Viswanathan, T.; Mani, S.; Das, K.C.; Chinnasamy, S.; Bhatnagar, A. Drying Characteristics of a Microalgae Consortium Developed for Biofuels Production. Trans. ASABE 2011, 54, 2245–2252. [Google Scholar] [CrossRef]
  60. Stramarkou, M.; Papadaki, S.; Kyriakopoulou, K.; Krokida, M. Effect of Drying and Extraction Conditions on the Recovery of Bioactive Compounds from Chlorella vulgaris. J. Appl. Phycol. 2017, 29, 2947–2960. [Google Scholar] [CrossRef]
  61. Desmorieux, H.; Hernandez, F. Biochemical and Physical Criteria of Spirulina after Different Drying Processes. In Proceedings of the 14th International Drying Symposium (IDS 2004), Sào Paulo, Brazil, 22–25 August 2004; pp. 900–907. [Google Scholar]
  62. Takaichi, S. Carotenoids in Algae: Distributions, Biosyntheses and Functions. Mar. Drugs 2011, 9, 1101–1118. [Google Scholar] [CrossRef]
  63. Neves, F.d.F.; Demarco, M.; Tribuzi, G. Drying and Quality of Microalgal Powders for Human Alimentation. In Microalgae—From Physiology to Application, 1st ed.; Vítová, M., Ed.; IntechOpen: London, UK, 2019. [Google Scholar]
  64. Ljubic, A.; Safafar, H.; Jacobsen, C. Recovery of Microalgal Biomass and Metabolites from Homogenized, Swirl Flash-Dried Microalgae. J. Appl. Phycol. 2019, 31, 2355–2363. [Google Scholar] [CrossRef] [Green Version]
  65. Hosseini Shekarabi, S.P. Biochemical composition and fatty acid profile of the marine microalga Isochrysis galbana dried with different methods. J. Microbiol. Biotechnol. Food Sci. 2019, 9, 521–524. [Google Scholar] [CrossRef]
  66. European Parliament and Council of the European Union. Regulation (E.U.) No 1169/2011 of the European Parliament and of the Council of 25 October 2011 on the provision of food information to consumers. Off. J. Eur. Union 2011, 50, 18–63. [Google Scholar]
  67. U.S. Department of Agriculture. Agricultural Research Service. “FoodData Central”. 2019. Available online: https://fdc.nal.usda.gov/ (accessed on 28 February 2022).
  68. Schiraldi, C.; De Rosa, M. Mesophilic Organisms. In Encyclopedia of Membranes; Drioli, E., Giorno, L., Eds.; Springer: Berlin/Heidelberg, Germany, 2014; pp. 1–2. ISBN 978-3-642-40872-4. [Google Scholar]
  69. Doğan-Halkman, H.B.; Çakır, İ.; Keven, F.; Worobo, R.W.; Halkman, A.K. Relationship among Fecal Coliforms and Escherichia Coli in Various Foods. Eur. Food Res. Technol. 2003, 216, 331–334. [Google Scholar] [CrossRef]
  70. Uyttendaele, M.; De Loy-Hendrickx, A.; Vermeulen, A.; Jacxsens, L.; Debevere, J.; Devlieghere, F. Microbiological Guidelines—Support for Interpretation of Microbiological Test Results of Foods; Uyttendaele, M., Ed.; Die Keure Publishing: Bruge, Belgium, 2018; pp. 1–95. [Google Scholar]
  71. Gaiani, C.; Morand, M.; Sanchez, C.; Tehrany, E.A.; Jacquot, M.; Schuck, P.; Jeantet, R.; Scher, J. How Surface Composition of High Milk Proteins Powders Is Influenced by Spray-Drying Temperature. Colloid. Surface. B 2010, 75, 377–384. [Google Scholar] [CrossRef] [PubMed]
  72. Köhler, K.; Schuchmann, H.P. Emulgiertechnik: Grundlagen, Verfahren und Anwendungen, 3rd ed.; Behr’s Verlag: Hamburg, Germany, 2012; pp. 1–527. [Google Scholar]
  73. Walstra, P. Physical Chemistry of Foods; Food Science and Technology; Marcel Dekker: New York, NY, USA, 2003; pp. 41–52. ISBN 978-0-8247-9355-5. [Google Scholar]
  74. Lam, R.S.H.; Nickerson, M.T. Food Proteins: A Review on Their Emulsifying Properties Using a Structure–Function Approach. Food Chem. 2013, 141, 975–984. [Google Scholar] [CrossRef]
  75. Nakai, S.; Ho, L.; Helbig, N.; Kato, A.; Tung, M.A. Relationship Between Hydrophobicity and Emulsifying Properties of Some Plant Proteins. Can. Inst. Food Sci. Technol. J. 1980, 13, 23–27. [Google Scholar] [CrossRef]
  76. Liang, H.-N.; Tang, C.-H. PH-Dependent Emulsifying Properties of Pea Pisum sativum (L.) Proteins. Food Hydrocoll. 2013, 33, 309–319. [Google Scholar] [CrossRef]
  77. McClements, D.J. Food Emulsions: Principles, Practices, and Techniques, 3rd ed.; CRC Press: Boca Raton, FL, USA, 1999; pp. 1–714. [Google Scholar]
  78. Guil-Guerrero, J.L.; Navarro-Juárez, R.; López-Martínez, J.C.; Campra-Madrid, P.; Rebolloso-Fuentes, M. Functional Properties of the Biomass of Three Microalgal Species. J. Food Eng. 2004, 65, 511–517. [Google Scholar] [CrossRef]
  79. Kamath, S.; Huppertz, T.; Houlihan, A.V.; Deeth, H.C. The Influence of Temperature on the Foaming of Milk. Int. Dairy J. 2008, 18, 994–1002. [Google Scholar] [CrossRef]
  80. Raikos, V. Effect of Heat Treatment on Milk Protein Functionality at Emulsion Interfaces. A Review. Food Hydrocoll. 2010, 24, 259–265. [Google Scholar] [CrossRef]
Figure 1. Technical diagram of the solar dryer and the experimental setup: solar drier side view (a), solar drier top view (b), top view of the shelf rack (c), and drying setup scheme (d).
Foods 11 01873 g001
Figure 2. Plotted activity log (SD I, II, and III) of the hybrid solar dryer, including outdoor temperature and humidity obtained from the weather station. The time intervals when the heater (upper panel) or the dehumidifier (lower panel) ran are shown as gray, vertical bars.
Foods 11 01873 g002
Figure 3. Relative moisture loss of solar-dried Tetraselmis chui (circles and dashed lines) and Nannochloropsis oceanica (triangles and solid lines) biomass during three independent drying trials (SD I, II, and III).
Foods 11 01873 g003
Figure 4. Total neoxanthin, violaxanthin, lutein, β-carotene, and total chlorophyll contents of solar- (SD I, II, and III) and freeze-dried (FDc) Tetraselmis chui (a). Total violaxanthin, zeaxanthin, β-carotene, and total chlorophyll contents of solar- (SD I, II, and III) and freeze-dried (FDc) Nannochloropsis oceanica (b). Different letters represent significant differences detected by Tukey’s post hoc range test (HSD, ANOVA). Data points for solar- and freeze-dried samples are shown as mean ± Std Dev (n = 3). Error bars represent standard deviations.
Foods 11 01873 g004
Figure 5. Total counts (PCA; a,d), xerophilic yeasts and molds (b,e), and yeasts and molds (c,f) of solar- (SD I, II, and III) and freeze-dried (FDc) Tetraselmis chui (ac) and Nannochloropsis oceanica (df) biomass. Different letters represent significant differences detected by Tukey’s post hoc range test (HSD, ANOVA). Error bars represent standard deviation (Std Dev). Data points for solar- and freeze-dried samples are shown as mean ± Std Dev (n = 3).
Foods 11 01873 g005
Figure 6. Water-holding capacity (WHC) (a), oil-holding capacity (OHC) (b), water solubility index (WSI) (c), foaming capacity (d), foaming stability (e), and emulsifying capacity (f) of solar- (SD I, II, and III) and freeze-dried (FDc) Tetraselmis chui and Nannochloropsis oceanica biomass. Different letters represent significant differences among samples from the same species detected by Tukey’s post hoc range test (HSD, ANOVA). Error bars represent standard deviation (Std Dev). Data points for solar- and freeze-dried samples are shown as mean ± Std Dev (n = 3). N.d., not detected.
Foods 11 01873 g006
Table 1. Values for indoor and outdoor conditions.
ParametersSD ISD IISD III
Indoor temperature min.–max. (°C)23.9–49.324.3–39.027.4–46.0
Average indoor temperature (°C)35.433.535.3
Indoor humidity min.–max. (%)15.3–41.923.4–47.618.7–46.9
Average indoor humidity (%)28.432.132.2
Outdoor temperature min.–max. (°C)10.9–21.816.2–20.116.7–20.5
Average outdoor temperature (°C)15.6318.2018.21
Outdoor humidity min.–max. (%)51.1–91.746.1–84.051.9–91.6
Average outdoor humidity (%)76.265.876.6
Average solar radiation (Rs; W.m−2)275.3114.1209.9
Table 2. Proximate composition (proteins, total lipids, carbohydrates, and ashes) of solar- (SD I, II, and III) and freeze-dried (control, FDc) Tetraselmis chui and Nannochloropsis oceanica biomass. Different letters represent significant differences among samples from the same species detected by Tukey’s post hoc range test (HSD, ANOVA). Data points for all samples are shown as mean ± standard deviation (Std Dev) (n = 3).
Proximate Composition (%)Tetraselmis chuiNannochloropsis oceanica
SD
I
SD
II
SD
III

FDc
SD
I
SD
II
SD
III

FDc
Proteins38.53 ± 0.78 a37.80 ± 0.64 a38.01 ± 0.88 a37.93 ± 0.11 a46.72 ± 0.31 a 46.01 ± 0.94 a48.09 ± 0.41 a47.39 ± 2.18 a
Total lipids18.61 ± 1.46 a18.40 ± 1.62 a18.24 ± 0.50 a16.75 ± 1.62 a21.46 ± 2.78 a24.69 ± 1.95 a23.25 ± 1.97 a24.25 ± 3.37 a
Carbohydrates16.73 ± 1.27 a 16.06 ± 1.05 a 16.27 ± 1.18 a 15.49 ± 1.78 a17.11 ± 2.54 a 14.69 ± 2.61 a 14.24 ± 1.62 a 15.28 ± 4.25 a
Ashes28.46 ± 0.06 a30.44 ± 0.06 a30.24 ± 0.05 a30.86 ± 0.10 a14.71 ± 0.28 b14.62 ± 0.45 b14.42 ± 0.15 b13.08 ± 0.16 a
Table 3. Fatty acid profile of solar- (SD I, II, and III) and freeze-dried (FDc) Tetraselmis chui and Nannochloropsis oceanica biomass. No significant differences among samples from the same species were detected by Tukey’s post hoc range test (HSD, ANOVA). Data points for solar- and freeze-dried samples are shown as mean ± Std Dev (n = 3). N.d., not detected; SFA, saturated fatty acids; MUFA, monounsaturated fatty acids; PUFA, polyunsaturated fatty acids.
Fatty Acid
(%)
Tetraselmis chuiNannochloropsis oceanica
SD ISD IISD IIIFDcSD ISD IISD IIIFDc
C14:01.12 ± 0.221.07 ± 0.151.05 ± 0.171.16 ± 0.184.85 ± 1.674.18 ± 0.744.20 ± 0.774.22 ± 0.61
C16:020.48 ± 1.8820.58 ± 1.8720.67 ± 1.6822.41 ± 1.9119.95 ± 5.6018.09 ± 3.5217.79 ± 3.2918.11 ± 2.89
∑ SFA21.59 ± 2.1021.65 ± 2.0321.72 ± 1.8423.57 ± 2.0924.80 ± 7.2622.28 ± 4.2621.99 ± 4.0622.32 ± 3.50
C16:1n-93.96 ± 1.923.84 ± 1.203.02 ± 1.974.12 ± 1.2225.30 ± 7.6822.03 ± 3.3321.80 ± 3.4321.94 ± 2.85
C18:1n-917.29 ± 0.7317.78 ± 0.4917.96 ± 0.6016.09 ± 4.423.61 ± 0.632.70 ± 0.802.95 ± 0.713.37±0.29
C20:11.14 ± 0.681.20 ± 0.701.42 ± 0.341.48 ± 0.33n.d.n.d.n.d.n.d.
∑ MUFA22.39 ± 3.3422.82 ± 2.4022.40 ± 2.9121.69 ± 5.9728.9 ± 8.3124.74 ± 4.1324.75 ± 4.1425.31 ± 3.14
C16:3n-31.56 ± 0.201.57 ± 0.161.58 ± 0.201.58 ± 0.17n.d.n.d.n.d.n.d.
C16:4n-319.32 ± 1.0119.43 ± 0.5219.87 ± 0.9619.49 ± 1.10n.d.n.d.n.d.n.d.
C18:2n-65.09 ± 0.185.17 ± 0.115.24 ± 0.205.36 ± 0.404.61 ± 0.893.89 ± 0.343.92 ± 0.394.22 ± 0.21
C18:3n-65.08 ± 0.395.06 ± 0.295.17 ± 0.345.14 ± 0.58n.d.n.d.n.d.n.d.
C18:4n-39.03 ± 0.679.01 ± 0.389.19 ± 0.578.89 ± 0.92n.d.n.d.n.d.n.d.
C20:4n-61.84 ± 0.261.70 ± 0.231.62 ± 0.241.62 ± 0.2910.31 ± 0.668.69 ± 1.249.20 ± 0.609.31 ± 0.34
C20:5n-312.12 ± 3.5011.47 ± 3.1511.15 ± 3.3110.62 ± 3.5828.72 ± 9.2237.95 ± 6.7037.29 ± 7.2536.37 ± 7.27
∑ PUFA54.04 ± 6.1153.42 ± 4.8553.82 ± 5.8352.69 ± 7.0543.64 ± 10.7650.53 ± 8.2850.41 ± 8.2449.89 ± 7.82
Table 4. Mineral contents of solar- (SD I, II, and III) and freeze-dried (FDc) Tetraselmis chui and Nannochloropsis oceanica biomass. Different letters represent significant differences among samples from the same species detected by Tukey’s post hoc range test (HSD, ANOVA). Data are shown as mean ± Std Dev (n=3).
Minerals
(mg/g)
Tetraselmis chuiNannochloropsis oceanica
SD ISD IISD IIIFDcSD ISD IISD IIIFDc
Phosphorus10.73 ± 0.06 b10.67 ± 0.02 ab10.75 ± 0.08 b10.53 ± 0.07 a11.44 ± 0.07 a11.51 ± 0.06 a11.48 ± 0.08 a11.26 ± 0.34 a
Sodium56.67 ± 2.28 d59.29 ± 1.57 c60.28 ± 0.04 b68.99 ± 0.45 a30.22 ± 0.44 b28.84 ± 0.16 a27.14 ± 0.80 a37.58 ± 0.24 a
Potassium17.28 ± 0.16 a17.73 ± 0.04 a17.64 ± 0.39 a18.54 ± 0.03 b5.07 ± 0.03 ab5.09 ± 0.09 b4.92 ± 0.06 a5.42 ± 0.03 c
Magnesium10.98 ± 0.07 a10.91 ± 0.12 a11.04 ± 0.10 a11.46 ± 0.07 b7.92 ± 0.08 a7.93 ± 0.07 a7.96 ± 0.12 a8.10 ± 0.03 a
Calcium16.46 ± 0.07 b16.37 ± 0.16 a16.02 ± 0.23 a16.33 ± 0.06 ab4.10 ± 0.03 b4.06 ± 0.03 ab4.05 ± 0.04 ab4.01 ± 0.04 a
Iron2.75 ± 1.55 b2.75 ± 0.31 b2.78 ± 0.78 b2.68 ± 1.92 a0.72 ± 2.71 a0.70 ± 0.91 a0.72 ± 0.06 a0.70 ± 0.48 a
Copper0.01 ± 0.00 ab0.01 ± 0.00 ab0.01 ± 0.00 b0.01 ± 0.00 a0.02 ± 0.00 a0.02 ± 0.00 a0.02 ± 0.00 b0.02 ± 0.00 a
Manganese0.11 ± 0.00 c0.10 ± 0.00 b0.11 ± 0.00 c0.10 ± 0.00 a0.04 ± 0.00 a0.04 ± 0.00 a0.05 ± 0.00 b0.04 ± 0.00 a
Publisher’s Note: MDPI stays neutral with regard to jurisdictional claims in published maps and institutional affiliations.

