
Chia (Salvia hispanica L.) Flour and Oil Ameliorate Metabolic Disorders in the Liver of Rats Fed a High-Fat and High Fructose Diet

 , , , , and
Abstract
:1. Introduction
2. Materials and Methods
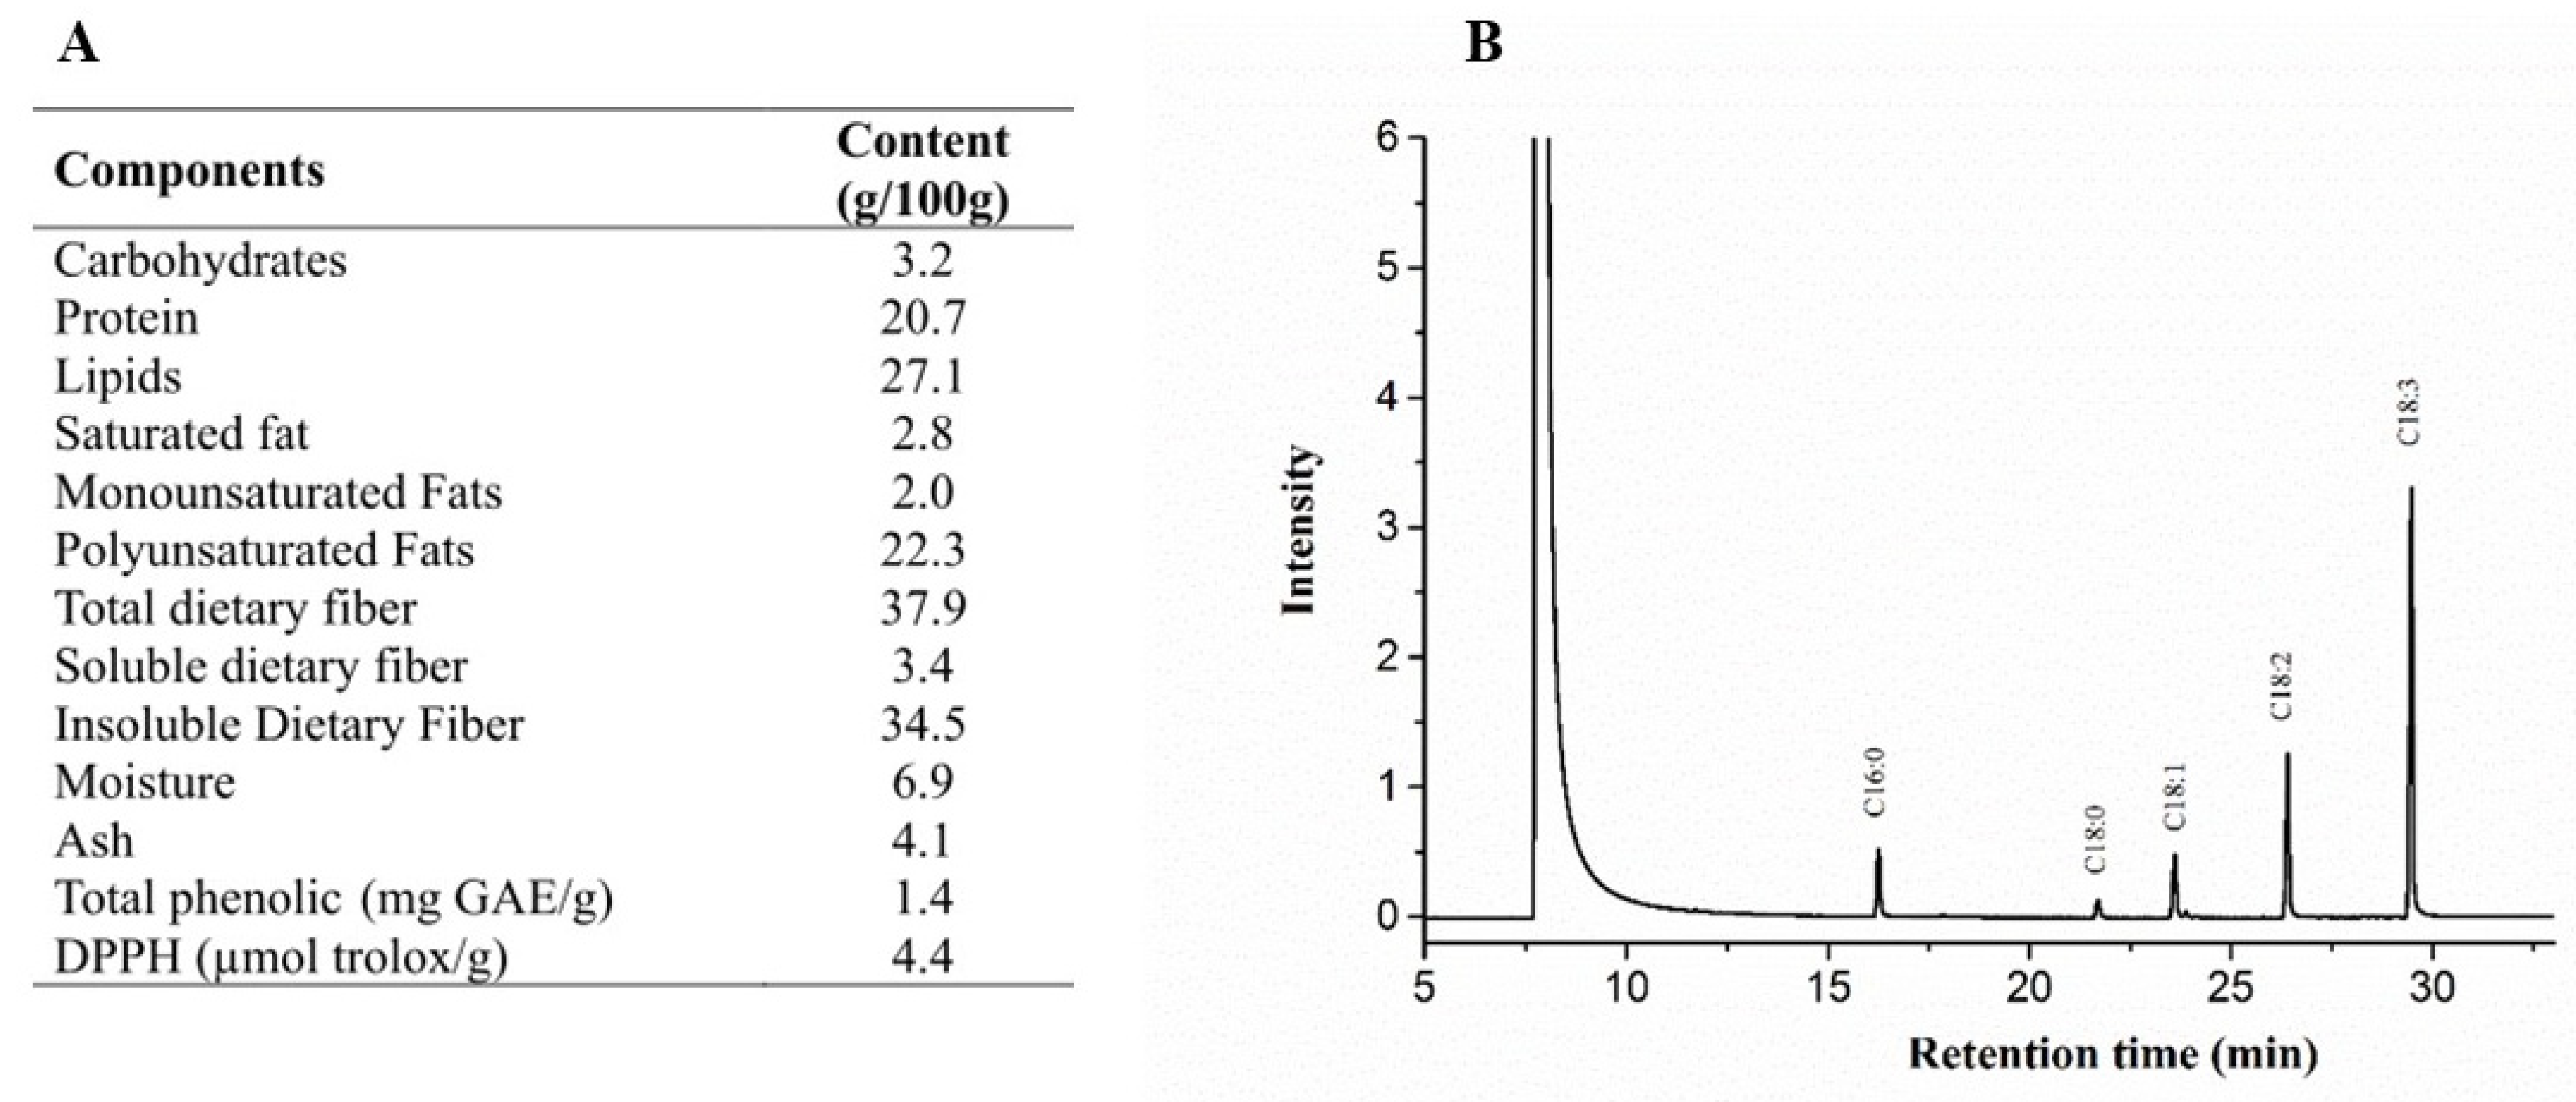
2.1. Chia Characterization
2.1.1. Raw Material
2.1.2. Chia Oil Extraction
2.1.3. Chia Proximate Composition
2.1.4. Determination of Total Antioxidant Capacity and Total Phenolic of Chia Flour
2.1.5. Peroxide and Acidity Content, and Fatty Acid Profile of Chia Oil
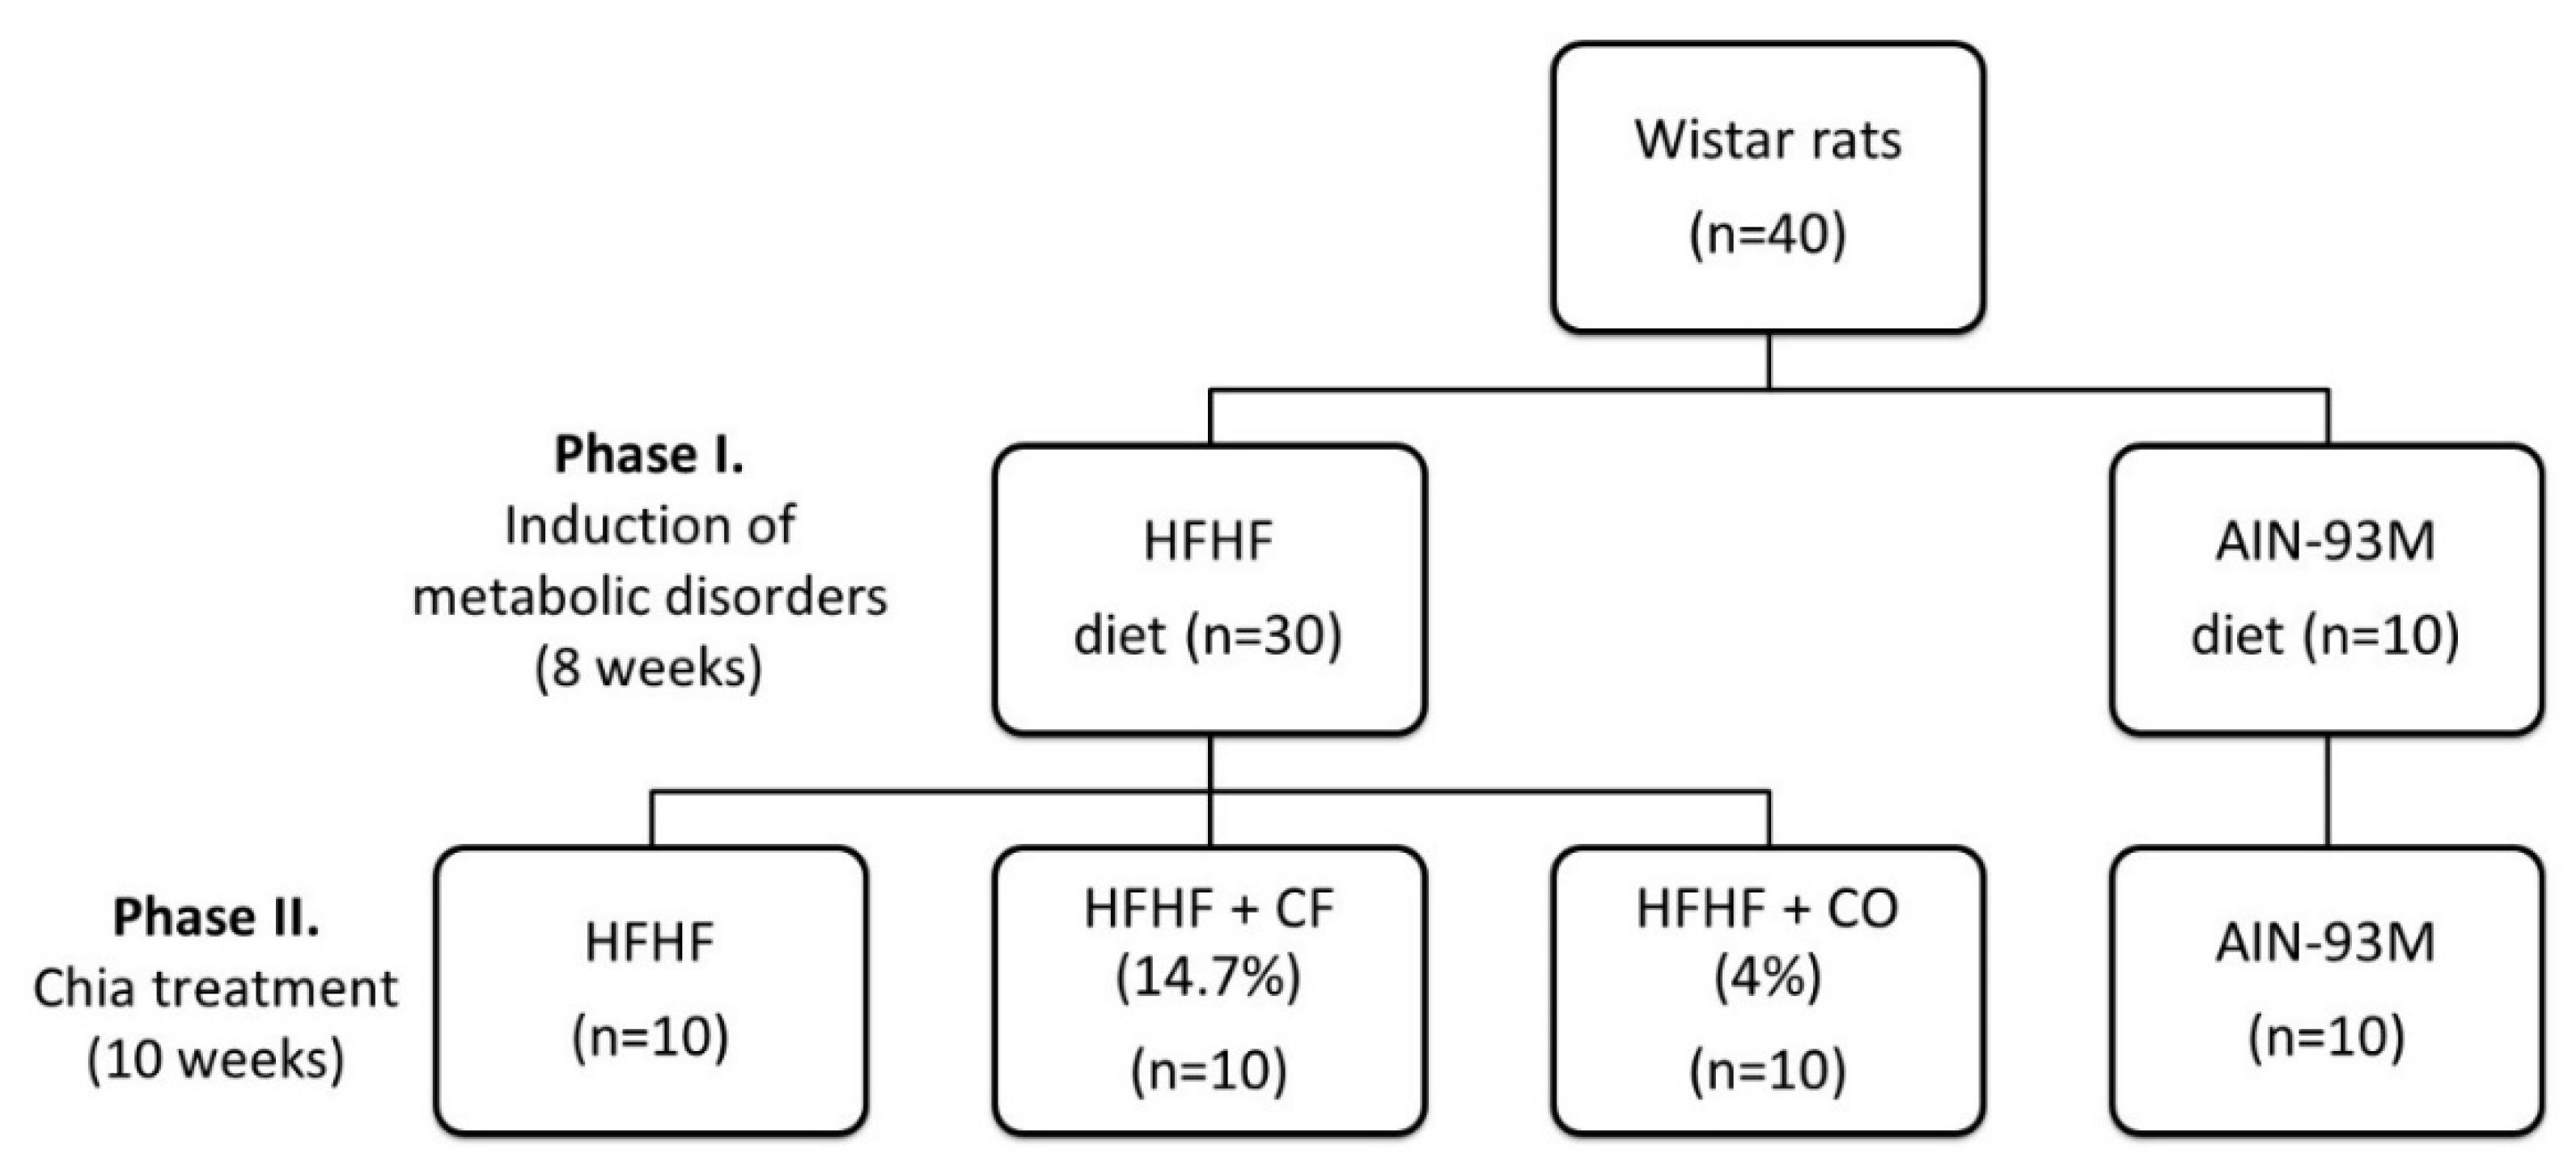
2.2. Animals and Experimental Design
2.2.1. Animals
2.2.2. Experimental Design and Diets
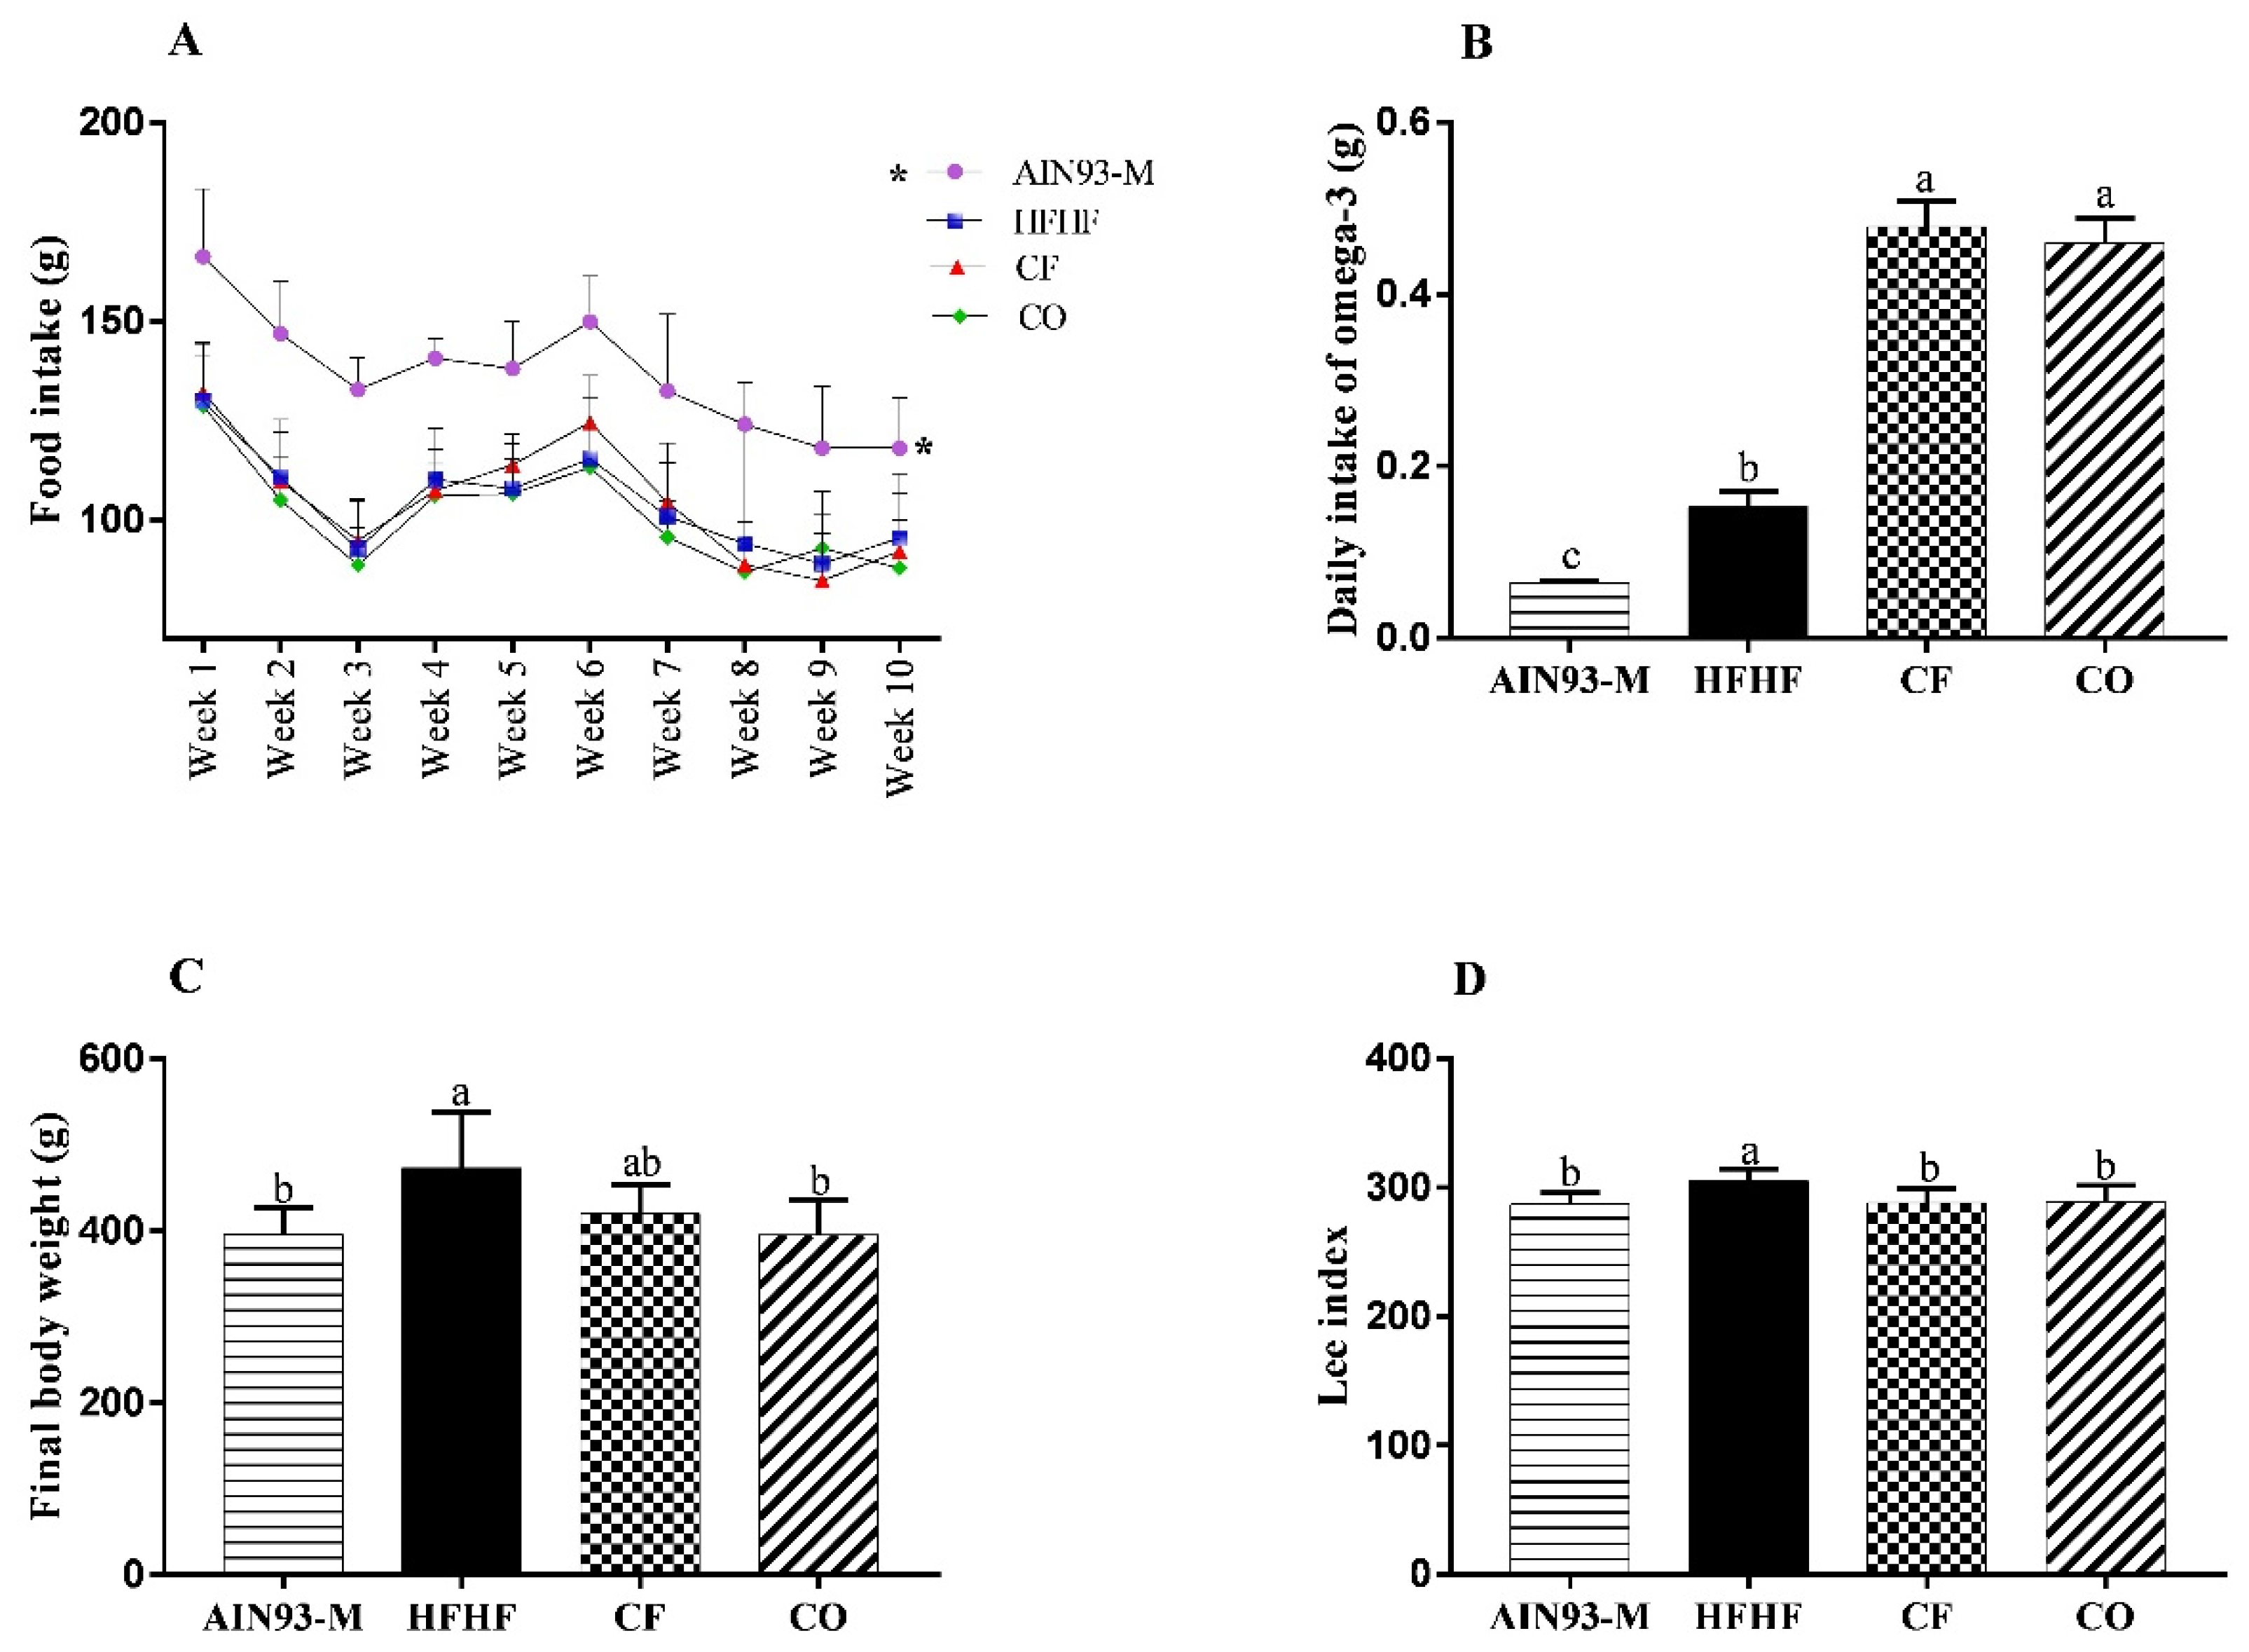
2.2.3. Food Intake, Biometric Parameters, and Euthanasia
2.3. Biochemical Analysis
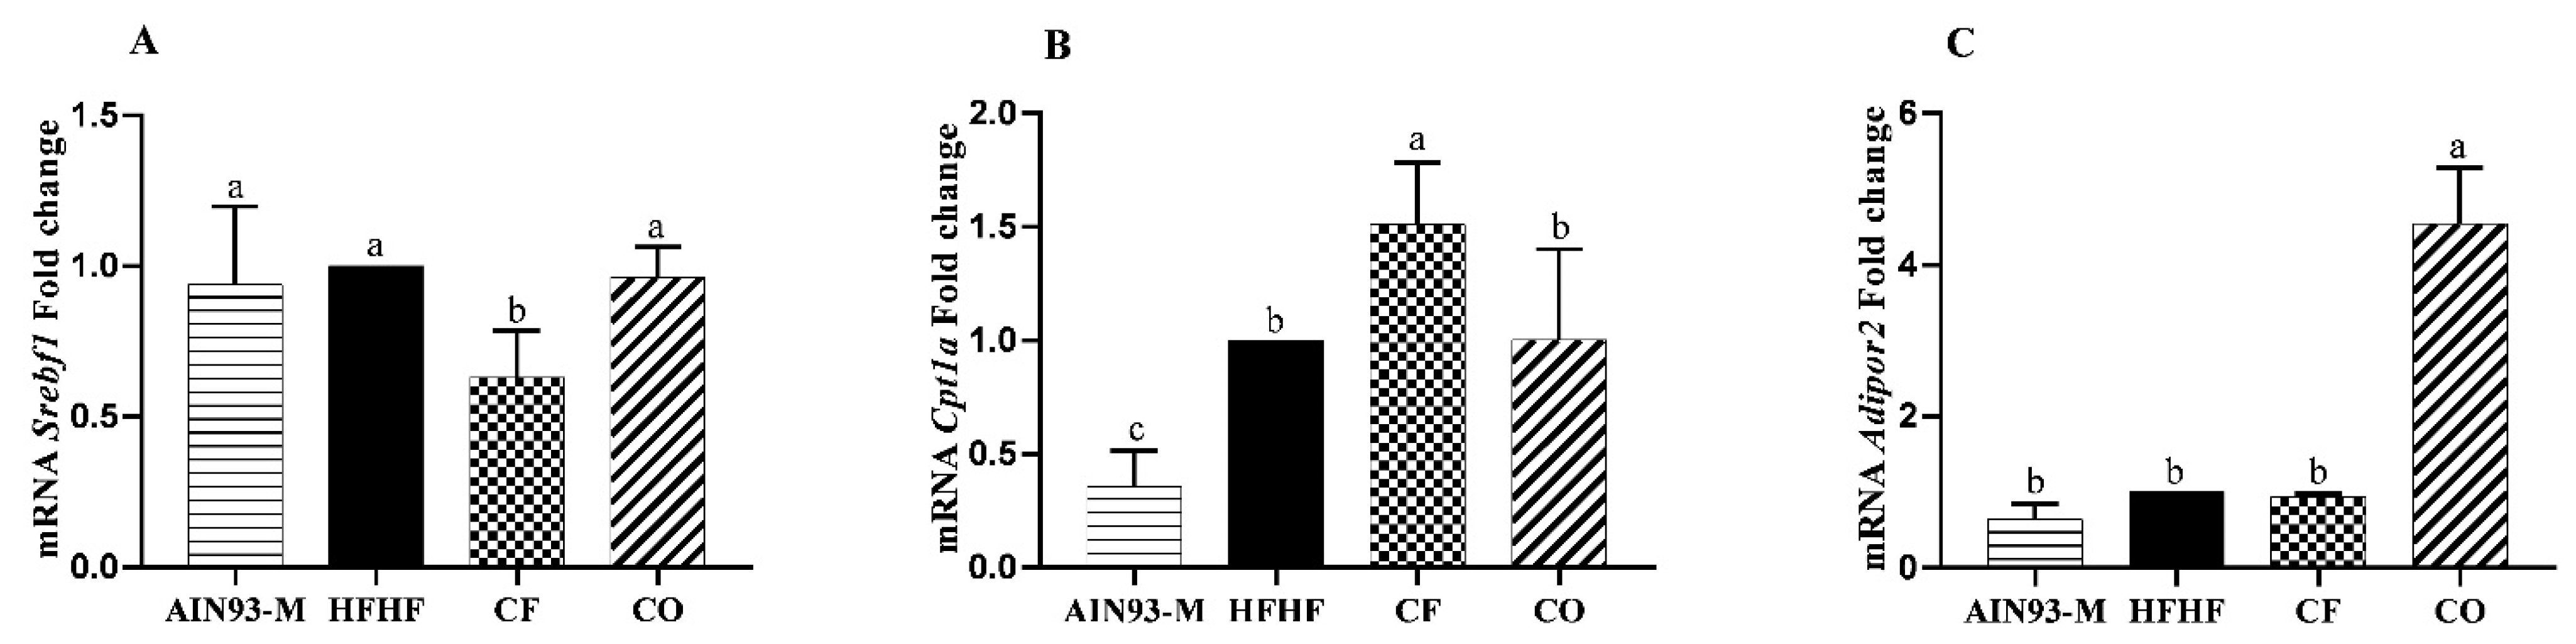
2.4. Gene Expression in the Liver
2.5. Determination of Pro and Anti-Inflammatory Liver Proteins
2.6. Evaluation of Oxidative Stress
2.6.1. Total Antioxidant Capacity
2.6.2. Superoxide Dismutase
2.6.3. Nitric Oxide
2.7. Liver Histomorphometry
2.8. Statistical Analyses
3. Results
3.1. Chemical Composition of Chia
3.2. Effect of Chia on Food Intake, and Murinometric Measures
3.3. Effect of Chia on Biochemical Parameters
3.4. Gene Expression in the Liver
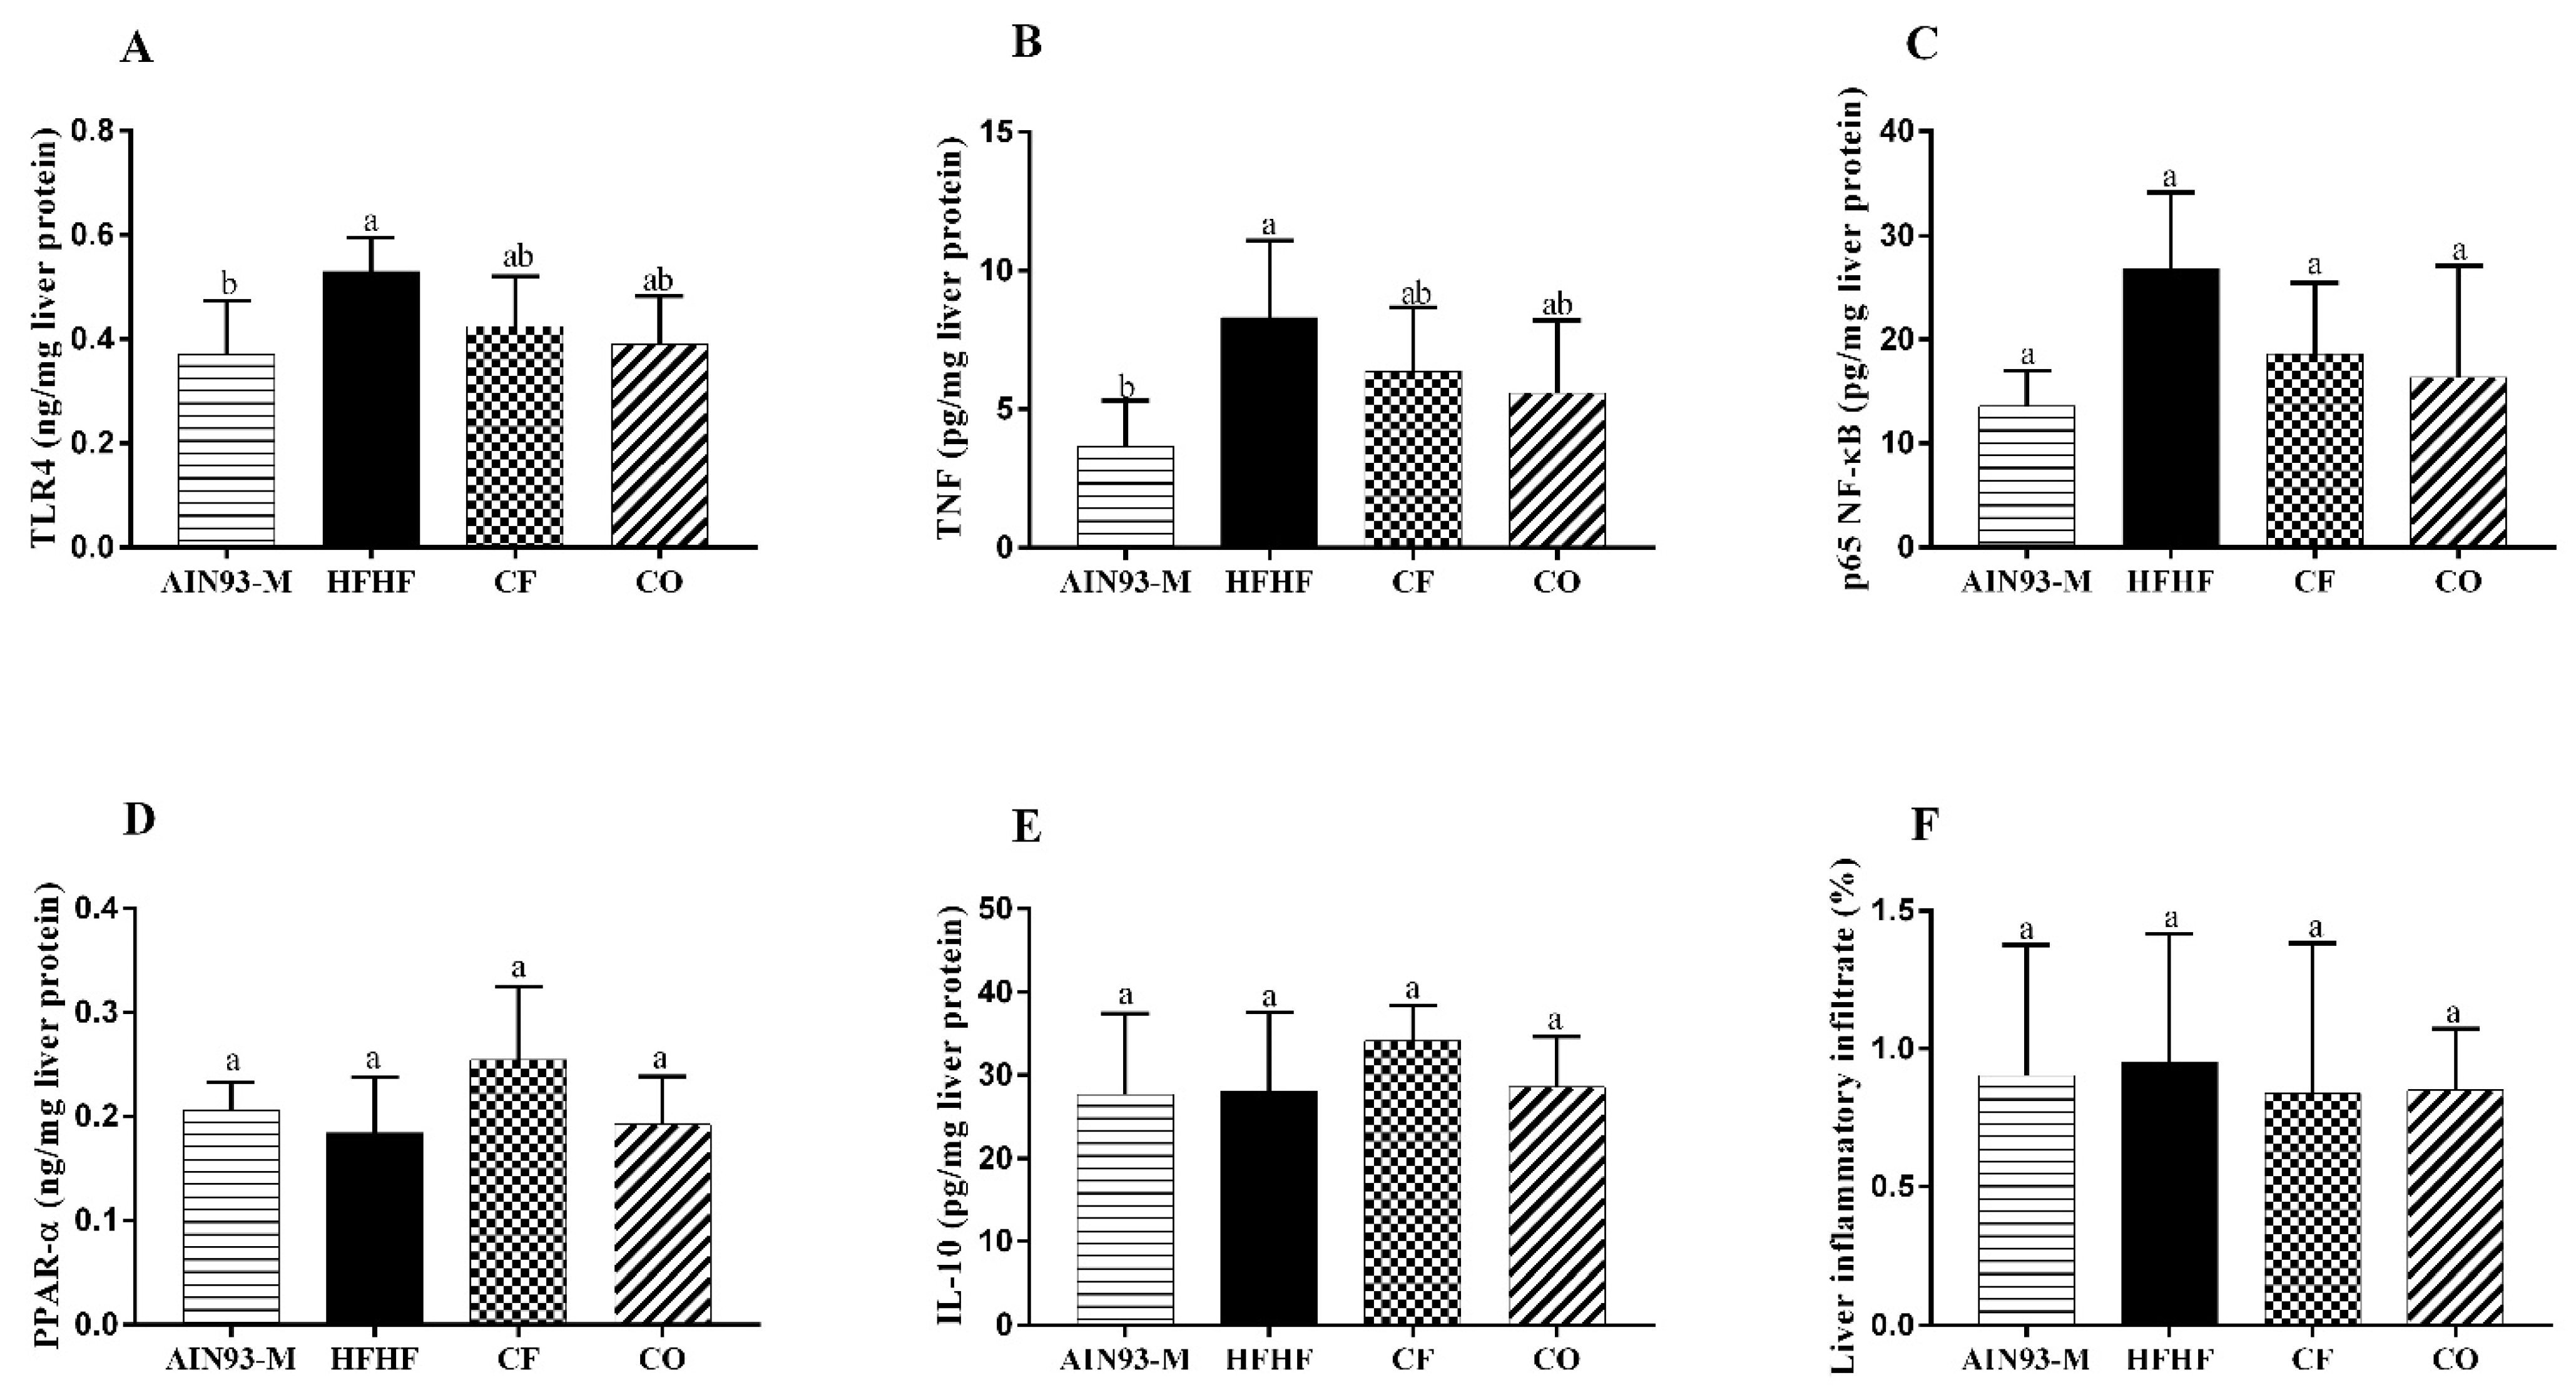
3.5. Effect of Chia on Pro and Anti-Inflammatory Proteins in the Liver
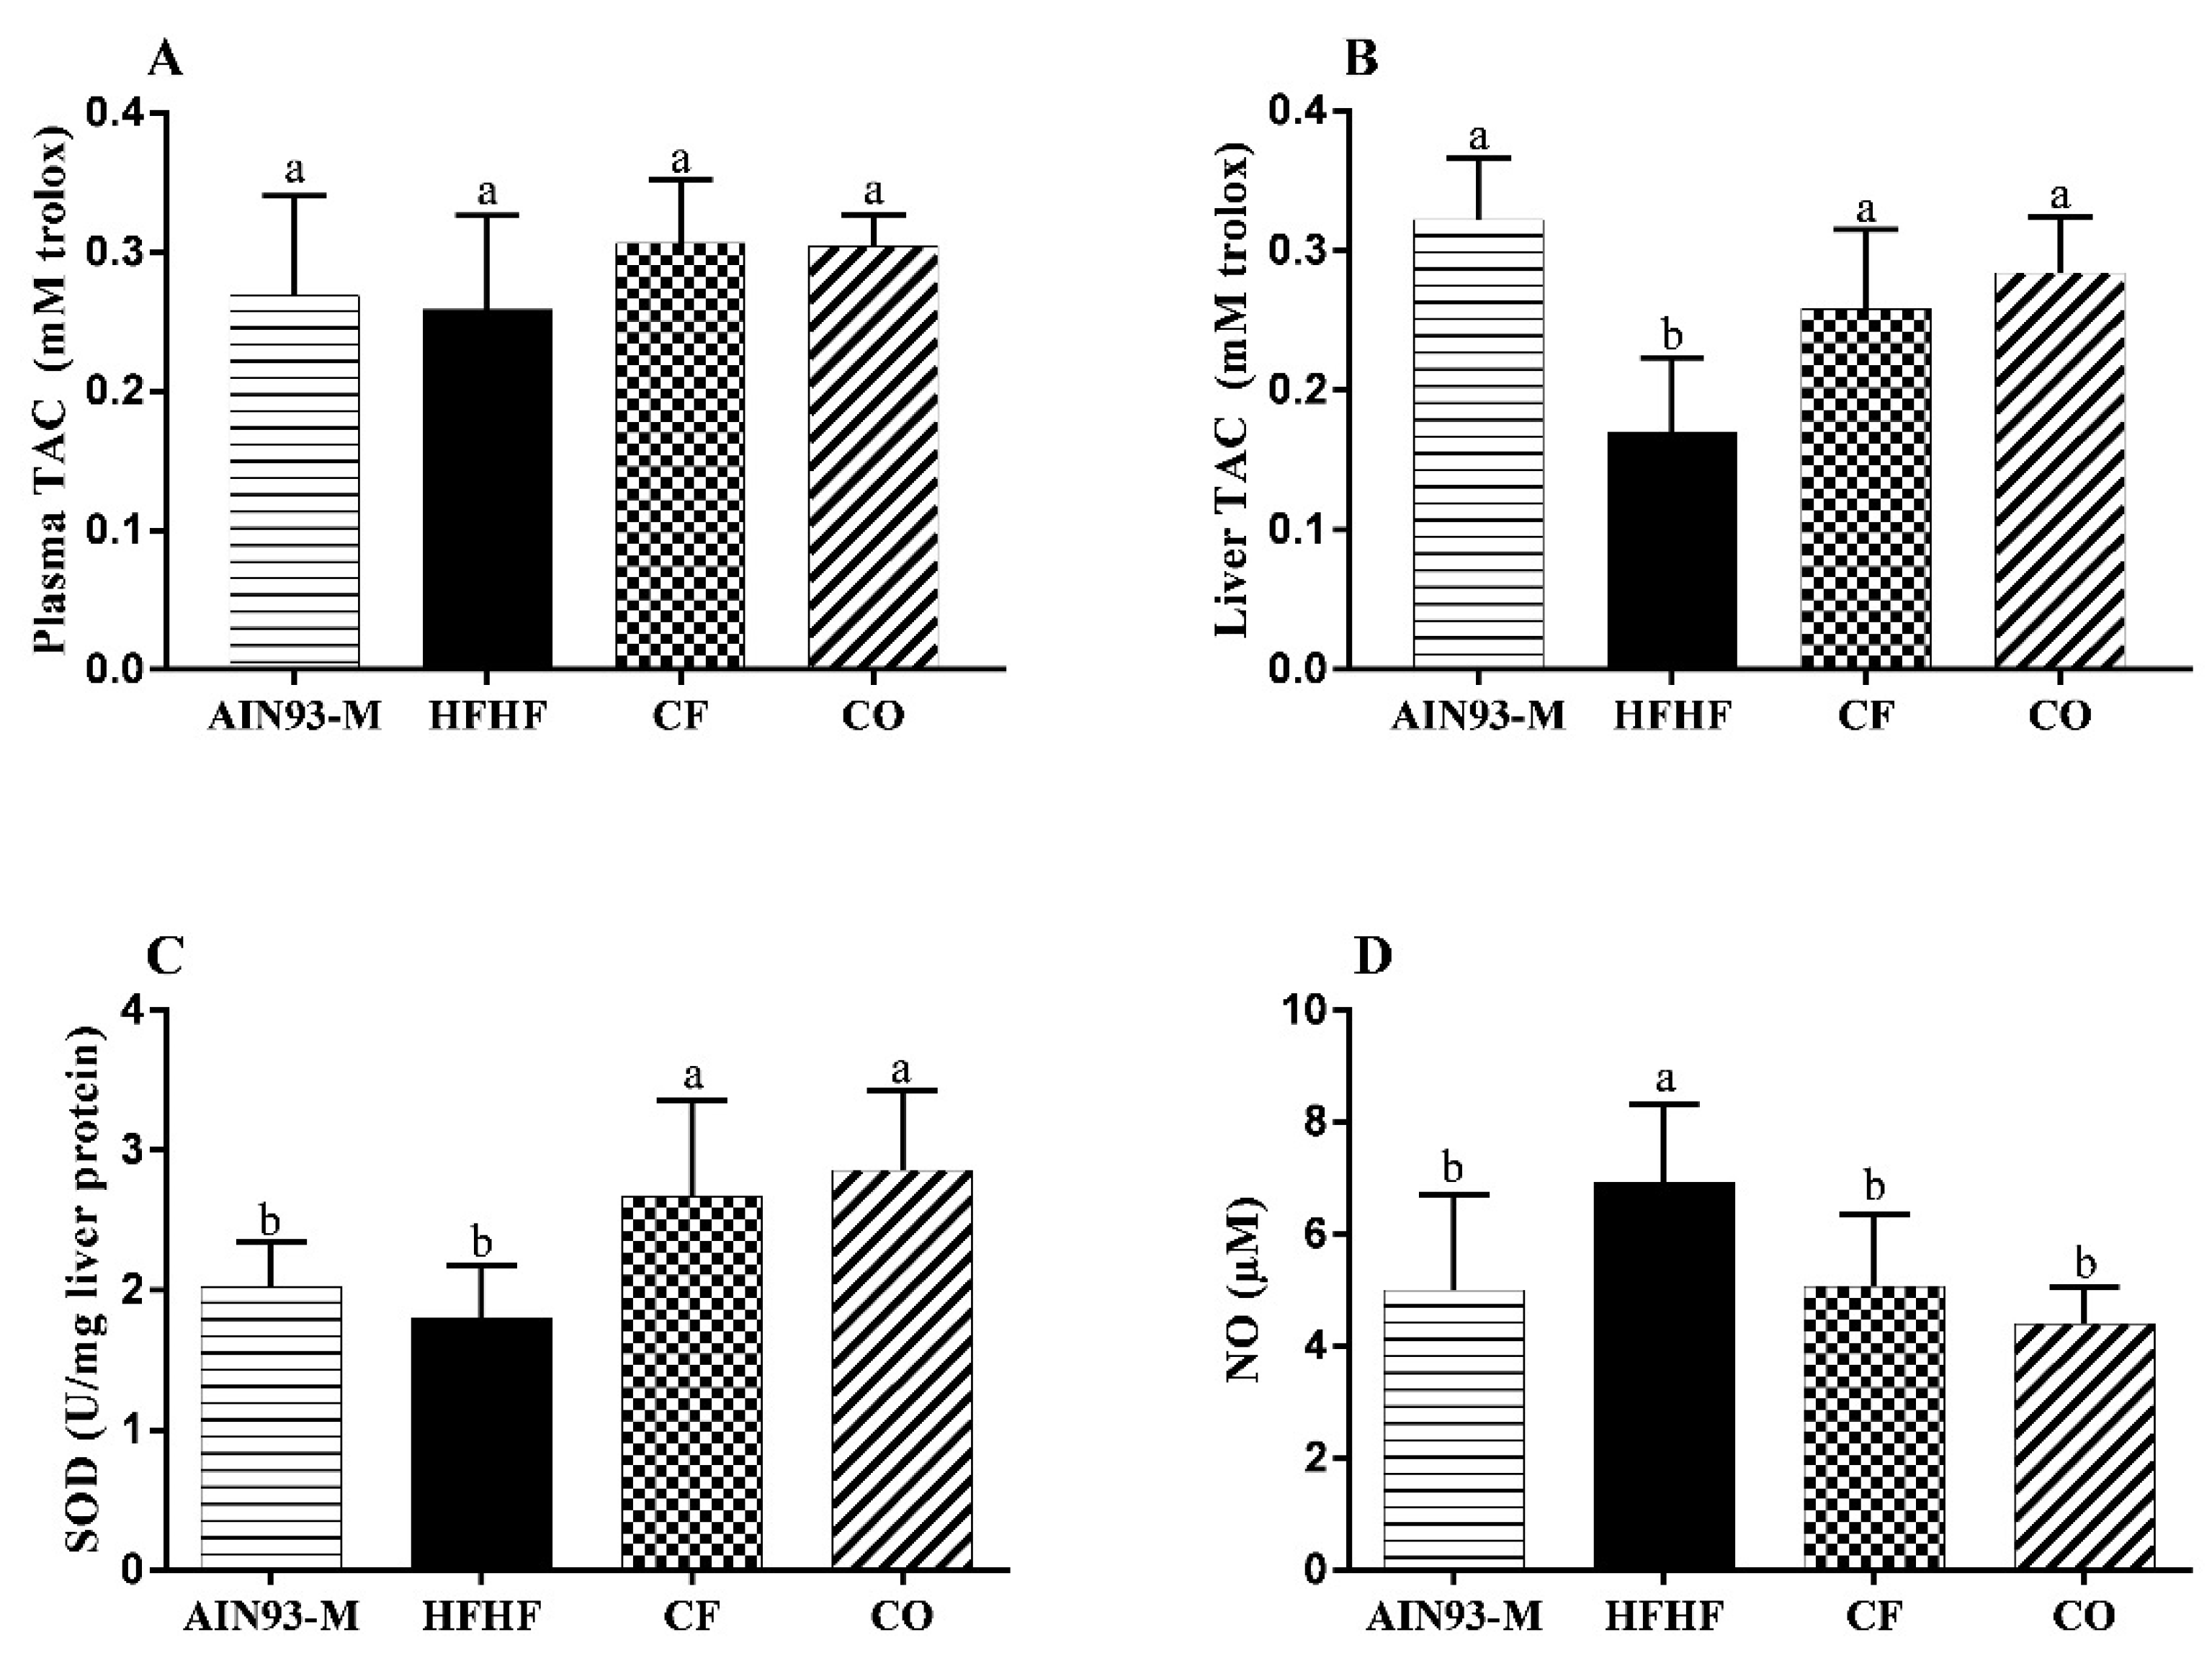
3.6. Effect of Chia on Oxidative Stress
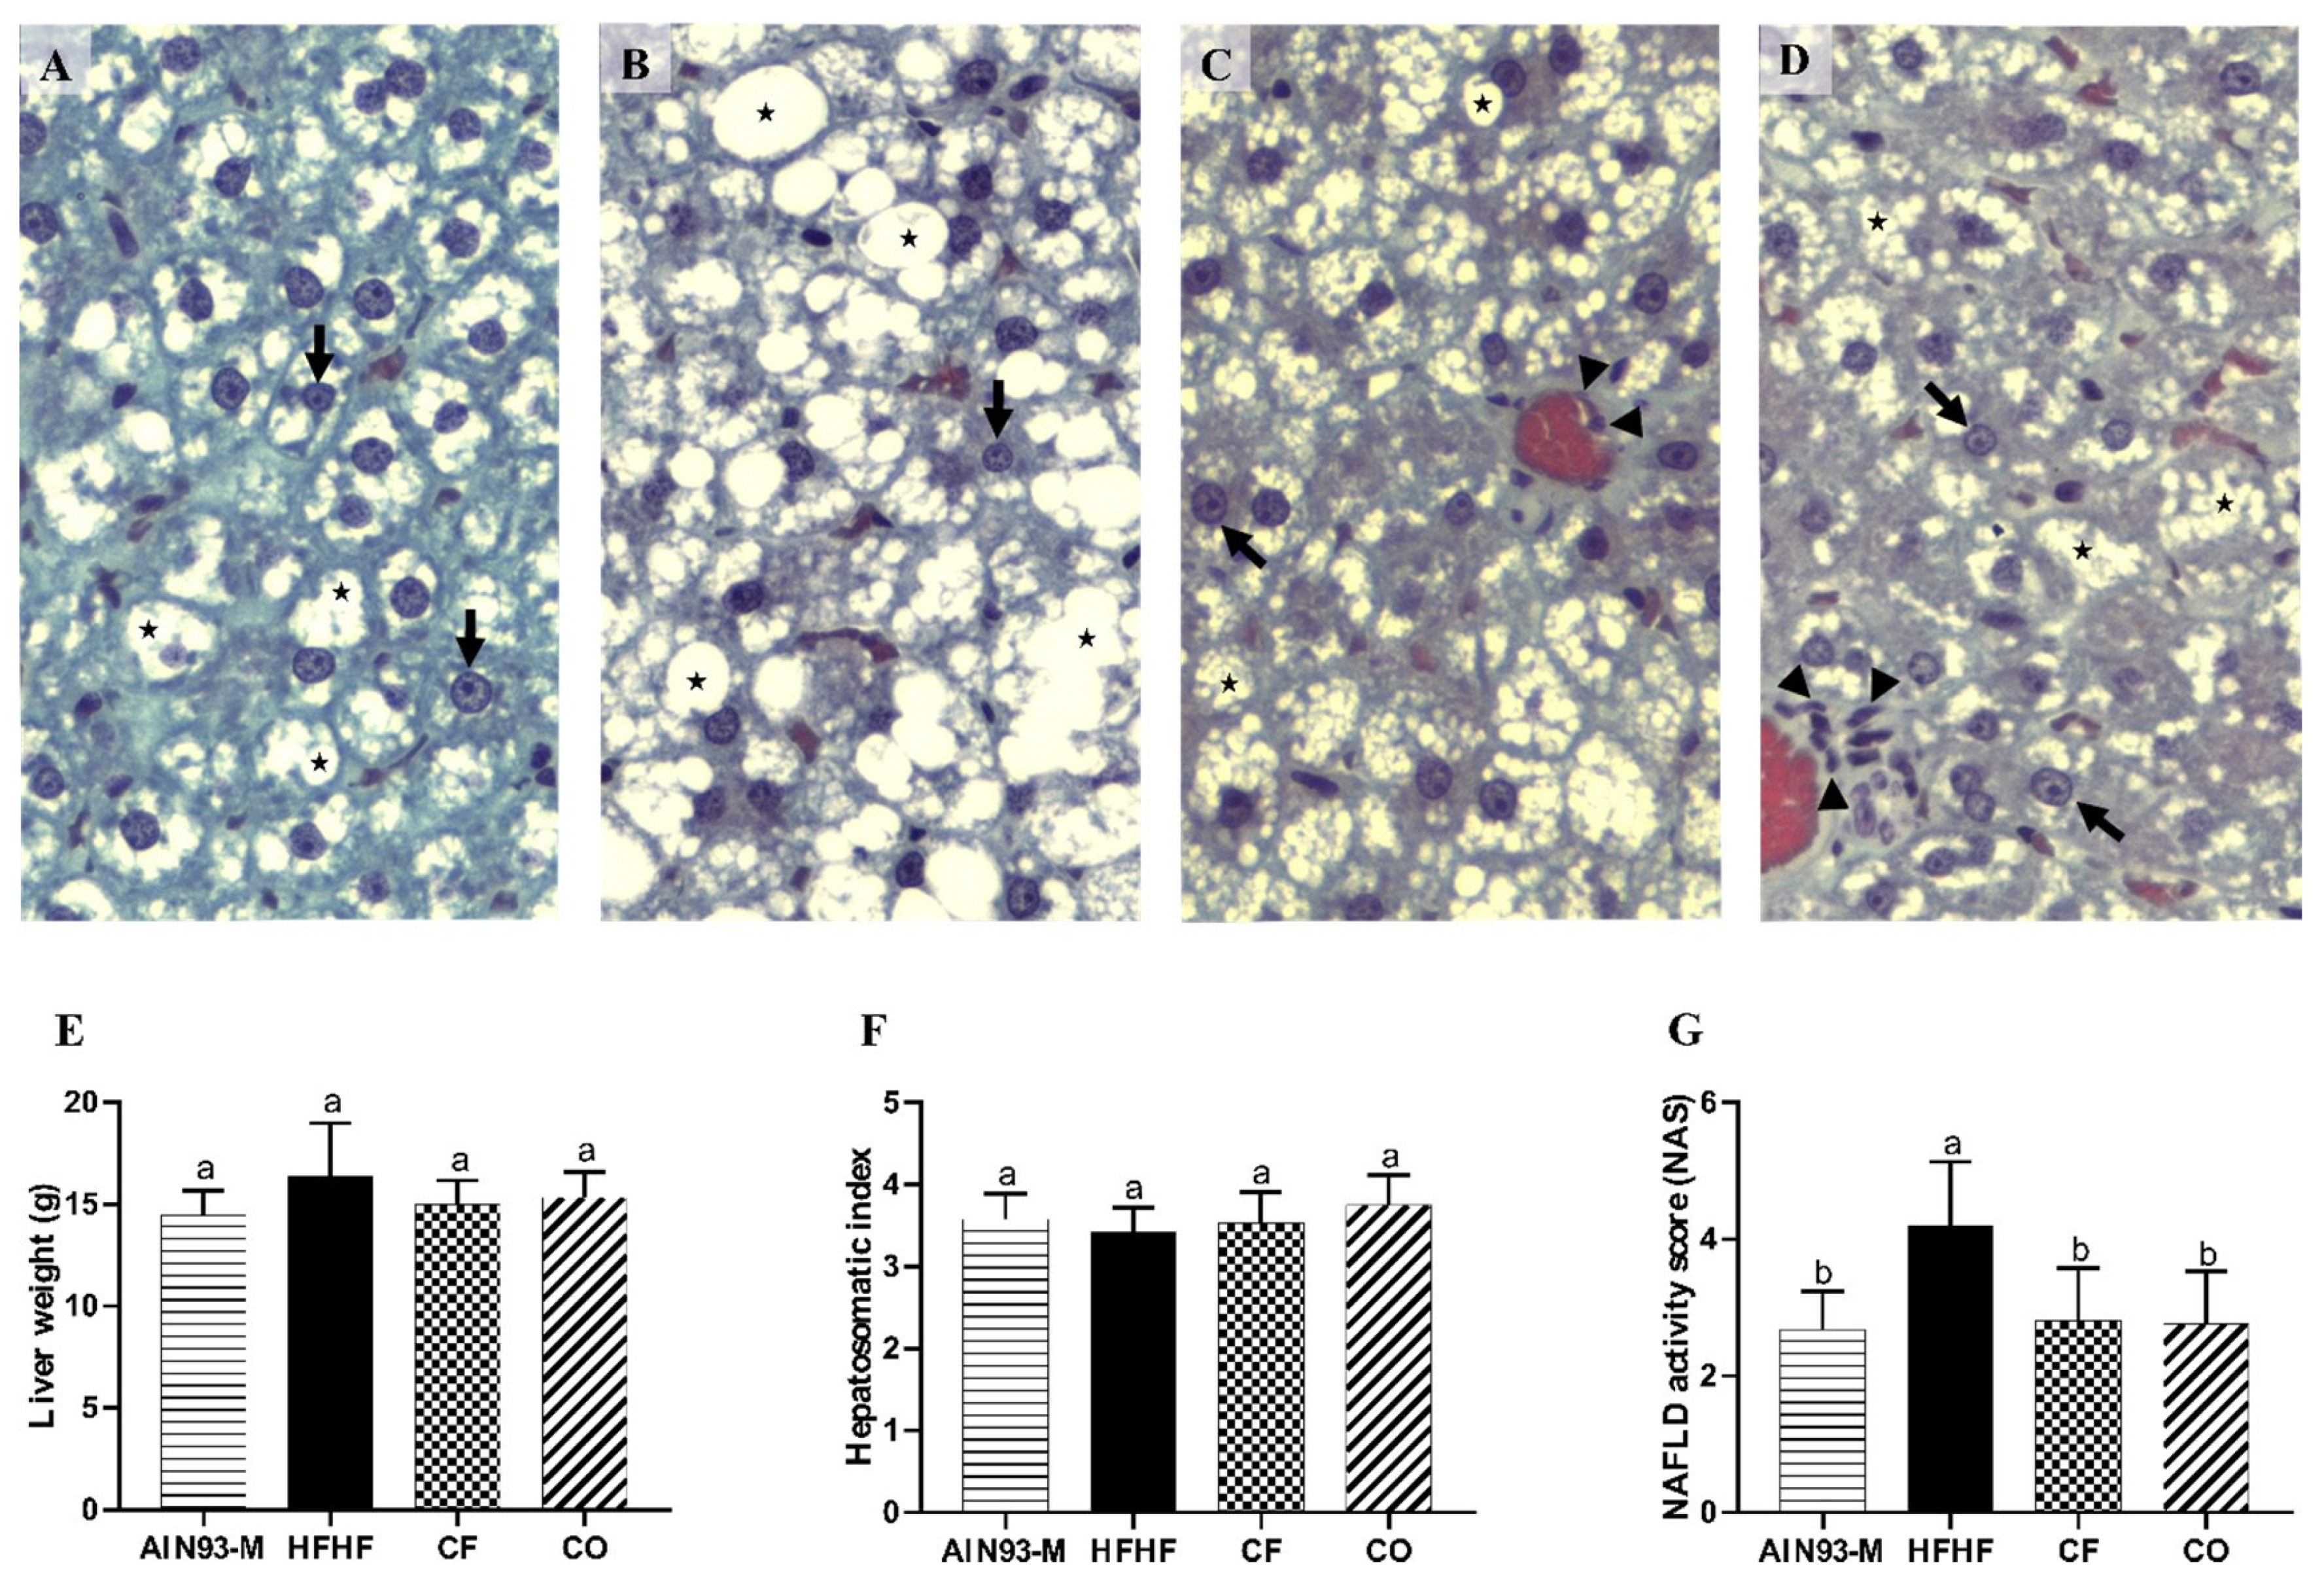
3.7. Effect of Chia on Liver’s Biometric and Histomorphometry Parameters
4. Discussion
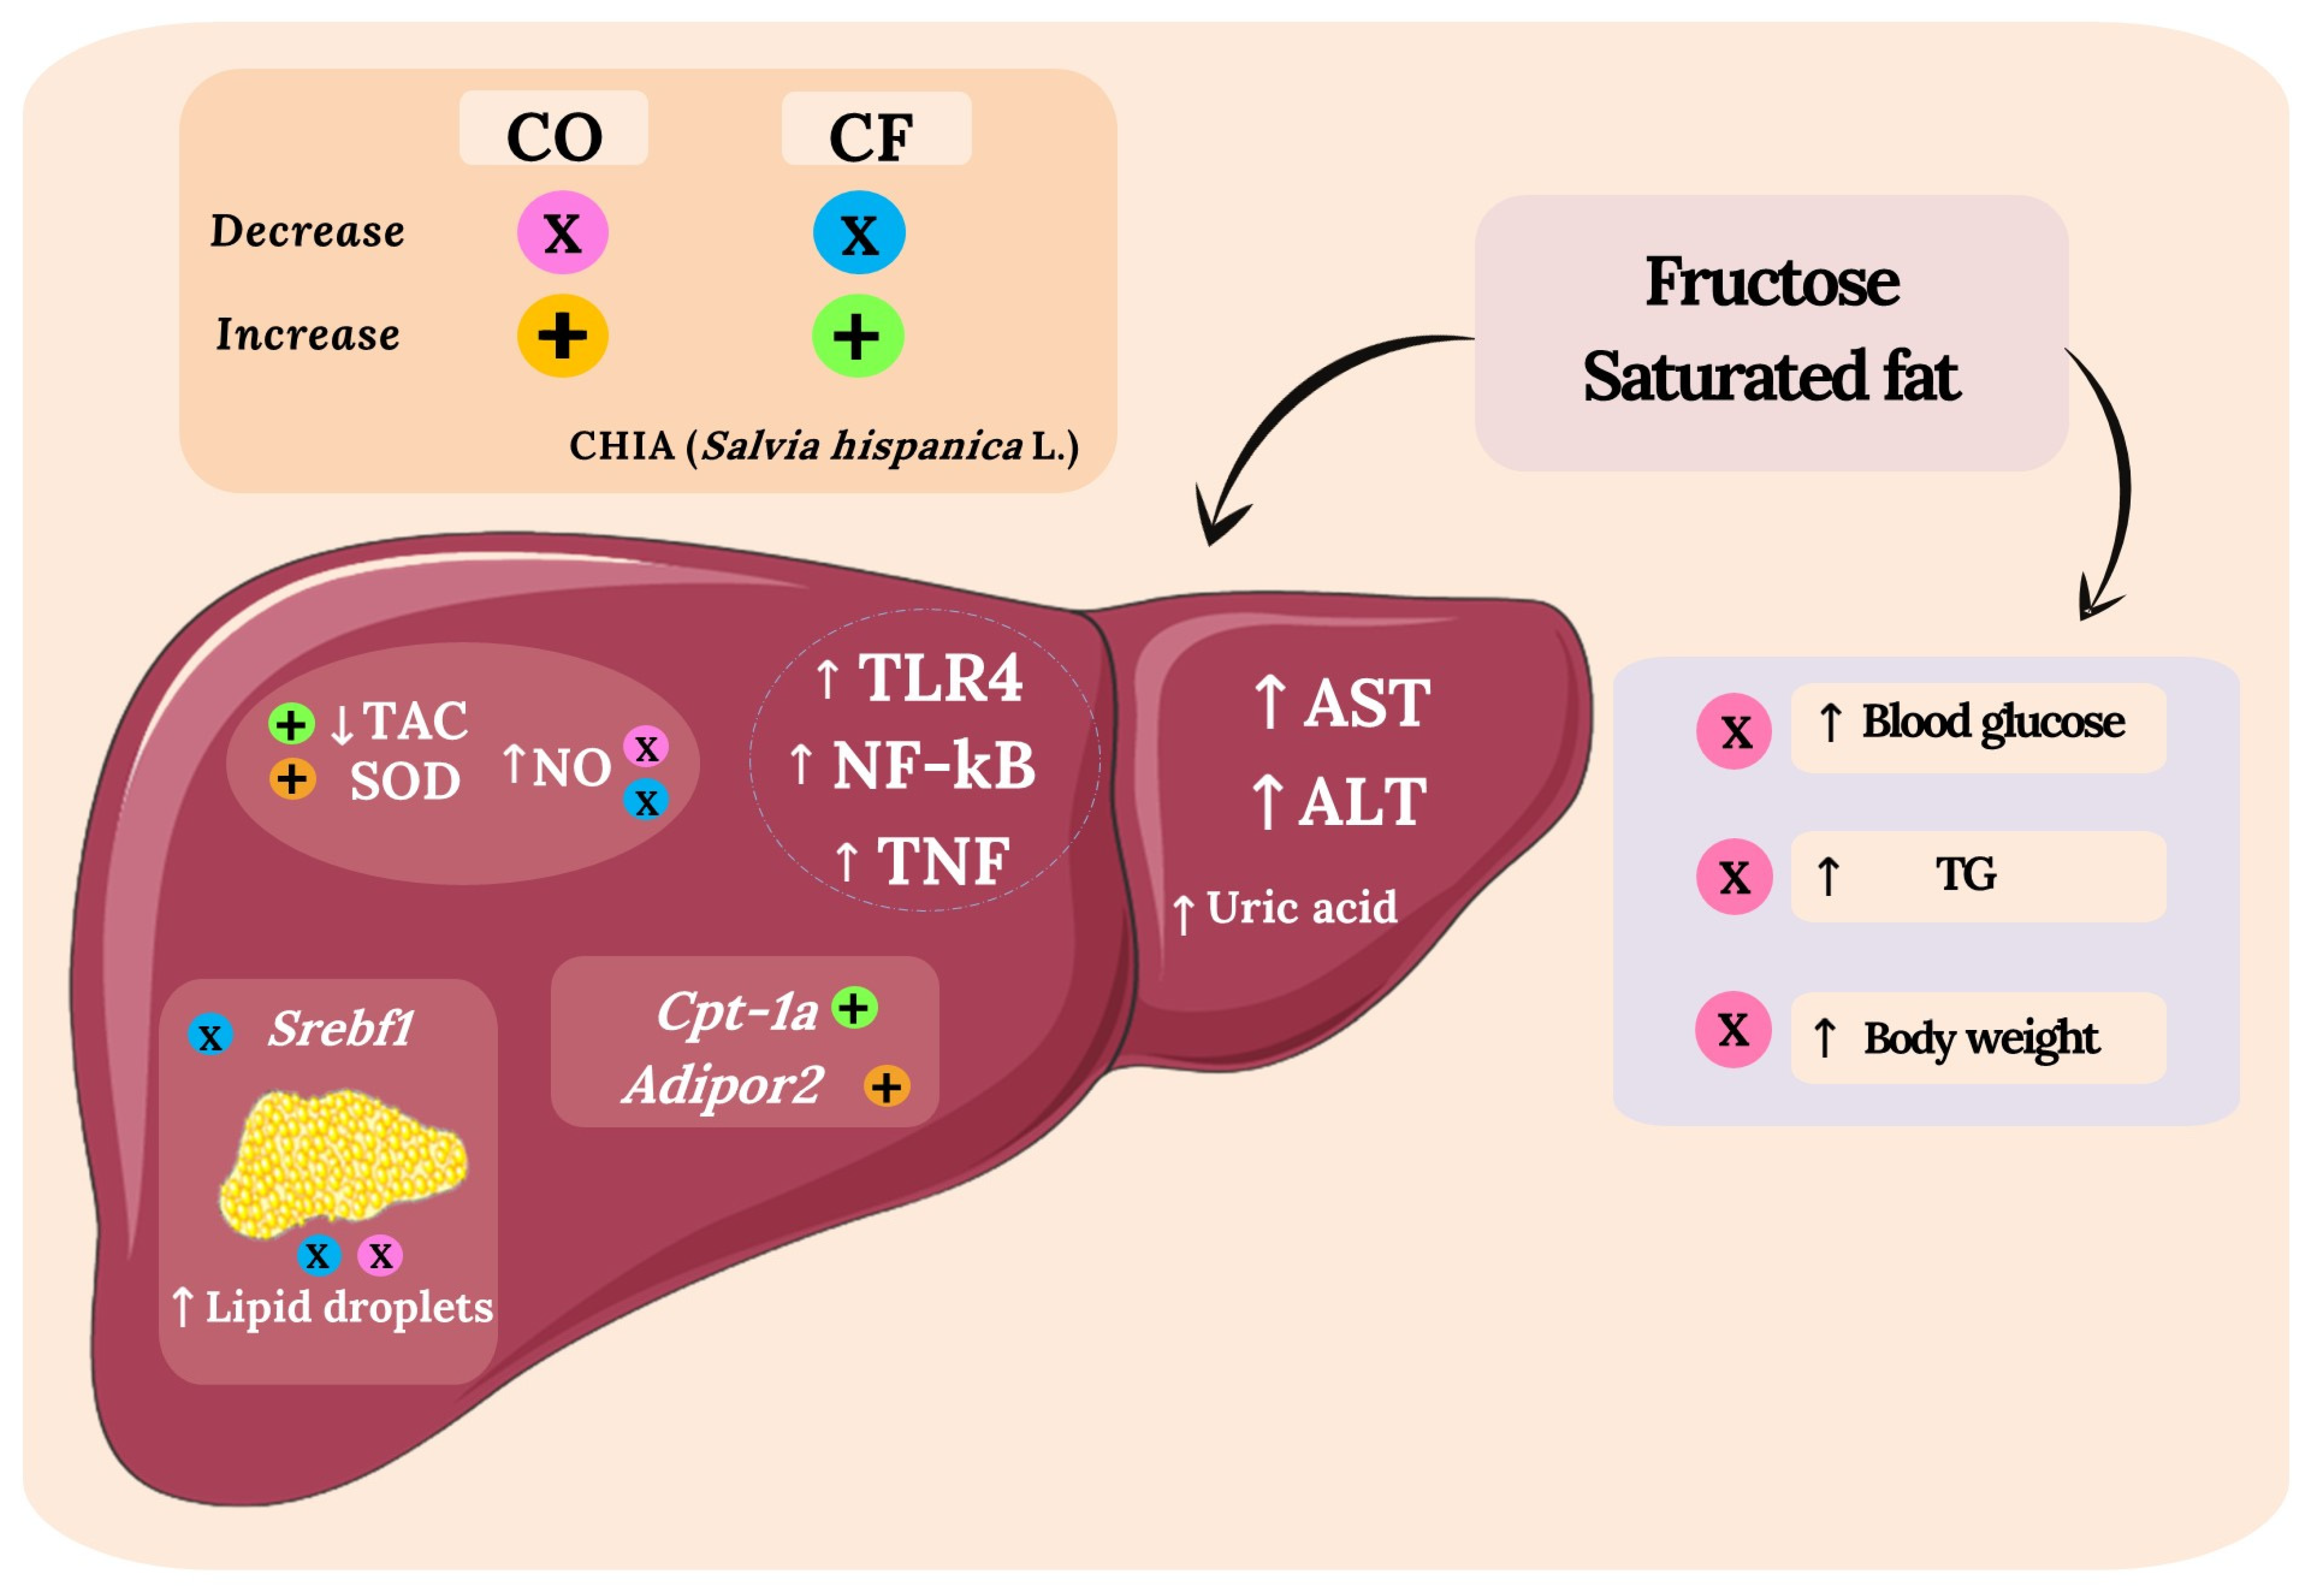
5. Conclusions
Author Contributions
Funding
Institutional Review Board Statement
Data Availability Statement
Conflicts of Interest
References
- Muriel, P.; López-Sánchez, P.; Ramos-Tovar, E. Fructose and the Liver. Int. J. Mol. Sci. 2021, 22, 6969. [Google Scholar] [CrossRef]
- Wong, W.-K.; Chan, W.-K. Nonalcoholic Fatty Liver Disease: A Global Perspective. Clin. Ther. 2021, 43, 473–499. [Google Scholar] [CrossRef] [PubMed]
- Kanwal, F.; Kramer, J.R.; Li, L.; Dai, J.; Natarajan, Y.; Yu, X.; Asch, S.M.; El-Serag, H.B. Effect of Metabolic Traits on the Risk of Cirrhosis and Hepatocellular Cancer in Nonalcoholic Fatty Liver Disease. Hepatology 2020, 71, 808–819. [Google Scholar] [CrossRef] [PubMed]
- Bawden, S.; Stephenson, M.; Ciampi, E.; Hunter, K.; Marciani, L.; Macdonald, I.; Aithal, G.; Morris, P.; Gowland, P. Investigating the effects of an oral fructose challenge on hepatic ATP reserves in healthy volunteers: A 31P MRS study. Clin. Nutr. 2016, 35, 645–649. [Google Scholar] [CrossRef] [Green Version]
- Distefano, J.K. Fructose-mediated effects on gene expression and epigenetic mechanisms associated with NAFLD pathogenesis. Cell. Mol. Life Sci. 2020, 77, 2079–2090. [Google Scholar] [CrossRef]
- Friedman, S.L.; Neuschwander-Tetri, B.A.; Rinella, M.; Sanyal, A.J. Mechanisms of NAFLD development and therapeutic strategies. Nat. Med. 2018, 24, 908–922. [Google Scholar] [CrossRef]
- Schuster, S.; Cabrera, D.; Arrese, M.; Feldstein, A.E. Triggering and resolution of inflammation in NASH. Nat. Rev. Gastroenterol. Hepatol. 2018, 15, 349–364. [Google Scholar] [CrossRef]
- Jensen, T.; Abdelmalek, M.F.; Sullivan, S.; Nadeau, K.J.; Cree-Green, M.; Roncal, C.; Nakagawa, T.; Kuwabara, M.; Sato, Y.; Kang, D.-H.; et al. Fructose and sugar: A major mediator of non-alcoholic fatty liver disease. J. Hepatol. 2018, 68, 1063–1075. [Google Scholar] [CrossRef] [PubMed] [Green Version]
- Stefan, N.; Häring, H.-U.; Cusi, K. Non-alcoholic fatty liver disease: Causes, diagnosis, cardiometabolic consequences, and treatment strategies. Lancet Diabetes Endocrinol. 2019, 7, 313–324. [Google Scholar] [CrossRef]
- Da Silva, B.P.; Anunciação, P.C.; Matyelka, J.C.D.S.; Lucia, C.M.D.; Martino, H.S.D.; Pinheiro-Sant’Ana, H.M. Chemical composition of Brazilian chia seeds grown in different places. Food Chem. 2017, 221, 1709–1716. [Google Scholar] [CrossRef]
- Grancieri, M.; Martino, H.S.D.; De Mejia, E.G. Chia Seed (Salvia hispanica L.) as a Source of Proteins and Bioactive Peptides with Health Benefits: A Review. Compr. Rev. Food Sci. Food Saf. 2019, 18, 480–499. [Google Scholar] [CrossRef] [Green Version]
- Grancieri, M.; Martino, H.S.D.; De Mejia, E.G. Protein Digests and Pure Peptides from Chia Seed Prevented Adipogenesis and Inflammation by Inhibiting PPARγ and NF-κB Pathways in 3T3L-1 Adipocytes. Nutrients 2021, 13, 176. [Google Scholar] [CrossRef] [PubMed]
- Mishima, M.D.V.; Ladeira, L.C.M.; da Silva, B.P.; Toledo, R.C.L.; de Oliveira, T.V.; Costa, N.M.B.; Martino, H.S.D. Cardioprotective action of chia (Salvia hispanica L.) in ovariectomized rats fed a high fat diet. Food Funct. 2021, 12, 3069–3082. [Google Scholar] [CrossRef] [PubMed]
- Vuksan, V.; Jenkins, A.; Brissette, C.; Choleva, L.; Jovanovski, E.; Gibbs, A.; Bazinet, R.; Au-Yeung, F.; Zurbau, A.; Ho, H.; et al. Salba-chia (Salvia hispanica L.) in the treatment of overweight and obese patients with type 2 diabetes: A double-blind randomized controlled trial. Nutr. Metab. Cardiovasc. Dis. 2017, 27, 138–146. [Google Scholar] [CrossRef]
- Enes, B.N.; Moreira, L.P.D.; Silva, B.P.; Grancieri, M.; Lúcio, H.G.; Venâncio, V.P.; Mertens-Talcott, S.U.; Rosa, C.O.B.; Martino, H.S.D. Chia seed (Salvia hispanica L.) effects and their molecular mechanisms on unbalanced diet experimental studies: A systematic review. J. Food Sci. 2020, 85, 226–239. [Google Scholar] [CrossRef] [Green Version]
- Enes, B.N.; Moreira, L.D.P.D.; Toledo, R.C.L.; Moraes, É.A.; Moreira, M.E.D.C.; Hermsdorff, H.H.M.; Noratto, G.; Mertens-Talcott, S.U.; Talcott, S.; Martino, H.S.D. Effect of different fractions of chia (Salvia hispanica L.) on glucose metabolism, in vivo and in vitro. J. Funct. Foods 2020, 71, 104026. [Google Scholar] [CrossRef]
- AOAC. Official Methods of Analysis of AOAC International: Agricultural Chemicals, Contaminants Drugs; AOAC International: Gaithersburg, MD, USA, 2012; Volume 16. [Google Scholar]
- Bloor, S.J. Overview of methods for analysis and identification of flavonoids. Methods Enzymol. 2001, 335, 3–14. [Google Scholar] [CrossRef]
- Singleton, V.L.; Orthofer, R.; Lamuela-Raventós, R.M. Analysis of total phenols and other oxidation substrates and antioxidants by means of folin-ciocalteu reagent. Methods Enzymol. 1999, 299, 152–178. [Google Scholar]
- AOCS. Official Methods and Recommended Practices of the American Oil Chemists’ Society; American Oil Chemists Society: Champaign, IL, USA, 1990. [Google Scholar]
- Lutz, A. Óleos E Gorduras. In Métodos Físicos-Quimicos Para Análise Aliment; Instituto Adolfo Lutz: Sao Paulo, Brazil, 2008; p. 1020. [Google Scholar]
- Murrieta, C.; Hess, B.; Rule, D. Comparison of acidic and alkaline catalysts for preparation of fatty acid methyl esters from ovine muscle with emphasis on conjugated linoleic acid. Meat Sci. 2003, 65, 523–529. [Google Scholar] [CrossRef]
- Livak, K.J.; Schmittgen, T.D. Analysis of Relative Gene Expression Data Using Real-Time Quantitative PCR and the 2−ΔΔCT Method. Methods 2001, 25, 402–408. [Google Scholar] [CrossRef]
- Bradford, M.M. A rapid and sensitive method for the quantitation of microgram quantities of protein utilizing the principle of protein-dye binding. Anal. Biochem. 1976, 72, 248–254. [Google Scholar] [CrossRef]
- Marklund, S.L. Product of extracellular-superoxide dismutase catalysis. FEBS Lett. 1985, 184, 237–239. [Google Scholar] [CrossRef] [Green Version]
- Green, L.C.; Wagner, D.A.; Glogowski, J.; Skipper, P.L.; Wishnok, J.S.; Tannenbaum, S.R. Analysis of Nitrate, Nitrite, and [15N] Nitrate in Biological Fluids. Anal. Biochem. 1982, 126, 131–138. [Google Scholar] [CrossRef]
- Cupertino, M.C.; Costa, K.L.C.; Santos, D.C.M.; Novaes, R.D.; Condessa, S.S.; Neves, A.C.; Oliveira, J.; Matta, S.L.P. Long-lasting morphofunctional remodelling of liver parenchyma and stroma after a single exposure to low and moderate doses of cadmium in rats. Int. J. Exp. Pathol. 2013, 94, 343–351. [Google Scholar] [CrossRef] [PubMed]
- Turlin, B.; Mendler, M.H.; Moirand, R.; Guyader, D.; Guillygomarc’H, A.; Deugnier, Y. Histologic Features of the Liver in Insulin Resistance–Associated Iron Overload. Am. J. Clin. Pathol. 2001, 116, 263–270. [Google Scholar] [CrossRef] [Green Version]
- Kleiner, D.E.; Brunt, E.M.; Van Natta, M.; Behling, C.; Contos, M.J.; Cummings, O.W.; Ferrell, L.D.; Liu, Y.-C.; Torbenson, M.S.; Unalp-Arida, A.; et al. Design and validation of a histological scoring system for nonalcoholic fatty liver disease. Hepatology 2005, 41, 1313–1321. [Google Scholar] [CrossRef] [PubMed]
- Bovi, A.P.D.; Marciano, F.; Mandato, C.; Siano, M.A.; Savoia, M.; Vajro, P. Oxidative Stress in Non-alcoholic Fatty Liver Disease. An Updated Mini Review. Front. Med. 2021, 8, 165. [Google Scholar] [CrossRef]
- Marineli, R.D.S.; Moraes, É.A.; Lenquiste, S.A.; Godoy, A.T.; Eberlin, M.N., Jr. Chemical characterization and antioxidant potential of Chilean chia seeds and oil (Salvia hispanica L.). LWT-Food Sci. Technol. 2014, 59, 1304–1310. [Google Scholar] [CrossRef]
- Oliveira-Alves, S.C.; Vendramini-Costa, D.B.; Cazarin, C.B.B.; Junior, M.R.M.; Ferreira, J.P.B.; da Silva, A.B.; Prado, M.A.; Bronze, M. Characterization of phenolic compounds in chia (Salvia hispanica L.) seeds, fiber flour and oil. Food Chem. 2017, 232, 295–305. [Google Scholar] [CrossRef]
- da Silva, B.P.; Toledo, R.C.L.; Grancieri, M.; Moreira, M.E.D.C.; Medina, N.R.; Silva, R.R.; Costa, N.M.B.; Martino, H.S.D. Effects of chia (Salvia hispanica L.) on calcium bioavailability and inflammation in Wistar rats. Food Res. Int. 2019, 116, 592–599. [Google Scholar] [CrossRef]
- Martinez, O.D.M.; Theodoro, J.M.V.; Grancieri, M.; Toledo, R.C.L.; Queiroz, V.A.V.; de Barros, F.A.R.; Martino, H.S.D. Dry heated whole sorghum flour (BRS 305) with high tannin and resistant starch improves glucose metabolism, modulates adiposity, and reduces liver steatosis and lipogenesis in Wistar rats fed with a high-fat high-fructose diet. J. Cereal Sci. 2021, 99, 103201. [Google Scholar] [CrossRef]
- Creus, A.; Ferreira, M.R.; Oliva, M.E.; Lombardo, Y.B. Mechanisms Involved in the Improvement of Lipotoxicity and Impaired Lipid Metabolism by Dietary α-Linolenic Acid Rich Salvia hispanica L (Salba) Seed in the Heart of Dyslipemic Insulin-Resistant Rats. J. Clin. Med. 2016, 5, 18. [Google Scholar] [CrossRef] [Green Version]
- Fortino, M.; Oliva, M.E.; Rodriguez, S.; Lombardo, Y.; Chicco, A. Could post-weaning dietary chia seed mitigate the development of dyslipidemia, liver steatosis and altered glucose homeostasis in offspring exposed to a sucrose-rich diet from utero to adulthood? Prostaglandins Leukot. Essent. Fat. Acids 2017, 116, 19–26. [Google Scholar] [CrossRef] [PubMed]
- Marineli, R.D.S.; Lenquiste, S.A.; Moraes, É.A.; Maróstica, M.R. Antioxidant potential of dietary chia seed and oil (Salvia hispanica L.) in diet-induced obese rats. Food Res. Int. 2015, 76, 666–674. [Google Scholar] [CrossRef]
- Han, K.; Li, X.Y.; Zhang, Y.Q.; He, Y.L.; Hu, R.; Lu, X.L.; Li, Q.J.; Hui, J. Chia Seed Oil Prevents High Fat Diet Induced Hyperlipidemia and Oxidative Stress in Mice. Eur. J. Lipid Sci. Technol. 2020, 122, 1–9. [Google Scholar] [CrossRef]
- Xu, H.; Zhao, Q.; Song, N.; Yan, Z.; Lin, R.; Wu, S.; Jiang, L.; Hong, S.; Xie, J.; Zhou, H.; et al. AdipoR1/AdipoR2 dual agonist recovers nonalcoholic steatohepatitis and related fibrosis via endoplasmic reticulum-mitochondria axis. Nat. Commun. 2020, 11, 5807. [Google Scholar] [CrossRef]
- Nelson, D.L.; Cox, M.M. Principios de Bioquimica de Lehninger, 6th ed.; Artmed Editora: Porto Alegre, Brazil, 2014. [Google Scholar]
- De Souza, T.; da Silva, S.V.; Fonte-Faria, T.; Nascimento-Silva, V.; Barja-Fidalgo, C.; Citelli, M. Chia oil induces browning of white adipose tissue in high-fat diet-induced obese mice. Mol. Cell. Endocrinol. 2020, 507, 110772. [Google Scholar] [CrossRef] [PubMed]
- Fonte-Faria, T.; Citelli, M.; Atella, G.C.; Raposo, H.F.; Zago, L.; de Souza, T.; da Silva, S.V.; Barja-Fidalgo, C. Chia oil supplementation changes body composition and activates insulin signaling cascade in skeletal muscle tissue of obese animals. Nutrition 2019, 58, 167–174. [Google Scholar] [CrossRef] [PubMed]
- Calder, P.C. Omega-3 fatty acids and inflammatory processes: From molecules to man. Biochem. Soc. Trans. 2017, 45, 1105–1115. [Google Scholar] [CrossRef] [Green Version]
- Pawlak, M.; Lefebvre, P.; Staels, B. Molecular mechanism of PPARα action and its impact on lipid metabolism, inflammation and fibrosis in non-alcoholic fatty liver disease. J. Hepatol. 2015, 62, 720–733. [Google Scholar] [CrossRef] [Green Version]
- Korbecki, J.; Bobiński, R.; Dutka, M. Self-regulation of the inflammatory response by peroxisome proliferator-activated receptors. Agents Actions 2019, 68, 443–458. [Google Scholar] [CrossRef] [PubMed] [Green Version]
- Da Silva, B.P.; Toledo, R.C.L.; Mishima, M.D.V.; Moreira, M.E.D.C.; Vasconcelos, C.M.; Pereira, C.E.R.; Favarato, L.S.C.; Costa, N.M.B.; Martino, H.S.D. Effects of chia (Salvia hispanica L.) on oxidative stress and inflammation in ovariectomized adult female Wistar rats. Food Funct. 2019, 10, 4036–4045. [Google Scholar] [CrossRef] [PubMed]


| Ingredients (g/kg of Diet) | AIN93-M | HFHF | Chia Flour | Chia Oil |
|---|---|---|---|---|
| Albumin * | 136.4 | 136.4 | 101.8 | 136.4 |
| Dextrinized starch | 155 | 45 | 45.4 | 45 |
| Corn starch | 463.5 | 135 | 116.8 | 135 |
| Sucrose | 100 | 28.6 | 29.3 | 28.6 |
| Fructose | - | 200 | 200 | 200 |
| Soybean oil | 40 | 40 | - | - |
| Chia seed | - | - | 147.3 | - |
| Chia oil | - | - | - | 40 |
| Lard | - | 310 | 310 | 310 |
| Microcristalline cellulose | 55.8 | 55.8 | - | 55.8 |
| Mineral mix | 35 | 35 | 35 | 35 |
| Vitamin mix | 10 | 10 | 10 | 10 |
| L-cystine | 1.8 | 1.8 | 1.8 | 1.8 |
| Choline bitartrate | 2.5 | 2.5 | 2.5 | 2.5 |
| Nutritional composition | ||||
| Macronutrients | ||||
| Carbohydrates (%) | 77.4 | 30.1 | 31 | 30.1 |
| Protein | 12.9 | 9.1 | 9.2 | 9.1 |
| Lipids | 9.7 | 59.8 | 60.4 | 59.8 |
| Energetic density (kcal/g) | 3.71 | 5.26 | 5.21 | 5.26 |
| Fatty acids (g/kg) ** | ||||
| Linoleic (C18:2n−6) | 20.2 | 58.8 | 46.5 | 46.5 |
| α-Linolenic (C18:3n−3) | 3.3 | 10.2 | 31.8 | 31.8 |
| n−6/n−3 ratio | 6.12:1 | 5.77:1 | 1.46:1 | 1.46:1 |
| Experimental Diets | ||||
|---|---|---|---|---|
| Parameters | AIN-93M | HFHF | CF | CO |
| Glucose (mg/dL) | 82.1 ± 12.1 b | 100.9 ± 7.8 a | 89.17 ± 2 ± 11.9 ab | 82.7 ± 11.5 b |
| TG (mg/dL) | 117.5 ± 17.1 b | 147.8 ± 21.6 a | 130.4 ± 7.8 ab | 115.8 ± 7.4 b |
| AST (U/L) | 98.5 ± 23.7 b | 150.7 ± 30.3 a | 172.0 ± 40.0 a | 172.9 ± 12.1 a |
| ALT (U/L) | 29.0 ± 11.1 b | 51.3 ± 16.9 a | 39.7 ± 6.3 ab | 52.1 ± 17.7 a |
| Uric acid (mg/dL) | 1.3 ± 0.7 b | 3.4 ± 2.4 a | 2.4 ± 1.2 ab | 1.7 ± 1.2 ab |
Publisher’s Note: MDPI stays neutral with regard to jurisdictional claims in published maps and institutional affiliations. |
© 2022 by the authors. Licensee MDPI, Basel, Switzerland. This article is an open access article distributed under the terms and conditions of the Creative Commons Attribution (CC BY) license (https://creativecommons.org/licenses/by/4.0/).
Share and Cite
de Paula Dias Moreira, L.; Enes, B.N.; de São José, V.P.B.; Toledo, R.C.L.; Ladeira, L.C.M.; Cardoso, R.R.; da Silva Duarte, V.; Hermsdorff, H.H.M.; de Barros, F.A.R.; Martino, H.S.D. Chia (Salvia hispanica L.) Flour and Oil Ameliorate Metabolic Disorders in the Liver of Rats Fed a High-Fat and High Fructose Diet. Foods 2022, 11, 285. https://doi.org/10.3390/foods11030285
de Paula Dias Moreira L, Enes BN, de São José VPB, Toledo RCL, Ladeira LCM, Cardoso RR, da Silva Duarte V, Hermsdorff HHM, de Barros FAR, Martino HSD. Chia (Salvia hispanica L.) Flour and Oil Ameliorate Metabolic Disorders in the Liver of Rats Fed a High-Fat and High Fructose Diet. Foods. 2022; 11(3):285. https://doi.org/10.3390/foods11030285
Chicago/Turabian Stylede Paula Dias Moreira, Luiza, Bárbara Nery Enes, Vinícius Parzanini Brilhante de São José, Renata Celi Lopes Toledo, Luiz Carlos Maia Ladeira, Rodrigo Rezende Cardoso, Vinícius da Silva Duarte, Helen Hermana Miranda Hermsdorff, Frederico Augusto Ribeiro de Barros, and Hércia Stampini Duarte Martino. 2022. "Chia (Salvia hispanica L.) Flour and Oil Ameliorate Metabolic Disorders in the Liver of Rats Fed a High-Fat and High Fructose Diet" Foods 11, no. 3: 285. https://doi.org/10.3390/foods11030285