Article

Hesperidin and Naringin Improve Broiler Meat Fatty Acid Profile and Modulate the Expression of Genes Involved in Fatty Acid β-oxidation and Antioxidant Defense in a Dose Dependent Manner

by
Ariadne L. Hager-Theodorides
1,*,
Theofilos Massouras
2,
Panagiotis E. Simitzis
1,
Katerina Moschou
2,
Evangelos Zoidis
3,
Eleni Sfakianaki
1,
Katerina Politi
1,
Maria Charismiadou
1,
Michael Goliomytis
1 and
Stelios Deligeorgis
1
1
Laboratory of Animal Breeding and Husbandry, Department of Animal Science, Agricultural University of Athens, 75 Iera Odos, 11855 Athens, Greece
2
Laboratory of Dairy Science and Technology, Department of Food Science and Human Nutrition, Agricultural University of Athens, 75 Iera Odos, 11855 Athens, Greece
3
Laboratory of Nutritional Physiology and Feeding, Department of Animal Science, Agricultural University of Athens, 75 Iera Odos, 11855 Athens, Greece
*
Author to whom correspondence should be addressed.
Foods 2021, 10(4), 739; https://doi.org/10.3390/foods10040739
Submission received: 1 March 2021 / Revised: 23 March 2021 / Accepted: 27 March 2021 / Published: 31 March 2021
(This article belongs to the Special Issue Bioactive Compounds: Applications in Foods of Animal Origin)

Abstract

:
The beneficial properties of the flavanones hesperidin and naringin as feed additives in poultry have lately been under investigation. In broilers, both flavanones have been shown to exhibit antioxidant properties while their individual effects on fatty acid (FA) composition and the underlying molecular mechanisms of their activity have not been explored. Here, we studied their effects on broiler meats’ FA profiles and on the expression of genes related to lipid metabolism, antioxidant defense and anti-inflammatory function. The experimental design comprised six treatment groups of broilers, each supplemented from day 11 until slaughter at 42 days with hesperidin, naringin or vitamin E, as follows: the E1 group received 0.75 g of hesperidin per kg of feed, E2 received 1.5 g hesperidin/kg feed, N1 received 0.75 g naringin/kg feed, N2 received 1.5 g naringin/kg feed, vitamin E (VE) received 0.2 g a-tocopheryl acetate/kg feed, and the control group was not provided with a supplemented feed. The VE treatment group served as a positive control for antioxidant activity. An analysis of the FA profiles of the abdominal adipose tissue (fat pad), major pectoralis (breast) and biceps femoris (thigh) muscles showed that both hesperidin and naringin had significant effects on saturated FA (SFA), polyunsaturated FA (PUFA) and omega n-6 content. Both compounds reduced SFA and increased PUFA and n-6 content, as well as reducing the atherogenicity and thrombogenicity indices in the breast muscle and fat pad. The effects on the thigh muscle were limited. An analysis of gene expression in the liver revealed that naringin significantly increased peroxisome proliferator-activated receptor alpha (PPARα), Acyl-CoA oxidase 1 (ACOX1) and glutathione disulfide reductase (GSR) expression. In the breast muscle, both hesperidin and naringin increased fatty acid synthase (FASN) expression and hesperidin increased the expression of adiponectin. In brief, both hesperidin and naringin supplementation beneficially affected FA profiles in the breast meat and fat pad of broiler chicken. These effects could be attributed to an increase in FA β-oxidation since the increased expression of related genes (PPARα and ACOX1) was observed in the liver. Furthermore, the antioxidant activity of hesperidin and naringin previously observed in the meat of broilers could be attributed, at least partly, to the regulation of antioxidant defense genes, as evidenced by the increased GSR expression in response to naringin supplementation.

Graphical Abstract

1. Introduction

The poultry industry worldwide is in search of bioactive and cost-effective compounds that can improve product quality and human health-promoting attributes. The potential benefits for poultry production that can be derived from dietary supplementation with plant flavonoids have recently been under investigation with so far encouraging results, especially for fat quality and antioxidant function [1]. Amongst flavonoids, hesperidin and naringin (flavanones that are abundant in citrus fruits) are potent antioxidants, possess anti-inflammatory properties, improve metabolic syndrome disease symptoms and modulate lipid metabolism [2].
Some of the desirable properties of broiler meats as regards fat quality are reduced fat content and favorable fatty acid composition, e.g., increased poly-unsaturated/saturated fatty acid (PUFA/SFA) ratio and reduced omega n-6/n-3 ratio and atherogenicity (AI) and thrombogenicity (TI) indices. Hesperidin has been shown to decrease muscle fat content in broilers [3], increase PUFA, improve n-6/n-3 and PUFA/SFA ratios in breast meat, and decrease serum and muscle cholesterol and triglyceride levels [4]. Furthermore, hesperidin and naringin were found to reduce cholesterol content in layer hens’ egg yolk [5,6,7] and to reduce serum cholesterol levels in layer hens [6,7]. In humans, flavonoids including hesperidin have been shown to improve metabolic syndrome health indices [8].
Another important quality parameter for poultry meat is oxidative stability [9]. Dietary supplementation with hesperidin has been shown to increase broiler meat antioxidant capacity during storage [10,11,12,13] and to improve antioxidant defense function in the plasma [4] and liver [3]. Naringin has also been found to reduce the oxidative deterioration of stored broiler meat [11]. Naringin and/or hesperidin, or their aglycones naringenin and hesperetin, have been found to alleviate the symptoms of induced oxidative stress in rodents and rabbits, in the context of human disease animal model systems such as metabolic disorder, diabetes and liver injury, and in human cell lines [14,15,16,17,18,19,20,21].
Citrus flavanones are also known to possess anti-inflammatory properties [2,22]. In chicken, hesperidin has been found to exert immunomodulatory functions, increasing antibody titers following immunizations, improving heterophil adhesion, elevating responses to cutaneous basophilic hypersensitivity tests and increasing phagocytic activity following lipopolysaccharide challenge [23,24].
Hesperidin, naringin and their aglycones seem to mediate the effects described above on lipid metabolism, antioxidant defense and immune regulation via the modulation of genes involved in relevant pathways [25,26,27]. Their effects on gene expression have been studied in many tissues and cell types, in vivo and in vitro, and under different physiological conditions, mainly in rodents, rabbits and human cell lines. The beneficial effects of the two flavonoids on metabolic disease have been linked to an increased hepatic expression of genes involved in fatty acid (FA) β-oxidation (such as PPARα, PPARγ, ACOX, CPT1A) and the decreased expression of genes involved in lipogenesis and lipid metabolism (e.g., FAS, Srebf1, ACC). Their antioxidant activity seems to be exerted via the downregulation of pro-apoptotic (e.g., Casp3, Casp9, BAX) and the upregulation of the anti-apoptotic (e.g., BCL-2) and antioxidant defense system (e.g., SOD, CAT, GSH-P, GPx, GR) genes. Their anti-inflammatory properties are linked to the modulation of genes involved in pro- and anti-inflammatory processes, such as iNOS, COX-2, Nrf2, NFκB, TGFβ and IL10. A comprehensive list of genes per functional category and corresponding references are presented in the supplementary material (Supplementary Table S1).
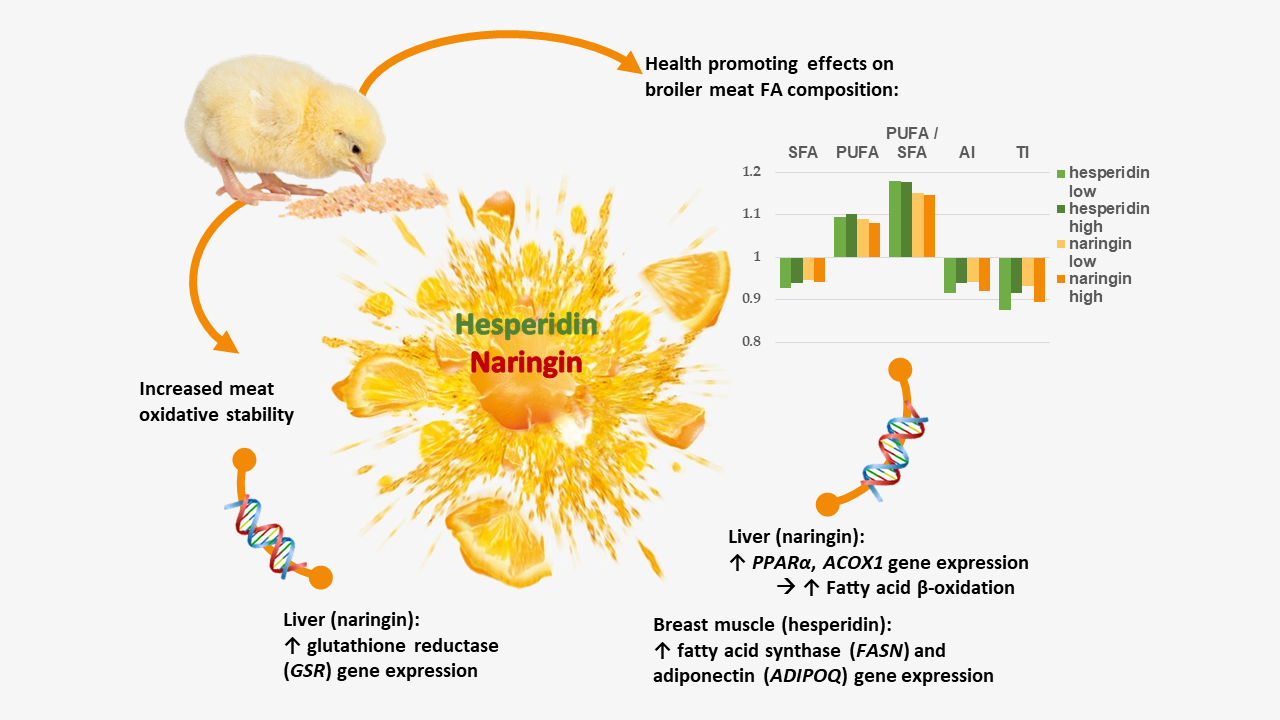
In this study we investigated the effect of hesperidin and naringin supplementation on broiler meat’s FA profile. Furthermore, we provide novel data on the expression of genes related to the known effects of the two flavanones on antioxidant defense, lipid metabolism, and inflammation.

2. Materials and Methods

2.1. Animals and Experimental Design

In this study, 240-day-old Ross 308 broiler chickens, obtained from a commercial hatchery, as hatched, were housed in a controlled environment. Animal management and feed are described in [11]. The 240 broiler chickens were equally allocated to 6 dietary treatment groups and 2 pens per treatment group. The six treatment groups were: N1 and N2, supplemented with 0.75 and 1.5 g naringin (Alfa Aesar GmbH & Co KG, Kandel, Germany) per kg of feed, respectively; E1 and E2, supplemented with 0.75 and 1.5 g hesperidin (TSI Europe NV, Zwijndrecht, Belgium) per kg of feed, respectively; control (C) with no feed additive; and vitamin E (VE) supplemented with 0.2 g a-tocopheryl acetate (vitamin E) (DSM Nutritional Products Hellas, Athens, Greece) per kg of feed. The VE treatment group served as a positive control for antioxidant activity and the level of supplementation was determined according to previously published data [28]. Feed additives were supplemented from the 11th day of age until slaughter at 42 days.

2.2. Fatty Acid Profile Analysis

2.2.1. Lipid Extraction

Total lipids were extracted from abdominal adipose tissue (fat pad), the breast (pectoralis major) and the thigh (biceps femoris) muscle from 10 birds per treatment group according to Folch et al. [29]. Afterwards, the organic phase was dried under reduced pressure with a rotary evaporator. The lipid extract was weighted, the percentage fat content was determined, and it was then subjected to transmethylation.

2.2.2. Transesterification and Gas Chromatographic Analysis

Direct transesterification on lipid extract was performed following [30] with minor modification. Briefly, a quantity between 100 and 150 mg of lipid extract was directly methylated with 2 mL of 0.5 M sodium methylate at 50 °C for 30 min, followed by 2 mL of 140 g L−1 boron trifluoride in methanol (BF3) at 50 °C for 30 min. Then, 2 mL of hexane was added and the upper hexane phase containing the fatty acid methyl esters (FAMEs) was transferred to gas–liquid chromatography (GLC) auto-sampler vials and analyzed in duplicate.
FAMEs were separated by GLC using a Shimadzu gas chromatograph (model GC-17A, Columbia, MD, USA) with a Shimadzu GC-2014 GC AOC-20i auto injector, equipped with a flame ionization detector (FID). The FA composition of the FAME was determined by capillary GC on a SP-2560 capillary column (75 m × 0.18 mm I.D., 0.14 μm; Supelco Inc., Bellefonte, PA, USA). The flow rate of carrier gas (Helium) was 1 mL∙min−1, the injection temperature was 250 °C and the detector temperature was 270 °C. The injection volume was 1 μL (split 1:50). The temperature program was as follows: The initial temperature was held at 75 °C for 5 min after injection and then programmed to increase at 5 °C/min to 150 °C, to hold for 5 min, then to increase to 220 °C at 7 °C/min and hold for 20 min. Fatty acid peaks were recorded and integrated using a Shimadzu GC solution software (Shimadzu Corporation, Kyoto, Japan). Individual fatty acids were identified by comparing their retention times with known fatty acid methyl ester standards (Supelco 37 Component FAME Mix, purchased from Sigma-Aldrich, Taufkirchen, Germany). The individual FA content was expressed as weight percentage (g∙100 g−1 of total FA). SFA, PUFA, MUFA, n-6 and n-3 were calculated as the sum of the percent content of all saturated, polyunsaturated, monounsaturated, n-6 and n-3 FA, respectively. PUFA/SFA and n-6/n-3 ratios were calculated by dividing PUFA by SFA and n-6 by n-3, respectively. The atherogenicity and thrombogenicity indices were calculated with the following formulas [31]: AI = (12:0 + 4 · 14:0 + 16:0)/(Sum MUFA + Sum PUFA), TI = (14:0 + 16:0 + 18:0)/[0.5 · Sum MUFA + 0.5 · Sum (n-6) PUFA + 3 · Sum (n-3) PUFA + (n-3/n-6)].

2.3. RNA Extraction and cDNA Synthesis

Samples from the liver, breast (pectoralis major) muscle and abdominal adipose tissue (fat pad) from 4 (liver, fat pad) or 6 (muscle) animals per dietary group (C, E1, E2, N1, N2 and VE) were collected post-mortem at 42 d of age, snap-frozen in liquid nitrogen and stored at −80 °C until the extraction of RNA. RNA was extracted using the QIAzol® lysis reagent (Qiagen, Hilden, Germany) and according to the manufacturer’s instructions. Briefly, approximately 20 mg of frozen liver tissue was homogenized in 500 μL QIAzol® lysis reagent and spun at 12,000× g for 10 min at 4 °C. Supernatant was mixed with 0.1 mL chloroform and incubated at room temperature for 5 min. The mixture was spun at 12,000× g for 15 min at 4 °C and the upper aqueous phase was mixed with 0.25 mL isopropanol and incubated on ice for 2 min and at room temperature for 10 min, then was spun at 12,000× g for 10 min at 4 °C. The pellet was washed with 0.5 mL 70% ethanol and was then resuspended in 50 μL dH2O. The RNA preparations were then treated with DNAseI (TAKARA Bio INC, Shiga, Japan) according to the manufacturer’s recommendations to eliminate gDNA contamination. RNA concentration and purity were assessed by spectrophotometry on a Quawell Q5000 micro volume cuvette free spectrophotometer. The synthesis of first strand cDNA for the quantitative (q)PCR arrays was performed using 500 ng total RNA with the RT2 first strand kit (Qiagen, Hilden, Germany) and according to the manufacturer’s protocol. The synthesis of cDNA for single-gene qPCR was performed with the PrimeScript RT-PCR Reagent Kit (TAKARA Bio INC, Shiga, Japan) using 1 μg total RNA in 20 μL reactions according to the manufacturer’s instructions.

2.4. Quantitative (q)PCR and PCR Arrays

Custom RT2 Profiler PCR arrays (Qiagen, Hilden, Germany) were designed to include 36 genes related to antioxidant activity and apoptosis, lipid metabolism, and anti-inflammatory responses, 5 housekeeping genes for normalization of the expression, 1 genomic DNA contamination-negative control, 3 reverse transcription, and 3 PCR-positive controls (Table 1). The genes included in the array were chosen based on the available published data for the effect of hesperidin, naringin and their aglycones on the expression of genes in the liver (Supplementary Table S1). Each well in a 96-well PCR plate contained the primers for the amplification of one of the 41 transcripts or controls. With each PCR plate, the gene expression in two liver samples was assayed. The RT2 SYBR Green ROX qPCR mastermix (Qiagen, Hilden, Germany) was used to prepare 25 μL quantitative reverse transcription (qRT)-PCR reactions that were performed, according to the manufacturer’s guidelines, in an ABI 7500 thermal cycler (Applied Biosystems, ThermoFisher Scientific, Waltham, MA, USA) under the following thermal program: initial denaturation/activation for 10 min at 95 °C, 40 cycles of 15 s at 95 °C and 1 min at 60 °C. The cycles were followed by a melt curve analysis.
Threshold fluorescence was manually defined using the log view, above the background signal and within the lower half of the linear amplification phase of the amplification plot. Threshold cycle (CT) values were exported for all wells and quality control analysis was performed using the SABiosciences PCR array data analysis excel template. The expression of each gene (GOI) was normalized using the geometric mean of the expression of the housekeeping genes (HKG) ( 2 C T ( G O I ) 2 C T ( H K G ) = 2 C T ). Fold differences in expression levels for each gene in the treatment groups (expt), relative to the control group’s mean expression (ctrl), were determined using the formula: 2 C T ( e x p t ) 2 C T ( c t r l ) = 2 C T . 2 C T values for each sample were extracted and submitted to statistical analysis using the SAS software (see “Statistical analysis” section).
Quantitative (q)RT-PCR was also performed to assess the expression of fatty acid synthase (FASN), peroxisome proliferator-activated receptor gamma (PPARγ), and adiponectin (ADIPOQ) in the breast muscle and fat pad. The actin beta (ACTB) gene was used as the internal control (housekeeping) gene for normalization. The primers used were as follows: ACTB—chACTB_F CGAGGCCCTCTTCCAGCCATCTTT and chACTB_R CACCAGACAGCACTGTGTTGGC; ADIPOQ—chAdipoQ_F CCAGGTCTACAAGGTGTCA and chAdipoQ_R CCATGTGTCCTGGAAATCCT; PPARγ—chPPARg_F TGTTGATTTTTCAAGCATTTCTTCACCACA and chPPARg_R AGGGAGGAGAAGGAGGCTCCAT; FASN—chFASN_F GGCTTGAGTTGGCACAGTGGCTA and chFASN_R CTTGGATTCCCAGCGCCTTCCA. All primers were designed so as to avoid genomic amplification (either across exon–exon boundaries or each primer of a pair was designed at different exons). Reactions were prepared with the KAPA SYBR FAST qPCR Master Mix (2X) Universal (KAPA Biosystems, Boston, Massachusetts, United States), at a 10 μL final volume using 1 μL cDNA (ca 20 ng total RNA) and 200 nM final concentration of each primer. The qPCR thermal protocol used was as follows: 1 cycle of 95 °C for 3 min, 40 cycles of 95 °C for 5 s, 60 °C for 30 s, and a final cycle at 60 °C for 30 s. This was followed by a melt–curve analysis to assess the specificity of the amplification.
The efficiencies of the reactions for all genes were between 90 and 110%, and the correlation coefficient between the threshold cycle and the log(Quantity) for the standard curve was >0.990. The raw data were analyzed with the ABI 7500 software and the mRNA abundance (quantity) was calculated relative to the standard curve obtained from serial dilutions, and was included in each qPCR run. The normalized expression levels of a target gene in each sample were estimated as the ratio of the test gene quantity divided by the respective quantity of the ACTB gene. The relative normalized expression in each sample was estimated as the ratio of the normalized expression divided by the mean normalized expression of the same gene in the control group.

2.5. Statistical Analysis

Statistical analysis was performed using SAS Studio (SAS University edition) and the mixed models task. The treatment effect on FA and the indices was assessed using each test parameter as the dependent variable and the treatment as the explanatory classification variable with fixed effect. Pairwise comparisons were performed between treatments and Tukey adjustment was used for multiple comparisons correction.
To assess the effect of hesperidin (E), naringin (N) and vitamin E (VE) on gene expression, the relative/normalized gene expression from the qPCR arrays, and the single gene qPCRs, the gene expression was assigned as the dependent variable, and E, N and VE were assigned as the classification variables with fixed effects. E and N had three class levels (0, 1, 2) and VE had two class levels (0, 1). The linear dose effects of E and N on FA and gene expression were assayed by assigning E and N as the explanatory continuous variables. Mean differences and treatment effects were considered significant for p < 0.05 and showed a trend towards difference at 0.10 > p > 0.05.

2.6. Ethics Statement

This study was carried out in strict accordance with the guidelines of “Council Directive 86/609/EEC regarding the protection of animals used for experimental and other scientific purposes”. The protocol was approved by the Research Ethics Committee of the Department of Animal Science and Aquaculture of the Agricultural University of Athens (approval document no 20/20032013). All efforts were made to minimize animal suffering.

3. Results

3.1. Effects of Hesperidin, Naringin and Vitamin E on the Fatty Acid Profiles of Breast and Leg Muscle and Fat Pad

The intramuscular fat contents and FA profiles of the pectoralis major (breast) and biceps femoris (thigh) muscles and the abdominal fat pad were assessed in 10 animals per experimental group (Table 2, Table 3, Table 4 and Table 5). No differences in the percentage of intramuscular fat in the breast or thigh were observed between treatment groups (Table 2, p > 0.05).
In the breast intramuscular fat (Table 3), hesperidin (E) and naringin (N) supplementation significantly reduced SFA (by 5–7%), and increased the PUFA (by 8–10%) content and the PUFA/SFA ratio compared to the control diet (p < 0.05). Hesperidin and naringin were supplemented at two different levels (0.75 and 1.5 g per kg or feed), based on previous experimental data from our group for hesperidin supplementation [10], to investigate possible dose-dependent effects. A significant linear dose–response to both E and N supplementation was observed in SFA, PUFA, and PUFA/SFA ratio (p-linear < 0.01). No effect was observed on monounsaturated FA (MUFA) (p > 0.05). In addition, total n-6 levels were significantly increased (by 7.5–12%), and AI and TI were favorably affected by both E and N in a dose-dependent manner (p-linear < 0.01). Total n-6 was significantly increased in all E and N treatment groups, while AI was reduced in the E1, N1 and N2 groups and TI was reduced in the E1, E2 and N2 groups. The observed reduction in total SFA levels can be accounted for mainly by the reduced caproic (C6:0, E1 only), palmitic (C16:0, E1 and N2) and stearic (C18:0, E and N1) acids contents. The total PUFA and n-6 increase can be attributed to the increased content of linoleic acid (18:2n-6) (p < 0.05 and p-linear < 0.01).
The effects of the two flavonoids in the thigh (Table 4) were limited to a significant reduction in docosahexaenoic acid (DHA, C22:6n-3) in all treatment groups and increases in n-6/n-3 ratio in treatment groups E1, N1 and N2 compared to the control (p < 0.05). The response to naringin supplementation followed a linear dose–response in both cases, while the response to hesperidin was linear in the case of DHA only (p-linear < 0.01).
In the fat pad (Table 5), similar to the effect in the breast, E and N significantly increased the contents of total PUFA (by 8.5–11%) and n-6 fatty acids (by 9–10%), as well as the PUFA/SFA ratio, in a dose-dependent manner (p-linear < 0.01). The PUFA, PUFA/SFA and n-6 in all E- or N-supplemented groups differed significantly from the control (p < 0.05).
Hesperidin significantly affected oleic (C18:1), linoleic and α-linolenic (ALA, C18:3n-3) acids in a linear dose-dependent manner (p-linear < 0.05). The trend of a linear dose effect of naringin on oleic acid was observed (0.05 < p-linear < 0.10), and this FA was significantly reduced in N1 compared to the control (p < 0.05). Supplementation with naringin linearly increased linoleic acid and ALA content (p-linear < 0.05). Linoleic acid was increased in both the N1 and N2 groups, while ALA increased significantly in E2 only (p < 0.05). In addition, the total MUFA was significantly reduced by hesperidin supplementation compared to the control (E1 and E2 p < 0.05 and p-linear < 0.01).
Vitamin E diet supplementation was used in this experiment as a positive control for antioxidant activity. In the breast meat, VE reduced SFA content (palmitic acid and total SFA), increased eicosapentaenoic acid (EPA, C20:5n-3), total n-3 and PUFA/SFA ratio, and improved AI and TI compared to the control diet (p < 0.05, Table 3). In the thigh meat, DHA was reduced and n-6/n-3 ratio increased in VE compared to control (Table 4). In the fat pad, oleic acid and total MUFA were reduced, while the linoleic acid, total n-6, PUFA and PUFA/SFA ratio were increased (p < 0.05, Table 5).
A few differences were observed between the E and N treatment groups compared to VE in the thigh and fat pad FA profiles (Table 4 and Table 5). In the thigh, myristic acid and DHA were increased in N2 and E2, respectively, compared to VE, while in the fat pad arachidonic acid (C20:4n-6) was lower in the VE compared to the E1 group only.
In the breast, while all three supplements (E, N and VE) reduced SFA content compared to control, VE mainly reduced palmitic acid, and E and N reduced both palmitic and stearic acids. The stearic acid content was thus found to be significantly reduced in the breast of E and N compared to VE-treated animals (p < 0.05). Furthermore, the EPA and total n-3 content were lower, while linoleic acid, total n-6 and the n-6/n-3 ratio were increased in E and N compared to VE (p < 0.05, Table 3).

3.2. Effects of Hesperidin and Naringin on Gene Expression in the Liver

The hepatic expression of genes involved in biological processes related to oxidative regulation, apoptosis, fatty acid metabolism, lipid metabolism and inflammation was compared between treatment groups (Supplementary Table S2). A total number of 36 genes was selected based on extensive literature data mining to identify genes reported to be differentially expressed in the livers of animals supplemented with naringin, hesperidin, their aglycones naringenin and hespretin, or citrus fruit extracts (Supplementary Table S1). No significant effects of hesperidin or vitamin E on hepatic gene expression were observed (p > 0.05). On the contrary, naringin was found to significantly affect the expression of peroxisome proliferator-activated receptor alpha (PPARα, p < 0.05), Acyl-CoA oxidase 1 (ACOX1, p < 0.05) and glutathione disulfide reductase (GSR, p < 0.05) genes (Supplementary Table S2 and Figure 1). The trend of a positive linear dose–response relationship between naringin and PPARα expression was detected (p-linear = 0.068), as well as a significant increase in the expression in N2 compared to N1 (p < 0.05). The expression of ACOX1 was significantly increased in N1 compared to the control (p < 0.05, Figure 1). A linear dose–response trend to naringin on the expression of GSR was observed (p-linear < 0.01), and the expression of the gene was significantly increased in N2 compared to the control (p < 0.05, Figure 1).

3.3. Expression of FASN, PPARγ and ADIPOQ Genes in the Fat Pad and Breast Muscle

The level of transcription of fatty acid synthase (FASN), peroxisome proliferator-activated receptor gamma (PPARγ) and adiponectin (ADIPOQ) genes was quantified in the breast muscle and fat pad (Table 6). No significant effects of hesperidin, naringin or vitamin E were detected on the expression of genes tested in the fat pad except an increasing trend for the expression of FASN in E1 group (p = 0.077).
On the contrary, a significant linear dose–response (to hesperidin and naringin) on the expression of FASN was observed in the breast. FASN expression increased with increasing hesperidin or naringin supplementation level (p-linear values < 0.0001 and 0.01, respectively, Figure 2a,b). Furthermore, a significant increase was observed in ADIPOQ expression in E1 compared to control (p < 0.05, Figure 2c).

4. Discussion

There is mounting evidence for the benefits of using plant flavonoids in poultry production, including their positive effects on meat fatty acid composition and oxidative stability [1,32]. Here, we found that the citrus flavanones hesperidin and naringin beneficially modulated the fatty acid profile of broiler chicken meat and fat pads (Table 3, Table 4 and Table 5). These effects were more pronounced in the breast meat and fat pad compared to thigh muscle. In the breast meat and fat pad, the PUFA and n-6 contents and PUFA/SFA ratio were increased. In addition, in the breast, the content of SFA was reduced. While the two compounds exhibited beneficial effects on meat FA composition, they had no adverse effects on growth performance [11]. The present study is the first to report the effects of the two flavanones on the FA profile of the fat pad and thigh muscle. The FA composition and transcriptional activity were examined in the fat pad, as in chicken it is an important site of FA storage and reflects the fat content of the animal [33,34]. Similar effects to those found here on the FA profile of breast meat have been reported following the supplementation of broilers with a mixture of hesperidin and genistein [4]. With increasing flavonoid mix concentrations, a reduction in SFA and MUFA was observed and an increase in PUFA in the breast meat was observed. Consistently with these results, the inclusion of orange (as yet unpublished data from our research group) or citrus [35] pulp in the broiler diet has been reported to beneficially affect FA profile. Both orange and citrus pulp increased PUFA content, while citrus pulp additionally reduced SFA and increased the PUFA/SFA ratio in broiler breast meat [35].
Metabolic disorders are currently a major human health issue worldwide. Apart from macronutrients, the quality of fat in the diet, including total SFA, PUFA and n-6 content, affects the development of metabolic disorder-related diseases. In addition to individual FA categories, PUFA/SFA, n-6/n-3 ratios and the atherogenicity and thrombogenicity indices have been proposed to predict the combined effects of different dietary factors on cardiovascular diseases [31]. Furthermore, total SFA and AI in the diet have been found to be significantly correlated with the atherogenic index of the plasma [36], an important index for atherosclerosis risk [37]. Here, we report a significant and dose-dependent beneficial effect of hesperidin, naringin and vitamin E supplementation on AI and TI in the breast muscle. Thus, in the present study we found that both hesperidin and naringin had significant and dose-dependent beneficial effects on various factors of fat quality related to human health, mainly in the breast muscle and fat pad. Consistently with previous reports, many of these effects were also observed following vitamin E supplementation [38,39], but they were more pronounced in the case of the two flavanones.
In chicken, the liver is the main site of fatty acid biosynthesis [40,41]. To study the molecular mechanism underlying the observed effects on FA profile, we quantified the expressions of a number of genes involved in lipid metabolism in the liver (Table 1 and Table S2), breast muscle and fat pad (
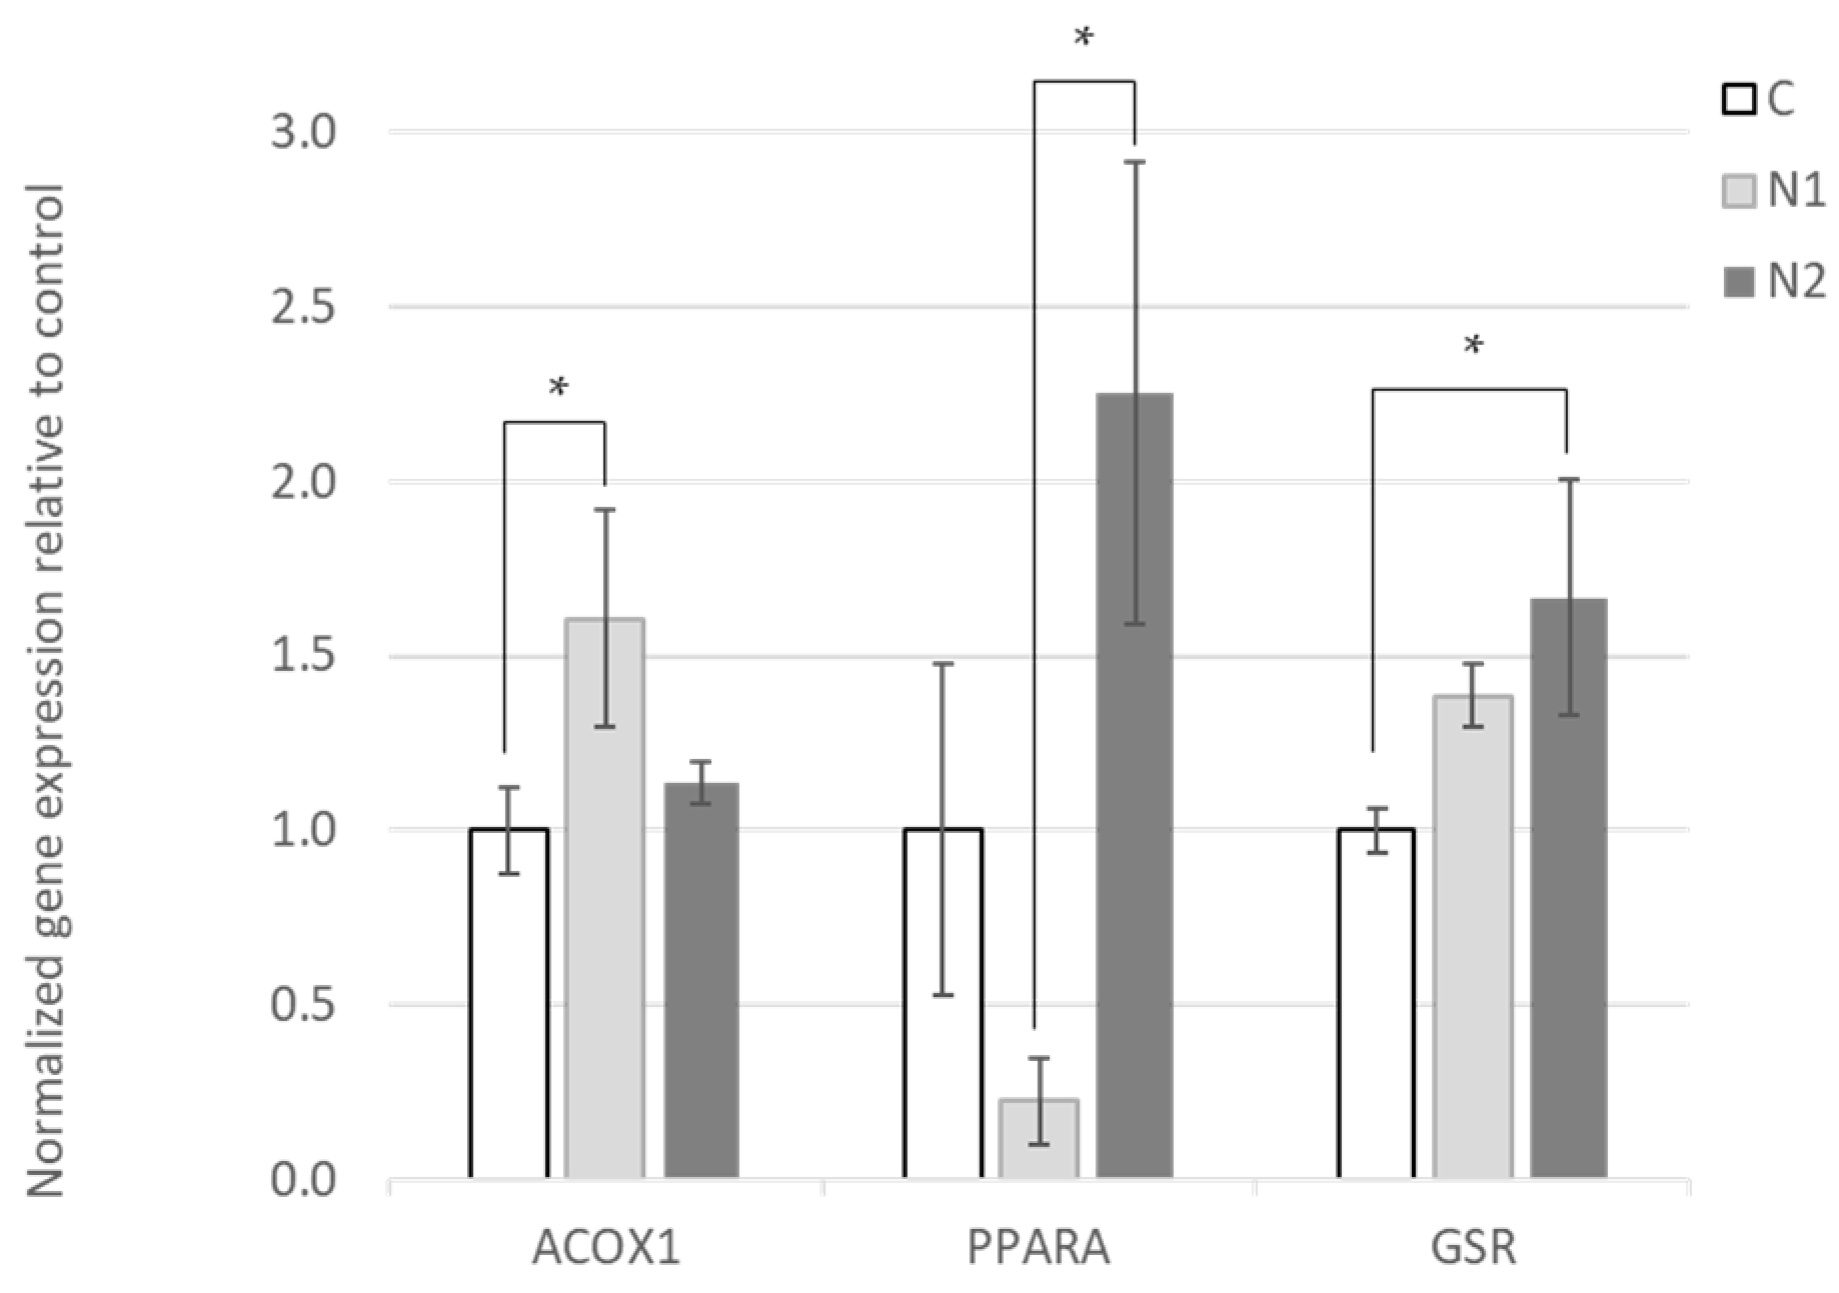
Table 6). We found that the hepatic expression of two genes involved in FA β-oxidation, PPARα and ACOX1, was significantly increased by naringin supplementation. PPARα is a ligand-activated transcription factor that regulates lipid metabolism, and in particular peroxisomal β-oxidation of FA. The activation of PPARα promotes the uptake, utilization, and catabolism of FA via the upregulation of genes involved in FA transport, binding and activation [42]. ACOX1, the first enzyme of the FA β-oxidation pathway, is a transcriptional target of PPARα. There are no reports on the effects of naringin on lipid metabolism-related genes in chicken. Nevertheless, consistently with our findings, quercetin, another plant flavonoid, was reported to increase the expression of PPARα in the livers of broilers [43].
The supplementation of the diet of metabolic disorder-affected mice with naringin and/or its aglycone naringenin has been shown to reduce the hepatic expression of genes related to de novo FA synthesis, and increase the expression of FA β-oxidation genes [44,45,46]. In these animal models, the effects of metabolic disease, such as hyperlipidemia and hypercholesterolemia, were attenuated by naringin/naringenin. Furthermore, similar effects were observed in the liver of naringin/naringenin-treated healthy mice [47], rats [48], and human and rat hepatic cell lines [49]. In all the above cases, the activation of FA β-oxidation was evident by the upregulation of PPARα and/or ACOX1 gene expression, consistently with our findings, with the exception of the findings of Ke et al. [45] who, despite observing an upregulation of FA oxidation, detected reduced ACOX1 expression.
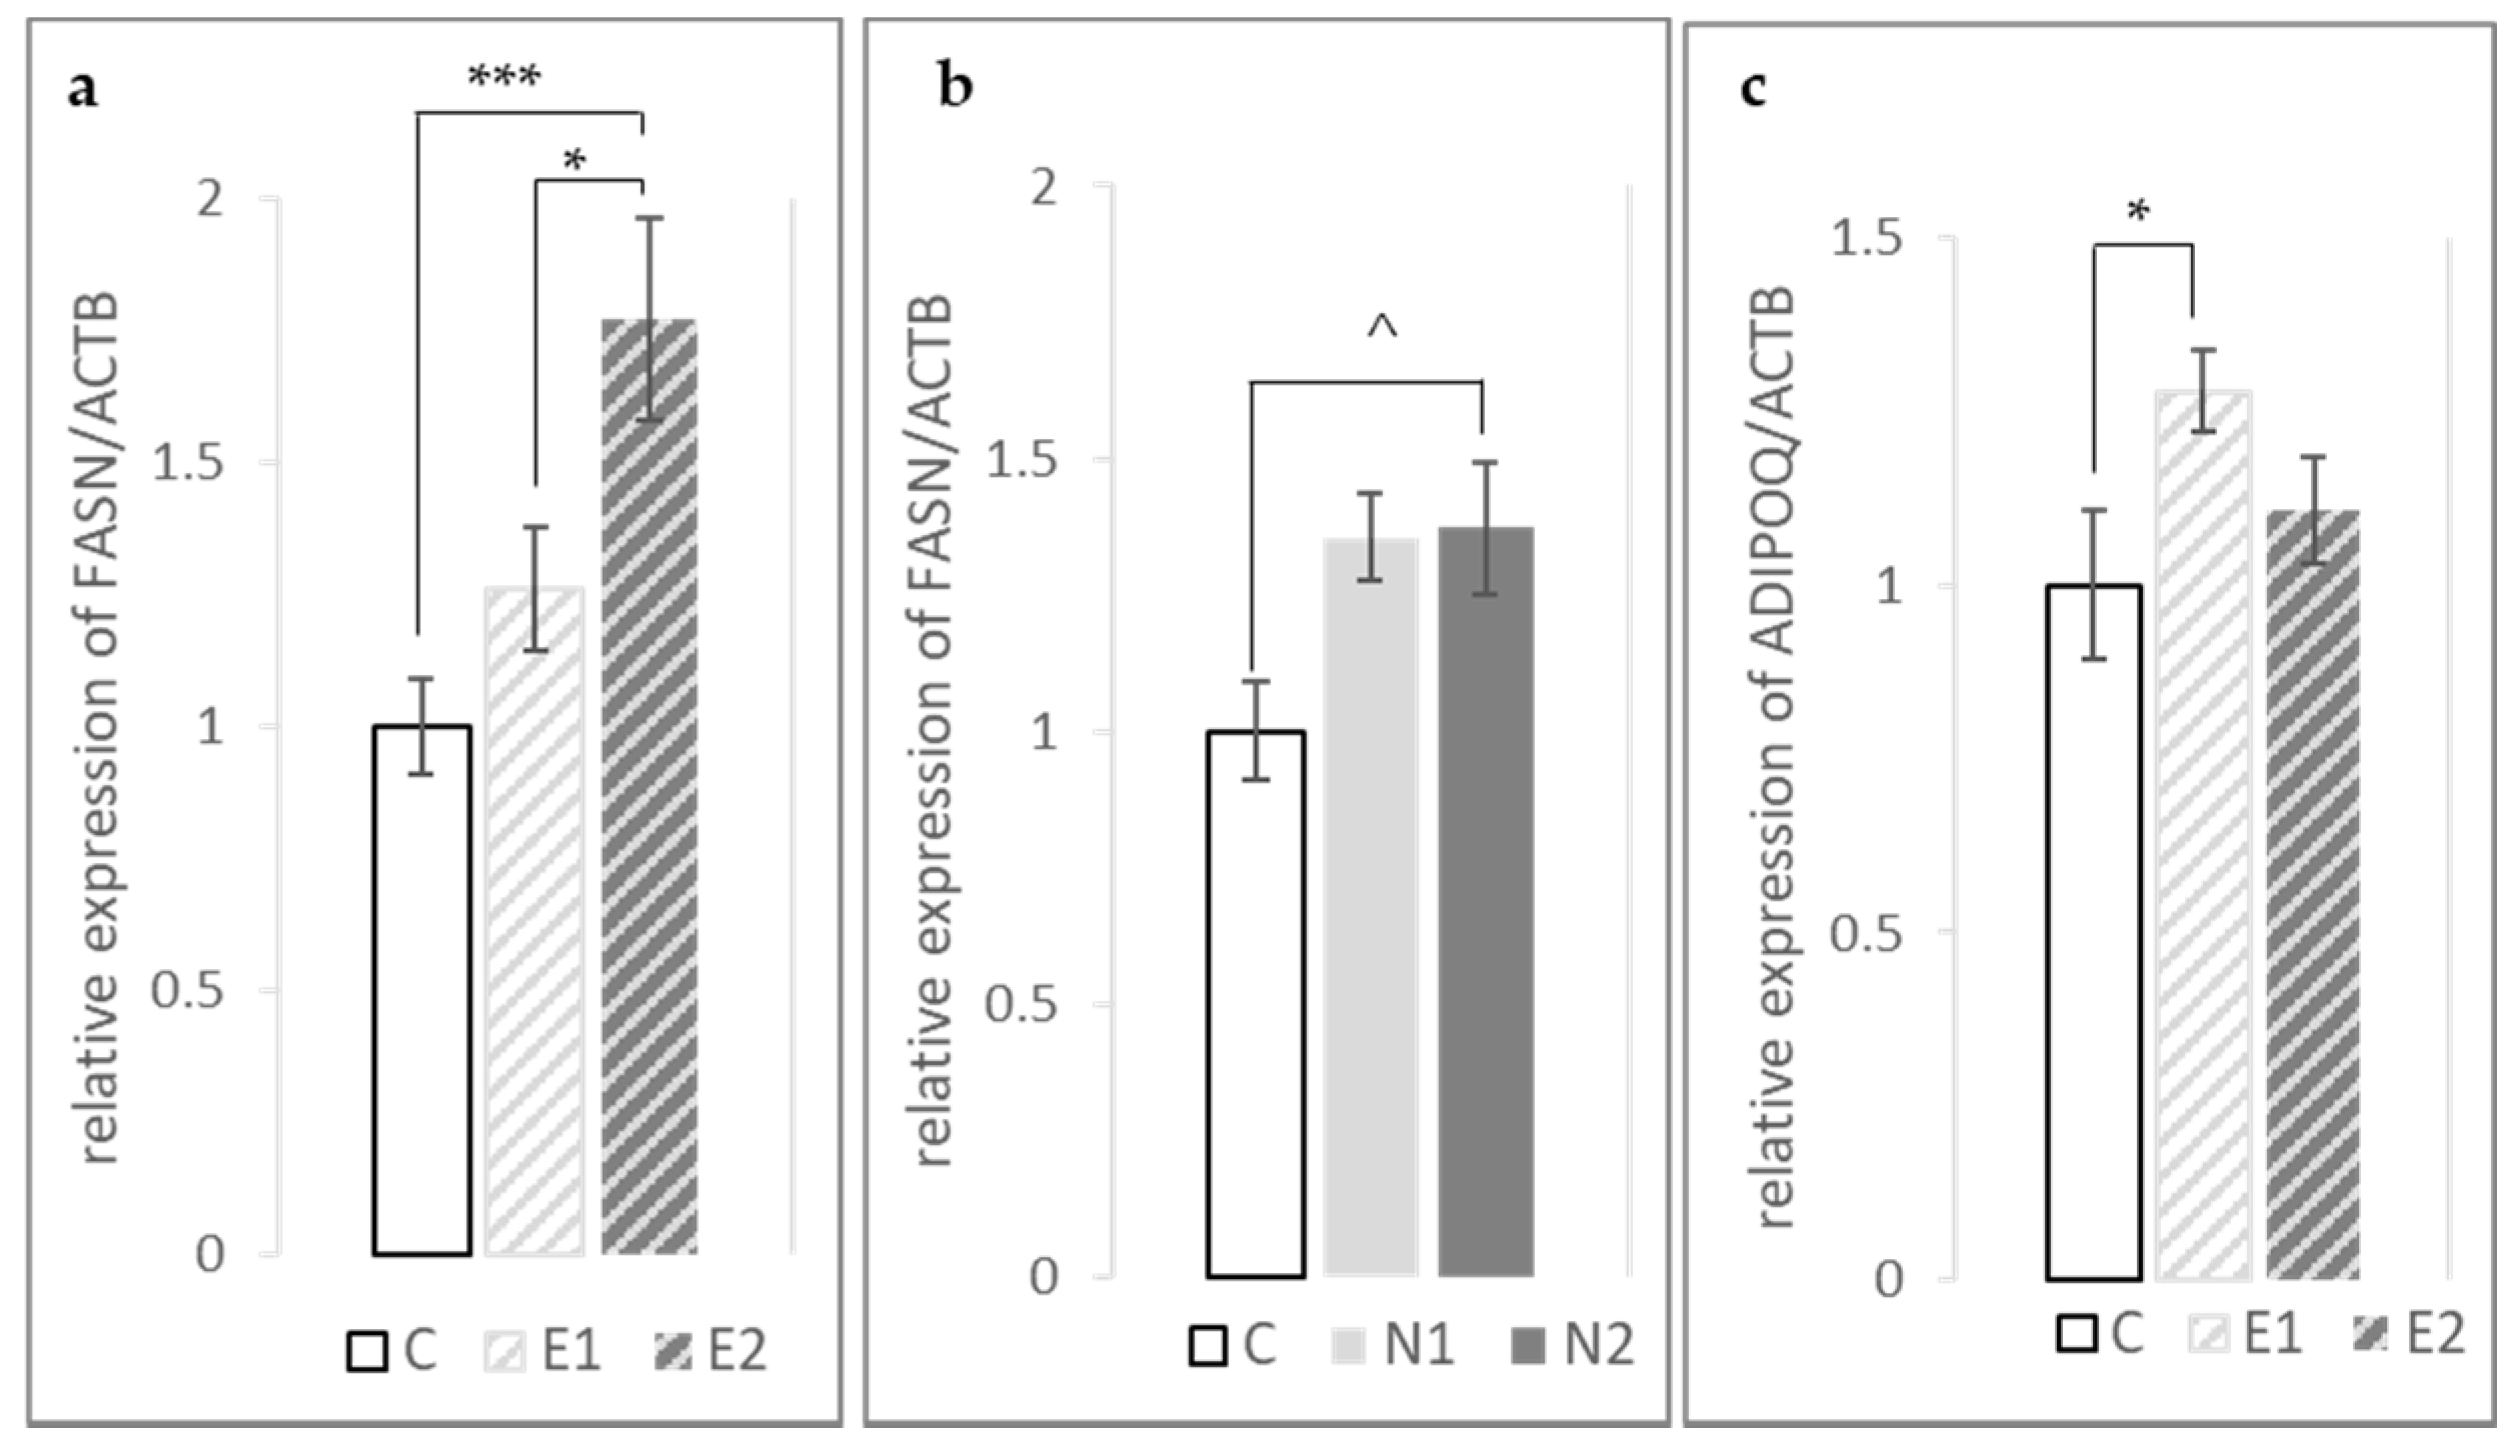
In the breast muscle, we found that FASN expression was increased significantly by both hesperidin and naringin in a dose-dependent manner (p-linear < 0.001 and 0.01, respectively). In contrast to our findings, the hepatic expression of FASN has been shown to be downregulated in response to hesperidin and naringin supplementation [44,46,49,50,51,52]. Nevertheless, it has been observed that effects on FASN expression may differ between the liver and skeletal muscle. A similar increase in FASN expression in the muscle in conjunction with reduced SFA and increased PUFA content was detected in broilers treated with Aspergillus awamori [53]. Interestingly, FASN mRNA expression was upregulated in the muscle tissue of naringenin-supplemented (3% w/w) mice relative to control, but did not reach significance (p = 0.07) [45]. The FASN mRNA expression in our study was not affected in the fat pad (Table 6), where it has been shown to be highly expressed [54]. FASN expression has been positively linked with cell proliferation and rapid development, which is the case of the 42-day-old broiler chickens examined here. Thus, a plausible explanation for the increased FASN expression observed could be that feed alone cannot meet the FA demands of actively proliferating tissues such as muscles, and as a consequence FASN expression rises [55].
Adiponectin is an adipokine produced mainly in the abdominal adipose tissue (fat pad), but also in the skeletal muscle [56]. It is involved in many biological processes and plays a protective role in diabetes, obesity, atherosclerosis and other metabolic deregulations. Increased levels of plasma adiponectin and mRNA expression in the fat pad have been detected in response to hesperidin and naringin supplementation [57,58,59]. Consistently with these findings, and in line with hesperidin’s beneficial effect on metabolic disorders and its anti-inflammatory properties, we detected increased ADIPOQ expression in the breast muscle in the E1 treatment group.
Meat’s oxidative stability has been shown to improve as a result of hesperidin or naringin dietary supplementation [11]. This effect could be attributed to the improvement of antioxidant defense status of the tissues. Indeed, we observed a significant upregulation of glutathione reductase (GSR) gene expression in response to increasing naringin supplementation (Figure 1 and Supplementary Table S2). Hepatic GSR expression was also increased in hesperidin-supplemented animals, but the difference from the control group was not significant. This is in line with the oxidative stability data, which showed that the antioxidant activity of naringin was more pronounced compared to hesperidin [11].
GSR is an enzyme that plays an important role in resisting oxidative stress [60]. It catalyzes the reduction of oxidized glutathione (GSSG) to the reduced glutathione (GSH), which is an essential molecule in resisting oxidative stress and preserving the reducing environment of all tissues. GSH can act as a scavenger for hydroxyl radicals, singlet oxygen, and various electrophiles [61]. The GSSG/GSH ratio present in the cell is important for maintaining the oxidative balance of the cell [62]. It is crucial that the cell reserves high levels of GSH and a low level of GSSG, and this ratio is regulated by GSR. Furthermore, GSH plays a pivotal role in the clearance and metabolism of xenobiotics, acts as a cofactor in specific detoxifying enzymes, participates in transport, and restores antioxidants such as vitamins C and E to their active forms [63]. It can either scavenge hydroxyl radicals and singlet oxygen non enzymatically, or serve as an electron donor to several enzymes involved in reactive oxygen species (ROS) detoxification. Increasing GSH tissue levels may also provide benefits in terms of the improved meat quality of livestock animals. Post-mortem lipid hydroperoxidation and protein oxidation (e.g., oxymyoglobin to metmyoglobin) have significant effects on meat tenderness and color [64,65,66]. GSH as an antioxidant may play a considerable role in preserving the shelf life and quality of meat products [67]. This role may be compared with that of vitamin E [68].
Consistent with our finding, Kapoor et al. [69] showed that the in vitro addition of naringenin to glucose-stressed rat hepatocytes could prevent the generation of ROS and the decline in the cells’ antioxidant defense. In particular, they showed that naringenin restored GR expression in glucose-stressed rat hepatocytes to control levels.
Although vitamin E supplementation also improved oxidative stability, as expected [11], no effect was observed on the hepatic expression of any of the antioxidant genes assessed here. This suggests that there are differences in the molecular mechanisms underlying the antioxidant activity of vitamin E and the two citrus flavanones. It could be argued that VE acts mainly via the direct scavenging of free radicals, while hesperidin and naringin also exert their antioxidant function via gene regulation, or alternatively that vitamin E regulates the expressions of genes not included in the array used in the present study.

5. Conclusions

In conclusion, hesperidin and naringin had beneficial effects on broiler meat’s health-promoting properties. They improved fatty acid profile, by reducing SFA and increasing PUFA content, and beneficially affected the AI and TI indices in breast muscle and the abdominal fat pad. Low levels of supplementation (0.75 g per kg feed) were sufficient for both compounds to exert their beneficial effects. The effects of naringin on FA are likely to be mediated by an increase in FA β-oxidation via the modulation of the expression of PPARα and ACOX1 in the liver. In the case of hesperidin, a role for FASN and ADIPOQ gene expression modulation in the breast muscle is indicated. Furthermore, the antioxidant properties of citrus flavanones observed in broilers could be attributed, at least partly, to the regulation of antioxidant defense genes, such as GSR, which was found here to be significantly affected by naringin supplementation.

Supplementary Materials

The following are available online at https://www.mdpi.com/article/10.3390/foods10040739/s1, Table S1: Review of genes found to be differentially regulated in the liver in response to hesperidin and/or naringin or their aglycones, hesperetin and naringenin, or to citrus fruit extracts containing them. Table S2: Effects of hesperidin (E), naringin (N) and vitamin E (VE) on mean expression of selected genes included in the qPCR array assay, involved in lipid metabolism, antioxidant defense and anti-inflammatory immune regulation.

Author Contributions

Conceptualization: A.L.H.-T., T.M., P.E.S., E.Z., M.C., M.G., S.D. Data curation: A.L.H.-T., T.M., P.E.S., K.P. Formal analysis: A.L.H.-T., M.G. Investigation: A.L.H.-T., K.M., E.S. Methodology: A.L.H.-T., T.M., P.E.S., K.M., E.Z., M.C., S.D. Visualization: A.L.H.-T., Writing – original draft: A.L.H.-T., writing - review & editing: A.L.H.-T., T.M., P.E.S., E.Z., K.P., M.C., M.G., S.D. Project administration: M.C., M.G., S.D. Funding acquisition: S.D. Resources: S.D. Supervision: S.D. All authors have read and agreed to the published version of the manuscript.

Funding

This work was funded by the Hellenic Ministry of National Education and Religious Affairs and the European Union “Thales” framework, project entitled: “The effects of antioxidant’s dietary supplementation on animal product quality” [MIS 380231].

Institutional Review Board Statement

The study was conducted according to the guidelines of the Declaration of Helsinki, and approved by the Departmental Bioethics and Deontology Committee of the Department of Animal Science and Aquaculture, Agricultural University of Athens (approval document no 20/20032013).

Acknowledgments

The authors would also like to thank DSM Nutritional Products Hellas for the donation of vitamin E. The central figure in the graphical abstract was obtained from https://dlpng.com/png/6431978 (accessed on 20 March 2021).

Conflicts of Interest

The authors declare no conflict of interest.

References

  1. Kamboh, A.A.; Leghari, R.A.; Khan, M.A.; Kaka, U.; Naseer, M.; Sazili, A.Q.; Malhi, K.K. Flavonoids supplementation-An ideal approach to improve quality of poultry products. World Poult. Sci. J. 2019, 75, 115–126. [Google Scholar] [CrossRef]
  2. Barreca, D.; Gattuso, G.; Bellocco, E.; Calderaro, A.; Trombetta, D.; Smeriglio, A.; Laganà, G.; Daglia, M.; Meneghini, S.; Nabavi, S.M. Flavanones: Citrus phytochemical with health-promoting properties. BioFactors 2017, 43, 495–506. [Google Scholar] [CrossRef]
  3. Kamboh, A.A.; Memon, A.M.; Mughal, M.J.; Memon, J.; Bakhetgul, M. Dietary effects of soy and citrus flavonoid on antioxidation and microbial quality of meat in broilers. J. Animal Physiol. Anim. Nutr. 2018, 102, 235–240. [Google Scholar] [CrossRef] [PubMed]
  4. Kamboh, A.A.; Zhu, W.Y. Effect of increasing levels of bioflavonoids in broiler feed on plasma anti-oxidative potential, lipid metabolites, and fatty acid composition of meat. Poult. Sci. 2013, 92, 454–461. [Google Scholar] [CrossRef] [PubMed]
  5. Iskender, H.; Yenice, G.; Dokumacioglu, E.; Kaynar, O.; Hayirli, A.; Kaya, A. Comparison of the effects of dietary supplementation of flavonoids on laying hen performance, egg quality and egg nutrient profile. Br. Poult. Sci. 2017, 58, 550–556. [Google Scholar] [CrossRef]
  6. Lien, T.F.; Yeh, H.S.; Su, W.T. Effect of adding extracted hesperetin, naringenin and pectin on egg cholesterol, serum traits and antioxidant activity in laying hens. Arch. Anim. Nutr. 2008, 62, 33–43. [Google Scholar] [CrossRef]
  7. Ting, S.; Yeh, H.S.; Lien, T.F. Effects of supplemental levels of hesperetin and naringenin on egg quality, serum traits and antioxidant activity of laying hens. Anim. Feed Sci. Technol. 2011, 163, 59–66. [Google Scholar] [CrossRef]
  8. Amiot, M.J.; Riva, C.; Vinet, A. Effects of dietary polyphenols on metabolic syndrome features in humans: A systematic review. Obes. Rev. 2016, 17, 573–586. [Google Scholar] [CrossRef]
  9. Fellenberg, M.A.; Speisky, H. Antioxidants: Their effects on broiler oxidative stress and its meat oxidative stability. World Poult. Sci. J. 2006, 62, 53–70. [Google Scholar] [CrossRef]
  10. Simitzis, P.E.; Symeon, G.K.; Charismiadou, M.A.; Ayoutanti, A.G.; Deligeorgis, S.G. The effects of dietary hesperidin supplementation on broiler performance and chicken meat characteristics. Can. J. Anim. Sci. 2011, 91, 275–282. [Google Scholar] [CrossRef] [Green Version]
  11. Goliomytis, M.; Kartsonas, N.; Charismiadou, M.A.; Symeon, G.K.; Simitzis, P.E.; Deligeorgis, S.G. The influence of naringin or hesperidin dietary supplementation on broiler meat quality and oxidative stability. PLoS ONE 2015, 10, e0141652. [Google Scholar] [CrossRef] [PubMed] [Green Version]
  12. Marzoni, M.; Chiarini, R.; Castillo, A.; Romboli, I.; De Marco, M.; Schiavone, A. Effects of dietary natural antioxidant supplementation on broiler chicken and Muscovy duck meat quality. Anim. Sci. Pap. Rep. 2014, 32, 359–368. [Google Scholar]
  13. Kamboh, A.A.; Zhu, W.Y. Individual and combined effects of genistein and hesperidin supplementation on meat quality in meat-type broiler chickens. J. Sci. Food Agric. 2013, 93, 3362–3367. [Google Scholar] [CrossRef]
  14. Hu, L.; Li, L.; Xu, D.; Xia, X.; Pi, R.; Wang, W.; Du, H.; Song, E.; Song, Y. Protective effects of neohesperidin dihydrochalcone against carbon tetrachloride-induced oxidative damage in vivo and in vitro. Chem. Biol. Interact. 2014, 213, 51–59. [Google Scholar] [CrossRef]
  15. Chen, X.J.; Wang, C.; Shu, K.G.; Lei, J.; Nie, H.; Zhang, Y.X.; Gong, Q. Effect of hesperidin pretreatment on the expression of apoptosis-related genes in the liver of mice with acetaminophen-induced acute liver injury. World Chin. J. Dig. 2013, 21, 1278–1285. [Google Scholar] [CrossRef]
  16. Chen, M.C.; Ye, Y.-Y.; Ji, G.; Liu, J.-W. Hesperidin upregulates heme oxygenase-1 to attenuate hydrogen peroxide-induced cell damage in hepatic L02 cells. J. Agric. Food Chem. 2010, 58, 3330–3335. [Google Scholar] [CrossRef] [PubMed]
  17. Jeon, S.M.; Bok, S.H.; Jang, M.K.; Lee, M.K.; Nam, K.T.; Park, Y.B.; Rhee, S.J.; Choi, M.S. Antioxidative activity of naringin and lovastatin in high cholesterol-fed rabbits. Life Sci. 2001, 69, 2855–2866. [Google Scholar] [CrossRef]
  18. Jeon, S.M.; Bok, S.H.; Jang, M.K.; Kim, Y.H.; Nam, K.T.; Jeong, T.S.; Park, Y.B.; Choi, M.S. Comparison of antioxidant effects of naringin and probucol in cholesterol-fed rabbits. Clin. Chim. Acta 2002, 317, 181–190. [Google Scholar] [CrossRef]
  19. Kapoor, R.; Kakkar, P. Naringenin accords hepatoprotection from streptozotocin induced diabetes in vivo by modulating mitochondrial dysfunction and apoptotic signaling cascade. Toxicol. Rep. 2014, 1, 569–581. [Google Scholar] [CrossRef] [Green Version]
  20. Kannappan, S.; Palanisamy, N.; Anuradha, C.V. Suppression of hepatic oxidative events and regulation of eNOS expression in the liver by naringenin in fructose-administered rats. Eur. J. Pharmacol. 2010, 645, 177–184. [Google Scholar] [CrossRef]
  21. Dhanya, R.; Jayamurthy, P. In vitro evaluation of antidiabetic potential of hesperidin and its aglycone hesperetin under oxidative stress in skeletal muscle cell line. Cell Biochem. Funct. 2020, 38, 419–427. [Google Scholar] [CrossRef]
  22. Rathee, P.; Chaudhary, H.; Rathee, S.; Rathee, D.; Kumar, V.; Kohli, K. Mechanism of action of flavonoids as anti-inflammatory agents: A review. Inflamm. Allergy Drug Targets 2009, 8, 229–235. [Google Scholar] [CrossRef]
  23. Kamboh, A.A.; Khan, M.A.; Kaka, U.; Awad, E.A.; Memon, A.M.; Saeed, M.; Korejo, N.A.; Bakhetgul, M.; Kumar, C. Effect of dietary supplementation of phytochemicals on immunity and haematology of growing broiler chickens. Ital. J. Anim. Sci. 2018, 1–6. [Google Scholar] [CrossRef]
  24. Kamboh, A.A.; Zhu, W.Y. Individual and combined effects of genistein and hesperidin on immunity and intestinal morphometry in lipopolysacharide-challenged broiler chickens. Poult. Sci. 2014, 93, 2175–2183. [Google Scholar] [CrossRef] [PubMed]
  25. Parhiz, H.; Roohbakhsh, A.; Soltani, F.; Rezaee, R.; Iranshahi, M. Antioxidant and anti-inflammatory properties of the citrus flavonoids hesperidin and hesperetin: An updated review of their molecular mechanisms and experimental models. Phytother. Res. 2015, 29, 323–331. [Google Scholar] [CrossRef]
  26. Alam, M.A.; Subhan, N.; Rahman, M.M.; Uddin, S.J.; Reza, H.M.; Sarker, S.D. Effect of citrus flavonoids, naringin and naringenin, on metabolic syndrome and their mechanisms of action. Adv. Nutr. 2014, 5, 404–417. [Google Scholar] [CrossRef] [PubMed]
  27. Mahmoud, A.M.; Hernández Bautista, R.J.; Sandhu, M.A.; Hussein, O.E. Beneficial effects of citrus flavonoids on cardiovascular and metabolic health. Oxidative Med. Cell. Longev. 2019, 2019. [Google Scholar] [CrossRef] [Green Version]
  28. Botsoglou, N.A.; Florou-Paneri, P.; Christaki, E.; Fletouris, D.J.; Spais, A.B. Effect of dietary oregano essential oil on performance of chickens and on iron-induced lipid oxidation of breast, thigh and abdominal fat tissues. Br. Poult. Sci. 2002, 43, 223–230. [Google Scholar] [CrossRef]
  29. Folch, J.; Lees, M.; Sloane Stanley, G.H. A simple method for the isolation and purification of total lipides from animal tissues. J. Biol. Chem. 1957, 226, 497–509. [Google Scholar] [CrossRef]
  30. Massouras, T.; Triantaphyllopoulos, K.A.; Theodossiou, I. Chemical composition, protein fraction and fatty acid profile of donkey milk during lactation. Int. Dairy J. 2017, 75, 83–90. [Google Scholar] [CrossRef]
  31. Ulbricht, T.L.V.; Southgate, D.A.T. Coronary heart disease: Seven dietary factors. Lancet 1991, 338, 985–992. [Google Scholar] [CrossRef]
  32. Vlaicu, P.A.; Untea, A.E.; Panaite, T.D.; Turcu, R.P. Effect of dietary orange and grapefruit peel on growth performance, health status, meat quality and intestinal microflora of broiler chickens. Ital. J. Anim. Sci. 2020, 19, 1394–1405. [Google Scholar] [CrossRef]
  33. Fouad, A.M.; El-Senousey, H.K. Nutritional Factors Affecting Abdominal Fat Deposition in Poultry: A Review. Asian Australas. J. Anim. Sci. 2014, 27, 1057–1068. [Google Scholar] [CrossRef] [PubMed] [Green Version]
  34. Nir, I.; Nitsan, Z.; Keren-Zvi, S. Chapter 15—Fat deposition in birds. In Leanness in Domestic Birds; Leclercq, B., Whitehead, C.C., Eds.; Butterworth-Heinemann: Oxford, UK, 1988; pp. 141–174. [Google Scholar]
  35. Mourão, J.L.; Pinheiro, V.M.; Prates, J.A.M.; Bessa, R.J.B.; Ferreira, L.M.A.; Fontes, C.M.G.A.; Ponte, P.I.P. Effect of dietary dehydrated pasture and citrus pulp on the performance and meat quality of broiler chickens. Poult. Sci. 2008, 87, 733–743. [Google Scholar] [CrossRef]
  36. Moussavi Javardi, M.S.; Madani, Z.; Movahedi, A.; Karandish, M.; Abbasi, B. The correlation between dietary fat quality indices and lipid profile with Atherogenic index of plasma in obese and non-obese volunteers: A cross-sectional descriptive-analytic case-control study. Lipids Health Dis. 2020, 19, 213. [Google Scholar] [CrossRef]
  37. Dobiášová, M.; Frohlich, J. The plasma parameter log (TG/HDL-C) as an atherogenic index: Correlation with lipoprotein particle size and esterification rate inapob-lipoprotein-depleted plasma (FERHDL). Clin. Biochem. 2001, 34, 583–588. [Google Scholar] [CrossRef]
  38. Zdanowska-Sąsiadek, Ż.; Michalczuk, M.; Poławska, E.; Damaziak, K.; Niemiec, J.; Radzik-Rant, A. Dietary vitamin E supplementation on cholesterol, vitamin E content, and fatty acid profile in chicken muscles. Can. J. Anim. Sci. 2016, 96, 114–120. [Google Scholar] [CrossRef] [Green Version]
  39. Rebolé, A.; Rodríguez, M.L.; Ortiz, L.T.; Alzueta, C.; Centeno, C.; Viveros, A.; Brenes, A.; Arija, I. Effect of dietary high-oleic acid sunflower seed, palm oil and vitamin E supplementation on broiler performance, fatty acid composition and oxidation susceptibility of meat. Br. Poult. Sci. 2006, 47, 581–591. [Google Scholar] [CrossRef] [PubMed]
  40. Nguyen, P.; Leray, V.; Diez, M.; Serisier, S.; Bloc’h, J.L.; Siliart, B.; Dumon, H. Liver lipid metabolism. J. Anim. Physiol. Anim. Nutr. 2008, 92, 272–283. [Google Scholar] [CrossRef]
  41. Liu, Y.; Zhou, J.; Musa, B.B.; Khawar, H.; Yang, X.; Cao, Y.; Yang, X. Developmental changes in hepatic lipid metabolism of chicks during the embryonic periods and the first week of posthatch. Poult. Sci. 2020, 99, 1655–1662. [Google Scholar] [CrossRef] [PubMed]
  42. Kersten, S. Integrated physiology and systems biology of PPARα. Mol. Metab. 2014, 3, 354–371. [Google Scholar] [CrossRef] [PubMed]
  43. Wang, M.; Xiao, F.L.; Mao, Y.J.; Ying, L.L.; Zhou, B.; Li, Y. Quercetin decreases the triglyceride content through the PPAR signalling pathway in primary hepatocytes of broiler chickens. Biotechnol. Biotechnol. Equip. 2019, 33, 1000–1010. [Google Scholar] [CrossRef] [Green Version]
  44. Pu, P.; Gao, D.M.; Mohamed, S.; Chen, J.; Zhang, J.; Zhou, X.Y.; Zhou, N.J.; Xie, J.; Jiang, H. Naringin ameliorates metabolic syndrome by activating AMP-activated protein kinase in mice fed a high-fat diet. Arch. Biochem. Biophys. 2012, 518, 61–70. [Google Scholar] [CrossRef] [PubMed]
  45. Ke, J.Y.; Kliewer, K.L.; Hamad, E.M.; Cole, R.M.; Powell, K.A.; Andridge, R.R.; Straka, S.R.; Yee, L.D.; Belury, M.A. The flavonoid, naringenin, decreases adipose tissue mass and attenuates ovariectomy-associated metabolic disturbances in mice. Nutr. Metab. 2015, 12. [Google Scholar] [CrossRef] [Green Version]
  46. Zar Kalai, F.; Han, J.; Ksouri, R.; El Omri, A.; Abdelly, C.; Isoda, H. Antiobesity effects of an edible halophyte Nitraria retusa Forssk in 3T3-L1 preadipocyte differentiation and in C57B6J/L mice fed a high fat diet-induced obesity. Evid. Based Complementary Altern. Med. 2013, 2013. [Google Scholar] [CrossRef] [Green Version]
  47. Huong, D.T.T.; Takahashi, Y.; Ide, T. Activity and mRNA levels of enzymes involved in hepatic fatty acid oxidation in mice fed citrus flavonoids. Nutrition 2006, 22, 546–552. [Google Scholar] [CrossRef]
  48. Cho, K.W.; Kim, Y.O.; Andrade, J.E.; Burgess, J.R.; Kim, Y.C. Dietary naringenin increases hepatic peroxisome proliferators-activated receptor α protein expression and decreases plasma triglyceride and adiposity in rats. Eur. J. Nutr. 2011, 50, 81–88. [Google Scholar] [CrossRef]
  49. Goldwasser, J.; Cohen, P.Y.; Yang, E.; Balaguer, P.; Yarmush, M.L.; Nahmias, Y. Transcriptional regulation of human and rat hepatic lipid metabolism by the grapefruit flavonoid naringenin: Role of PPARα, PPARγ and LXRα. PLoS ONE 2010, 5, e12399. [Google Scholar] [CrossRef] [Green Version]
  50. Ohara, T.; Muroyama, K.; Yamamoto, Y.; Murosaki, S. A combination of glucosyl hesperidin and caffeine exhibits an anti-obesity effect by inhibition of hepatic lipogenesis in mice. Phytother. Res. 2015, 29, 310–316. [Google Scholar] [CrossRef] [PubMed]
  51. Lu, Y.; Xi, W.; Ding, X.; Fan, S.; Zhang, Y.; Jiang, D.; Li, Y.; Huang, C.; Zhou, Z. Citrange fruit extracts alleviate obesity-associated metabolic disorder in high-fat diet-induced obese C57BL/6 mouse. Int. J. Mol. Sci. 2013, 14, 23736–23750. [Google Scholar] [CrossRef]
  52. Mitsuzumi, H.; Yasuda, A.; Arai, N.; Sadakiyo, T.; Kubota, M. Glucosyl hesperidin lowers serum triglyceride level in the rats fed a high-fat diet through the reduction of hepatic triglyceride and cholesteryl ester. Jpn. Pharmacol. Ther. 2011, 39, 727–740. [Google Scholar]
  53. Saleh, A.A.; Eid, Y.Z.; Ebeid, T.A.; Ohtsuka, A.; Hioki, K.; Yamamoto, M.; Hayashi, K. The modification of the muscle fatty acid profile by dietary supplementation with Aspergillus awamori in broiler chickens. Br. J. Nutr. 2012, 108, 1596–1602. [Google Scholar] [CrossRef] [Green Version]
  54. Semenkovich, C.F.; Coleman, T.; Fiedorek Jr, F.T. Human fatty acid synthase mRNA: Tissue distribution, genetic mapping, and kinetics of decay after glucose deprivation. J. Lipid Res. 1995, 36, 1507–1521. [Google Scholar] [CrossRef]
  55. Fhu, C.W.; Ali, A. Fatty Acid Synthase: An Emerging Target in Cancer. Molecules 2020, 25, 3935. [Google Scholar] [CrossRef] [PubMed]
  56. Martinez-Huenchullan, S.F.; Tam, C.S.; Ban, L.A.; Ehrenfeld-Slater, P.; McLennan, S.V.; Twigg, S.M. Skeletal muscle adiponectin induction in obesity and exercise. Metab. Clin. Exp. 2020, 102. [Google Scholar] [CrossRef] [PubMed] [Green Version]
  57. Ali, A.M.; Gabbar, M.A.; Abdel-Twab, S.M.; Fahmy, E.M.; Ebaid, H.; Alhazza, I.M.; Ahmed, O.M. Antidiabetic Potency, Antioxidant Effects, and Mode of Actions of Citrus reticulata Fruit Peel Hydroethanolic Extract, Hesperidin, and Quercetin in Nicotinamide/Streptozotocin-Induced Wistar Diabetic Rats. Oxidative Med. Cell. Longev. 2020, 2020. [Google Scholar] [CrossRef]
  58. Haidari, F.; Heybar, H.; Jalali, M.T.; Ahmadi Engali, K.; Helli, B.; Shirbeigi, E. Hesperidin Supplementation Modulates Inflammatory Responses Following Myocardial Infarction. J. Am. Coll. Nutr. 2015, 34, 205–211. [Google Scholar] [CrossRef] [PubMed]
  59. Liu, L.; Shan, S.; Zhang, K.; Ning, Z.Q.; Lu, X.P.; Cheng, Y.Y. Naringenin and Hesperetin, Two Flavonoids Derived from Citrus aurantium Up-regulate Transcription of Adiponectin. Phytother. Res. 2008, 22, 1400–1403. [Google Scholar] [CrossRef]
  60. Zoidis, E.; Seremelis, I.; Kontopoulos, N.; Danezis, G.P. Selenium-dependent antioxidant enzymes: Actions and properties of selenoproteins. Antioxidants 2018, 7, 66. [Google Scholar] [CrossRef] [PubMed] [Green Version]
  61. Forman, H.J.; Davies, K.J.A.; Ursini, F. How do nutritional antioxidants really work: Nucleophilic tone and para-hormesis versus free radical scavenging in vivo. Free Radic. Biol. Med. 2014, 66, 24–35. [Google Scholar] [CrossRef] [Green Version]
  62. Poljsak, B.; Šuput, D.; Milisav, I. Achieving the balance between ROS and antioxidants: When to use the synthetic antioxidants. Oxidative Med. Cell. Longev. 2013. [Google Scholar] [CrossRef]
  63. Kurutas, E.B. The importance of antioxidants which play the role in cellular response against oxidative/nitrosative stress: Current state. Nutr. J. 2016, 15. [Google Scholar] [CrossRef] [Green Version]
  64. Nielsen, J.H.; Sørensen, B.; Skibsted, L.H.; Bertelsen, G. Oxidation in pre-cooked minced pork as influenced by chill storage of raw muscle. Meat Sci. 1997, 46, 191–197. [Google Scholar] [CrossRef]
  65. Mercier, Y.; Gatellier, P.; Renerre, M. Lipid and protein oxidation in vitro, and antioxidant potential in meat from Charolais cows finished on pasture or mixed diet. Meat Sci. 2004, 66, 467–473. [Google Scholar] [CrossRef]
  66. Rowe, L.J.; Maddock, K.R.; Lonergan, S.M.; Huff-Lonergan, E. Influence of early postmortem protein oxidation on beef quality. J. Anim. Sci. 2004, 82, 785–793. [Google Scholar] [CrossRef] [PubMed]
  67. Guo, S.; Ma, J.; Xing, Y.; Xu, Y.; Jin, X.; Yan, S.; Shi, B. Artemisia annua L. aqueous extract as an alternative to antibiotics improving growth performance and antioxidant function in broilers. Ital. J. Anim. Sci. 2020, 19, 399–409. [Google Scholar] [CrossRef] [Green Version]
  68. Liu, S.M.; Eady, S.J. Glutathione: Its implications for animal health, meat quality, and health benefits of consumers. Australian J. Agric. Res. 2005, 56, 775–780. [Google Scholar] [CrossRef]
  69. Kapoor, R.; Rizvi, F.; Kakkar, P. Naringenin prevents high glucose-induced mitochondria-mediated apoptosis involving AIF, Endo-G and caspases. Apoptosis 2013, 18, 9–27. [Google Scholar] [CrossRef] [PubMed]
Figure 1. Effect of naringin on the hepatic expression of Acyl-CoA oxidase 1 (ACOX1), peroxisome proliferator-activated receptor alpha (PPARα) and glutathione disulfide reductase (GSR) genes relative to control. Graph bars represent mean normalized gene expressions in the livers of animals that received C (no supplemented control), N1 (0.75 g naringin/kg feed) and N2 (1.5 g naringin/kg feed) diets relative to mean normalized expression in the control group. Expression was normalized with the geometric mean of four housekeeping genes. Sample size n = 4. Error bars represent SEM and * denotes statistically significant difference between means (p < 0.05). The effect of naringin on GSR expression is dose-dependent (p-linear = 0.008).
Foods 10 00739 g001
Figure 2. Relative expression of FASN and ADIPOQ genes in pectoralis major muscle. The expression of each gene shown is the mean of 6 biological replicates, and each sample is normalized for the corresponding ACTB expression and relative to the mean normalized expression in the control group. (a,b). Expression of FASN in C-E1-E2 and C-N1-N2 treatment groups, respectively. E1 (0.75 g of hesperidin per kg of feed), E2 (1.5 g hesperidin/kg feed), N1 (0.75 g naringin/kg feed), N2 (1.5 g naringin/kg feed) and C (control, no supplementation). Hesperidin’s effect on FASN expression: p = 0.0003, p-linear < 0.0001. Naringin’s effect on FASN expression: p = 0.06, p-linear = 0.01. (c). Expression of ADIPOQ in C-E1-E2 treatment groups. Hesperidin’s effect on ADIPOQ expression: p = 0.05. p-linear non-significant. Statistical differences between means are shown (* p < 0.05, *** p < 0.001, ^ p < 0.10).
Foods 10 00739 g002
Table 1. Genes included in the quantitative (q)PCR array.
Gene/Assay SymbolGene/Assay DescriptionUnigeneGeneBankGene Function
CATCatalaseGga.1183NM_001031215Antioxidant
DIO1Deiodinase, Iodothyronine deiodinase Type IGga.553NM_001097614
DIO2Deiodinase, Iodothyronine deiodinase Type IIGga.51485NM_204114
GPX1Glutathione peroxidase 1Gga.1465NM_001277853
GPX4Glutathione peroxidase 4Gga.107XM_003642871
GSRGlutathione ReductaseGga.34900XM_001235016
SOD1CuZn Superoxide DismutaseGga.3346NM_205064
SOD2Mn Superoxide DismutaseGga.937NM_204211
SOD3extracellular Cu-Zn-Superoxide DismutaseGga.1128XM_420760
TXNRD1Thioredoxin reductase Type IGga.4380NM_001030762
TXNRD2Thioredoxin reductase Type IIGga.29425NM_001122691
BCL2B-cell CLL/lymphoma 2Gga.42172NM_205339Apoptosis
CASP3Caspase 3, apoptosis-related cysteine peptidaseGga.4346NM_204725
CASP8Caspase 8, apoptosis-related cysteine peptidaseGga.2451NM_204592
CASP9Caspase 9, apoptosis-related cysteine peptidaseGga.4116XM_424580
TMBIM1Transmembrane BAX inhibitor motif containing 1Gga.7211XM_422067
ACOX1Acyl-CoA oxidase 1, palmitoylGga.39153NM_001006205Fatty Acid Metabolism
CPT1ACarnitine palmitoyltransferase 1A (liver)Gga.9299NM_001012898
FASNFatty acid synthaseGga.8951NM_205155
PPARAPeroxisome proliferator-activated receptor alphaGga.4006NM_001001464
PPARGPeroxisome proliferator-activated receptor gammaGga.3858NM_001001460
PPARGC1APeroxisome proliferator-activated receptor gamma, coactivator 1 alphaGga.22894NM_001006457
SCDStearoyl-CoA desaturaseGga.17055NM_204890
SREBF1Sterol regulatory element binding transcription factor 1Gga.51495NM_204126
LDLRLow density lipoprotein receptorGga.8517NM_204452Lipid metabolism
LPLLipoprotein lipaseGga.1152NM_205282
ACACAacetyl-CoA carboxylase alphaGga.1480NM_205505Metabolism
GCKSimilar to glucokinaseGga.48051XM_004949993
IL10Interleukin 10Gga.46641NM_001004414pro-inflammatory
IL1BInterleukin 1, betaGga.19NM_204524
IL2Interleukin 2Gga.4946NM_204153
IL6Interleukin 6 (interferon, beta 2)Gga.2769NM_204628
LITAFlipopolysaccharide-induced tumor necrosis factor-alpha factor homologGga.3383NM_204267
NOS2Inducible Nitric Oxide synthaseGga.3327NM_204961
PTGS2Prostaglandin-endoperoxide synthase 2Gga.4401NM_001167718
SMAD3SMAD family member 3Gga.28197NM_204475
ACTBActin, betaGga.43416NM_205518Housekeeping
H6PDHexose-6-phosphate dehydrogenaseGga.50291XM_425746
HMBSHydroxymethylbilane synthaseGga.8480XM_417846
RPL4Ribosomal protein L4Gga.4523NM_001007479
UBCUbiquitin CGga.39142XM_001234599
GGDCgenomic DNA contamination negative control
RTCreverse transcription positive control
PPCPCR-positive control
Table 2. Effect of hesperidin (E), naringin (N) and vitamin E (VE) on intramuscular fat content in pectoralis major (breast) and biceps femoris (thigh).
Treatmentp-Valuep-Linear
% Intramuscular FatCE1E2N1N2VESEM C-E1-E2C-N1-N2
Breast1.521.381.681.151.421.170.15NSNSNS
Thigh5.245.224.854.555.125.240.34NSNSNS
C (no supplementation), E1 (0.75 g of hesperidin per kg of feed), E2 (1.5 g hesperidin/kg feed), N1 (0.75 g naringin/kg feed), N2 (1.5 g naringin/kg feed) and VE (0.2 g a-tocopheryl acetate/kg feed). Significance of treatment (p) and linear dose–response to E and N (p-linear) are shown. NS: not significant.
Table 3. Effect of hesperidin (E), naringin (N) and vitamin E (VE) on intramuscular fat content, fatty acid profile and atherogenicity (AI) and thrombogenicity (TI) indices in the pectoralis major breast muscle.
Tissue: BreastTreatment (LSM) p-Linear
ParameterCE1E2N1N2VESEMp-ValueC-E1-E2C-N1-N2
FA (% of Total)
C6:00.0180.006 C0.0140.0070.0110.0120.0027*NSNS
C10:00.0160.0170.0180.0120.0110.0170.0032NSNSNS
C12:00.0180.0150.0210.0140.0170.0200.0030NSNSNS
C14:00.450.440.440.420.430.420.01NSNSNS
C14:10.0710.0720.0640.0610.0700.0600.0044NSNSNS
C15:00.0800.0760.0820.0820.0800.0790.0028NSNSNS
C16:025.6024.33 C24.7424.8124.29 C24.24 C0.28*****
C16:13.223.293.012.913.052.930.16NSNSNS
C17:00.1120.1020.1130.1140.1100.1140.005NSNSNS
C17:10.0710.0700.0700.0680.0690.0650.004NSNSNS
C18:08.146.98 C,VE6.88 C,VE7.14 C,VE7.487.870.17*********
C18:133.6833.4533.1233.2833.5333.880.36NSNSNS
C18:2n-622.8925.06 C25.69 C,VE25.39 C,VE24.65 C23.660.38**********
C18:3n-31.711.81 VE1.791.741.761.650.04*0.1NS
C20:3n-60.4350.3520.4170.4370.4100.3950.038NSNSNS
C20:4n-60.2020.2300.2030.2150.1930.1930.009*NSNS
C20:5n-32.032.15 VE2.17 VE2.17 VE2.533.08 C0.20**NS0.07
C22:5n-30.0280.251 C,VE0.0220.0060.0030.0540.019****NS*
C22:6 n-31.291.421.171.151.321.320.10NSNSNS
SFA34.4231.95 C32.29 C32.59 C32.42 C32.76 C0.34*********
MUFA37.0436.8836.2636.3236.7236.940.45NSNSNS
PUFA28.5731.26 C31.46 C31.11 C30.87 C30.350.48********
PUFA/SFA0.8310.980 C0.977 C0.956 C0.953 C0.927 C0.021**********
n-623.0925.29 C25.89 C,VE25.61 C,VE24.84 C23.850.37**********
n-35.055.625.15 VE5.06 VE5.626.10 C0.21**NSNS
n-6/n-34.624.545.10 VE5.14 VE4.443.980.18****NSNS
AI0.4180.383 C0.3920.393 C0.385 C0.386 C0.006******
TI0.7530.660 C0.689 C0.7010.674 C0.667 C0.015*******
C (no supplementation), E1 (0.75 g of hesperidin per kg of feed), E2 (1.5 g hesperidin/kg feed), N1 (0.75 g naringin/kg feed), N2 (1.5 g naringin/kg feed) and VE (0.2 g a-tocopheryl acetate/kg feed). Significance of treatment (p) and linear dose-response to E and N (p-linear) are shown. C: Means differ significantly from C (p < 0.05). VE: Means differ significantly from VE (p < 0.05). * p < 0.05, ** p < 0.01, *** p < 0.001, **** p < 0.0001. NS: not significant.
Table 4. Effect of hesperidin (E), naringin (N) and vitamin E (VE) on intramuscular fat content, fatty acid profile and atherogenicity (AI) and thrombogenicity (TI) indices in the biceps femoris thigh muscle.
Tissue: ThighTreatment p-Linear
ParameterCE1E2N1N2VESEMp-ValueC-E1-E2C-N1-N2
FA (% of Total)
C6:00.0040.010 C0.0050.0040.0070.0060.001*NSNS
C10:00.0080.0080.0070.0080.0080.0070.001NSNSNS
C12:00.0220.0220.0210.0220.0220.0200.001NSNSNS
C14:00.4680.4810.4670.4660.486 VE0.4420.010*NSNS
C14:10.0880.0910.0800.0790.0910.0770.005NSNSNS
C15:00.0750.0790.0800.0820.0800.0780.003NSNSNS
C16:023.9723.9424.2424.0623.8923.270.28NSNSNS
C16:14.2504.4033.9433.9564.5093.9560.198NSNSNS
C17:00.0800.0830.0900.0890.0830.0870.006NSNSNS
C17:10.1070.1060.1020.1100.1120.1060.005NSNSNS
C18:05.4385.4135.5995.0385.3245.6490.225NSNSNS
C18:135.8936.1435.4635.1535.9137.340.54^NSNS
C18:2n-625.3425.4125.7726.8525.6425.160.54NSNSNS
C18:3n-32.0942.0832.1352.1512.1182.0640.035NSNSNS
C20:3n-60.1390.1480.1590.1630.1550.1430.010NSNSNS
C20:4n-60.2280.2250.2220.2240.2250.2210.008NSNSNS
C20:5n-30.9630.9561.0571.1461.0071.0460.081NSNSNS
C22:5n-30.0460.0570.0460.0040.0090.0200.010**NS**
C22:6n-30.8210.374 C0.567 C,VE0.403 C0.331 C0.315 C0.041**********
SFA30.0630.0330.5129.7629.8929.550.32NSNSNS
MUFA40.3340.7439.5939.2940.6241.480.63NSNSNS
PUFA29.6329.2529.9630.9429.4828.970.64NSNSNS
PUFA/SFA0.9880.9750.9841.0400.9880.9830.027NSNSNS
n-625.5625.6325.9927.0725.8625.380.54NSNSNS
n-33.9233.4703.8053.7043.4643.4460.118*NS^
n-6/n-36.5787.412 C6.8597.329 C7.500 C7.400 C0.156***NS**
AI0.3700.3700.3760.3700.3690.3560.006NSNSNS
TI0.6670.6830.6840.6660.6790.6700.012NSNSNS
C (no supplementation), E1 (0.75 g of hesperidin per kg of feed), E2 (1.5 g hesperidin/kg feed), N1 (0.75 g naringin/kg feed), N2 (1.5 g naringin/kg feed) and VE (0.2 g a-tocopheryl acetate/kg feed). Significance of treatment (P) and linear dose–response to E and N (p-linear) are shown. C: Means differ significantly from C (p < 0.05). VE: Means differ significantly from VE (p < 0.05). * p < 0.05, ** p < 0.01, *** p < 0.001, **** p < 0.0001, ^ 0.10 > p > 0.05. NS: not significant.
Table 5. Effect of hesperidin (E), naringin (N) and vitamin E (VE) on fatty acid (FA) profile and atherogenicity (AI) and thrombogenicity (TI) indices in the abdominal adipose tissue.
Tissue: Fat PadTreatment (LSM) p-Valuep-Linear
ParameterCE1E2N1N2VESEMTreatmentC-E1-E2C-N1-N2
FA (% of Total)
C10:00.0060.0080.0070.0080.0080.0080.001NSNSNS
C12:00.0210.0230.0220.0270.0220.0210.002NSNSNS
C14:00.4710.4810.4750.4880.4790.4470.016NSNSNS
C14:10.0960.0960.0870.0820.0960.0820.007NSNSNS
C15:00.0760.0740.0740.0730.0650.0710.005NSNSNS
C16:024.1623.2223.0322.9423.1523.410.35NS^^
C16:14.7564.5484.1094.4064.5364.0830.269NSNSNS
C17:00.0690.0720.0790.0740.0710.0750.007NSNSNS
C17:10.1080.1150.1080.1090.1190.1220.006NSNSNS
C18:04.3484.4064.5004.4924.2904.2130.269NSNSNS
C18:138.8837.16 C37.57 C37.56 C37.8136.90 C0.31****^
C18:2n-623.7325.64 C26.06 C26.17 C25.93 C26.94 C0.42********
C18:3n-32.1642.2272.518 C2.3072.3062.3230.062******
C20:3n-60.0780.1040.1900.0860.1120.0970.029NS**NS
C20:4n-60.2300.467 C,VE0.2840.2360.2130.2420.046**NSNS
C20:5n-30.2990.6150.3230.4980.2780.4470.107NSNSNS
C22:5n-30.2350.2420.3320.2240.2830.2620.046NS^NS
C22:6n-30.2790.4800.2620.2380.2200.2470.079NSNSNS
SFA29.1528.2928.1928.1028.0928.240.38NSNS^
MUFA43.8441.92 C41.87 C42.1542.5641.19 C0.46****NS
PUFA27.0129.77 C29.97 C29.76 C29.34 C30.56 C0.46*********
PUFA/SFA0.9311.055 C1.065 C1.061 C1.048 C1.084 C0.025******
n-623.9726.10 C26.34 C26.40 C26.14 C27.18 C0.43********
n-32.9783.5643.4343.2673.0883.2790.164NS^NS
n-6/n-38.2457.7187.7318.1368.5868.3990.382NSNSNS
AI0.3680.3510.3470.3470.3490.3520.007NS^^
TI0.6760.6290.6300.6320.6400.6370.014NS*NS
Significance of treatment (P) and linear dose–response to E and N (p-linear) are shown. C (no supplementation), E1 (0.75 g of hesperidin per kg of feed), E2 (1.5 g hesperidin/kg feed), N1 (0.75 g naringin/kg feed), N2 (1.5 g naringin/kg feed) and VE (0.2 g a-tocopheryl acetate/kg feed). C: Means differ significantly from C (p < 0.05). VE: Means differ significantly from VE (p < 0.05). * p < 0.05, ** p < 0.01, *** p < 0.001, **** p < 0.0001, ^ 0.10 > p > 0.05. NS: not significant.
Table 6. Effects of hesperidin (E), naringin (N) and vitamin E (VE) on mean expression of adiponectin (ADIPOQ), fatty acid synthase (FASN) and peroxisome proliferator-activated receptor gamma (PPARγ) in the breast pectoralis major (breast) muscle and abdominal adipose tissue (fat pad).
Treatment Mean ± SEM p-Value p-Linear
CE1E2N1N2VEENVEC-E1-E2C-N1-N2
Breast muscle
ADIPOQ1 ± 0.111.28 ± 0.061.11 ± 0.081.13 ± 0.080.87 ± 0.041.00 ± 0.09*^NSNSNS
FASN1 ± 0.091.26 ± 0.121.77 ± 0.191.36 ± 0.081.37 ± 0.121.09 ± 0.07***^NS******
PPARγ1 ± 0.120.98 ± 0.091.09 ± 0.171.05 ± 0.070.93 ± 0.070.92 ± 0.09NSNSNSNSNS
Fat pad
ADIPOQ1 ± 0.080.96 ± 0.251.46 ± 0.291.11 ± 0.321.06 ± 0.31.09 ± 0.18NSNSNSNSNS
FASN1 ± 0.061.82 ± 0.561.15 ± 0.191.29 ± 0.271.09 ± 0.221.33 ± 0.18^NSNSNSNS
PPARγ1 ± 0.171.27 ± 0.471.33 ± 0.170.8 ± 0.220.74 ± 0.171.01 ± 0.28NSNSNSNSNS
Expression is relative to the control group. Significance of hesperidin (E), naringin (N) and vitamin E (VE) treatment effects (p-value) and linear dose–response relationship of E and N (p-linear) are shown. C (no supplementation), E1 (0.75 g of hesperidin per kg of feed), E2 (1.5 g hesperidin/kg feed), N1 (0.75 g naringin/kg feed), N2 (1.5 g naringin/kg feed) and VE (0.2 g a-tocopheryl acetate/kg feed). * p < 0.05, ** p < 0.01, *** p < 0.001, **** p < 0.0001, ^ 0.10 > p > 0.05. NS: not significant.
Publisher’s Note: MDPI stays neutral with regard to jurisdictional claims in published maps and institutional affiliations.

