Article

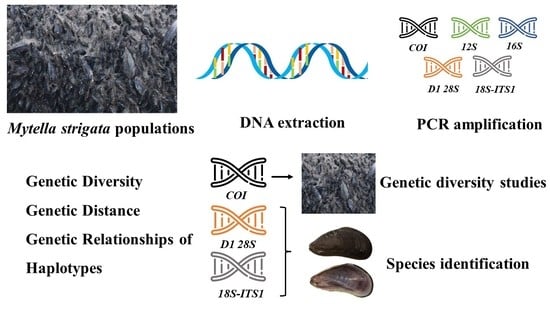
Evaluating the Utility of Five Gene Fragments for Genetic Diversity Analyses of Mytella strigata Populations

1
Laboratory of Marine Organism Taxonomy & Phylogeny, Qingdao Key Laboratory of Marine Biodiversity and Conservation, Institute of Oceanology, Chinese Academy of Sciences, Qingdao 266071, China
2
College of Life Sciences, Qingdao University, Qingdao 266000, China
3
University of Chinese Academy of Sciences, Beijing 100049, China
*
Authors to whom correspondence should be addressed.
Fishes 2023, 8(1), 34; https://doi.org/10.3390/fishes8010034
Submission received: 7 December 2022 / Revised: 26 December 2022 / Accepted: 30 December 2022 / Published: 3 January 2023
(This article belongs to the Special Issue Mollusk Genetic Diversity and Breeding Technology)

Abstract

:
Mytella strigata (Hanley, 1843) is an invasive mussel species that has rapidly spread in China in recent years. Here, we tested the utility of three mitochondrial gene fragments, COI, 12S, and 16S, and two nuclear gene fragments, D1 28S and 18S-ITS1, for characterizing the levels of genetic diversity among and within populations using 191 M. strigata specimens collected in China to aid ongoing efforts to identify the origin of the invasion as well as molecular genetic studies. M. strigata exhibited two sex-associated haplogroups according to the COI and 12S sequences. The ratio of female-lineage to male-lineage COI and 12S sequences was 149:22 and 72:7, and the genetic distances between haplogroups were 6.56 and 9.17, respectively. Only one haplotype was detected among the 18S-ITS1 sequences (413 bp), and three haplotypes were detected among the D1 28S sequences (296 bp). The haplotype diversity of both the female-lineage COI and 12S sequences was greater than 0.5, and the nucleotide diversity of the 12S, 16S, D1 28S, and 18S-ITS1 sequences was less than 0.005 in all six populations in China. Our findings indicated that COI is the most useful gene fragment for genetic diversity studies of M. strigata populations; D1 28S and 18S-ITS1 sequences would be useful for species identification because of their low intraspecific diversity. Our genetic analysis of the COI sequences revealed Colombia as the most likely origin of M. strigata in China and showed that the invasive populations in China have recently experienced or are currently experiencing a population bottleneck.

Graphical Abstract

1. Introduction

Biological invasions pose a major threat to native biodiversity and ecosystem health [1], as they have been shown to lead to the decline or extirpation of native species [2], have deleterious effects on ecosystem functions, and affect the global environment [3,4,5]. The four stages of biological invasions include introduction, establishment, spread, and impact; the eradication of invasive species is often considered a futile endeavor once the establishment stage is reached [6]. Human activities are responsible for the introduction of many marine invasive species, especially through ballast water [7,8]; however, ocean and coastal currents can promote the spread of invasive species over small areas and, thus, increase the complexity of the dynamics of invasions [9]. Population genetic studies are essential for evaluating the current status of invasive populations as well as monitoring and controlling their spread; such studies can also help identify the origins of invasions and provide insights into patterns of genetic variation and molecular evolution [10].
Mytella strigata (Hanley, 1843) (=Mytella charruana (d’Orbigny, 1846)) is native to the Pacific and Atlantic coasts of tropical America [11]. This species has received increased research attention because it has been reported in various regions, including Florida [12] and the Indo-West Pacific [13], namely, the Philippines [14], Singapore [11], Thailand [15], India [16], and China [17]. M. strigata has spread rapidly in China in recent years, and the invasion of this species is currently thought to be in the establishment and spread stages [18]. Given that there is extensive variation in shell color and shell surface pattern in M. strigata and related species [11], mitochondrial cytochrome oxidase subunit I (COI) and large subunit of nuclear ribosomal RNA (28S) sequences have been used to distinguish M. strigata from similar species [11,17,19]. COI sequences also have been used to characterize the distribution of haplotypes [13,19]. However, two types of heteroplasmy have been detected in the COI sequences of M. strigata. The first is characterized by the presence of two distinct sex-associated mitochondrial lineages [20], which is common in bivalves with both egg-transmitted (female-lineage mitochondrial DNA (mtDNA), F-mtDNA) and sperm-transmitted mitochondrial genomes (male-lineage mtDNA, M-mtDNA) [20,21]; this is referred to as the doubly uniparental inheritance (DUI) pattern [22]. The second is characterized by the presence of two different haplogroups in both sexes; only one of these haplogroups has been detected in Brazil [13]. The p-distance between two sex-associated COI lineages of M. strigata ranges from 20.5% to 20.8% [23]. This has limited the use of COI sequences for population genetic studies; there is thus a pressing need to identify mitochondrial and nuclear markers that could be used to identify the origin of M. strigata invasions and characterize the patterns of molecular variation in M. strigata.
Here, we evaluated the utility of five genetic markers, including three mitochondrial gene fragments, COI, the small subunit ribosomal RNA (12S), and the large subunit ribosomal RNA (16S), and two nuclear gene fragments, the D1 region of 28S (D1 28S) and a fragment from the small subunit ribosomal RNA to internal transcribed spacer-1 (18S-ITS1), for studies of genetic diversity among and within M. strigata populations. Population genetic analyses were conducted to characterize genetic variation among Chinese, Colombian, Ecuadorian, and American populations of M. strigata. The aims of this study were to (1) detect the intraspecific diversity for the five gene fragments, (2) identify the gene fragments most useful for population genetic analyses, and (3) evaluate the relationships between invasive and native populations to identify the origin of M. strigata invasions in China.

2. Materials and Methods

A total of 191 M. strigata individuals were collected from four provinces in China from November 2020 to August 2022, and these samples were obtained from six populations: Jimei (JM), Shanwei (SW), Xuwen (XW), Zhanjiang (ZJ), Beihai (BH), and Hainan (HN) (Figure 1, Table 1). All samples were identified as M. strigata according to the morphological descriptions of Lim et al. (2018), Sanpanich and Wells (2019), and Huang et al. (2021); the main characteristics used to distinguish M. strigata from similar species include the subterminal umbos, external shell color, coloration patterns, and 3 or 4 (as many as 7) teeth in the anterior ventral region of the valves. These specimens were preserved in 95% alcohol. A Tiangen DNA kit (DP324, Tiangen Biotech (Beijing) Co., Ltd., Beijing, China) was used to extract total DNA from the adductor muscles per the manufacturer’s instructions. The primers used to amplify the COI, 12S, 16S, D1 28S, and 18S-ITS1 sequences are shown in Table 2. Each PCR reaction mixture contained 0.5 μL of each primer, 1.0 μL of DNA, 12.5 μL of 2× Taq PCR MasterMix (PC1120; Beijing Solarbio Science & Technology Co., Ltd., Beijing, China), and 10.5 μL of ddH2O in a total volume of 25 μL. For the COI, 12S, and 16S sequences, the thermal cycling conditions were as follows: initial denaturation at 95 °C for 3 min; 32 cycles of 95 °C for 30 s, 48 °C for 1 min, and 72 °C for 1 min; and a final extension at 72 °C for 5 min. The thermal cycling conditions for the D1 28S and 18S-ITS1 sequences were based on those described in Lim et al. (2018) (Table 2). Agarose gel electrophoresis was used to confirm the PCR products, and an Applied Biosystems 3730xl Genetic Analyzer (Tsingke Biotechnology Co., Ltd., Beijing, China) was used for sequencing.
Because of sex-related heteroplasmy in COI, MEGA 11.0.13 software [27] was used to align all COI sequences in Chinese populations with confirmed female-lineage COI sequences (F-COI, GenBank accession Nos. JQ685156; MG736074; and MG736082) and male-lineage COI sequences (M-COI, Nos. JQ685158; JQ685159; and MG736069) to identify the lineage corresponding to each sequence [11,23]. Alignment of all 12S sequences from China in this study revealed two genetically distinct haplogroups: one covering the 12S sequence that was confirmed from a female (No. MT991018), which was defined as F-12S, and the other was identified as male-lineage 12S (M-12S) according to the DUI pattern. EMBOSS Needle (https://www.ebi.ac.uk/Tools/psa/emboss_needle/ accessed on 10 October 2022) was used for the pairwise sequence alignment of both haplogroups of the COI and 12S sequences, and MEGA 11.0.13 software was used to calculate the genetic distance between haplogroups using the maximum composite likelihood method. The ClustalW algorithm in the MEGA 11.0.13 software was used to align the F-COI, F-12S, 16S, D1 28S, and 18S-ITS1 sequences of Chinese populations. DnaSP 6 [28] software was used to analyze the number of haplotypes (h), number of polymorphic (segregating) sites (S), haplotype (gene) diversity (Hd), nucleotide diversity (Pi), and average number of nucleotide differences (K) for the five markers in the six populations sampled. MEGA 11.0.13 software was then used to evaluate the inter- and intra-population genetic distances of the F-COI and F-12S sequences. popART 1.7 [29] and WinArl35 [30] software were used to construct haplotype networks to clarify the patterns of within-species genetic diversity and the genealogical relationships among haplotypes. We also analyzed genetic data from United States, Ecuadorian, and Colombian populations [19].

3. Results

A total of 171 COI (GenBank accession Nos. OP921310-OP921333), 158 12S (GenBank accession Nos. OP935689-OP935698), 177 16S (GenBank accession Nos. OP925864-OP925874), 191 D1 28S (GenBank accession Nos. OP925881-OP925883), and 191 18S-ITS1 (GenBank accession No. OP936019) sequences were obtained (Table 1), and the lengths of these sequences were 610, 504, 411, 296, and 413 bp, respectively. Alignment of our sequences with those of M. strigata in GenBank revealed two sex-associated haplogroups for both the COI and 12S sequences. The ratio of the F and M haplotypes was 4:20 in the COI sequences and 7:3 in the 12S sequences. The F-COI and F-12S sequences showed higher identities (identities of 99% and 98%, respectively) than the M-COI and M-12S sequences (identities of 79% and 76%, respectively).

3.1. Genetic Diversity Analyses

The utility of the five markers for analyses of the genetic diversity of M. strigata populations varied (Table 3). Two nuclear gene fragments, D1 28S and 18S-ITS1, were highly conserved, and only three haplotypes of D1 28S and one haplotype of 18S-ITS1 were detected. Two polymorphic sites were detected in D1 28S, and the values of both Hd and K for D1 28S were less than 0.5 (0.490 and 0.496, respectively). The genetic diversity of the three mitochondrial genes was higher than those of the D1 28S and 18S-ITS1 sequences, especially the F-COI sequences; a total of 22 haplotypes were identified among the F-COI sequences, and a total of 8 and 10 haplotypes were identified among the F-12S and 16S sequences, respectively. The values of Hd, Pi, and K for F-COI were significantly higher than those for F-12S and 16S (p < 0.01). The Hd values of both the F-COI and F-12S sequences were greater than 0.5 in all populations sampled; the Pi values for both F-12S and 16S were less than 0.005.

3.2. Genetic Distance Analyses

Genetic distances between the five populations sampled were similar according to the F-12S sequences and ranged from 0.00239 (SW-HN) to 0.00333 (SW-BH) (Table 4). The highest genetic distance within populations was observed in SW (0.00317), and the lowest genetic distance within populations was observed in HN (0.00154). The estimates of the genetic distances between populations were markedly higher according to the F-COI sequences and ranged from 0.00429 (JM-BH) to 0.01763 (HN-Ecuador) (Table 5). All the genetic distances between populations from China and from Ecuador or the United States were greater than 0.01, with the exception of the genetic distance between BH and the United States (0.00970). The highest and lowest genetic distance within populations according to the F-COI sequences was observed in the United States (0.00880) and BH (0.00369), respectively. The genetic distances between populations from China and Colombia were similar to those between the six Chinese populations.

3.3. Genetic Relationships of Haplotypes

Two sex-associated haplogroups were identified in the TCS Network constructed using the 12S sequences (Figure 2), and the genetic distance between these two haplogroups was 9.17. The female-lineage haplogroup was more common than the male-lineage haplogroup both in terms of haplotype quantity (7:3) and sequence quantity (72:7). The most common three haplotypes were Hap_A (61 sequences), Hap_C (47 sequences), and Hap_D (32 sequences). Two sex-associated haplogroups were also identified in the TCS Network constructed using all 171 COI sequences from China and 155 COI sequences from the United States, Ecuador, and Colombia (Figure 3), and the genetic distance between these two haplogroups was 6.56. The ratio of the F-COI sequences to the M-COI sequences was 149:22. Only two COI haplotypes were shared among populations in the United States and China; no shared haplotypes were detected between Ecuador and China. Ten Colombian haplotypes were detected in China, accounting for five of the six Colombian haplotypes and one of the two F-type haplotypes from China. A total of nine F-COI haplotypes and four M-COI haplotypes from China were not detected in the United States, Ecuador, or Colombia. The four dominant haplotypes, Hap_1, Hap_2, Hap_4, and Hap_7, were detected in all six Chinese populations.

4. Discussion

Genetic diversity indicates the total genetic variation among individuals within and between populations [31,32], and analyses of spatial and temporal variations in the genetic diversity of invasive species are frequently conducted [33,34]. Seasons can affect the genetic diversity of populations, and a high genetic heterogeneity always appears in summer populations [35]; thus, we sampled our populations during the autumn and winter months. The nuclear D1 28S and 18S-ITS1 sequences were the most conserved among the five molecular markers examined in this study; these sequences would therefore be useful for distinguishing M. strigata from other similar species [23]. The rate of evolution of mtDNA is thought to be faster in animals than that of nuclear DNA [36,37], and the levels of genetic diversity observed in the three mitochondrial genes and two nuclear genes of M. strigata provide support for this general finding.
We detected two highly divergent haplogroups in the COI and 12S sequences of M. strigata; however, this was not the case for the 16S sequences. The number of F-type haplotypes was much greater than that of M-type haplotypes, which suggests that the F genome evolves faster than the M genome [38]. The heteroplasmy in COI is thought to stem from the DUI pattern [19]. However, all DNA samples were obtained from adductor muscles in this study; 22 of the 171 COI sequences were M-COI, which is not consistent with the canonical DUI pattern in which all COI sequences would be F-COI sequences [20]. There are three possible, non-mutually exclusive explanations for this finding: (1) the introgression of specific male-lineage genes, such as M-COI and M-12S, in M. strigata, which results in an unusual DUI pattern [23]; (2) mitochondrial heteroplasmy in which both mitogenomes are present in many tissues of both sexes [39]; and (3) variation in the efficacy of the same pairs of primers for amplifying two lineages sequences [40]. In species with unusual DUI patterns, the presence of M-mtDNA in the adductor muscles of female individuals might reflect sperm mitochondria not having been eliminated in the eggs and that it had dispersed randomly in the blastomeres; in male individuals, sperm mitochondria might have broken away, aggregated, and migrated to adjacent adductor muscle cells [41,42,43]. The percentage of nucleotide divergence (p-distance) between the two types of COI sequences varied among species showing a DUI pattern; for example, the p-distance between two types of the COI sequences was 8% in the veneroid Artica islandica [44], 17% in the nuculanoid Ledella sublevis [45], 20.5% to 20.8% in M. strigata [23], 24% in the mytiloid Mytilus edulis [46], and 50% in the unionoid Inversidens japanensis [47]. No DUI pattern has been detected in the Mediterranean alien species Brachidontes pharaonic despite mitochondrial heteroplasmy (p-distance of 8.6%) [39]; this suggests that the DUI pattern might be absent in M. strigata. The 16S sequences were relatively conserved in M. strigata; however, variation in the 16S sequences has been detected in Donax vittatus and other species in which a DUI pattern has been detected, including Mytilus galloprovincialis [48] and Perumytilus purpuratus [49]. Variation in the 12S sequences was observed in this study, and this is consistent with the results of studies of other mollusk species. Additional mitochondrial data are needed to clarify patterns of genetic differentiation observed among DUI species.
The haplotype diversity of M. strigata in China was high (greater than 0.5), and the nucleotide diversity of M. strigata in China was low (less than 0.005), indicating that the M. strigata population in China has undergone a population bottleneck, followed by rapid population growth and the accumulation of mutations, a pattern that has often been observed in various populations of marine fishes [50]. However, the 16S gene in M. strigata was the most highly conserved among the three mitochondrial markers, and this was reflected by its low haplotype diversity, nucleotide diversity, and average number of nucleotide differences in these sequences. Consequently, the haplotype diversity values of the 16S sequences in JM, XW, and BH (less than 0.5) do not provide an accurate reflection of the actual genetic status of M. strigata based on our analysis of all populations in which all molecular markers were used. Although our genetic distance and haplotype network analyses revealed low levels of genetic differentiation among Chinese populations regardless of whether COI or 12S gene fragments were used in these analyses, the performance of the COI sequences in these analyses was higher than that of the 12S sequences. The 12S sequence was shorter than the COI sequence [51], and the F-12S sequence in our study was 106 bp shorter than the F-COI sequence. All the diversity parameters and genetic distances were higher when they were estimated using the F-COI sequences than when they were estimated using the F-12S sequences, suggesting that the rate of evolution of the COI sequences was greater than that of the 12S sequences [52] and that the COI sequences are the most useful for genetic diversity analyses of M. strigata populations among the five markers examined.
The genetic distances between Chinese populations and native Colombian populations were lower than those between Chinese populations and the invasive United States population [19,53], which provides support for the hypothesis of Ma et al. [13]: that the invasive populations of M. strigata in China might have been derived from Colombian populations. A star-shaped network was observed for Hap_1, Hap_2, and Hap_10 of the COI sequences, which indicates that M. strigata populations in China might have undergone recent founder events and that they recently experienced or are currently experiencing a population bottleneck [50].

5. Conclusions

In this study, the utility of three mitochondrial gene fragments and two nuclear gene fragments were tested for characterizing the levels of genetic diversity among and within populations of M. strigata specimens collected in China. M. strigata exhibited two sex-associated haplogroups according to the COI and 12S sequences. Our findings indicated that COI is the most useful gene fragment for genetic diversity studies of M. strigata populations; D1 28S and 18S-ITS1 sequences would be useful for species identification. Our genetic analysis of the COI sequences revealed Colombia as the most likely origin of M. strigata in China and showed that the invasive populations in China have recently experienced or are currently experiencing a population bottleneck.

Author Contributions

C.Z. (Chenxia Zuo) and P.M. were responsible for the investigation, data analysis, and original draft; C.Z. (Chenchen Zhang), D.Z., Y.Z. and X.M. helped collect samples and carry out the data analysis; T.Z. and H.W. reviewed and edited the manuscript; Z.Z. was in charge of the methodology and funding provision. All authors contributed to the article and approved the submitted version. All authors have read and agreed to the published version of the manuscript.

Funding

This work was supported by the National Key R&D Program of China (No. 2022YFD2401204), the National Natural Science Foundation of China (No. 42006080), and the Science & Technology Fundamental Resources Investigation Program (No. 2022FY100300).

Institutional Review Board Statement

Ethical review and approval were waived for this study, because the invasive mussel in this study is an invertebrate with no sense or subjective experience.

Informed Consent Statement

Not applicable.

Data Availability Statement

Relevant information has been added in the article.

Acknowledgments

We appreciate the help from Liqiang Zhao from Guangdong Ocean University for the sample collection. We would also like to thank the reviewers for their constructive comments and helpful suggestions that improved the manuscript.

Conflicts of Interest

The authors declare no conflict of interest.

References

  1. Encarnação, J.; Teodósio, M.A.; Morais, P. Citizen science and biological invasions: A review. Front. Environ. Sci. 2021, 8, 602980. [Google Scholar] [CrossRef]
  2. Rytwinski, T.; Taylor, J.J.; Donaldson, L.A.; Britton, J.R.; Browne, D.R.; Gresswell, R.E.; Lintermans, M.; Prior, K.A.; Pellatt, M.G.; Vis, C.; et al. The effectiveness of non-native fish removal techniques in freshwater ecosystems: A systematic review. Environ. Rev. 2019, 27, 71–94. [Google Scholar] [CrossRef]
  3. Simberloff, D.; Martin, J.-L.; Genovesi, P.; Maris, V.; Wardle, D.A.; Aronson, J.; Courchamp, F.; Galil, B.; Garcia-Berthou, E.; Pascal, M.; et al. Impacts of biological invasions: What’s what and the way forward. Trends Ecol. Evol. 2013, 28, 58–66. [Google Scholar] [CrossRef] [PubMed] [Green Version]
  4. Chan, F.T.; Briski, E. An overview of recent research in marine biological invasions. Mar. Biol. 2017, 164, 121. [Google Scholar] [CrossRef] [Green Version]
  5. He, W.M. Biological invasions: Are their impacts precisely knowable or not? Biodiversity Sci. 2020, 28, 253–255. [Google Scholar]
  6. Bergman, J.N.; Raby, G.D.; Neigel, K.L.; Rennie, C.D.; Balshine, S.; Bennett, J.R.; Fisk, A.T.; Cooke, S.J. Tracking the early stages of an invasion with biotelemetry: Behaviour of round goby (Neogobius melanostomus) in Canada’s historic Rideau Canal. Biol. Invasions 2022, 24, 1149–1173. [Google Scholar] [CrossRef]
  7. Davidson, I.; Cahill, P.; Hinz, A.; Kluza, D.; Scianni, C.; Georgiades, E. A review of biofouling of ships’ internal seawater systems. Front. Mar. Sci. 2021, 8, 761531. [Google Scholar] [CrossRef]
  8. Iacarella, J.C.; Burke, L.; Davidson, I.C.; DiBacco, C.; Therriault, T.W.; Dunham, A. Unwanted networks: Vessel traffic heightens the risk of invasions in marine protected areas. Biol. Conserv. 2020, 245, 108553. [Google Scholar] [CrossRef]
  9. Robins, P.E.; Neill, S.P.; Giménez, L.; Jenkins, S.R.; Malham, S.K. Physical and biological controls on larval dispersal and connectivity in a highly energetic shelf sea. Limnol. Oceanogr. 2013, 58, 505–524. [Google Scholar] [CrossRef]
  10. Casillas, S.; Barbadilla, A. Molecular population genetics. Genetics 2019, 213, 721–722. [Google Scholar] [CrossRef] [Green Version]
  11. Lim, J.Y.; Tay, T.S.; Lim, C.S.; Lee, S.S.C.; Teo, S.L.M.; Tan, K.S. Mytella strigata (Bivalvia: Mytilidae): An alien mussel recently introduced to Singapore and spreading rapidly. Molluscan Res. 2018, 38, 170–186. [Google Scholar] [CrossRef]
  12. Boudreaux, M.L.; Walters, L.J. Mytella charruana (Bivalvia: Mytilidae): A new, invasive bivalve in Mosquito Lagoon, Florida. Nautilus 2006, 120, 34–36. [Google Scholar]
  13. Ma, P.Z.; Li, H.M.; Liu, Y.M.; Li, C.; Zhang, Z.; Wang, H.Y. First confirmed occurrence of the invasive mussel Mytella strigata (Hanley, 1843) in Guangdong and Hainan, China, and Indo-West Pacific regions. BioInvasions Rec. 2022, 11, 947–963. [Google Scholar] [CrossRef]
  14. Rice, M.A.; Rawson, P.D.; Salinas, A.D.; Rosario, W.R. Identification and salinity tolerance of the western hemisphere mussel Mytella charruana (d’orbigny, 1842) in the Philippines. J. Shellfish Res. 2016, 35, 865–873. [Google Scholar] [CrossRef]
  15. Sanpanichl, K.; Wells, F.E. Mytella strigata (Hanley, 1843) emerging as an invasive marine threat in Southeast Asia. BioInvasions Rec. 2019, 8, 343–356. [Google Scholar] [CrossRef]
  16. Jayachandran, P.R.; Aneesh, B.P.; Oliver, P.G.; Philomina, J.; Jima, M.; Harikrishnan, K.; Nandan, S.B. First record of the alien invasive biofouling mussel Mytella strigata (Hanley, 1843) (Mollusca: Mytilidae) from Indian waters. BioInvasions Rec. 2019, 8, 828–837. [Google Scholar] [CrossRef]
  17. Huang, Y.C.; Li, Z.K.; Chen, W.L.; Chan, C.C.; Hsu, H.Y.; Lin, Y.T.; Huang, Y.S.; Han, Y.S. First record of the invasive biofouling mussel Mytella strigata (Hanley, 1843) (Bivalvia: Mytilidae) from clam ponds in Taiwan. BioInvasions Rec. 2021, 10, 304–312. [Google Scholar] [CrossRef]
  18. Ma, P.Z.; Zuo, C.X.; Li, H.M.; Wang, H.Y.; Wang, Q.H.; Zhang, Z. The basic biology and biological invasion of Mytella strigata. Acta Ecol. Sin. 2022, 43. [Google Scholar] [CrossRef]
  19. Gillis, N.K.; Walters, L.J.; Fernandes, F.C.; Hoffman, E.A. Higher genetic diversity in introduced than in native populations of the mussel Mytella charruana: Evidence of population admixture at introduction sites. Divers. Distrib. 2009, 15, 784–795. [Google Scholar] [CrossRef]
  20. Gusman, A.; Lecomte, S.; Stewart, D.T.; Passamonti, M.; Breton, S. Pursuing the quest for better understanding the taxonomic distribution of the system of doubly uniparental inheritance of mtDNA. PeerJ 2016, 4, e2760. [Google Scholar] [CrossRef] [Green Version]
  21. Zouros, E. Biparental inheritance through uniparental transmission: The doubly uniparental inheritance (DUI) of mitochondrial DNA. Evol. Biol. 2012, 40, 1–31. [Google Scholar] [CrossRef]
  22. Zouros, E.; Ball, A.O.; Saavedra, C.; Freeman, K.R. An unusual type of mitochondrial DNA inheritance in the blue mussel Mytilus. Proc. Natl. Acad. Sci. USA 1994, 91, 7463–7467. [Google Scholar] [CrossRef] [PubMed]
  23. Alves, F.A.d.S.; Beasley, C.R.; Hoeh, W.R.; Rocha, R.M.d.; Simone, L.R.L.d.; Tagliaro, C.H. Detection of mitochondrial DNA heteroplasmy suggests a doubly uniparental inheritance pattern in the mussel Mytella charruana. Braz. J. Biol. Sci. 2012, 10, 176–185. [Google Scholar]
  24. Folmer, O.; Black, M.; Hoeh, W.; Lutz, R.; Vrijenhoek, R. DNA primers for amplification of mitochondrial cytochrome c oxidase subunit I from diverse metazoan invertebrates. Mol. Mar. Biol. Biotechnol. 1994, 3, 294–299. [Google Scholar] [PubMed]
  25. Simon, C.; Frati, F.; Beckenbach, A.; Crespi, B.; Liu, H.; Flook, P. Evolution, weighting, and phylogenetic utility of mitochondrial gene-sequences and a compilation of conserved polymerase chain-reaction primers. Ann. Entomol. Soc. Am. 1994, 87, 651–701. [Google Scholar] [CrossRef]
  26. Lovejoy, N.R.; Lester, K.; Crampton, W.G.R.; Marques, F.P.L.; Albert, J.S. Phylogeny, biogeography, and electric signal evolution of Neotropical knifefishes of the genus Gymnotus (Osteichthyes: Gymnotidae). Mol. Phylogenet. Evol. 2010, 54, 278–290. [Google Scholar] [CrossRef] [PubMed]
  27. Tamura, K.; Stecher, G.; Kumar, S. MEGA11: Molecular evolutionary genetics analysis version 11. Mol. Biol. Evol. 2021, 38, 3022–3027. [Google Scholar] [CrossRef]
  28. Rozas, J.; Ferrer-Mata, A.; Sánchez-DelBarrio, J.C.; Guirao-Rico, S.; Librado, P.; Ramos-Onsins, S.E.; Sánchez-Gracia, A. DnaSP 6: DNA sequence polymorphism analysis of large data sets. Mol. Biol. Evol. 2017, 34, 3299–3302. [Google Scholar] [CrossRef]
  29. Leigh, J.W.; Bryant, D. POPART: Full-feature software for haplotype network construction. Methods Ecol. Evol. 2015, 6, 1110–1116. [Google Scholar] [CrossRef]
  30. Excoffier, L.; Lischer, H.E.L. Arlequin suite ver 3.5: A new series of programs to perform population genetics analyses under Linux and Windows. Mol. Ecol. Resour. 2010, 10, 564–567. [Google Scholar] [CrossRef]
  31. Barrandeguy, M.E.; García, M.V. Quantifying genetic diversity: The starting point for population genetic studies using molecular markers. J. Genet. 2014, 93, 587–589. [Google Scholar] [CrossRef] [PubMed] [Green Version]
  32. Fowler, A.E.; Loonam, G.A.; Blakeslee, A.M.H. Population structure and demography of non-indigenous Japanese mystery snails in freshwater habitats of Virginia and Washington, DC, USA. Aquat. Invasions 2022, 17, 415–430. [Google Scholar] [CrossRef]
  33. Paolacci, S.; Bog, M.; Lautenschlager, U.; Bonfield, R.; Appenroth, K.-J.; Oberprieler, C.; Jansen, M.A.K. Clonal diversity amongst island populations of alien, invasive Lemna minuta Kunth. Biol. Invasions 2021, 23, 2649–2660. [Google Scholar] [CrossRef]
  34. Young, R.G.; Mitterboeck, T.F.; Loeza-Quintana, T.; Adamowicz, S.J. Rates of molecular evolution and genetic diversity in European vs. North American populations of invasive insect species. Eur. J. Entomol. 2018, 115, 718–728. [Google Scholar] [CrossRef]
  35. Han, G.D.; Wang, W.; Dong, Y.W. Effects of balancing selection and microhabitat temperature variations on heat tolerance of the intertidal black mussel Septifer virgatus. Integr. Zool. 2020, 15, 416–427. [Google Scholar] [CrossRef]
  36. Brown, W.M.; George, M., Jr.; Wilson, A.C. Rapid evolution of animal mitochondrial DNA. Proc. Natl. Acad. Sci. USA. 1979, 76, 1967–1971. [Google Scholar] [CrossRef] [PubMed] [Green Version]
  37. Lynch, M.; Koskella, B.; Schaack, S. Mutation pressure and the evolution of organelle genomic architecture. Science 2006, 311, 1727–1730. [Google Scholar] [CrossRef] [Green Version]
  38. Fernández-Pérez, J.; Froufe, E.; Nantón, A.; Gaspar, M.B.; Méndez, J. Genetic diversity and population genetic analysis of Donax vittatus (Mollusca: Bivalvia) and phylogeny of the genus with mitochondrial and nuclear markers. Estuar. Coast. Shelf Sci. 2017, 197, 126–135. [Google Scholar] [CrossRef]
  39. Lubośny, M.; Śmietanka, B.; Arculeo, M.; Burzyński, A. No evidence of DUI in the Mediterranean alien species Brachidontes pharaonis (P. Fisher, 1870) despite mitochondrial heteroplasmy. Sci. Rep. 2022, 12, 8569. [Google Scholar] [CrossRef]
  40. Theologidis, I.; Fodelianakis, S.; Gaspar, M.B.; Zouros, E. Doubly uniparental inheritance (DUI) of mitochondrial dna in Donax trunculus (Bivalvia: Donacidae) and the problem of its sporadic detection in Bivalvia. Evolution 2008, 62, 959–970. [Google Scholar] [CrossRef]
  41. Cao, L.; Kenchington, E.; Zouros, E. Differential segregation patterns of sperm mitochondria in embryos of the blue mussel (Mytilus edulis). Genetics 2004, 166, 883–894. [Google Scholar] [CrossRef] [PubMed]
  42. Kakoi, S.; Kin, K.; Miyazaki, K.; Wada, H. Early development of the Japanese spiny oyster (Saccostrea kegaki): Characterization of some genetic markers. Zool. Sci. 2008, 25, 455–464. [Google Scholar] [CrossRef] [PubMed] [Green Version]
  43. Zouros, E.; Rodakis, G.C. Doubly uniparental inheritance of mtDNA: An unappreciated defiance of a general rule. Adv. Anat. Embyrol. Cell Biol. 2019, 231, 25–49. [Google Scholar]
  44. Degletagne, C.; Abele, D.; Held, C. A distinct mitochondrial genome with DUI-like inheritance in the ocean quahog Arctica islandica. Mol. Biol. Evol. 2016, 33, 375–383. [Google Scholar] [CrossRef]
  45. Boyle, E.E.; Etter, R.J. Heteroplasmy in a deep-sea protobranch bivalve suggests an ancient origin of doubly uniparental inheritance of mitochondria in Bivalvia. Mar. Biol. 2013, 160, 413–422. [Google Scholar] [CrossRef]
  46. Breton, S.; Burger, G.; Stewart, D.T.; Blier, P.U. Comparative analysis of gender-associated complete mitochondrial genomes in marine mussels (Mytilus spp.). Genetics 2006, 172, 1107–1119. [Google Scholar] [CrossRef] [Green Version]
  47. Doucet-Beaupré, H.; Breton, S.; Chapman, E.G.; Blier, P.U.; Bogan, A.E.; Stewart, D.T.; Hoeh, W.R. Mitochondrial phylogenomics of the Bivalvia (Mollusca): Searching for the origin and mitogenomic correlates of doubly uniparental inheritance of mtDNA. BMC Evol. Biol. 2010, 10, 50. [Google Scholar] [CrossRef] [Green Version]
  48. Ladoukakis, E.D.; Saavedra, C.; Magoulas, A.; Zouros, E. Mitochondrial DNA variation in a species with two mitochondrial genomes: The case of Mytilus galloprovincialis from the Atlantic, the Mediterranean and the Black Sea. Mol. Ecol. 2002, 11, 755–769. [Google Scholar] [CrossRef]
  49. Vargas, J.; Pérez, M.; Toro, J.; Astorga, M.P. Presence of two mitochondrial genomes in the mytilid Perumytilus purpuratus: Phylogenetic evidence for doubly uniparental inheritance. Genet. Mol. Biol. 2015, 38, 173–181. [Google Scholar] [CrossRef] [Green Version]
  50. Grant, W.S.; Bowen, B.W. Shallow population histories in deep evolutionary lineages of marine fishes: Insights from sardines and anchovies and lessons for conservation. J. Hered. 1998, 89, 415–426. [Google Scholar] [CrossRef] [Green Version]
  51. Sung, C.H.; Lin, C.H.; Huang, C.W.; Wang, L.J. Characterization and phylogenetic analysis of the complete mitochondrial genome of Mytella strigata (Hanley 1843) (Bivalvia: Mytiloida: Mytilidae). Mitochondrial DNA B 2021, 6, 2345–2347. [Google Scholar] [CrossRef] [PubMed]
  52. Lushai, G.; Smith, D.A.S.; Goulson, D.; Allen, J.A.; Maclean, N. Mitochondrial DNA clocks and the phylogeny of Danaus butterflies. Int. J. Trop. Insect Sci. 2003, 23, 309–315. [Google Scholar] [CrossRef] [Green Version]
  53. Calazans, C.S.H.; Walters, L.J.; Fernandes, F.C.; Ferreira, C.E.L.; Hoffman, E.A. Genetic structure provides insights into the geographic origins and temporal change in the invasive charru mussel (Sururu) in the southeastern United States. PLoS ONE 2018, 13, e0195159. [Google Scholar] [CrossRef] [PubMed]
Figure 1. Chinese populations of Mytella strigata sampled in this study. The size of the circles indicates the number of samples from each population; the black circle (for reference) indicates 10 individuals.
Fishes 08 00034 g001
Figure 2. A TCS network showing the genetic relationships for the mitochondrial 12S gene fragment among six Chinese populations of Mytella strigata. The male mitochondrial lineage is on the left and the female one is on the right.
Fishes 08 00034 g002
Figure 3. A TCS network showing the genetic relationships for the mitochondrial COI gene fragment among nine populations of Mytella strigata in China, the United States, Colombia, and Ecuador. The cluster of the male lineage of Hap_50–53 is on the upper left, and the other haplotypes are of female lineage.
Fishes 08 00034 g003
Table 1. Information on the samples collected and the number of sequences obtained in this study. The number of male-lineage gene sequences is shown in parentheses.
LocationCollection DateGeographical CoordinatesQuantityCOI12S16SD1 28S18S-ITS1
Jimei21 October 202124°34′891″ N, 118°6′578″ E3533(1)27(1)323535
Shanwei31 October 202122°49′354″ N, 115°33′91″ E3529(3)25(2)333535
Xuwen17 August 202220°24′739″ N, 109°56′15″ E3636(6)35(5)343636
Beihai12 October 202121°24′6″ N, 109°10′9″ E2420(3)21(2)212424
Zhanjiang27 November 202020°55′53″ N, 110°31′43″ E3530(1)31(1)343535
Hainan6 December 202019°59′7″ N, 110°35′7″ E2623(8)19(3)232626
6 December 202019°37′35″ N, 110°49′43″ E
Total--191171(22)158(14)177191191
Table 2. Primers and thermal cycling conditions for the PCR reactions of the COI, 12S, 16S, D1 28S, and 18S-ITS1 sequences in this study.
MarkersPrimersPCR Programs
COILCO 1490 5′-GGTCAACAAATCATAAAGATATTGG-3′
HCO 2198 5′-TAAACTTCAGGGTGACCAAAAAATCA-3′ [24]
95 °C 3 min, 32× (95 °C 30 s, 48 °C 1 min, 72 °C 1 min), 72 °C 5 min
12S12S-SR-J14197 5′-GTACAYCTACTATGTTACGACTT-3′
12S-SR-N14745 5′-GTGCCAGCAGYYGCGGTTANAC-3′ [25]
95 °C 3 min, 32× (95 °C 30 s, 48 °C 1 min, 72 °C 1 min), 72 °C 5 min
16S16Sar 5′-CGCCTGTTTATCAAAAACAT-3′
16Sbr 5′-CCGGTCTGAACTCAGATCACGT-3′ [26]
95 °C 3 min, 32× (95 °C 30 s, 48 °C 1 min, 72 °C 1 min), 72 °C 5 min
D1 28SLSU5b 5′-ACCCGCTGAAYTTAAGCA-3′
D1R 5′-AACTCTCTCMTTCARAGTTC-3′ [11]
95 °C 5 min, 49 °C 45 s, 72 °C 1 min, 34× (95 °C 30 s, 52 °C 45 s 72 °C 1 min), 95 °C 30 s, 52 °C 45 s, 72 °C 5 min
18S-ITS1ITS1A-sal 5′-AAAAAGCTTTTGTACACACCGCCCGTCGC-3′
ITS1B-sal 5′-AGCTTGCTGCGTTCTTCATCGA-3′ [11]
95 °C 3 min, 35× (95 °C 1 min, 45.5 °C 1 min, 72 °C 1.5 min), 72 °C 7 min
Table 3. Genetic diversity parameters for six populations of Mytella strigata in China based on five different molecular markers. JM, Jimei; SW, Shanwei; XW, Xuwen; BH, Beihai; ZJ, Zhanjiang; HN, Hainan; h, number of haplotypes; S, number of polymorphic (segregating) sites; Hd, haplotype (gene) diversity; Pi, nucleotide diversity; K, average number of nucleotide differences.
F-COIF-12S16SD1 28S18S-ITS1
hSHdPiKhSHdPiKhSHdPiKhSHdPiKhSHdPiK
JM10120.8470.004542.756440.6650.003031.526320.4460.001150.474210.4200.001420.420100.0000.000000.000
SW10130.8710.005473.323780.7910.003151.589650.6060.001720.708210.5140.001740.514100.0000.000000.000
XW10140.8320.004552.761330.6000.002591.303540.4390.001160.476210.4640.001570.464100.0000.000000.000
BH680.6540.003442.088330.6020.002611.310320.4520.001160.476210.4640.001570.464100.0000.000000.000
ZJ8110.7660.004892.966330.6250.002521.269790.6290.002260.927320.5280.001900.561100.0000.000000.000
HN8110.7900.005593.390330.5920.001540.775680.6960.002941.209210.5080.001720.508100.0000.000000.000
Total22250.8440.004912.981890.6740.002841.43210130.5570.001720.790320.4900.001680.496100.0000.000000.000
Table 4. Genetic distances between populations (below the diagonal) and genetic distances within six Chinese populations (in bold values) of Mytella strigata according to the partial F-12S gene. JM, Jimei; SW, Shanwei; XW, Xuwen; BH, Beihai; ZJ, Zhanjiang; HN, Hainan.
SWZJJMHNBHXW
SW0.00317
ZJ0.003070.00253
JM0.003330.002730.00305
HN0.002390.002780.003010.00154
BH0.003340.002510.002760.003180.00261
XW0.003320.002520.002760.003140.002500.00260
Table 5. Genetic distances between populations (below the diagonal) and genetic distances within six Chinese populations (in bold values) and three western hemisphere populations (United States, Ecuador, and Colombia) of Mytella strigata according to variation of the partial F-COI gene. JM, Jimei; SW, Shanwei; XW, Xuwen; BH, Beihai; ZJ, Zhanjiang; HN, Hainan. Populations from Ecuador and Colombia are natural populations, and the United States population is an invasive population.
SWZJJMHNBHXWEcuadorColombiaUSA
SW0.00587
ZJ0.005560.00523
JM0.005590.005250.00486
HN0.006040.005750.006520.00577
BH0.004920.004540.004290.005760.00369
XW0.005370.005010.004780.006130.004090.00476
Ecuador0.016860.017000.016660.017630.015880.016490.00522
Colombia0.005610.005380.004980.006440.004440.004950.016240.00515
USA0.010690.010840.010440.011460.009700.010370.013990.010080.00880
Disclaimer/Publisher’s Note: The statements, opinions and data contained in all publications are solely those of the individual author(s) and contributor(s) and not of MDPI and/or the editor(s). MDPI and/or the editor(s) disclaim responsibility for any injury to people or property resulting from any ideas, methods, instructions or products referred to in the content.

