Article

Growth, Chemical Composition, Histology and Antioxidant Genes of Atlantic Salmon (Salmo salar) Fed Whole or Pre-Processed Nannochloropsis oceanica and Tetraselmis sp.

1
Faculty of Biosciences and Aquaculture, Nord University, 8026 Bodø, Norway
2
Zheijang NHU Co., Ltd., Shaoxing 312500, China
3
Cermaq Norway AS, Nordfoldveien 165, 8286 Steigen, Norway
*
Author to whom correspondence should be addressed.
Fishes 2021, 6(3), 23; https://doi.org/10.3390/fishes6030023
Submission received: 1 June 2021 / Revised: 19 July 2021 / Accepted: 20 July 2021 / Published: 23 July 2021
(This article belongs to the Special Issue Integration of Nutrition and Physiology in Aquatic Animals)

Abstract

:
New sustainable feed ingredients are a necessity for the salmon aquaculture industry. In this study, we examined the effect of pre-extrusion processing of two microalgae, Nannochloropsis oceanica and Tetraselmis sp., on the growth, fatty acid content in the flesh and health of Atlantic salmon. The fish were fed one of the following five diets for nine weeks: (1) CO: a fish meal-based control (basal) diet, (2) NU: a Nannochloropsis diet, (3) NE: a pre-extruded Nannochloropsis diet, (4) TU: a Tetraselmis diet, and (5) TE: a pre-extruded Tetraselmis diet. The algae-incorporated diets contained 30% of the respective microalgae. Our results showed that the best growth performance was achieved by the CO diet, followed by the NE diets. Feeding of unprocessed Nannochloropsis and Tetraselmis resulted in a significant reduction in enterocyte vacuolization compared to the CO feeding. A significant effect of processing was noted in the fillet fatty acid content, the intestine and liver structure and the expression of selected genes in the liver. The expression of antioxidant genes in both the liver and intestine, and the accumulation of different fatty acids in the fillet and liver of the extruded algae-fed groups, warrants further investigation. In conclusion, based on the short-term study, 30% inclusion of the microalgae Nannochloropsis oceanica and Tetraselmis sp. can be considered in Atlantic salmon feeds.

1. Introduction

Marine microalgae are primary producers of eicosapentaenoic acid (EPA) and docosahexaenoic acid (DHA) and, based on their chemical composition, certain microalgae can be good candidates for ingredients in fish feeds if they can be produced on a large scale [1]. A variety of microalgae species has been studied to assess their suitability as feed ingredients for aquaculture in general, and as replacements for fish meal or fish oil in feeds for Atlantic salmon (Salmo salar) [2,3,4,5,6,7,8]. Some of the microalgae are also good sources of vitamins, minerals and pigments, all with good antioxidant effects [9]. Antioxidant activity has been reported in extracts from different microalgae, amongst others Tetraselmis sp. and Nannochloropsis sp. [10]. Feeding fish with microalgae meal, which are sources of natural antioxidants, may increase their cells’ capacity to scavenge reactive oxygen (ROS) or nitrogen species. ROS, the products of basal metabolism that regulate cellular homeostasis, are produced in cell organelles such as endoplasmic reticulum, mitochondria, peroxisomes and even in cell membranes and cytoplasm [11]. The vital ROS buffering systems in mitochondria and peroxisomes include glutathione peroxidases (GPx), glutathione (GSH), superoxide dismutase (SOD) family of proteins and catalase that help in converting radicals into unharmful substances [12]. Thus, living organisms have developed different antioxidant defence systems to counterbalance the adverse effects of ROS. In addition to these antioxidant mechanisms, rapid and continuous renewal of secreted mucus safeguards the epithelial cells such as those of the intestine [13]. Furthermore, intestinal health and welfare could be considered as interconnected because new aquafeed ingredients can negatively affect the structure and barrier functions of the different intestinal segments, and intestinal microbiota is a key player in the immune maturation, growth, health and behaviour of farmed animals [14]. The gastrointestinal tract of fish is covered by a protective layer of mucus and each part of the intestine performs different functions [15]. Mucins are a diverse group of glycoproteins that are vital components of mucus, and these molecules are responsible for the viscoelastic properties of mucus. Mucins are produced and secreted by goblet cells in the intestine [16]. Mucous cell quantification is efficient in revealing aberrant responses in tissues [17]. Mucins can be either monomeric or multimeric, and the former group includes transmembrane mucins mainly associated with the glycocalyx, while the latter group are gel-forming mucins, like MUC2, MUC5AC, MUC5B and MUC6 [18,19,20]. Some MUC genes have been identified in fish or predicted in fish genomes and are in general similar to mammalian mucin genes [21,22,23,24,25]. Recently, mucin genes have been identified in several tissues in Atlantic salmon [26].
It is suggested that microalgae such as Nannochloropsis sp. and Tetraselmis sp. can provide the essential vitamins, pigments and polyphenols for the aquaculture industry [27,28,29]. In addition, Nannochloropsis and Tetraselmis are sources of high-value essential n-3 long-chain polyunsaturated fatty acids such as EPA and alpha linolenic acid (ALA) [30]. The protein and lipid content of Nannochloropsis vary between 18 and 48% and 2 and 68%, respectively. Tetraselmis has a protein content ranging between 27 and 54% and a lipid content in the range 3–45% [30]. Carnivorous species such as Atlantic salmon have a relatively short and simple digestive system with a limited capacity to digest complex carbohydrates present in intact microalgae. However, it is now known that the rigid microalgae cell walls can be broken to release the essential nutrients and antioxidant elements from microalgae [29,31,32,33]. Since the microalgae processing technology has not matured yet [34,35], it has been reported that the current microalgae inclusion level should be below 10% to avoid negative effects on energy digestibility and to obtain a good feed conversion ratio (FCR) [3,4,5,6,30,34]. Previous studies have indicated the suitability of microalgae for farmed fishes; 14.2% of a blend of N. oculata defatted biomass and whole cell Schizochytrium sp. was efficient enough to impart good growth in Nile tilapia (Oreochromis niloticus) [36], and low levels of Spirulina can help rainbow trout in recruiting lipids during times of starvation [37]. Studies have also shown that extrusion improves the digestibility of Nannochloropsis [2] and the process can also be used as a pre-treatment method to increase extraction of lipid [32] as well as other intracellular components. It is therefore hypothesized that extrusion as a pre-treatment of the algae biomass may enhance the bioavailability of lipids from Nannochloropsis and Tetraselmis, which, along with the released antioxidants, could improve the growth as well as the health of the fish. Hence, we have investigated the effects of feeding whole and pre-extruded microalgae meal on weight gain, whole body chemical composition, expression of selected genes in the liver and intestine and histological features in these organs of Atlantic salmon. Additionally, we have examined the feed quality based on the content of volatile organic compounds. It is reported that pre-processing of ingredients as well as the heat and shear forces from the extrusion process itself may also induce volatile organic compounds (VOCs) from oxidation of lipids [38,39,40] as well as oxidized proteins, indicating that VOCs may interfere with feed utilization [41].

2. Results

2.1. Volatile Organic Compounds

Dynamic headspace gas chromatography–mass spectrometry (GC-MS) analysis detected approximately 130 different volatile organic compounds (VOCs) in the experimental feeds, and the information of selected compounds is provided in Table 1. The molecules detected in the feeds were typical protein (low molecular weight (LWM) amines, branched chain volatiles) and lipid oxidation products (aldehydes, alcohols, ketones). As observed, pre-treatment of the algae increased the concentration of LMW amines, hexanal, butanal, 2-methyl-propanal, 1-penten-3-one, (E)-2-pentenal, (E)-2-hexenal, and 1-penten-3-ol.

2.2. Growth

All the feeds were well accepted by the fish and there was no mortality during the course of the experiment. The weight gain of the fish ranged from 83 to 99 g (Table 2). The final weight of the fish fed the CO diet was significantly higher compared to the fish fed algae diets. Pre-extrusion of Nannochloropsis tended to increase fish growth compared to the other algae-fed fish groups, as reflected in the increased weight gain (WG; %) and specific growth rate (SGR; % day−1). The WG and SGR in fish fed NU, TU and TE were also significantly lower compared to the CO group. A significant effect of the extrusion process was not evident from the 2-way ANOVA (Supplementary Table S1).

2.3. Whole Body Proximate Composition

The whole body proximate composition of fish from the experimental groups at the end of the feeding study is presented in Table 3. The dry matter in the TE group was higher compared to the CO group, which had values significantly lower than the NE group. The NE group had higher dry matter values than the NU group. The highest protein content was found in salmon fed diet CO, but the values were not significantly different from the protein content in fish fed diets NU and TU. Fish fed NE and TE had significantly lower protein content than fish from the CO diet groups. In addition, the protein content of the TU and TE were significantly different. The lipid content was significantly higher in fish fed diet TE than fish fed NU, NE and TU. Ash content was significantly higher in fish fed diets NU and NE. Ash content was significantly lower in fish fed diets TE compared to the fish fed CO, NE and NU diets. The ash content in NU was significantly higher compared to the TU group. Energy content was significantly higher in fish fed the diets TU and TE compared to fish from the other diet groups.
The fatty acid composition of salmon fillet after 9 weeks of feeding with the experimental diets are presented in Table 4. The highest content of SFA in the flesh lipids was found in the fillet of salmon fed diet NE. SFA content was significantly lower in fish fed diets CO, NU and TU. The MUFAs in the fillet were significantly higher in fish fed diets NU compared to all fish groups except those fed on the TE diet. Fish fed the TU diet showed higher PUFA content compared to the other groups, but we did not detect any significant differences. Fillets from fish fed the TU diets had higher content of EPA+DHA compared to fish fed the TE diet. The ratio of n-6 to n-3 fatty acids in the fillet were found to be significantly higher in fish fed the NU diet compared to the CO and TU diets.
We did not find an effect of pre-treatment on whole body composition (Supplementary Table S1), but the factor had a significant effect on most of the fatty acids deposited in the fillets of Atlantic salmon (Supplementary Table S2).

2.4. Histology

The morphology of the pyloric caeca, mid intestine, distal intestine and liver are shown as supplementary material (Figures S1–S4), and the associated parameters are given in Figures S5–S7. We did not observe any changes related to any diet in the pyloric caeca of the different study groups. The mid and distal intestine of the fish fed the CO diet had normal micromorphological features. On the other hand, fish fed the microalgae-incorporated-feeds (NU, NE, TU, and TE) had some alterations, although not statistically significant. The altered features included the thickening of the stratum granulosum and compactum in the mid intestine of the NU, NE and TU groups, wider villi and increased mucous cell area in the TE group, wider distal intestine villi in the TE group and increased distal intestine mucous cell area in the NE group. In addition, enterocyte vacuolization in the NU and TU groups was significantly lower compared to the CO group.
Liver morphology of the CO fed group was normal with centrally located nuclei and homogenous structure of hepatocytes. Vacuolization in the NU and TU group was not as visible as in the case of the other algae-fed groups. In the pre-extruded algae feeding groups (NE, TE), noticeable vacuoles were present in the hepatocytes, with significant differences detected for the CO vs. TE, NE vs. TU and TU vs. TE comparisons.
Pre-treatment was found to significantly influence mid intestine villi width and vacuolization in the distal intestine and liver (Supplementary Table S3).

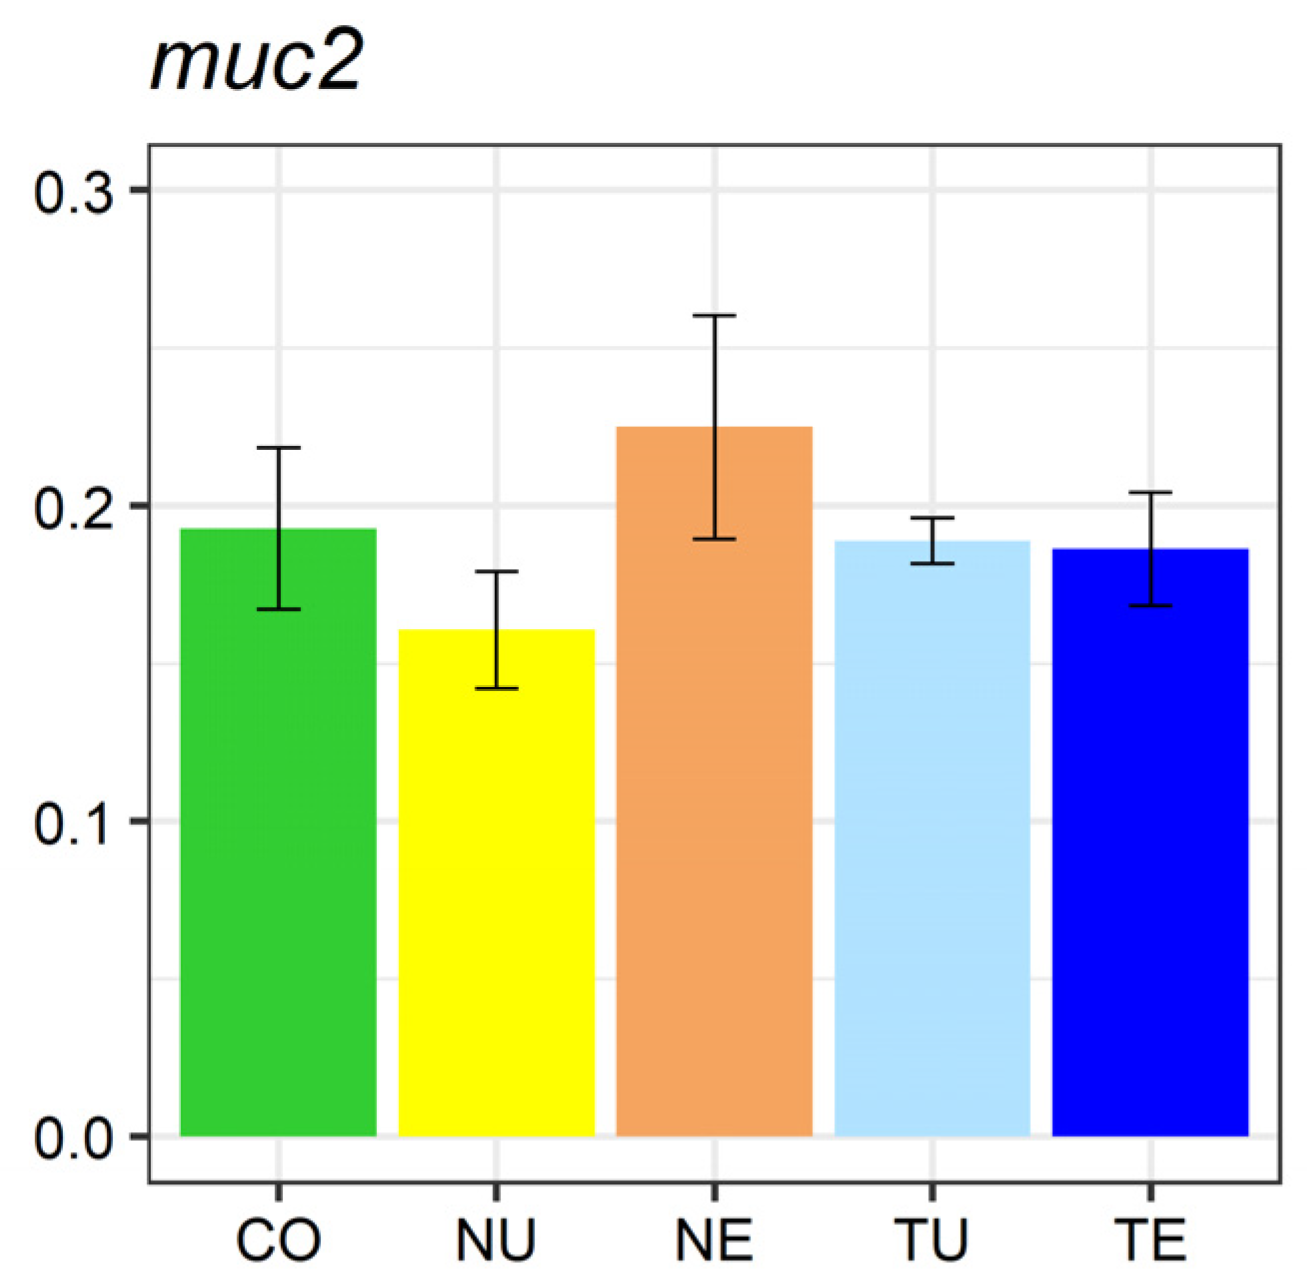
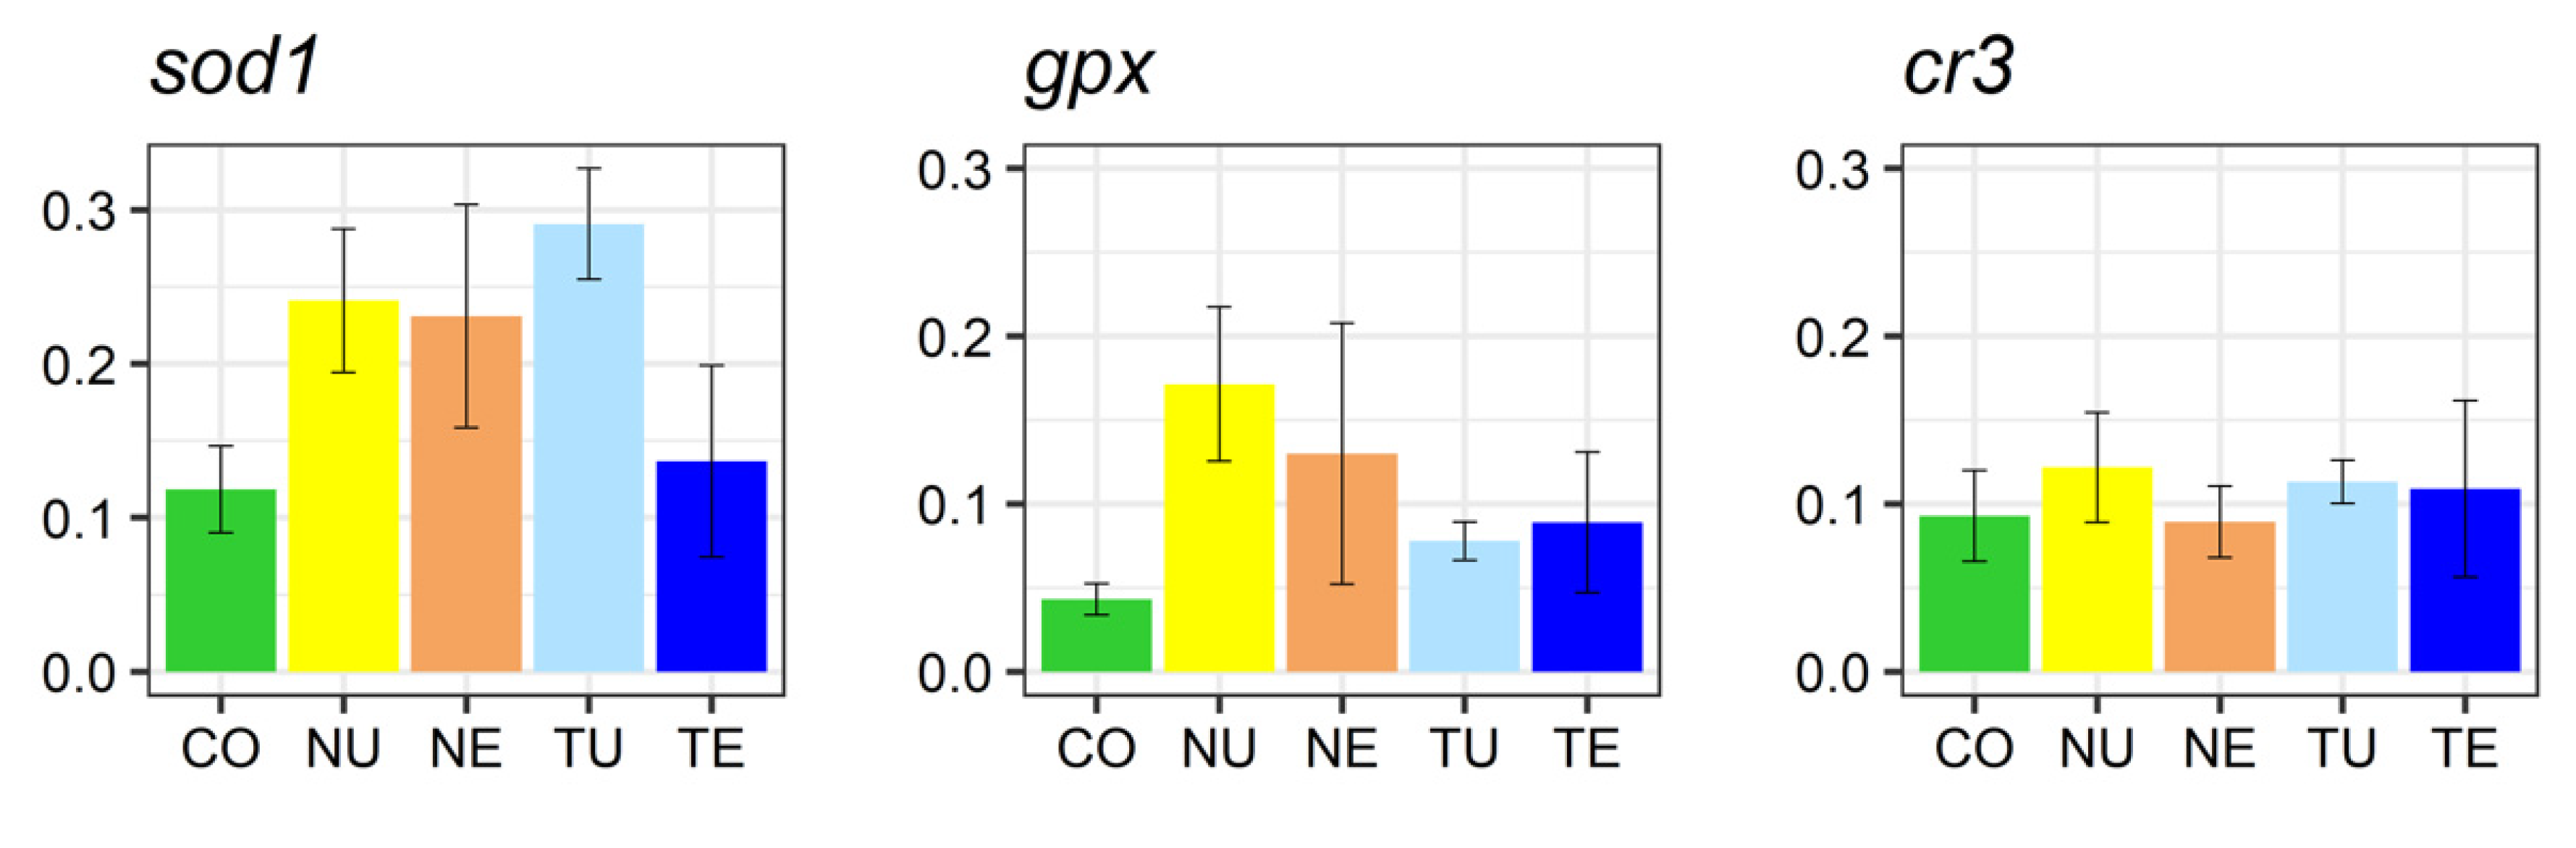
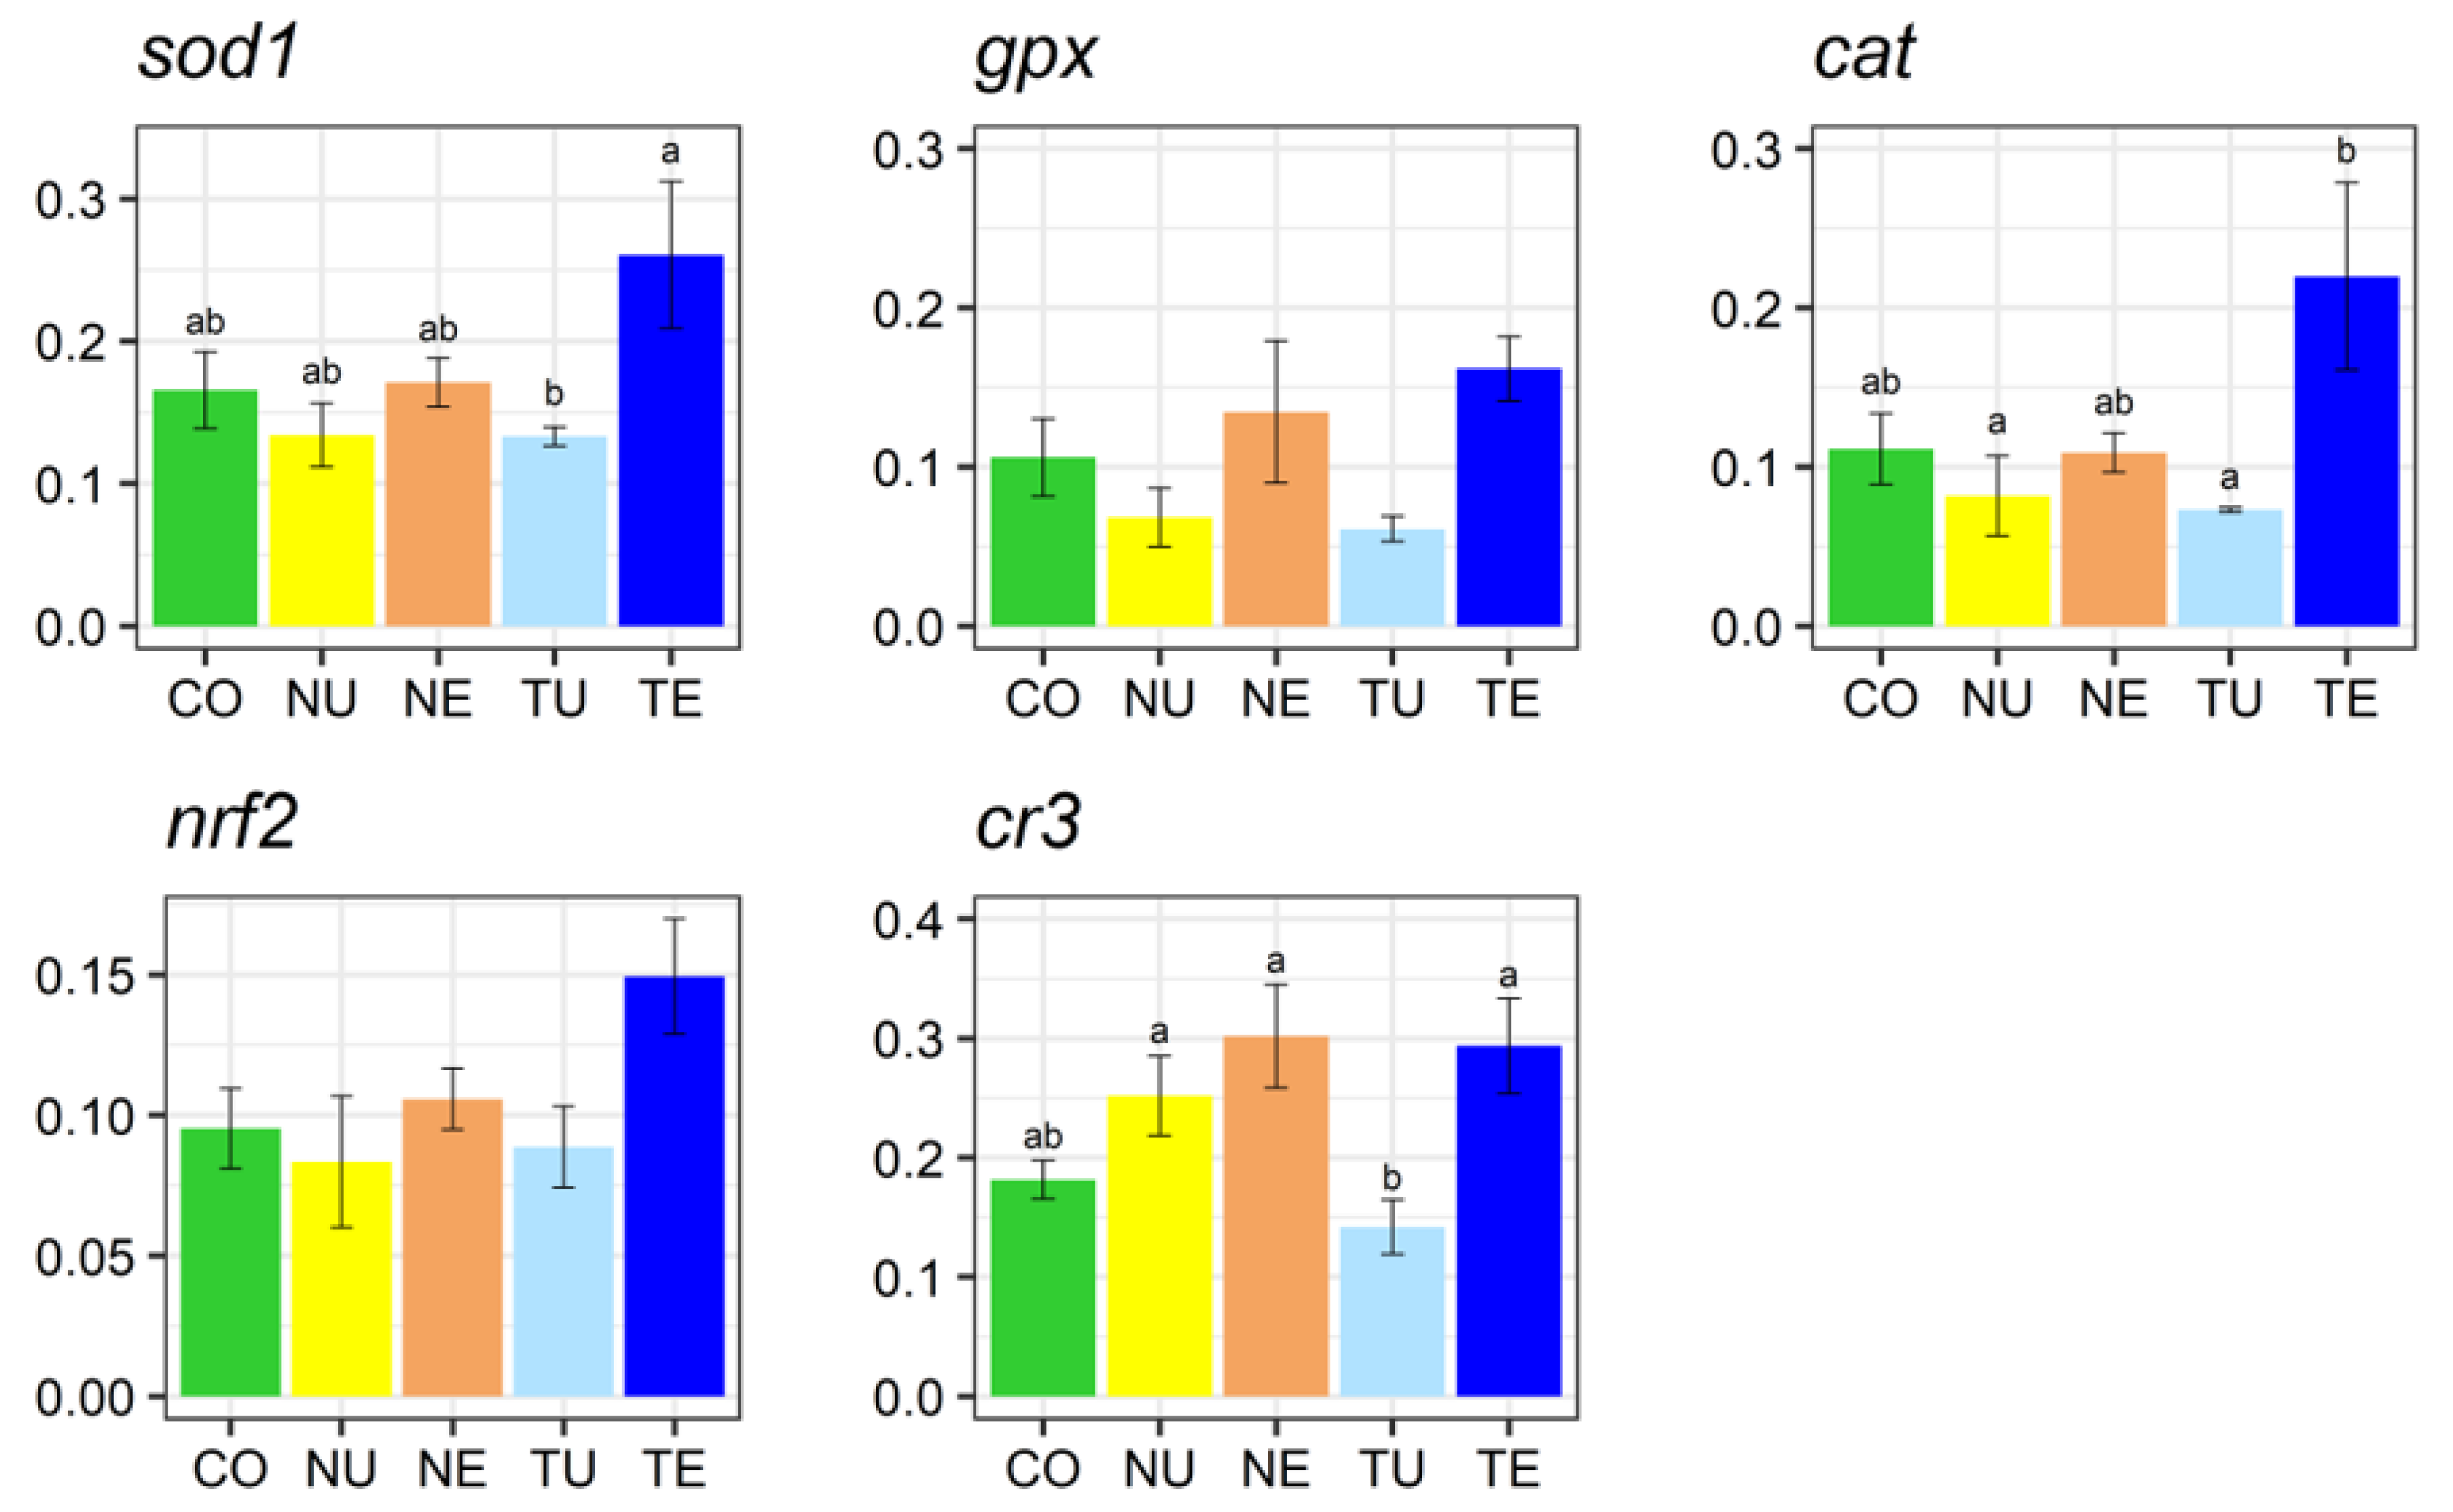
2.5. Gene Expression Analysis

The relative expression of the mucin gene muc2 in Atlantic salmon distal intestine is shown in Figure 1; there were no significant differences in the gene expression. Expression of muc5ac1, muc5ac2 and muc5b were also examined, but the values were too low to be quantified.
The relative expressions of antioxidant and immune-related genes in Atlantic salmon distal intestine and liver are shown in Figure 2 and Figure 3, respectively. Expression of the antioxidant-related genes sod1 and gpx in the distal intestine of the study groups were not significantly different (Figure 2). Nevertheless, the non-significant differences in the expression of sod1 in the NU, NE and TU groups and the expression of gpx in the NU and NE groups deserve attention. The expression of cr3 in the distal intestine of the study groups did not vary significantly.
The extruded Tetraselmis-fed fish had elevated the expression of selected antioxidant and immune-related genes in the liver compared to the untreated Tetraselmis diet (TE vs. TU; Figure 3). The antioxidant genes, namely sod1, gpx, cat, nrf2 and cr3, were higher in the extruded Tetraselmis-fed fish (TE). The gene cr3 had significantly lower expression in the TU diet group compared to the other algae-fed groups. The gene cat was significantly higher in the TE group compared to the NU and TU groups. Furthermore, sod1 was significantly higher in the TE group compared to the TU group.
The effect of pre-treatment was reflected in the expression of all the genes examined in the liver of Atlantic salmon (Supplementary Table S4). On the contrary, such an effect was not evident in the case of genes that were examined in the distal intestine of the fish (Supplementary Table S5).

3. Discussion

To obtain a well-balanced, cost-optimal feed, the aquafeed industry employs ingredients from agricultural crops, products from wild aquatic animals and land animals, insect meal and algal meal as well as oils. However, we have to reduce the dependence on finite resources from the wild and human food to make aquaculture more sustainable [42]. Among the new aquafeed ingredients, insect (black soldier fly larvae; Hermetia illucens, L.) meal incorporation levels of 60% in feeds is reported to lower the apparent digestibility coefficients of protein, lipids and amino acids, and increase both hepatosomatic and viscerosomatic indices in Atlantic salmon maintained in freshwater [43]. On the other hand, 20% of insect meal in feeds was found to increase the dry matter, gross energy and mineral digestibility coefficients in Atlantic salmon [44]. Another study also indicated the positive effects of 60% insect meal in the diets of Atlantic salmon in freshwater [45]. Nevertheless, it is essential to gather information regarding the suitability of algae, which lies at the bottom of the aquatic food web, for farmed fishes. In the present study, we employed meals from two microalgae, Nannochloropsis oceanica and Tetraselmis sp. to understand their ability to alter growth, accumulate fatty acids in the fillets and alter selected genes of Atlantic salmon. Furthermore, we have described the histological changes in the intestine and liver and potential impact of algae and feed VOCs on the antioxidant genes of the fish.

3.1. Growth and Chemical Composition

Earlier studies on feeding microalgae-incorporated feeds to Atlantic salmon tested inclusion levels up to 20% [2,3,4,5,6,7,46,47,48]. The current experiment was designed to examine the effects of 30% incorporation of two microalgae strains on growth and health parameters. The 30% inclusion level had a negative effect on growth. However, the growth data must be interpreted carefully as the feeding period was short, and the protein and lipid levels varied among the experimental feeds (Table 5). All the microalgae-incorporated diets contained less protein and lipid, and consequently less energy, compared to the CO diet, and this may explain the lower weight gain observed in algae-fed fish [49].
Biochemical composition of fish varies with their life stages and is influenced by environmental and dietary factors [50]. Significant differences were observed in the proximate composition of whole fish from the different feeding groups of the present experiment; this result is in line with other studies that examined the effect of feeding microalgae on fish performance [51,52]. In the present study, the highest protein content was noted in fish fed the CO diet compared to the extruded microalgae-incorporated diets, and the unextruded Tetraselmis-fed fish had higher whole body protein content compared with extruded Tetraselmis-fed fish. These observations indicate that the pre-treatment of the microalgae biomass can reduce the utilization of nutrients from the microalgae. Damage to proteins during heat processing is a function of temperature, time, moisture and the presence of reducing substances [53]. The amino acids that are most susceptible to heat treatment-induced degradation are arginine, cysteine, lysine, serine and threonine [54]. Amino acids with reactive side chains may link to reducing agents present in feeds [55]. Cysteine and methionine are sulfur amino acids, but the sulfur atom of cysteine that is present in the side chain is involved in the formation of reactive sulfhydryl group, and cysteine can be easily oxidized to form cystine dimer containing disulfide bridge [55]. Maillard reaction readily takes place between lysine and reducing sugars, and it is known to reduce fish growth [56]. Overheating of fish meal during drying increased the cross-linking between proteins [57] and reduced digestibility of nearly all amino acids, especially cysteine [58,59,60,61]. Heat-induced changes in cysteine and the ensuing effect on protein and amino acid digestibility in rainbow trout (Salmo gairdneri) has been reported previously [57]. The whole body lipid content of the experimental fish was in the same range [4], or higher than earlier studies with Atlantic salmon fed microalgae [3] and lower than lipid content reported when salmon were fed 10% pre-extruded N. oceanica in plant-based feeds [48]. In the present study, the highest lipid content and lowest protein content was noted for fish fed TE and this result could suggest that the protein quality was too inferior to support efficient growth. The ash content of the experimental fish was in agreement with other reported values on fish fed with microalgae [4] and higher than the whole body ash values reported by us previously [48].
As for the fatty acid composition in the fillet of Atlantic salmon, SFAs were higher in the NE fed fish and MUFAs were higher in the NU fed fish. On the other hand, the PUFAs, n-3 PUFAs and EPA + DHA were higher in fish fed the TU diet. It is known that the fatty acid composition of Atlantic salmon fillet reflects the levels present in the diet [62,63,64]. Feeding defatted N. oculata biomass and whole cell Schizochytrium sp. to Nile tilapia (Oreochromis niloticus) did not alter the total SFAs, MUFAs or PUFAs but significantly increased DHA and decreased the EPA in the fillets of the fish fed algae [36]. Another study that employed Schizochytrium spp. to replace fish oil in the diets of Atlantic salmon, also reported lower concentration of EPA and higher amounts of DHA in the alga fed fish [65]. Muscle EPA and DHA contents were not altered by feeding a combination of dried Nannochloropsis sp. and Isochrysis sp., but it elevated the concentration of arachidonic acid [66].

3.2. Intestinal Health

Nannochloropsis or Tetraselmis, at high (30%) levels, in the marine-based diets did not induce strong signs of inflammation in the intestine of the fish. The noted alteration can be characterized as minor to moderate, as the typical intestinal inflammation features such as shortening of mucosal folds and absence of absorptive vacuoles were not observed in the algae-fed groups [67,68]. Microalgae might not induce enteritis because they may not contain antinutritional factors. It has been shown that DHA deficiency in diets can affect the intestinal morphology of Atlantic salmon, causing swollen enterocytes and unusual vacuoles [69]. As discussed above, the high inclusion of microalgae in the diets used in our study may have caused an alteration of fatty acid composition in the fish, which could have contributed to the observed changes in the intestinal and liver morphology. A recent study from our research group found minor changes in the distal intestinal morphology of Atlantic salmon fed diets with a mix of plant proteins [68]. Nevertheless, we noted higher palmitic acid (C16:0) in the fillets from fish that consumed the NE diet. It is reported that dietary palmitic acid can increase the number of goblet cells, expression of Muc2 and transmucosal electrical resistance in the colon of rats [70]. Certain long-chain polyunsaturated fatty acids reduce goblet cell number [70] and, in our study, Σn-6/n-3 was lower and EPA+DHA was higher in the fillets of the TU group.
Even though the inclusion level of algae in the present experiment was higher than those employed in other studies performed with Atlantic salmon, the observed micromorphological features are somewhat comparable with those of other studies where N. oceanica was incorporated either at 10 or 20% [5]. N. oceanica included at 10% in a plant-based diet with or without feed additives did not change the intestinal structure of Atlantic salmon [48]. On the other hand, a blend of Tisochrysis lutea and Tetraselmis suecica, which replaced 15 and 45% fish meal protein, increased the height and thickness of the proximal intestine villi of European sea bass [71]. Studies with gilthead seabream (Sparus aurata) fed 10% T. chuii or 10% Phaeodactylum tricornutum reported morphological changes in the intestinal mucosa of the fish [72]; fish fed T. chuii showed signs of oedema and inflammation, while such changes were not evident in those fed P. tricornutum. In a long-term study on Atlantic salmon, covering most of the aquaculture production cycle (18 g to 3 kg), around 2.5–6% Schizochytrium limacinum in modern low-fishmeal diets caused a downregulation of some genes related to intestinal inflammatory response, but intestinal histology study did not indicate any diet-related changes [73]. However, all the samples, including those from the control group, had aberrant distal intestine morphology [73]. Another study reported morphological changes in the intestinal villi and swollen goblet cells in Atlantic salmon fed 15% Schizochytrium sp. and yeast extract, but there were no signs of toxicity, stress or inflammation [7].
The changes in hepatocyte morphology that were visible in fish fed single and double extruded microalgae in the feeds were not evident in the CO group. Vacuoles were visible in the hepatocytes of the pre-extruded groups (NE, TE). These vacuoles may indicate accumulation of glycogen or fat in the hepatocytes prompted by the algae incorporation in the feeds, as noted in previous studies [74,75]. A study revealed that the vacuoles in the liver of juvenile Senegalese sole (Solea senegalensis) disappeared after 90 days of feeding of the macroalga, Ulva ohnoi [76]. On the other hand, the microalga Scenedesmus sp., when included in feeds, did not cause any adverse effects in both the intestine and liver of rainbow trout [77]; here, the alga inclusion was only 5%. Our findings suggest that incorporation of microalgae at 30%, and in particular the double extrusion of microalgae, may have affected the nutrient availability or metabolism of nutrients. Feed processing temperature was also found to have an effect on the metabolism of fish, as indicated by Jasour et al.; extrusion at a higher temperature may produce undesirable protein oxidation products in the feeds [78]. Furthermore, fatty acid content can affect the liver morphology of Atlantic salmon, as observed in a feeding trial with EPA or DHA deficient diets [69]. On the contrary, large amounts of lipid droplets were noted in the liver and intestinal cells of another salmonid, rainbow trout, fed diets containing a mix of plant oils [79]. Even though we did not set out to replace fish oil in this experiment, the algae meal does contain some lipids, which may have affected the lipid metabolism and caused the observed changes in hepatocyte morphology. It is likely that the observation in the present study is lipid-based vacuolization rather than glycogen-based because glycogen should have been dyed pink by the PAS staining. However, we are unable to ascertain this, and, thus, it warrants further investigation. High levels of dietary n-6 fatty acids, especially 18:2n-6, leads to more accumulation of n-6 fatty acids in all tissues, and neutral lipids in the liver of Atlantic salmon had more linoleic acid. Linoleic acid and EPA were found to increase and C22:5n-3 and DHA were decreased in the liver of Genetically Improved Farmed Tilapia (O. niloticus) fed a high-fat diet (soybean oil) [80]. The TU group, which was found to have a similar liver morphology as that of the CO group, had a profile of the abovementioned fatty acids that plausibly would not have favored the accumulation of linoleic acid.
As for the mucin genes, high expression of muc2 and low expression of muc5ac and muc5b in the distal intestine of Atlantic salmon corroborated the result of others [26] who reported the predominance of muc2 in the intestine. Both muc2 and muc5b were differentially expressed in the skin, gills and intestine of common carp [25]. The MUC2 mucin is the primary intestinal mucin across many species, including mammals and birds [81], and muc2 is constitutively expressed in the intestine of fishes. It is reported that other intestinal mucin genes are altered by diet or intestinal parasite infection [24]. The expression of muc2 in the intestine of carp was altered by dietary glucan [25]. Our recent study has revealed the reduction in the expression of muc2 in the intestine of Atlantic salmon fed a diet containing 20% soybean meal and 30% fishmeal and fish oil [68]. However, in the present study, muc2 was not significantly altered in the distal intestine of Atlantic salmon fed algae diets.
The higher gene expression of antioxidant-related genes in the liver of Tetraselmis-fed fish could be pointing to an improved response to oxidative stress. Superoxide dismutase, serum catalase and glutathione-S-transferase activities and total antioxidant capacity of catfish (Clarias gariepinus) exposed to sodium dodecyl sulfate were restored through an additional exposure to Spirulina platensis [82]. The protective role of dietary Chlorella vulgaris against arsenic toxicity was revealed through increased antioxidant activities (catalase, glutathione and glutathione peroxidase) in the liver of Nile tilapia fed 10% of the alga [83]. We did not perform a challenge study, instead we investigated the effect of double extrusion on increased utilization of the algae biomass. Expression of cat and sod1 was significantly higher in the liver of TE, which was the group with higher liver vacuolization. Oxidative stress is observed during steatosis, and cells respond to the condition by increasing the molecules of the antioxidant system. Antioxidant enzymes such as Cu/Zn-SOD, GPx and catalase activities in the liver of non-alcoholic fatty liver disease patients were significantly higher [84]. In addition, there exists a correlation between lipid accumulation and expression of C3d and C3 in the liver of mice fed a high-fat diet [85]. CR3 on macrophages recognizes the C3d fragment of C3 [86], and we observed a higher expression of cr3 in the liver of the TE group. In our previous study with Atlantic salmon fed diets with up to 20% defatted Desmodesmus sp., we did not observe any change in the antioxidant capacity or the expression of intestinal immune and inflammatory marker genes [4]. An alternate interpretation of the present results is that the double extrusion of the microalgae may have caused quality changes in the feeds, which in turn may have triggered oxidative stress in the fish. However, the patterns of change in VOCs in feeds and alteration of the liver antioxidant genes are not similar. In addition, the pattern of expression of the antioxidant genes in the distal intestine and liver were different. This may be explained by the role of the liver in the metabolism of nutrients and handling of ROS.
The experimental feeds were high in polyunsaturated fatty acids and because the feeds had high content of marine ingredients, the lipid profile was dominated by long-chain n-3 fatty acids that are prone to oxidation during processing and storage. Double extrusion of the two microalgae may have challenged the stability of the products [87,88]. The aldehyde, hexanal which is formed from linoleic, gamma-linolenic and arachidonic acids was found in higher concentrations compared to propanal, the aldehyde formed from ALA, EPA and DHA [89]. GC-MS analysis indicated that the amount and type of volatile oxidation products in the experimental feeds were similar to those associated with Norwegian fish meal. Although extrusion can eliminate enzymatic rancidity, oxidative rancidity can occur during the feed manufacturing process [90]. Hence, the higher concentration of certain volatile compounds that are linked to extrusion could be indicative of the fact that double extruded microalgae may need stabilization with antioxidants. To overcome this issue, super critical fluid extrusion can be considered because this method aided vitamin retention in addition to restraining lipid oxidation in puffed rice [91].
To embrace sustainability, the aquafeed industry could employ microalgae that have high-value lipids, high-quality proteins and antioxidants. Such a strategy will reduce the dependency on human food-based meals and oils and our finite resources. Through the current study we assessed the potential of microalgae, their ability to impart growth and affect health in fishes.

4. Materials and Methods

The study was approved by the Norwegian Animal Research Authority (FDU: Forsøksdyrutvalget ID-5887). Atlantic salmon smolt of average weight 154.2 g (AquaGen strain) were purchased from a local commercial producer (Cermaq Norway AS, Hopen, Norway), and randomly sorted into the rearing tanks (800 L, A-plast, Skodje, Norway) at the Research Station of Nord University. Each tank contained 39 fish, and there were four replicate tanks per diet group. All tanks were supplied with filtered and aerated seawater (8.6 °C ± 0.2) in a flow-through system, and the average oxygen saturation was 86.7% measured at the outlet of each tank. Tanks were kept under 24 h photoperiod with artificial light.
The following five diets were fed for 60 days to the respective fish group: (1) CO: a fish meal-based control (basal) diet, (2) NU: a Nannochloropsis diet, (3) NE: a pre-extruded Nannochloropsis diet, (4) TU: a Tetraselmis diet, and (5) TE: a pre-extruded Tetraselmis diet. All diets, except the CO diet, contained 30% of the respective microalga (Table 5). These feeds were produced by Sparos LDA, Olhão, Portugal. For NE and TE, the dried algal meal was subjected to a pre-extrusion before they were blended with the other ingredients, as earlier described by Gong, Sørensen, Dahle, Nadanasabesan, Dias, Valente, Sørensen and Kiron [48]. In brief, this was carried out by passing the algal meal through a twin-screw extruder (model BC45, Clextral, Firminy, France). All diets were then produced by mixing the ingredients with a double-helix mixer (model 500 l, TGC Extrusion, Roullet-Saint-Estèphe, France), milled in a hammer mill (model SH1, Hosokawa-Alpine, Augsburg, Germany), extruded through a twin-screw extruder (model BC45, Clextral), and vacuum coated (model PG-10VCLAB, Dinnissen, The Netherlands) according to common fish feed production practices. The ingredient and proximate composition of the feeds are listed in Table 5. Fish in each tank were fed twice a day (08.00–9.00 and 15.00–16.00) using a programmed automatic feeding system (Arvo-Tec, Huutokoski, Finland). The feeding rate was initially 1% of biomass and the rate was gradually increased to 1.4% taking the appetite of the fish into consideration.
Chemical analysis of whole body (dry matter, protein, lipid, ash and energy; 6 fish per tank were pooled to obtain a sample for analysis) and fatty acid composition of fillet was performed on freeze-dried samples. Dry matter content was determined by differences; by oven drying (2.0 g) samples to a constant weight at 104 °C for 20 h (ISO 6496-1999). The oven dried samples were combusted in a muffle furnace to a constant weight at 540 °C for 16 h to determine the ash content (ISO 5984-2002). Crude protein in 0.5 g of samples were determined by Kjeldahl titration method (N × 6.25, KjeltecTM 2300, Foss Tecator AB, Höganäs, Sweden; ISO 5983-1987). Crude fat in 2.0 g of samples were determined gravimetrically using the diethyl ester extraction method, according to the Norwegian Standard Association [92]. Energy was analyzed by bomb calorimeter (IKA C200, Staufen, Germany: ISO 9831: 1998). Carbohydrates were calculated as follows: 100 − (water + protein + lipid + ash).
Total lipid extractions of freeze-dried whole bodies or fillets (100 mg/sample) were carried out according to the chloroform/methanol (2:1, v/v) gravimetric determination described by Bligh and Dyer [93]. Briefly, freeze-dried samples were homogenized by mixing 1.8 mL of distilled water, 2 mL of methanol and 1 mL of chloroform followed by adding 1 mL of chloroform and 1 ml of distilled water. Samples were then centrifuged (4000 rpm) to separate the phases. The lower chloroform phase containing lipids was transferred into a glass tube and dried under a gentle nitrogen flow to prevent fatty acid oxidation. Fatty acid methyl esters (FAMEs) of samples were obtained by transesterification and methylation according to the method described previously [94]. FAMEs analyses were performed in duplicate in a gas chromatograph (SCION 436-GC, Scion Instruments, Goes, The Netherlands) fitted with a flame ionization detector at 250 °C. The separation was achieved using a wax embedded column of 25 m length, 0.25 mm internal diameter and 0.2 µm film thickness (Agilent Technologies, Middelburg, The Netherlands). Individual FAME was identified and quantified by comparison to known standard mixtures of common fatty acids (FAME MIX 2/GLC-473, Nu-Chek Prep, Elysian, MN, USA) and results were expressed as relative area percentage of the total fatty acid using a software Compass CDS, Bruker Co-operation.
Oxidation stability of the experimental diets were analyzed by dynamic headspace gas chromatography–mass spectrometry (GC-MS) of volatile oxidation products. Samples (2 g) were weighed into Erlenmeyer flask and methanol spiked with ethyl heptanoate (internal standard). The samples were then placed in a water bath at 70 °C and purged for 20 min with a stream of nitrogen, (100 mL/min). Volatile compounds were trapped on an adsorber (Tenax GR), desorbed at 280 °C for 5 min in a Markes Thermal Desorber and transferred to an Agilent 6890 GC with an Agilent 5973 Mass Selective Detector (EI, 70 eV). The volatiles were separated in a DB-WAXetr column (30 m, 0.25 mm i.d., 0.5 μm film) with a temperature program starting at 30 °C, held for 10 min, increasing 1°/min to 40 °C, 3°/min to 70 °C, and 6.5°/min to 230 °C, with a hold time of 5 min. The peaks were integrated and compounds tentatively identified with HP Chemstation software, and NIST11 Mass Spectral Library. System performance was checked with blanks and standard samples before and after analysis. The feed samples were analyzed in duplicate.
The specific growth rate (SGR) of the fish, expressed in %/day, was calculated as follows
SGR = ln ( w f ) ln ( w i ) t   ×   100
where wf and wi are the mean final and initial weight of the fish, respectively, measured in grams, and t is time measured in days.
Three fish per tank for liver gene expression analysis, and five fish per tank for intestinal gene expression analysis were collected at the end of the feeding trial. These fish were randomly selected for sampling from each tank, anaesthetized with tricaine mesylate (MS-222, Argent Chemical Laboratories, Redmond, WA, USA), and killed with a sharp blow to the head.
For histology, 3 fish/tank or 12 fish per diet group were processed and employed for the study. A small part of the liver, pyloric caeca, mid intestine and distal intestine were dissected out and placed in neutral buffered formalin (NBF, 4%). The samples were processed using standard histology procedures and embedded in paraffin. The paraffin blocks were sectioned using a microtome (Microm HM3555, MICROM International GmbH, Walldorf, Germany), stained using a staining machine (Microm HMS 760×, MICROM International GmbH) with Alcian Blue-Periodic Acid Schiff’s reagent (AB-PAS, pH 1). The stained slides were mounted with Pertex® mounting medium and later viewed with light microscope Olympus BX61/Camera Color View IIIu (Olympus Europa GmbH, Hamburg, Germany). The captured images were analyzed using the software Cell P (Soft Imaging System GmbH, Munster, Germany). ImageJ 1.53e was employed to quantify the features of interest. In all cases, we employed images from four fish per group. Measurements such as villi width (at the villi base), combined height of stratum granulosum and stratum compactum (measured by drawing a straight line parallel to lamina propria) were taken after setting the scale. Goblet cell counts and their area in each villus were recorded using freehand selection tool. The selection was first converted to an 8-bit image, after clearing and subtracting the background. Next, after converting to binary, particles were analyzed; thus, we obtained the cell counts and area. A semi-quantitative approach was also employed to score the vacuoles in both distal intestine enterocytes and liver tissue; 5 indicated high vacuolization and 1 was assigned for images with no or hardly any vacuoles.
For gene expression analysis, a small piece of the liver and distal intestine was dissected out and gently rinsed with PBS. The samples were immediately placed in cryotubes and frozen in liquid nitrogen, and later stored at -80 °C.
The relative mRNA levels of mucin genes (muc2, muc5ac1, muc5ac2 and muc5b) in the distal intestine, and antioxidant genes (catalase—cat; glutathione peroxidase—gpx; nuclear factor erythroid 2—related factor 2—nrf2; superoxide dismutase 1—sod1) plus complement receptor 3—cr3 in the distal intestine and liver were examined in this study. Detailed information for all target and reference genes are presented in Table 6. Primers were purchased from Eurofins Genomics (Luxembourg, Luxembourg).
RNA was extracted from the samples using E-Z 96 Total RNA Kit (Omega Bio-Tek, Norcross, USA). Roughly 100 mg of the tissue sample was cut from the frozen sample and homogenized using Zirconium oxide beads (1.4 mm; Percellys, Tarnos, France) and TRK lysis buffer in a pre-cooled capped freestanding tube (VWR International, Oslo, Norway) at 6000 rpm. The resulting mixture was centrifuged (18,000× g, 20 °C) to obtain clear supernatant. Briefly, 300 µL supernatant was added to 300 µL 70% ethanol and mixed, before this mixture was added to the E-Z 96 RNA plate, which contained HiBind® matrix in each well. Centrifugation (3000 rpm, 15 min) was used to draw the sample through the well, followed by several steps of buffer washes according to the kit instructions. Finally, the RNA was obtained by adding 65–75 μL of RNase-free water (5 Prime GmbH, Hilden, Germany) to each well and a final centrifugation.
The purity and quality of RNA was checked in NanodropTM 1000 (ThermoFisher Scientific, Waltham MA, USA). Extracted RNA was quantified by Qubit™ RNA broad-range assay kit (Life Technologies, Carlsbad, USA) on a Qubit 3.0 Fluorometer (Life Technologies) and diluted with RNase-free water if necessary. cDNA synthesis was performed with QuantiTect™ Reverse Transcription Kit (Quiagen GmbH, Hilden, Germany) with 1000 ng of RNA and a reaction volume of 20 µL per sample, according to the manufacturer’s instructions. The cDNA samples were diluted with nuclease free water by a factor of 10 before continuing with qPCR.
qPCR was performed on a LightCycler® 96 (Roche Life Science) using Fast SYBR® Green Real-Time PCR Master Mix (Applied Biosystems, Carlsbad, CA, USA). Each reaction contained 5 μL of Fast SYBR® Green PCR Master Mix, 1 µL primer mix (200 nM), and 4 µL cDNA (0.5 ng/µL). Reactions (n = 20 and n = 12 per diet for distal intestine and liver, respectively) were performed in duplicate. Thermal cycling conditions were initial holding at 95 °C for 20 s, 40 cycles of denaturation at 95 °C (3 s), and annealing/extension at 60 °C (30 s).
A standard curve with known concentrations was prepared for each primer in order to calculate the gene expression. This was performed by pooling RNA from every sample, reverse transcribing the pooled RNA as described above, and using the resulting cDNA to create a 6-point threefold dilution series that was used for qPCR. The equation
E = ( 10 1 m 1 ) × 100
was used to calculate the efficiency of the primers (E) based on the slope (m) of the standard curve. The normalization factor was computed for each sample based on the relative quantities of the two most stable genes from among the set of four reference genes using geNorm [95]. The reference genes chosen were elongation factor 1AB (ef1ab), ribosomal protein L13 (rpl13), ribosomal protein S29 (rps29) and ubiquitin (ubi). The expression levels of all the target genes were then calculated relative to the normalization factor.
Statistical analysis was carried out using SigmaPlot. The data were tested for normality (Shapiro–Wilk normality test) and equality of variance (Levene’s test). For parametric data, one-way analysis of variance (ANOVA) was performed, followed by Tukey’s multiple comparison test to identify the significant differences among the means of the dietary groups. For non-parametric data, Kruskal–Wallis test, followed by Dunn’s multiple comparison test, was performed to decipher the significant differences between the groups. The data from the algae-fed groups were subjected to 2-way ANOVA to understand the effect of the extrusion process. A significance level of p < 0.05 was chosen to indicate the differences.

5. Conclusions

Atlantic salmon fed Nannochloropsis oceanica and Tetraselmis sp. did not exhibit any signs of intestine inflammation other than enterocyte vacuolization. A significant effect of processing was noted on the fillets’ fatty acids, liver histology and expression of genes in the liver. The correlation between vacuolization in the mid and distal intestine, and the changes in the fillets’ fatty acids and hepatocytes vacuolization, should be studied further.

Supplementary Materials

The following are available online at https://www.mdpi.com/article/10.3390/fishes6030023/s1. Supplementary Table S1. Results of 2-way ANOVA of fish growth and proximate composition. Supplementary Table S2. Results of 2-way ANOVA of fatty acid data from fillets of the algae-fed fish. Supplementary Table S3. Results of 2-way ANOVA of parameters measured from the mid and distal intestine and liver of Atlantic salmon. Supplementary Table S4. Results of 2-way ANOVA of gene data from the liver of the algae-fed fish. Supplementary Table S5. Results of 2-way ANOVA of gene data from the distal intestine of the algae-fed fish. Figure S1: Comparison of the photomicrographs of the pyloric caeca from Atlantic salmon fed control feed (CO) or algae-containing diets (NU, NE, TU, TE). Scale bar: 200 µm, Figure S2: Comparison of the photomicrographs of the mid intestine from Atlantic salmon fed control feed (CO) or algae-containing diets (NU, NE, TU, TE). Black arrow: Lamina propria. Asterisk: Stratum granulosum. Scale bar: 100 µm. Figure S3: Comparison of the photomicrographs of the distal intestine from Atlantic salmon fed control feed (CO) or algae-containing diets (NU, NE, TU, TE). Black arrow: Lamina propria. Asterisk: Stratum granulosum. Red arrow: Supranuclear vacuolization. Scale bar: 100 µm. Figure S4: Comparison of the photomicrographs of the liver from Atlantic salmon fed control feed (CO) or algae-containing diets (NU, NE, TU, TE). A. Original images. B. Green channel of the original images. Red arrow: Small vacuoles. Black arrow: Large vacuoles. Scale bar: 50 µm., Figure S5: Comparison of the histological parameters that were assessed in the mid intestine of Atlantic salmon fed control feed (CO) or algae-containing diets (NU, NE, TU, TE), Figure S6: Comparison of the histological parameters that were assessed in the distal intestine of Atlantic salmon fed control feed (CO) or algae-containing diets (NU, NE, TU, TE), Figure S7: Comparison of vacuolization in the liver of Atlantic salmon fed control feed (CO) or algae-containing diets (NU, NE, TU, TE).

Author Contributions

Conceptualization, V.K. and M.S.; methodology, V.K. and M.S.; validation, V.K. and M.S.; formal analysis, S.L.S., A.G., G.V., D.D. and Y.G.; investigation, Y.G., A.G. and S.L.S.; resources, M.S. and V.K.; data curation, S.L.S., M.S. and V.K.; writing—original draft preparation, S.L.S. and A.G.; writing—review and editing, V.K. and M.S.; visualization, S.L.S.; supervision, V.K. and M.S.; project administration, V.K.; funding acquisition, V.K. and M.S. All authors have read and agreed to the published version of the manuscript.

Funding

This study was funded by the Research Council of Norway (Project No. 260190, Alger4laks) and is part of the COFASP ERA-NET project MARINALGAE4aqua.

Institutional Review Board Statement

The study was conducted according to the guidelines of the National Animal Research Authority (FDU: Forsøksdyrutvalget ID-5887) in Norway.

Data Availability Statement

Data is contained within the article and supplementary material. Supplementary material contains figures necessary for interpreting the results.

Acknowledgments

This study was funded by the Research Council of Norway (Project No. 260190, Alger4laks) and is part by the COFASP ERA-NET project MARINALGAE4aqua. The authors acknowledge the support of the staff at the Research Station of Nord University. Yangyang Gong was financially supported by a fellowship from the China Scholarship Council as well as by the funding from East China Sea Fisheries Research Institute, Chinese Academy of Fishery Sciences.

Conflicts of Interest

The authors declare no conflict of interest. The funders had no role in the design of the study; in the collection, analyses, or interpretation of data; in the writing of the manuscript, or in the decision to publish the results.

References

  1. Shah, M.R.; Lutzu, G.A.; Alam, A.; Sarker, P.; Chowdhury, M.K.; Parsaeimehr, A.; Liang, Y.; Daroch, M. Microalgae in aquafeeds for a sustainable aquaculture industry. J. Appl. Phycol. 2018, 30, 197–213. [Google Scholar] [CrossRef]
  2. Gong, Y.; Guterres, H.A.D.S.; Huntley, M.; Sørensen, M.; Kiron, V. Digestibility of the defatted microalgae Nannochloropsis sp. and Desmodesmus sp. when fed to Atlantic salmon, Salmo salar. Aquac. Nutr. 2018, 24, 56–64. [Google Scholar] [CrossRef]
  3. Kiron, V.; Phromkunthong, W.; Huntley, M.; Archibald, I.; Scheemaker, G.d. Marine microalgae from biorefinery as a potential feed protein source for Atlantic salmon, common carp and whiteleg shrimp. Aquac. Nutr. 2012, 18, 521–531. [Google Scholar] [CrossRef]
  4. Kiron, V.; Sørensen, M.; Huntley, M.; Vasanth, G.K.; Gong, Y.; Dahle, D.; Palihawadana, A.M. Defatted biomass of the microalga, Desmodesmus sp., can replace fishmeal in the feeds for Atlantic salmon. Front. Mar. Sci. 2016, 3, 67. [Google Scholar] [CrossRef] [Green Version]
  5. Sørensen, M.; Gong, Y.; Bjarnason, F.; Vasanth, G.K.; Dahle, D.; Huntley, M.; Kiron, V. Nannochloropsis oceanica-derived defatted meal as an alternative to fishmeal in Atlantic salmon feeds. PLoS ONE 2017, 12, e0179907. [Google Scholar] [CrossRef]
  6. Sørensen, M.; Berge, G.M.; Reitan, K.I.; Ruyter, B. Microalga Phaeodactylum tricornutum in feed for Atlantic salmon (Salmo salar)—Effect on nutrient digestibility, growth and utilization of feed. Aquaculture 2016, 460, 116–123. [Google Scholar] [CrossRef]
  7. Kousoulaki, K.; Østbye, T.-K.K.; Krasnov, A.; Torgersen, J.S.; Mørkøre, T.; Sweetman, J. Metabolism, health and fillet nutritional quality in Atlantic salmon (Salmo salar) fed diets containing n-3-rich microalgae. J. Nutr. Sci. 2015, 4. [Google Scholar] [CrossRef] [PubMed] [Green Version]
  8. Tibbetts, S.M.; Mann, J.; Dumas, A. Apparent digestibility of nutrients, energy, essential amino acids and fatty acids of juvenile Atlantic salmon (Salmo salar L.) diets containing whole-cell or cell-ruptured Chlorella vulgaris meals at five dietary inclusion levels. Aquaculture 2017, 481, 25–39. [Google Scholar] [CrossRef] [Green Version]
  9. Dineshbabu, G.; Goswami, G.; Kumar, R.; Sinha, A.; Das, D. Microalgae–nutritious, sustainable aqua-and animal feed source. J. Funct. Foods 2019, 62, 103545. [Google Scholar] [CrossRef]
  10. Goiris, K.; Muylaert, K.; Fraeye, I.; Foubert, I.; De Brabanter, J.; De Cooman, L. Antioxidant potential of microalgae in relation to their phenolic and carotenoid content. J. Appl. Phycol. 2012, 24, 1477–1486. [Google Scholar] [CrossRef]
  11. Forrester, S.J.; Kikuchi, D.S.; Hernandes, M.S.; Xu, Q.; Griendling, K.K. Reactive oxygen species in metabolic and inflammatory signaling. Circ. Res. 2018, 122, 877–902. [Google Scholar] [CrossRef]
  12. Regoli, F.; Giuliani, M.E. Oxidative pathways of chemical toxicity and oxidative stress biomarkers in marine organisms. Mar. Environ. Res. 2014, 93, 106–117. [Google Scholar] [CrossRef] [PubMed]
  13. Schneider, H.; Pelaseyed, T.; Svensson, F.; Johansson, M.E.V. Study of mucin turnover in the small intestine by in vivo labeling. Sci. Rep. 2018, 8, 5760. [Google Scholar] [CrossRef] [PubMed]
  14. Kraimi, N.; Dawkins, M.; Gebhardt-Henrich, S.G.; Velge, P.; Rychlik, I.; Volf, J.; Creach, P.; Smith, A.; Colles, F.; Leterrier, C. Influence of the microbiota-gut-brain axis on behavior and welfare in farm animals: A review. Physiol. Behav. 2019, 210, 112658. [Google Scholar] [CrossRef] [PubMed]
  15. Bjørgen, H.; Li, Y.; Kortner, T.M.; Krogdahl, Å.; Koppang, E.O. Anatomy, immunology, digestive physiology and microbiota of the salmonid intestine: Knowns and unknowns under the impact of an expanding industrialized production. Fish. Shellfish Immunol. 2020, 107, 172–186. [Google Scholar] [CrossRef] [PubMed]
  16. McGuckin, M.A.; Lindén, S.K.; Sutton, P.; Florin, T.H. Mucin dynamics and enteric pathogens. Nat. Rev. Microbiol. 2011, 9, 265–278. [Google Scholar] [CrossRef]
  17. Dang, M.; Pittman, K.; Sonne, C.; Hansson, S.; Bach, L.; Søndergaard, J.; Stride, M.; Nowak, B. Histological mucous cell quantification and mucosal mapping reveal different aspects of mucous cell responses in gills and skin of shorthorn sculpins (Myoxocephalus scorpius). Fish. Shellfish Immunol. 2020, 100, 334–344. [Google Scholar] [CrossRef] [PubMed]
  18. Ratcliffe, M.J. Encyclopedia of Immunobiology; Academic Press: Cambridge, MA, USA, 2016; Available online: https://www.sciencedirect.com/referencework/9780080921525/encyclopedia-of-immunobiology (accessed on 22 February 2021).
  19. Thornton, D.J.; Sheehan, J.K. From mucins to mucus. Proc. Am. Thorac. Soc. 2004, 1, 54–61. [Google Scholar] [CrossRef]
  20. Linden, S.K.; Sutton, P.; Karlsson, N.G.; Korolik, V.; McGuckin, M.A. Mucins in the mucosal barrier to infection. Mucosal Immunol. 2008, 1, 183–197. [Google Scholar] [CrossRef] [Green Version]
  21. Lang, T.; Klasson, S.; Larsson, E.; Johansson, M.E.V.; Hansson, G.C.; Samuelsson, T. Searching the evolutionary origin of epithelial mucus protein components—Mucins and FCGBP. Mol. Biol. Evol. 2016, 33, 1921–1936. [Google Scholar] [CrossRef]
  22. Lang, T.; Hansson, G.C.; Samuelsson, T. Gel-forming mucins appeared early in metazoan evolution. Proc. Natl. Acad. Sci. USA 2007, 104, 16209–16214. [Google Scholar] [CrossRef] [Green Version]
  23. Lang, T.; Alexandersson, M.; Hansson, G.C.; Samuelsson, T. Bioinformatic identification of polymerizing and transmembrane mucins in the puffer fish Fugu rubripes. Glycobiology 2004, 14, 521–527. [Google Scholar] [CrossRef] [Green Version]
  24. Pérez-Sánchez, J.; Estensoro, I.; Redondo, M.J.; Calduch-Giner, J.A.; Kaushik, S.; Sitjà-Bobadilla, A. Mucins as diagnostic and prognostic biomarkers in a fish-parasite model: Transcriptional and functional analysis. PLoS ONE 2013, 8, e65457. [Google Scholar] [CrossRef] [PubMed] [Green Version]
  25. Van der Marel, M.; Adamek, M.; Gonzalez, S.F.; Frost, P.; Rombout, J.H.W.M.; Wiegertjes, G.F.; Savelkoul, H.F.J.; Steinhagen, D. Molecular cloning and expression of two β-defensin and two mucin genes in common carp (Cyprinus carpio L.) and their up-regulation after β-glucan feeding. Fish. Shellfish Immunol. 2012, 32, 494–501. [Google Scholar] [CrossRef] [PubMed]
  26. Sveen, L.R.; Grammes, F.T.; Ytteborg, E.; Takle, H.; Jørgensen, S.M. Genome-wide analysis of Atlantic salmon (Salmo salar) mucin genes and their role as biomarkers. PLoS ONE 2017, 12, e0189103. [Google Scholar] [CrossRef] [Green Version]
  27. Brown, M.R.; Mular, M.; Miller, I.; Farmer, C.; Trenerry, C. The vitamin content of microalgae used in aquaculture. J. Appl. Phycol. 1999, 11, 247–255. [Google Scholar] [CrossRef]
  28. Pataroa, G.; Carulloa, D.; Ferraria, G. PEF-assisted supercritical CO2 extraction of pigments from microalgae Nannochloropsis oceanica in a continuous flow system. Chem. Eng. 2019, 74. [Google Scholar] [CrossRef]
  29. Kokkali, M.; Martí-Quijal, F.J.; Taroncher, M.; Ruiz, M.-J.; Kousoulaki, K.; Barba, F.J. Improved extraction efficiency of antioxidant bioactive compounds from Tetraselmis chuii and Phaedoactylum tricornutum using pulsed electric fields. Molecules 2020, 25, 3921. [Google Scholar] [CrossRef] [PubMed]
  30. Tibbetts, S.M. The potential for ‘Next-Generation’, microalgae-based feed ingredients for salmonid aquaculture in context of the blue revolution. In Microalgal Biotechnol; IntechOpen: London, UK, 2018; Available online: https://www.intechopen.com/books/microalgal-biotechnology/the-potential-for-next-generation-microalgae-based-feed-ingredients-for-salmonid-aquaculture-in-cont (accessed on 3 February 2021).
  31. Lee, S.Y.; Cho, J.M.; Chang, Y.K.; Oh, Y.-K. Cell disruption and lipid extraction for microalgal biorefineries: A review. Bioresour. Technol. 2017, 244, 1317–1328. [Google Scholar] [CrossRef]
  32. Li, Q.; Zhou, Z.; Zhang, D.; Wang, Z.; Cong, W. Lipid extraction from Nannochloropsis oceanica biomass after extrusion pretreatment with twin-screw extruder: Optimization of processing parameters and comparison of lipid quality. Bioprocess. Biosyst. Eng. 2020, 43, 655–662. [Google Scholar] [CrossRef]
  33. Wang, M.; Cheng, H.; Chen, S.; Wen, S.; Wu, X.; Zhang, D.; Yuan, Q.; Cong, W. Microalgal cell disruption via extrusion for the production of intracellular valuables. Energy 2018, 142, 339–345. [Google Scholar] [CrossRef]
  34. Teuling, E.; Schrama, J.W.; Gruppen, H.; Wierenga, P.A. Effect of cell wall characteristics on algae nutrient digestibility in Nile tilapia (Oreochromis niloticus) and African catfish (Clarus gariepinus). Aquaculture 2017, 479, 490–500. [Google Scholar] [CrossRef]
  35. Alhattab, M.; Kermanshahi-Pour, A.; Brooks, M.S.-L. Microalgae disruption techniques for product recovery: Influence of cell wall composition. J. Appl. Phycol. 2019, 31, 61–88. [Google Scholar] [CrossRef]
  36. Sarker, P.K.; Kapuscinski, A.R.; McKuin, B.; Fitzgerald, D.S.; Nash, H.M.; Greenwood, C. Microalgae-blend tilapia feed eliminates fishmeal and fish oil, improves growth, and is cost viable. Sci. Rep. 2020, 10, 19328. [Google Scholar] [CrossRef]
  37. Güroy, D.; Güroy, B.; Merrifield, D.L.; Ergün, S.; Tekinay, A.A.; Yiğit, M. Effect of dietary Ulva and Spirulina on weight loss and body composition of rainbow trout, Oncorhynchus mykiss (Walbaum), during a starvation period. J. Anim. Physiol. Anim. Nutr. 2011, 95, 320–327. [Google Scholar] [CrossRef]
  38. Barden, L.; Decker, E.A. Lipid oxidation in low-moisture food: A review. Crit. Rev. Food Sci. Nutr. 2016, 56, 2467–2482. [Google Scholar] [CrossRef]
  39. Barriuso, B.; Astiasarán, I.; Ansorena, D. A review of analytical methods measuring lipid oxidation status in foods: A challenging task. Eur. Food Res. Technol. 2013, 236, 1–15. [Google Scholar] [CrossRef]
  40. Chen, Y.J.; Liu, Y.J.; Yang, H.J.; Yuan, Y.; Liu, F.J.; Tian, L.X.; Liang, G.Y.; Yuan, R.M. Effect of dietary oxidized fish oil on growth performance, body composition, antioxidant defence mechanism and liver histology of juvenile largemouth bass Micropterus salmoides. Aquac. Nutr. 2012, 18, 321–331. [Google Scholar] [CrossRef]
  41. Jasour, M.S.; Wagner, L.; Sundekilde, U.K.; Larsen, B.K.; Greco, I.; Orlien, V.; Olsen, K.; Rasmussen, H.T.; Hjermitslev, N.H.; Hammershøj, M.; et al. A comprehensive approach to assess feathermeal as an alternative protein source in aquafeed. J. Agric. Food Chem. 2017, 65, 10673–10684. [Google Scholar] [CrossRef] [PubMed]
  42. Cottrell, R.S.; Blanchard, J.L.; Halpern, B.S.; Metian, M.; Froehlich, H.E. Global adoption of novel aquaculture feeds could substantially reduce forage fish demand by 2030. Nat. Food 2020, 1, 301–308. [Google Scholar] [CrossRef]
  43. Belghit, I.; Liland, N.S.; Waagbø, R.; Biancarosa, I.; Pelusio, N.; Li, Y.; Krogdahl, Å.; Lock, E.-J. Potential of insect-based diets for Atlantic salmon (Salmo salar). Aquaculture 2018, 491, 72–81. [Google Scholar] [CrossRef]
  44. Fisher, H.J.; Collins, S.A.; Hanson, C.; Mason, B.; Colombo, S.M.; Anderson, D.M. Black soldier fly larvae meal as a protein source in low fish meal diets for Atlantic salmon (Salmo salar). Aquaculture 2020, 521, 734978. [Google Scholar] [CrossRef]
  45. Belghit, I.; Waagbø, R.; Lock, E.-J.; Liland, N.S. Insect-based diets high in lauric acid reduce liver lipids in freshwater Atlantic salmon. Aquac. Nutr. 2019, 25, 343–357. [Google Scholar] [CrossRef] [Green Version]
  46. Kousoulaki, K.; Mørkøre, T.; Nengas, I.; Berge, R.K.; Sweetman, J. Microalgae and organic minerals enhance lipid retention efficiency and fillet quality in Atlantic salmon (Salmo salar L.). Aquaculture 2016, 451, 47–57. [Google Scholar] [CrossRef]
  47. Gong, Y.; Bandara, T.; Huntley, M.; Johnson, Z.I.; Dias, J.; Dahle, D.; Sørensen, M.; Kiron, V. Microalgae Scenedesmus sp. as a potential ingredient in low fishmeal diets for Atlantic salmon (Salmo salar L.). Aquaculture 2019, 501, 455–464. [Google Scholar] [CrossRef]
  48. Gong, Y.; Sørensen, S.L.; Dahle, D.; Nadanasabesan, N.; Dias, J.; Valente, L.M.P.; Sørensen, M.; Kiron, V. Approaches to improve utilization of Nannochloropsis oceanica in plant-based feeds for Atlantic salmon. Aquaculture 2020, 522, 735122. [Google Scholar] [CrossRef]
  49. Einen, O.; Roem, A.J. Dietary protein/energy ratios for Atlantic salmon in relation to fish size: Growth, feed utilization and slaughter quality. Aquac. Nutr. 1997, 3, 115–126. [Google Scholar] [CrossRef]
  50. Shearer, K.D. Factors affecting the proximate composition of cultured fishes with emphasis on salmonids. Aquaculture 1994, 119, 63–88. [Google Scholar] [CrossRef]
  51. Dallaire, V.; Lessard, P.; Vandenberg, G.; de la Noüe, J. Effect of algal incorporation on growth, survival and carcass composition of rainbow trout (Oncorhynchus mykiss) fry. Bioresour. Technol. 2007, 98, 1433–1439. [Google Scholar] [CrossRef]
  52. Mustafa, G.; Wakamatsu, S.; Takeda, T.-a.; Umino, T.; Nakagawa, H. Effects of algae meal as feed additive on growth, feed efficiency, and body composition in red sea bream. Fish. Sci. 1995, 61, 25–28. [Google Scholar] [CrossRef] [Green Version]
  53. Papadopoulos, M.C. Effect of processing on high-protein feedstuffs: A review. Biol.Wastes 1989, 29, 123–138. [Google Scholar] [CrossRef]
  54. Pickford, J.R. Effects of processing on the stability of heat labile nutrients in animal feeds. In Recent Advances in Animal Nutrition; Garnsworthy, P.C., Haresign, W., Cole, D.J.A., Eds.; Redwood Press: Melksham, UK, 1992; Available online: https://agris.fao.org/agris-search/search.do?recordID=US201301481830 (accessed on 22 January 2021).
  55. Bender, A.E. Food Processing and Nutrition; Academic Press Inc. (London) Ltd.: London, UK, 1978; p. 243. Available online: http://saspjournals.com/wp-content/uploads/2015/08/SJAVS-24A304-311.pdf (accessed on 20 February 2021).
  56. Deng, D.-F.; Hemre, G.-I.; Storebakken, T.; Shiau, S.-Y.; Hung, S.S.O. Utilization of diets with hydrolyzed potato starch, or glucose by juvenile white sturgeon (Acipenser transmontanus), as affected by Maillard reaction during feed processing. Aquaculture 2005, 248, 103–109. [Google Scholar] [CrossRef] [Green Version]
  57. Opstvedt, J.; Miller, R.; Hardy, R.W.; Spinelli, J. Heat-induced changes in sulfhydryl groups and disulfide bonds in fish protein and their effect on protein and amino acid digestibility in rainbow trout (Salmo gairdneri). J. Agric. Food Chem. 1984, 32, 929–935. [Google Scholar] [CrossRef]
  58. Andorsdòttir, G. Protein Quality, Methionine Supplementation and Fat Levels in Starter Diets for Salmon Fry. Ph.D. Thesis, University of Oslo, Oslo, Norway, 1985. [Google Scholar]
  59. Ljøkjel, K.; Sørensen, M.; Storebakken, T.; Skrede, A. Digestibility of protein, amino acids and starch in mink (Mustela vison) fed diets processed by different extrusion conditions. Can. J. Anim. Sci. 2004, 84, 673–680. [Google Scholar] [CrossRef] [Green Version]
  60. Ljøkjel, K.; Harstad, O.M.; Skrede, A. Effect of heat treatment of soybean meal and fish meal on amino acid digestibility in mink and dairy cows. Anim. Feed Sci. Technol. 2000, 84, 83–95. [Google Scholar] [CrossRef]
  61. Hurrell, R.F. Reactions of food proteins during processing and storage and their nutritional consequences. In Developments in Food Proteins—3; Hudson, B.J.F., Ed.; Elsevier: London, UK, 1984; pp. 213–244. Available online: https://agris.fao.org/agris-search/search.do?recordID=US201302567346 (accessed on 15 January 2021).
  62. Sissener, N.H. Are we what we eat? Changes to the feed fatty acid composition of farmed salmon and its effects through the food chain. J. Exp. Biol. 2018, 221, jeb161521. [Google Scholar] [CrossRef] [Green Version]
  63. Sprague, M.; Dick, J.R.; Tocher, D.R. Impact of sustainable feeds on omega-3 long-chain fatty acid levels in farmed Atlantic salmon, 2006–2015. Sci. Rep. 2016, 6, 21892. [Google Scholar] [CrossRef] [Green Version]
  64. Teimouri, M.; Yeganeh, S.; Amirkolaie, A.K. The effects of Spirulina platensis meal on proximate composition, fatty acid profile and lipid peroxidation of rainbow trout (Oncorhynchus mykiss) muscle. Aquac. Nutr. 2016, 22, 559–566. [Google Scholar] [CrossRef]
  65. Mizambwa, H.E. Effects of Replacing Fish Oil with Microalgae Biomass (Schizochytrium spp.) as a Source of n-3 LC-PUFA to Atlantic salmon (Salmo salar) on Growth Performance, Fillet Quality and Fatty Acid Composition. Master’s Thesis, Norwegian University of Life Sciences, Ås, Norway, 2017. [Google Scholar]
  66. Walker, A.B.; Berlinsky, D.L. Effects of partial replacement of fish meal protein by microalgae on growth, feed intake, and body composition of Atlantic cod. N. Am. J. Aquac. 2011, 73, 76–83. [Google Scholar] [CrossRef]
  67. Baeverfjord, G.; Krogdahl, A. Development and regression of soybean meal induced enteritis in Atlantic salmon, Salmo salar L., distal intestine: A comparison with the intestines of fasted fish. J. Fish. Dis. 1996, 19, 375–387. [Google Scholar] [CrossRef]
  68. Sørensen, S.L.; Park, Y.; Gong, Y.; Vasanth, G.K.; Dahle, D.; Korsnes, K.; Phuong, T.H.; Kiron, V.; Øyen, S.; Pittman, K.; et al. Nutrient digestibility, growth, mucosal barrier status, and activity of leucocytes from head kidney of Atlantic salmon fed marine- or plant-derived protein and lipid sources. Front. Immunol. 2021, 11. [Google Scholar] [CrossRef] [PubMed]
  69. Bou, M.; Berge, G.M.; Baeverfjord, G.; Sigholt, T.; Østbye, T.-K.; Romarheim, O.H.; Hatlen, B.; Leeuwis, R.; Venegas, C.; Ruyter, B. Requirements of n-3 very long-chain PUFA in Atlantic salmon (Salmo salar L.): Effects of different dietary levels of EPA and DHA on fish performance and tissue composition and integrity. Br. J. Nutr. 2017, 117, 30–47. [Google Scholar] [CrossRef] [PubMed] [Green Version]
  70. Benoit, B.; Bruno, J.; Kayal, F.; Estienne, M.; Debard, C.; Ducroc, R.; Plaisancié, P. Saturated and unsaturated fatty acids differently modulate colonic goblet cells in vitro and in rat pups. J. Nutr. 2015, 145, 1754–1762. [Google Scholar] [CrossRef] [PubMed] [Green Version]
  71. Messina, M.; Bulfon, C.; Beraldo, P.; Tibaldi, E.; Cardinaletti, G. Intestinal morpho-physiology and innate immune status of European sea bass (Dicentrarchus labrax) in response to diets including a blend of two marine microalgae, Tisochrysis lutea and Tetraselmis suecica. Aquaculture 2019, 500, 660–669. [Google Scholar] [CrossRef]
  72. Cerezuela, R.; Fumanal, M.; Tapia-Paniagua, S.T.; Meseguer, J.; Moriñigo, M.Á.; Esteban, M.Á. Histological alterations and microbial ecology of the intestine in gilthead seabream (Sparus aurata L.) fed dietary probiotics and microalgae. Cell Tissue Res. 2012, 350, 477–489. [Google Scholar] [CrossRef] [PubMed]
  73. Kousoulaki, K.; Berge, G.M.; Mørkøre, T.; Krasnov, A.; Baeverfjord, G.; Ytrestøyl, T.; Carlehög, M.; Sweetman, J.; Ruyter, B. Microalgal Schizochytrium limacinum biomass improves growth and filet quality when used long-term as a replacement for fish oil, in modern salmon diets. Front. Mar. Sci. 2020, 7. [Google Scholar] [CrossRef]
  74. Maradonna, F.; Nozzi, V.; Santangeli, S.; Traversi, I.; Gallo, P.; Fattore, E.; Mita, D.G.; Mandich, A.; Carnevali, O. Xenobiotic-contaminated diets affect hepatic lipid metabolism: Implications for liver steatosis in Sparus aurata juveniles. Aquat. Toxicol. 2015, 167, 257–264. [Google Scholar] [CrossRef]
  75. Marcon, L.; Bazzoli, N.; Honor Mounteer, A.; Anjos Benjamin, L.D. Histological and histometric evaluation of the liver in Astyanax bimaculatus (Teleostei: Characidae), exposed to different concentrations of an organochlorine insecticide. Anat. Rec. 2015, 298, 1754–1764. [Google Scholar] [CrossRef] [Green Version]
  76. Vizcaíno, A.J.; Fumanal, M.; Sáez, M.I.; Martínez, T.F.; Moriñigo, M.A.; Fernández-Díaz, C.; Anguis, V.; Balebona, M.C.; Alarcón, F.J. Evaluation of Ulva ohnoi as functional dietary ingredient in juvenile Senegalese sole (Solea senegalensis): Effects on the structure and functionality of the intestinal mucosa. Algal Res. 2019, 42, 101608. [Google Scholar] [CrossRef]
  77. Skalli, A.; Firmino, J.P.; Andree, K.B.; Salomón, R.; Estévez, A.; Puig, P.; Sabater-Martínez, M.; Hechavarria, T.; Gisbert, E. The inclusion of the microalga Scenedesmus sp. in diets for rainbow trout, Onchorhynchus mykiss, juveniles. Animals 2020, 10, 1656. [Google Scholar] [CrossRef] [PubMed]
  78. Jasour, M.S.; Wagner, L.; Sundekilde, U.K.; Larsen, B.K.; Rasmussen, H.T.; Hjermitslev, N.H.; Hammershøj, M.; Dalsgaard, A.J.T.; Dalsgaard, T.K. Fishmeal with different levels of biogenic amines in aquafeed: Comparison of feed protein quality, fish growth performance, and metabolism. Aquaculture 2018, 488, 80–89. [Google Scholar] [CrossRef]
  79. Caballero, M.J.; Obach, A.; Rosenlund, G.; Montero, D.; Gisvold, M.; Izquierdo, M.S. Impact of different dietary lipid sources on growth, lipid digestibility, tissue fatty acid composition and histology of rainbow trout, Oncorhynchus mykiss. Aquaculture 2002, 214, 253–271. [Google Scholar] [CrossRef]
  80. Tao, Y.-F.; Qiang, J.; Bao, J.-W.; Chen, D.-J.; Yin, G.-J.; Xu, P.; Zhu, H.-J. Changes in physiological parameters, lipid metabolism, and expression of microRNAs in Genetically Improved Farmed Tilapia (Oreochromis niloticus) with fatty liver induced by a high-fat diet. Front. Physiol. 2018, 9, 1521. [Google Scholar] [CrossRef] [PubMed] [Green Version]
  81. Aliakbarpour, H.R.; Chamani, M.; Rahimi, G.; Sadeghi, A.A.; Qujeq, D. The Bacillus subtilis and lactic acid bacteria probiotics influences intestinal mucin gene expression, histomorphology and growth performance in broilers. Asian-Australas. J. Anim. Sci. 2012, 25, 1285–1293. [Google Scholar] [CrossRef] [PubMed] [Green Version]
  82. Sayed, A.E.H.; Authman, M.M.N. The protective role of Spirulina platensis to alleviate the sodium dodecyl sulfate toxic effects in the catfish Clarias gariepinus (Burchell, 1822). Ecotoxicol. Environ. Saf. 2018, 163, 136–144. [Google Scholar] [CrossRef] [PubMed]
  83. Zahran, E.; Risha, E. Modulatory role of dietary Chlorella vulgaris powder against arsenic-induced immunotoxicity and oxidative stress in Nile tilapia (Oreochromis niloticus). Fish. Shellfish Immunol. 2014, 41, 654–662. [Google Scholar] [CrossRef]
  84. Perlemuter, G.; Davit-Spraul, A.; Cosson, C.; Conti, M.; Bigorgne, A.; Paradis, V.; Corre, M.-P.; Prat, L.; Kuoch, V.; Basdevant, A.; et al. Increase in liver antioxidant enzyme activities in non-alcoholic fatty liver disease. Liver Int. 2005, 25, 946–953. [Google Scholar] [CrossRef] [PubMed]
  85. Tsuru, H.; Osaka, M.; Hiraoka, Y.; Yoshida, M. HFD-induced hepatic lipid accumulation and inflammation are decreased in Factor D deficient mouse. Sci. Rep. 2020, 10, 17593. [Google Scholar] [CrossRef]
  86. Vorup-Jensen, T.; Jensen, R.K. Structural immunology of complement receptors 3 and 4. Front. Immunol. 2018, 9. [Google Scholar] [CrossRef] [Green Version]
  87. Storebakken, T.; Sørensen, M.; Bjerkeng, B.; Harris, J.; Monahan, P.; Hiu, S. Stability of astaxanthin from red yeast, Xanthophyllomyces dendrorhous, during feed processing: Effects of enzymatic cell wall disruption and extrusion temperature. Aquaculture 2004, 231, 489–500. [Google Scholar] [CrossRef]
  88. Martínez-Yusta, A.; Goicoechea, E.; Guillén, M.D. A review of thermo-oxidative degradation of food lipids studied by 1H NMR spectroscopy: Influence of degradative conditions and food lipid nature. Compr. Rev. Food Sci. Food Saf. 2014, 13, 838–859. [Google Scholar] [CrossRef]
  89. Shahidi, F. Headspace volatile aldehydes as indicators of lipid oxidation in foods. In Headspace Analysis of Foods and Flavors: Theory and Practice; Rouseff, R.L., Cadwallader, K.R., Eds.; Springer: Boston, MA, USA, 2001; pp. 113–123. [Google Scholar] [CrossRef]
  90. Riaz, M.N.; Rokey, G.J. (Eds.) Impact of particle size and other ingredients on extruded foods and feeds. In Extrusion Problems Solved; Woodhead Publishing: Cambridge, UK, 2012; pp. 55–63. [Google Scholar] [CrossRef]
  91. Paraman, I.; Wagner, M.E.; Rizvi, S.S.H. Micronutrient and protein-fortified whole grain puffed rice made by supercritical fluid extrusion. J. Agric. Food Chem. 2012, 60, 11188–11194. [Google Scholar] [CrossRef] [PubMed]
  92. Standard Norge. Atlantic Salmon Measurement of Colour and Fat. NS9401/9402. 1994, p. 5. Available online: https://www.standard.no/no/nettbutikk/produktkatalogen/produktpresentasjon/?ProductID=135397 (accessed on 3 February 2021).
  93. Bligh, E.G.; Dyer, W.J. A rapid method of total lipid extraction and purification. Can. J. Biochem. Physiol. 1959, 37, 911–917. [Google Scholar] [CrossRef] [PubMed] [Green Version]
  94. Metcalfe, L.D.; Schmitz, A.A.; Pelka, J.R. Rapid preparation of fatty acid esters from lipids for gas chromatographic analysis. Anal. Chem. 1966, 38, 514–515. [Google Scholar] [CrossRef]
  95. Vandesompele, J.; De Preter, K.; Pattyn, F.; Poppe, B.; Van Roy, N.; De Paepe, A.; Speleman, F. Accurate normalization of real-time quantitative RT-PCR data by geometric averaging of multiple internal control genes. Genome Biol. 2002, 3. [Google Scholar] [CrossRef] [PubMed] [Green Version]
Figure 1. Relative expression of muc2 in the distal intestine of Atlantic salmon fed on different diets (CO, NU, NE, TU, TE) (n = 4 per diet).
Fishes 06 00023 g001
Figure 2. Relative expression of antioxidant and immune-related genes. Shown are the expression of sod1, gpx and cr3 in the distal intestine of Atlantic salmon fed on different diets (CO, NU, NE, TU, TE) (n = 4 per diet).
Fishes 06 00023 g002
Figure 3. Relative expression of antioxidant and immune-related genes. Shown are the expression of sod1, gpx, cat, nrf2 and cr3 in the liver of Atlantic salmon fed on different diets (CO, NU, NE, TU, TE) (n = 4 per diet). Different letters (a, b) above the bars indicate significant differences (p < 0.05).
Fishes 06 00023 g003
Table 1. Volatile oxidation products (ng/g) in feeds.
Diet GroupsCONUNETUTE
VOCs
SUM LMW Amines790694722595657
Propanal562712
Propanal, 2-methyl-2749963345
2-Propenal03922
Butanal1833373339
Butanal, 2-methyl-53101472102
Butanal, 3-methyl-310651406372550
1-Penten-3-one3338623135
2-Butenal733771316
Hexanal511071164877
2-Pentenal, (E)-1632981634
1-Penten-3-ol307428678244580
2-Hexenal, (E)-4380723682
2-Penten-1-ol, (E)-135571895170
Table 2. Initial, final weight and specific growth rate of Atlantic salmon fed one of the five experimental diets for 9 weeks.
Growth IndicesCONUNETUTE
IBW(g)154.4 ± 0.1154.0 ± 0.1153.9 ± 0.3154.4 ± 0.2154.3 ± 0.2
FBW (g)307.8 ± 1.6 a288.9 ± 5.0 b292.9 ± 1.7 ab282.9 ± 3.4 b285.1 ± 3.6 b
WG (%)99.4 ± 2.0 a87.6 ± 6.3 b90.3 ± 3.0 ab83.3 ± 4.3 b84.8 ± 4.8 b
SGR (% day−1)1.15 ± 0.01 a1.05 ± 0.03 b1.07 ± 0.01 ab1.01 ± 0.02 b1.02 ± 0.02 b
Tanks were the experimental units (n = 4 replicates). Values are expressed as mean ± sem. Values in the same row with different superscript letters (a, b) show significant differences (p < 0.05). CO: Control fishmeal-based diet, NU: Nannochloropsis, NE: Nannochloropsis pre-extruded, TU: Tetraselmis, TE: Tetraselmis pre-extruded. IBW, Initial body weight; FBW, Final body weight; WG, Weight gain; SGR, Specific growth rate.
Table 3. Whole body proximate composition (%) of fish from the different experimental groups.
ParameterCONUNETUTE
Dry matter (g/kg)28.8 ± 0.09 a28.8 ± 0.19 ac29.6 ± 0.11 b29.3 ± 0.16 abc29.6 ± 0.28 bc
Dry matter (%)
Protein62.6 ± 0.42 a61.1 ± 0.45 abc60.4 ± 0.29 bc61.4 ± 0.6 ac59.6 ± 0.43 b
Lipid32.5 ± 0.54 ab31.7 ± 0.53 a32.0 ± 0.3 a32.0 ± 0.57 a35.0 ± 0.54 b
Ash6.8 ± 0.09 ab7.0 ± 0.13 a7.0 ± 0.21 ab6.1 ± 0.2 bc5.6 ± 0.05 c
Energy25.6 ± 0.07 a25.6 ± 0.02 a25.6 ± 0.06 a26.1 ± 0.11 b26.3 ± 0.13 b
Values are expressed as mean ± sem (n = 4 replicates). Values in the same row with different superscript letters (a, b, c) indicate significant differences (p < 0.05).
Table 4. Content of fatty acids (% of lipid) in the fillets of fish fed the experimental diets for 9 weeks.
Diet GroupsCONUNETUTE
Fatty Acids
C14:03.1 ± 0.04 ab3.1 ± 0.02 b3.3 ± 0.01 a3.4 ± 0.4 b3.1 ± 0.02 b
C16:013.0 ± 0.18 a13.0 ± 0.13 a14.5 ± 0.26 b12.5 ± 0.67 a13.8 ± 0.23 ab
C18:02.9 ± 0.05 a2.8 ± 0.05 ab2.9 ± 0.05 a2.7 ± 0.07 b2.9 ± 0.05 ab
∑SFA19.0 ± 0.24 a18.8 ± 0.15 a20.7 ± 0.31 b17.98 ± 0.94 a19.70 ± 0.27 ab
C16:13.4 ± 0.01 ab4.0 ± 0.04 ac4.6 ± 0.05 c3.2 ± 0.03 b3.4 ± 0.07 ab
C18:1n-921.4 ± 0.51 ab22.8 ± 0.2 b20.6 ± 0.39 a19.5 ± 1.67 a22.7 ± 0.22 b
C18:1n-72.8 ± 0.01 ab2.9 ± 0.02 b2.7 ± 0.02 a2.7 ± 0.04 a2.7 ± 0.01 a
C20:1n-93.8 ± 0.15 a4.3± 0.02 b3.9 ± 0.09 a4.0 ± 0.04 a4.1 ± 0.06 ab
C22:1n-93.8 ± 0.02 a4.3 ± 0.03 b3.9 ± 0.04 abc3.8 ± 0.07 ac3.9 ± 0.01 bc
∑ MUFA35.1 ± 0.56 ab38.3 ± 0.23 c35.7 ± 0.38 ab29.8 ± 5.08 b36.9 ± 0.20 ac
C18:2n-66.8 ± 0.19 a7.7 ± 0.15 b7.1 ± 0.15 a6.8 ± 0.33 a7.3 ± 0.12 ab
C18:3n-32.3 ± 0.20 ab2.3 ± 0.08 ab2.1 ± 0.06 a2.8 ± 0.05 bc3.2 ± 0.17 c
C18:4n-34.4 ± 0.28 a1.3 ± 0.01 b1.2 ± 0.03 b1.4 ± 0.02 ab4.1 ± 0.11 a
C20:4n-31.1 ± 0.05 abc1.0 ± 0.00 ab1.0 ± 0.01 a1.3 ± 0.03 bc1.3 ± 0.01 c
C20:5n-34.9 ± 0.62 a5.4 ± 0.25 ab6.5 ± 0.16 b4.9 ± 0.40 a5.2 ± 0.08 a
C22:5n-31.5 ± 0.09 a1.1 ± 0.07 b1.2 ± 0.06 b2.2± 1.03 ab1.2 ± 0.09 ab
C22:6n-321.4 ± 0.51 ab22.8 ± 0.22 b20.6 ± 0.39 a19.5 ± 1.67 a22.7 ± 0.22 b
∑ PUFA34.2 ± 4.7734.1 ± 0.2529.9 ± 3.9534.4± 0.9133.1 ± 3.97
∑ n-6FA6.8 ± 0.19 a7.7 ± 0.15 b7.1 ± 0.15 a6.8 ± 0.33 a7.4 ± 0.12 ab
∑ n-3FA27.4 ± 4.59 a26.3 ± 0.18 b22.9 ± 4.03 ab27.6 ± 0.65 ab25.8 ± 3.87 ab
∑ EPA+DHA18.6 ± 4.30 a20.8 ± 0.11 ab17.6 ± 3.71 ab21.3 ± 0.50 a16.0 ± 3.55 b
∑ n-6/n-30.28 ± 0.06 a0.29 ± 0.01 b0.36 ± 0.10 ab0.24 ± 0.01 a0.31 ± 0.06 ab
Values are expressed as mean ± sem (n = 4 replicates). Values in the same row with different superscript letters (a, b, c) indicate significant differences (p < 0.05). SFA—Saturated fatty acids; MUFA—monounsaturated fatty acids; PUFA—polyunsaturated fatty acids; n-6—omega-6 polyunsaturated fatty acids; n-3—omega-3 polyunsaturated fatty acids; EPA + DHA—Eicosapentaenoic acid and Docosahexaenoic acid; n-6/n-3—ratio of n-6 PUFA/n-3 PUFA.
Table 5. Ingredient composition, analyzed chemical composition and energy of the experimental diets.
Diet GroupsCONUNETUTE
Ingredients (%)
Fishmeal LT70 152.036.436.436.436.4
Nannochloropsis 2 30.0
Nannochloropsis (pre-extruded) 2 30.0
Tetraselmis2 30.0
Tetraselmis (pre-extruded) 2 30.0
Wheat gluten 315.010.510.510.510.5
Wheat meal 48.4805.9365.9365.9365.936
Pea starch6.04.24.24.24.2
Fish oil 517.5012.2512.2512.2512.25
Vitamin Mineral Premix PV01 61.00.70.70.70.7
Proximate composition (g/100 g)
Dry matter (DM)92.692.591.993.490.4
Per 100 g DM
Protein52.447.047.044.845.3
Lipid20.918.418.816.017.5
Ash8.717.216.916.616.1
Carbohydrates18.017.417.322.621.1
Energy (MJ/1000 g)23.421.521.720.721.2
1 NORVIK 70, Sopropeche, France, 2 Allmicroalgae—Natural Products, Portugal, Values are expressed as mean ± SD (n = 4 replicates), 3 ROQUETTE Frères, France, 4 Casa Lanchinha, Portugal, 5 SAVINOR UTS, Portugal, 6 PREMIX Lda, Portugal.
Table 6. Primer sequences, amplicon size, PCR efficiency and accession numbers for the target genes and reference genes involved in this study.
Gene NamePrimer SequenceAmplicon Size (bp)PCR Efficiency (%)Accession #
(UniProt/GenBank)
Target genes
muc2(.1/2)GAGTGGGCTCTCAGATCCAG-F9996.8XM_014184683.1/XM_014170386.1
GATGATGCGGACGGTAGTTT-R
muc5ac1GACCTGCTCTGTGGAAGGAG-F12096.7XM_014127075.1
AGCACGGTGAATTCAGTTCC-R
muc5ac2 (/4)TTTTCTCAGTTGCCGCTTTT-F9298.9-99.8XM_014182329.1
AGTCGGAGCCCATAAGAGGT-R
muc5bATTAAGAGCGATGTCTTCACAGC-F8597.4-102.4XM_014175874.1/XM_014126057.1
AAGCACATGAGTCTCTCACACAA-R
catCCGACCGTCCGTAAATGCTA-F14096.1BT045615.1
GCTTTTCAGATAGGCTCTTCATGTAA-R
gpxGCAATCAGTTCGGACATCAGG-F13191.1XM_014133872
GTCCTTCCCATTCACATCCAC-R
nrf2TCAACAGGACATCGACCTAAT-F8381.9BT059007.1
GGCAGTAGTCAAACACCTCT-R
sod1CCACGTCCATGCCTTTGG-F14194.1AY736282.1
TCAGCTGCTGCAGTCACGTT-R
cr3 (itgb2)ATGACATGGACTACCCATCTGTT-F151110.5BT058776.1
TCTGACAATACTCCCACCTCA-R
Reference genes
ef1abTGCCCCTCCAGGATGTCTAC-F59100.8BG933853
CACGGCCCACAGGTACTG-R
rpl13CGCTCCAAGCTCATCCTCTTCCC-F7994.0BT048949.1
CCATCTTGAGTTCCTCCTCAGTGC-R
rps29GGGTCATCAGCAGCTCTATTGG-F16791.1BT043522.1
AGTCCAGCTTAACAAAGCCGATG-R
ubiAGCTGGCCCAGAAGTACAACTGTG-F16291.1AB036060.1
CCACAAAAAGCACCAAGCCAAC-R
hprt1CCGCCTCAAGAGCTACTGTAAT-F25582.5BT043501
GTCTGGAACCTCAAACCCTATG-R
Publisher’s Note: MDPI stays neutral with regard to jurisdictional claims in published maps and institutional affiliations.

