Article

Intrinsic Smoke Properties and Prediction of Smoke Production in National Bureau of Standards (NBS) Smoke Chamber

Polymers Composites and Hybrids (PCH), IMT Mines Ales, 6 Avenue de Clavières, 30100 Ales, France
*
Author to whom correspondence should be addressed.
Fire 2023, 6(3), 109; https://doi.org/10.3390/fire6030109
Submission received: 7 February 2023 / Revised: 5 March 2023 / Accepted: 8 March 2023 / Published: 10 March 2023
(This article belongs to the Special Issue Compartment Fire and Safety)

Abstract

:
Smoke production in a smoke chamber is characterized by the accumulation of smoke and the continuous consumption of oxygen leading to a vitiated atmosphere. However, a method is proposed to predict the smoke evolution in a smoke chamber at 25 kW/m2 by using material properties calculated from a cone calorimeter, as already shown in a previous article. These properties represent the ability of a material to produce smoke at a specific mass loss rate. The influence of a flame retardant on these properties can be used as a quantitative measurement of its action on smoke production. These properties can be calculated at another heat flux than 25 kW/m2. The knowledge of the curve “mass loss rate = f(time)” in a smoke chamber is still required, but this curve is close to that measured in a cone calorimeter at the same heat flux. The results prove that the smoke production in a smoke chamber and cone calorimeter is qualitatively similar, i.e., the decrease of oxygen content in a smoke chamber has no influence on smoke (at least as long as optical density does not exceed 800).

1. Introduction

Many works have been devoted for a long time to smoke opacity because a huge amount of heavy and black smoke may delay the escape of people during a fire, increasing the time during which toxic gases are inhaled. It is well known that deaths are mainly due to smoke inhalation rather than burns during accidental building fires. Another concern motivating some studies is that the time needed to detect a fire using a smoke detector obviously depends on the smoke production [1].
Smoke opacity is usually assessed through light extinction measurements. The ratio between the transmitted and incident light intensities I/I0 is related to the concentration of soot M, the length of the light path l and a mass specific extinction coefficient σs, which is believed to be universal for well-ventilated flaming fires (Equation (1)). Its value is estimated to be around 8.7 m2/g [2]. Estimations of 5.3 m2/g have also been proposed for smoldering (flameless) fires [3].
I I 0 = e ( σ s × M × l )
The mass concentration of soot depends on the material under burning and test conditions, especially the heat flux. Flame retardants also have a great influence on soot formation mechanisms. This is well known for halogenated FRs, but Lyon et al. have recently shown that some phosphorus FRs promote soot formation [4].
However, the mass concentration over the burning time is not easy to measure even if developments now allow the sampling of the soot together with the measurement of light obscuration. Hong et al. have recently published a paper with a series of cone calorimeter tests with simultaneous gravimetric sampling and light extinction measurements (GSLE) performed on acrylonitrile butadiene styrene (ABS) and unplasticized polyvinyl chloride (UPVC) [1]. They found two different values for the mass-specific extinction coefficient for both polymers.
Another approach is to identify some correlations between the smoke production and other data, such as heat release or mass loss, without measuring the soot concentration. This approach has led to defining several smoke parameters. The smoke extinction area (SEA in m2/g) is defined as follows:
SEA = k × V MLR
With k being the light extinction coefficient, V the volume flow rate and MLR the mass loss rate.
Other parameters include the so-called smoke parameter, which is the product of the peak of heat release rate (pHRR) with the SEA and the smoke factor, which is the product of the pHRR and the total smoke production (TSP) [5,6].
Predicting the smoke production during a real large-scale burning from small-scale tests remains challenging and has motivated numerous studies for a long time. Based on the previously presented smoke parameters, Ostman et al., as well as Dietenberger and Grexa, have established some correlations between the full-scale room fire test and the cone calorimeter [7,8].
Despite that the NBS smoke chamber is devoted to the measurement of smoke production and has been widely used for a long time [9,10], the cone calorimeter was also claimed to be more suitable to illustrate the smoke release in large fires. Therefore, some studies have been dedicated to establishing correlations between both tests [11,12]. Cornelissen found some correlations between the specific extinction area in the cone calorimeter and in the smoke chamber for a narrow range of flooring materials tested at various heat fluxes. This correlation concerns only the peak value [12]. On the contrary, Hirschler concluded that the smoke results in the NBS chamber do not correlate with cone calorimeter ones [6]. Similarly, Flisi reviewed the main methods to assess smoke density [13]. He concluded that no correlations were found between different fire tests among the most used, including cone calorimeter and NBS smoke chamber. To the best of our knowledge, there is no satisfying method to correlate the cone calorimeter and smoke density chamber.
In a recent paper, in the line of previously cited works, we have plotted the rate of smoke release (RSR) versus the heat release rate (HRR) in the cone calorimeter [14]. Above an HRR threshold corresponding to the smoke point [15], the ratios of the heat release rate (HRR) and/or mass loss rate (MLR) over the rate of smoke release (RSR) are essentially constant over the whole burning period. These parameters were found to be closely related to the material composition. The ability to release smoke increases for polymers containing aromatic rings (as PBT) or halogens (in the backbone or as brominated FR) and decreases for polymers containing a high amount of oxygen (or nitrogen) atoms (as POM, PLA or PMMA). Oxygen-rich macromolecular structures are already partially oxidized, and their ability to form soot (i.e., almost pure carbon particles) is certainly lower. Indeed, these particles are formed from precursors involving carbon-rich polycyclic aromatic hydrocarbons. The parameters cited above were used to simulate the smoke production of different polymers in arbitrary (but well-ventilated) fire scenarios. Nevertheless, this possibility was not attempted for scenarios with smoke accumulation and oxygen depletion as in the smoke density chamber.
The present article aims to check if these smoke parameters allow the calculation of the optical density in the smoke chamber, i.e., if it is possible to correlate the smoke production in cone calorimeter tests (i.e., in a well-ventilated atmosphere, without smoke accumulation) and in smoke chamber tests (with smoke accumulation leading to an atmosphere more and more vitiated) during the whole burning period, and not only for the peak of extinction. This approach would be useful since the smoke density chamber is today the main test to assess the smoke production from a material at bench scale. Moreover, the cleaning of the chamber is often a long and harsh task limiting the number of tests that can be carried out in one day. A gain in time is expected if such a correlation is reliable. This last point is not a scientific consideration, but it is not without importance.

2. Materials and Methods

Five series of materials have been considered in this study. Series A gathers several pure polymers already studied in our previous article [14]. All their smoke properties are picked up from this article. Series B corresponds to Elium resin (Elium®188-O from Arkema, Colombes, France) filled with one ionic liquid (Tributyl(ethyl)phosphonium diethyl-phosphate from Solvionic, called IL169). Cone calorimeter tests were also performed at 50 kW/m2. Epoxy resins (DGEBA DER332 from Dow Chemical Company (Dow France, St-Denis, France) and Jeffamine D230 from Huntsman) filled with various amounts of the same ionic liquid constitute series C. The fire behavior of these formulations has already been studied [16]. Cone calorimeter tests were carried out at 35 kW/m2. Series D gathers 25/75 PE/EVA (Polyethylene and Ethylene vinyl acetate) materials filled with Aluminum hydroxide (ATH—Martinal OL104 from Huber-Martinswerk) and/or Magnesium hydroxide (MDH—FR20 from ICL-IP). Ethylene vinyl acetate (EVA Escorene UL00226CC from Exxon Mobil Chemicals, Leatherhead, UK) containing 26 wt% of vinyl acetate and polyethylene (LDPE PE-019) was provided by Repsol. These formulations were tested at 50 kW/m2 in cone calorimeter. Series E corresponds to Acrylonitrile butadiene styrene (ABS Terluran GP22 natural from Ineos) filled with two different flame retardants, namely Ammonium polyphosphate (APP Exolit AP422 from Clariant) and Decabromodiphenyloxide (DBDPO FR1210 from ICL-IP). Their smoke properties were also calculated from cone calorimeter tests performed at 50 kW/m2. ABS filled with 20 wt% of APP was also tested at 25 kW/m2.
PE/EVA and ABS compounds were extruded using a Clextral BC21 twin screw extruder at temperatures of 160 °C and 210 °C, respectively. Flame retardants were dried prior to extrusion to avoid vaporization of water at 100 °C and incorporated in the molten zone using a gravimetric feeder. The flow rate was 4 kg/h. To use the cone calorimeter, formulations needed to be injected. There were 10 × 10 × 0.4 cm3 plates obtained after injection molding using a 50-ton Krauss Maffei equipment.
Elium resins were prepared by mixing Elium resin®188-O, ionic liquid (IL169) and initiator (Perkadox GB-50X form Arkema), whose content has been set at 2.2% by mass relative to the mass of resin. The mixtures were stirred and poured into a mold in which they were left for 24 h. The resulting plates were then post-baked in an oven for 4 h at 80 °C.
Cone calorimeter tests were performed using an FTT (Fire Testing Technology) apparatus according to the standard ISO 5660 at various heat fluxes (most often 50 kW/m2). Ignition was piloted. Sample dimensions were 10 × 10 × 0.4 cm3. Materials were tested in duplicate.
Smoke chamber tests were carried out using an FTT NBS smoke density chamber according to standard ISO 5659 at 25 kW/m2 [17]. Ignition was piloted. The internal dimensions of the chamber were 914 mm × 914 mm × 610 mm. Sheets were 7.5 × 7.5 × 0.4 cm3. In one case, three sheets of POM were stacked to reach a higher sample mass and to evaluate how the consumption of a large amount of oxygen during the test may modify the smoke production. Note that our NBS smoke chamber is based on the same principle but also has some differences with the smoke chambers used in the articles previously reported and corresponding to the ASTM Method E 662 standard [10,12].

3. Results

The following section is divided into three parts. The first one is a reminder of the method used to calculate the intrinsic smoke properties. The second one provides some examples where intrinsic smoke properties allow assessing the effect of a flame retardant on smoke production. The last one is devoted to the prediction of smoke production in a smoke density chamber using these smoke properties calculated from a cone calorimeter.

3.1. Calculations of Intrinsic Smoke Properties

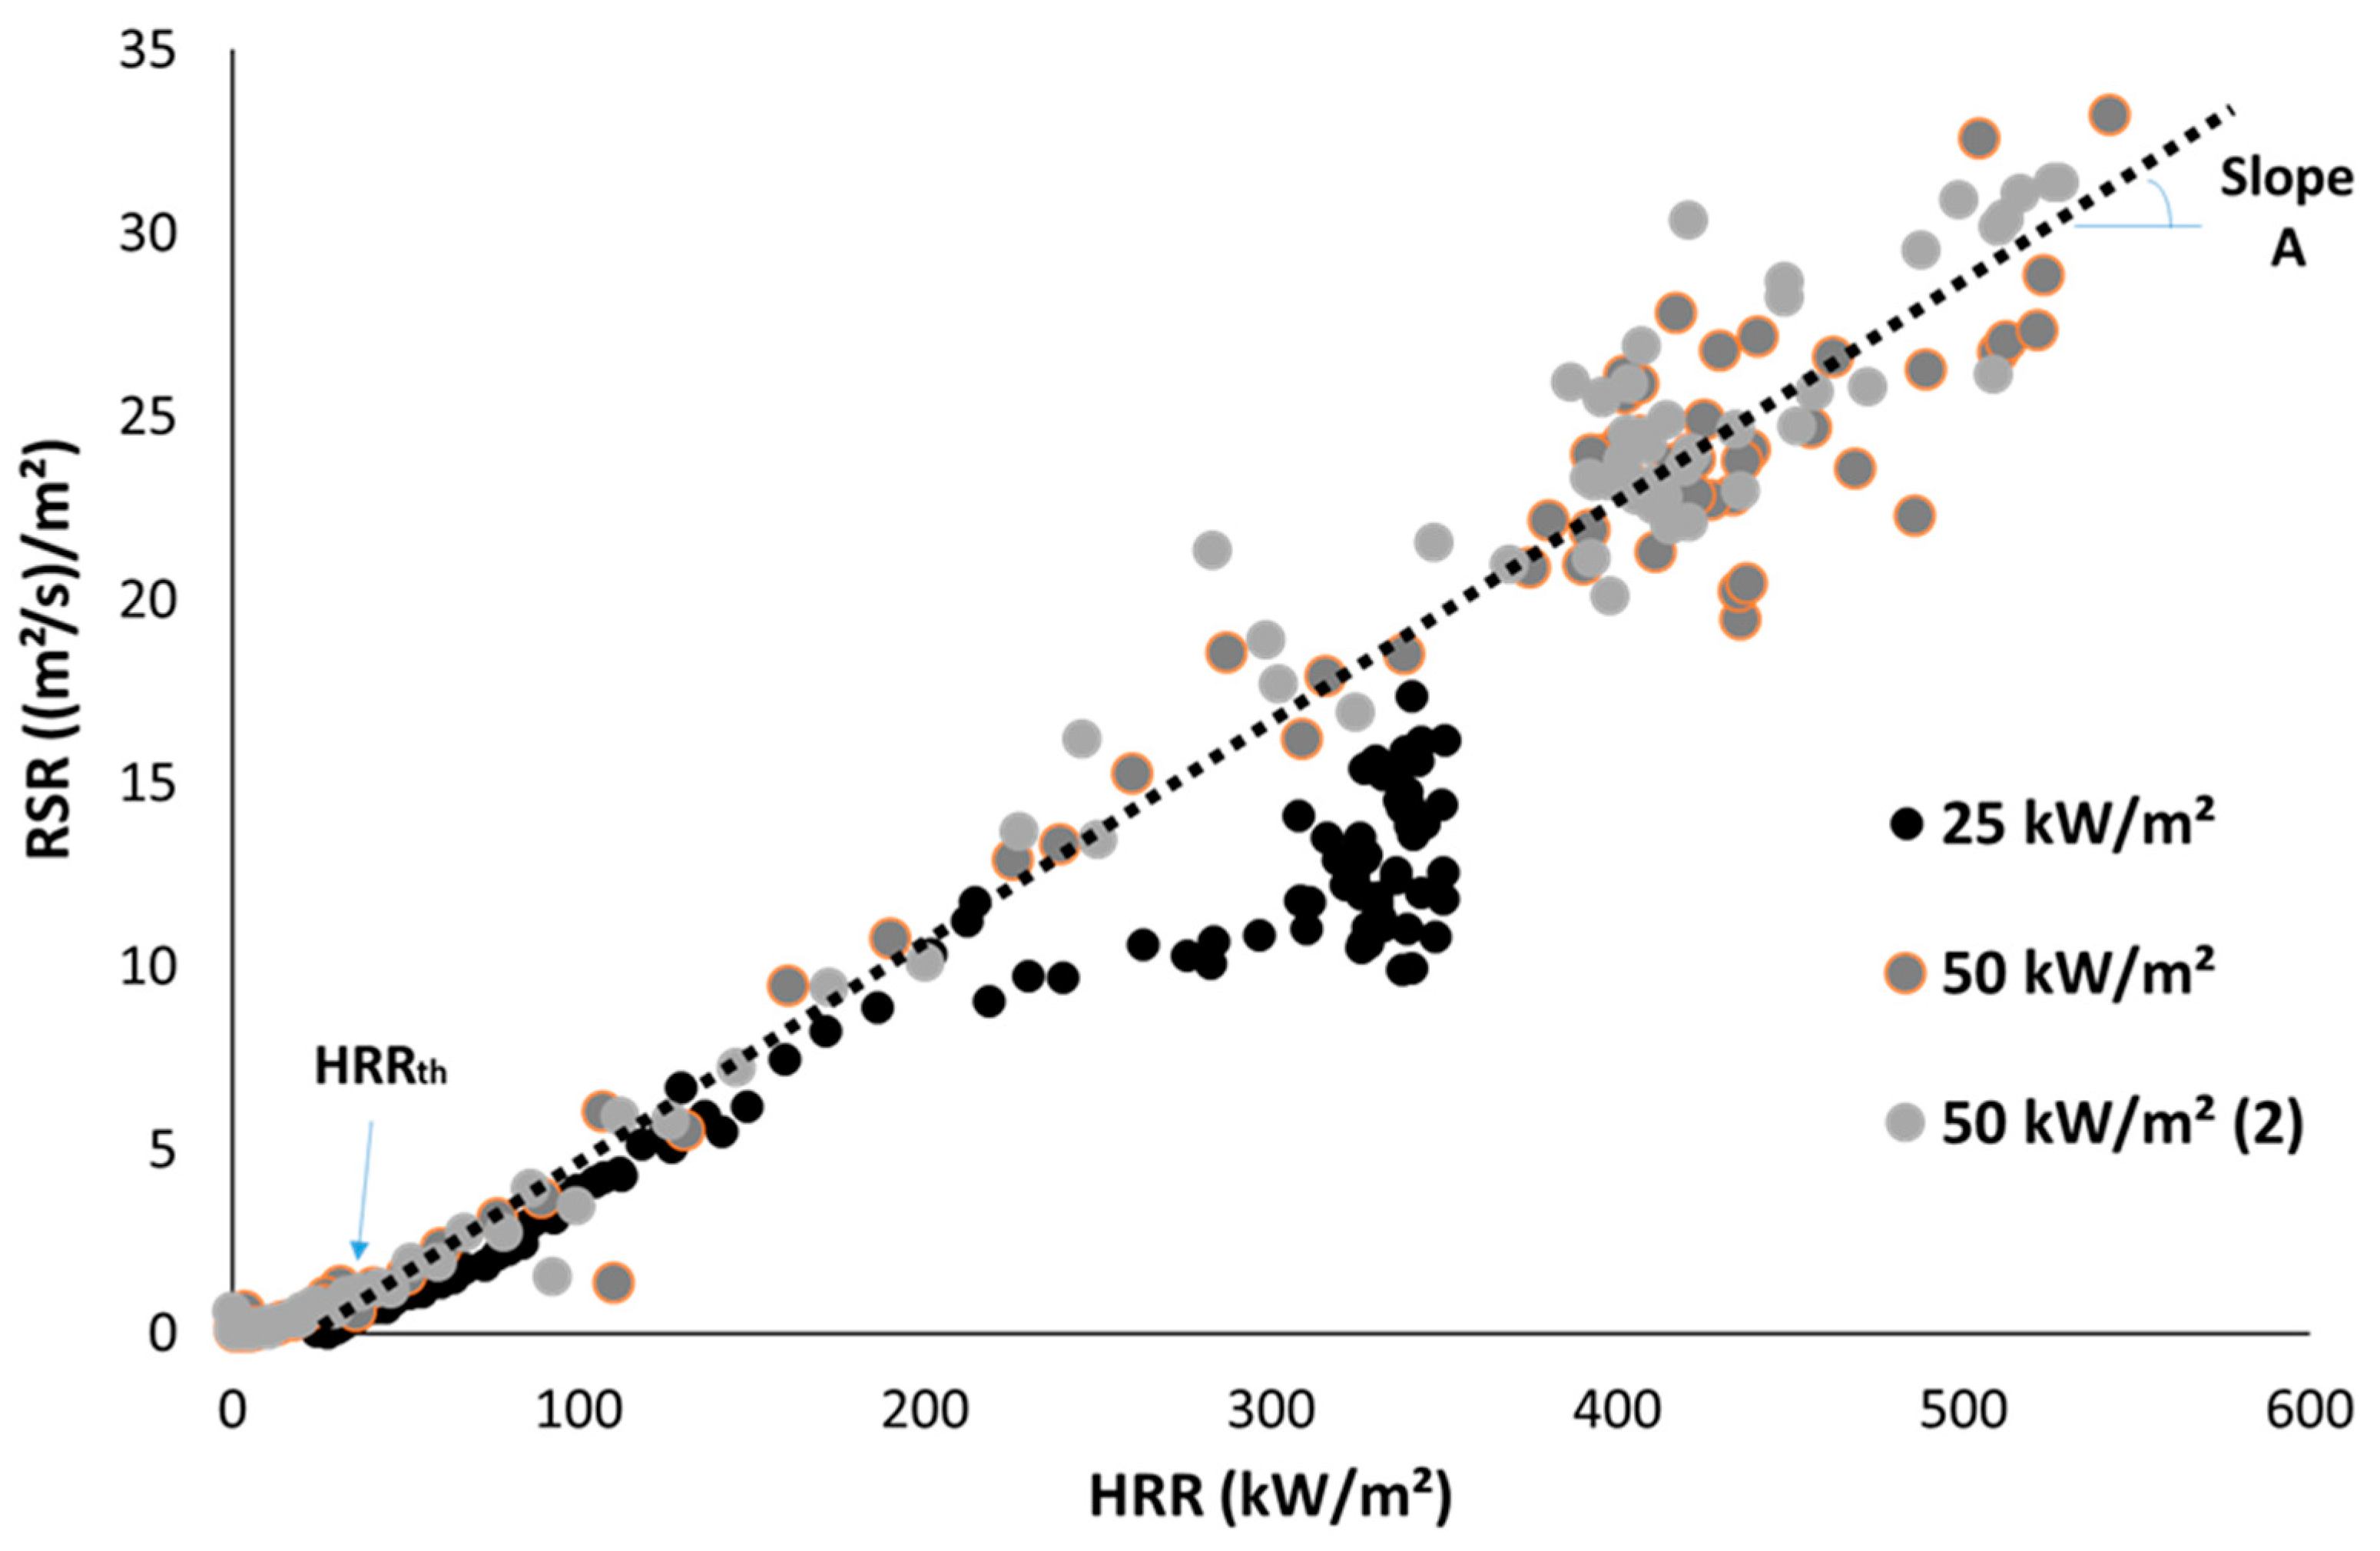
The cone calorimeter provides HRR and RSR curves. Plotting RSR versus HRR allows for calculating intrinsic smoke properties, regardless of the heat release (or decomposition) rate. Most often, a linear relationship may be found between RSR and HRR, mainly when HRR increases or decreases, as shown in Figure 1. When HRR is more or less constant, the data points are more scattered, as observed for the test performed at 25 kW/m2. It is noteworthy that the same relation is observed at 25 and 50 kW/m2, evidencing that it is not dependent on heat flux. Testing materials at higher heat flux allows for reaching higher HRR and RSR, and then calculating the smoke properties more accurately.
From the linear part of the curve RSR = f(HRR), two parameters can be calculated. The first one is called A (m2/kJ) and represents the increase in RSR per HRR unit. The second one is called HRRth, i.e., HRR threshold, and represents the minimum value of HRR for which RSR starts to increase. RSR is defined from HRR using Equation (3).
{ When   HRR < HRR th ,   RSR = 0 When   HRR > HRR th ,     RSR = A × ( HRR HRR th )
HRR and MLR are in close relation through Equation (4).
HRR = EHC × MLR
With EHC, the effective heat of combustion (in kJ/g).
Then, Equation (3) becomes Equation (5) by replacing HRR per MLR. A second parameter B is defined in m2/g. B is nothing less than the smoke extinction area (SEA).
{ When   MLR < MLR th ,   RSR = 0 When   MLR > MLR th ,     RSR = B × ( MLR MLR th ) HRR th = EHC × MLR th A = B EHC
A, B, HRRth and MLRth are considered intrinsic smoke properties. More details can be found in our previous article [14]. From a practical point of view, the values of HRRth and MLRth are less accurate and reliable. Therefore, the discussion will focus on A and B values. HRRth and MLRth will be considered only in the last section when smoke production in the smoke density chamber will be studied.

3.2. Assessment of FR on Smoke Production

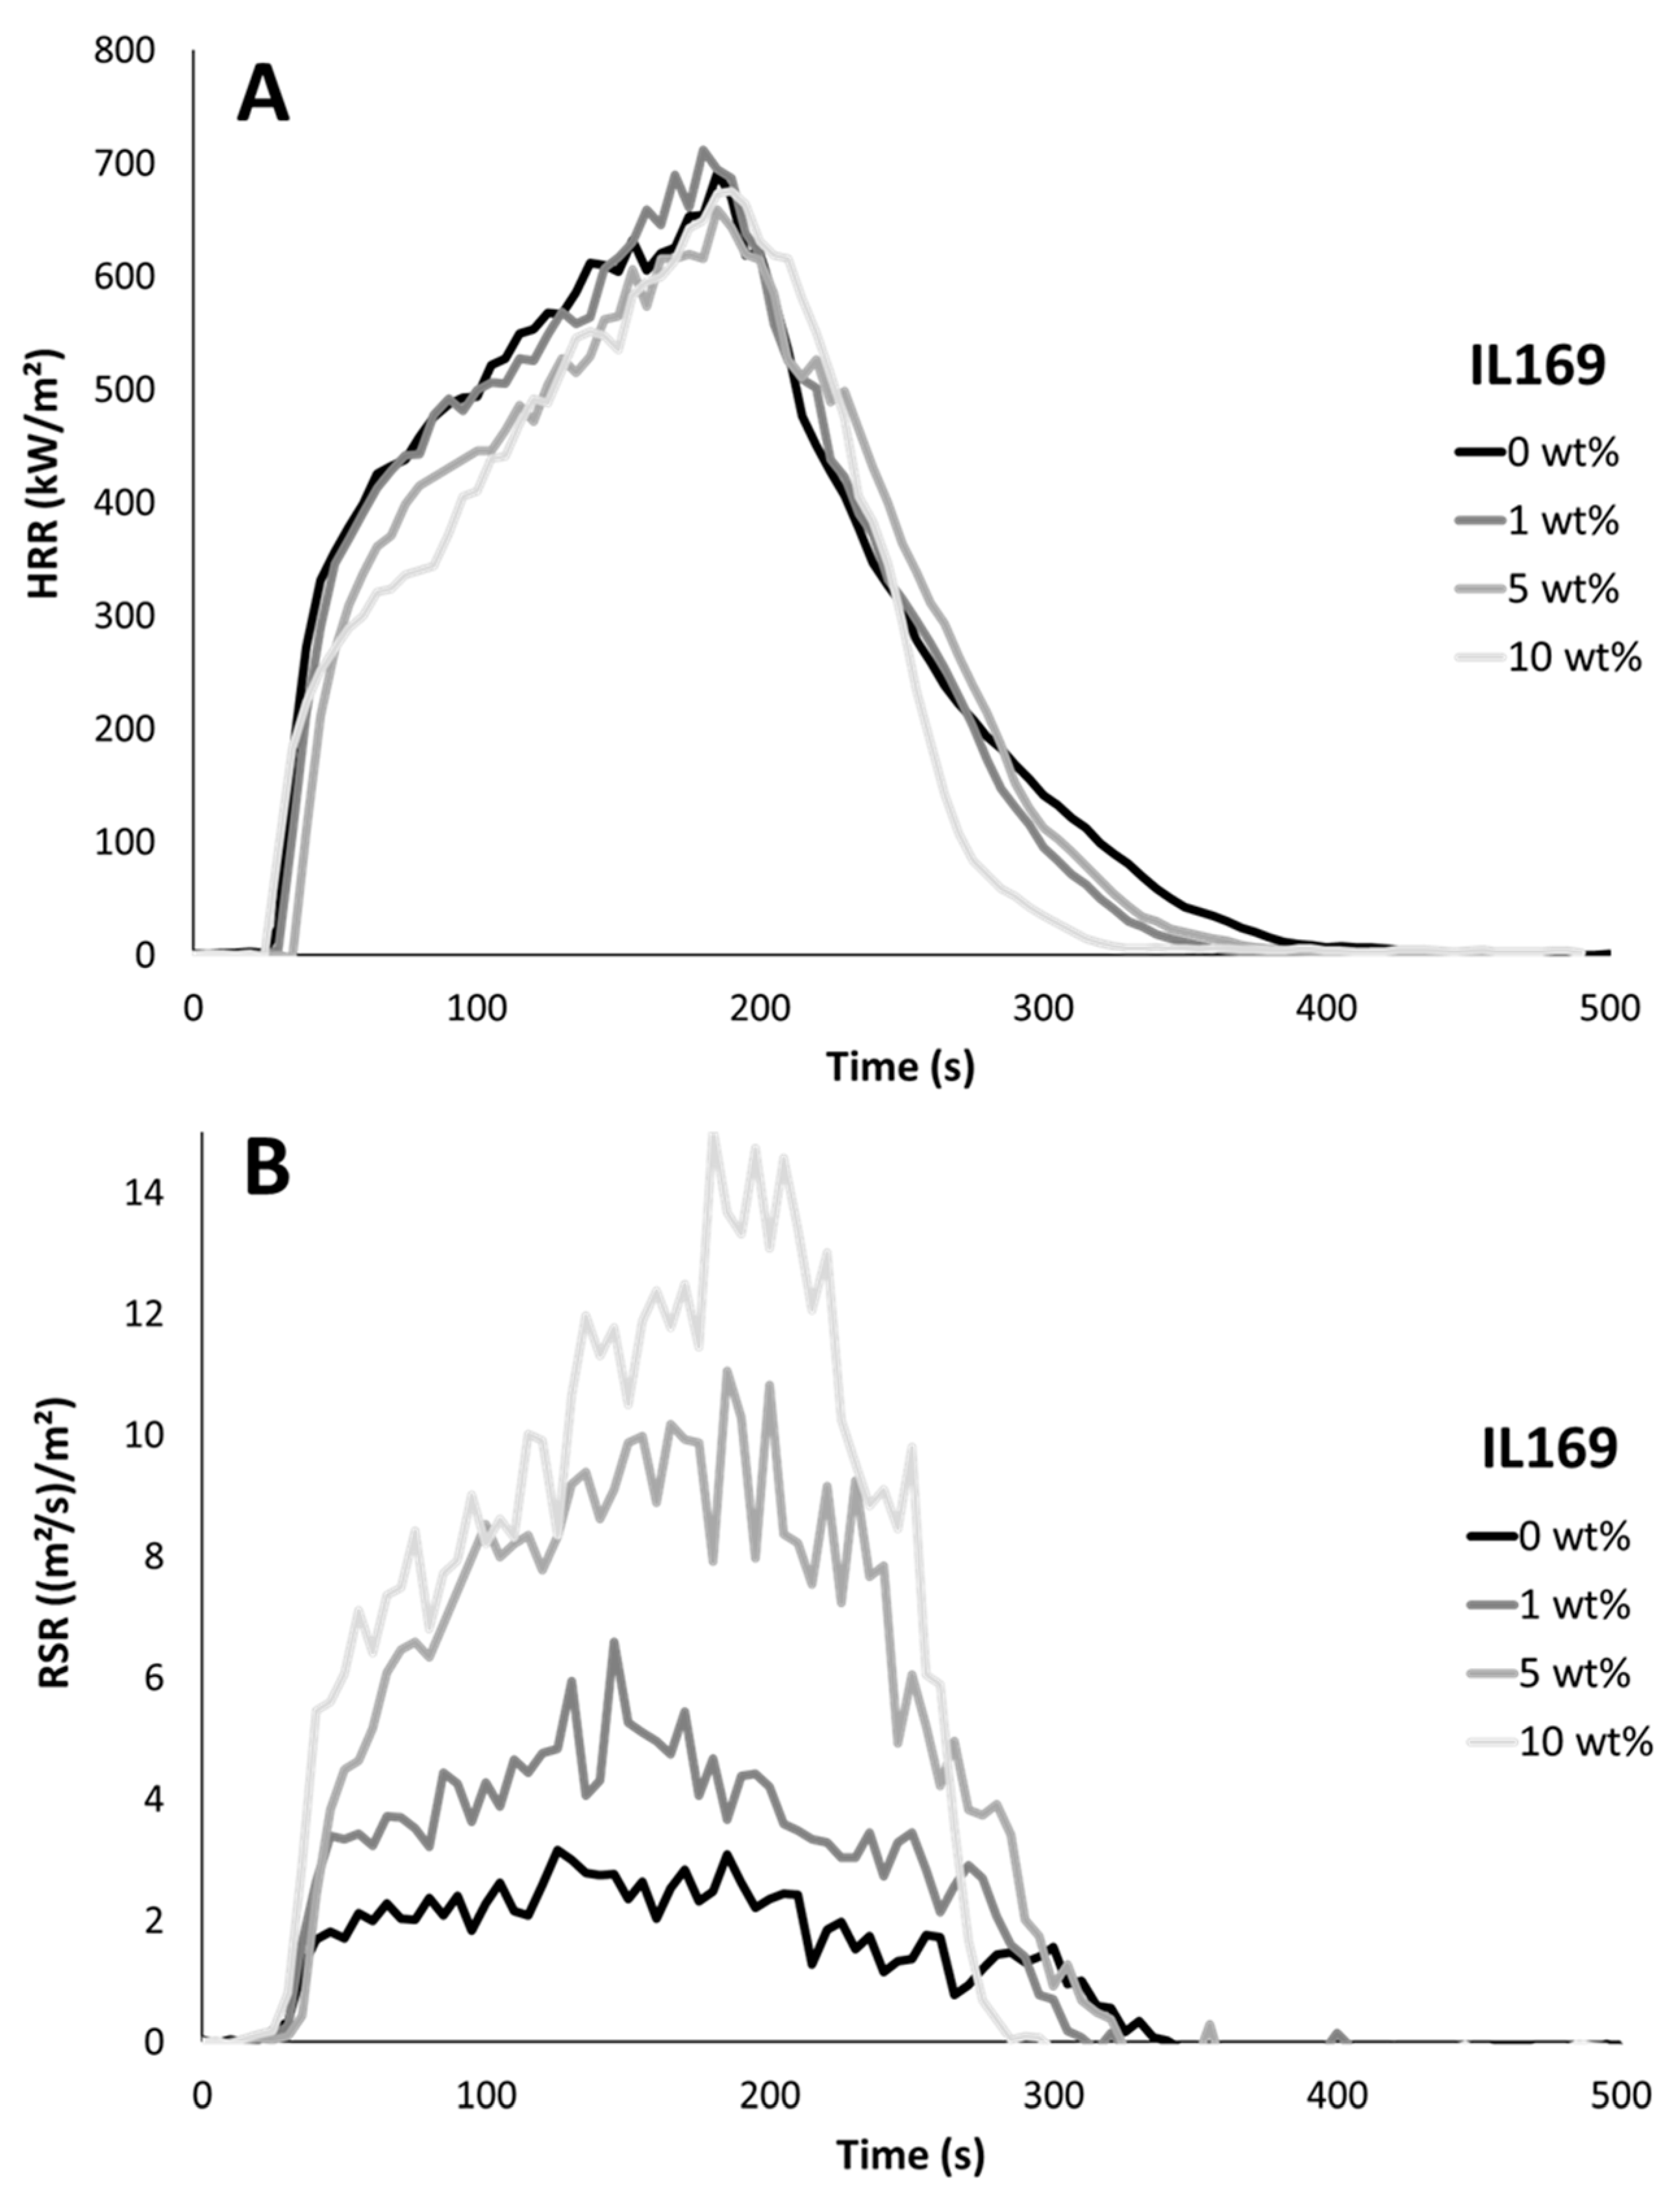
IL169 does not improve the fire behavior of Elium resin. Figure 2A shows that the HRR curve does not change significantly when IL169 is added in Elium resin. TTI and pHRR remain in the range of 26–36 s and 673–712 kW/m2, respectively. Nevertheless, IL169 slightly decreases the combustion efficiency (calculated from the effective heat of combustion in the cone calorimeter and heat of complete combustion in PCFC) from 1 to 0.87 (for 10 wt% of IL169). Similarly, CO/CO2 ratio as well as smoke production increases significantly (Figure 2B).
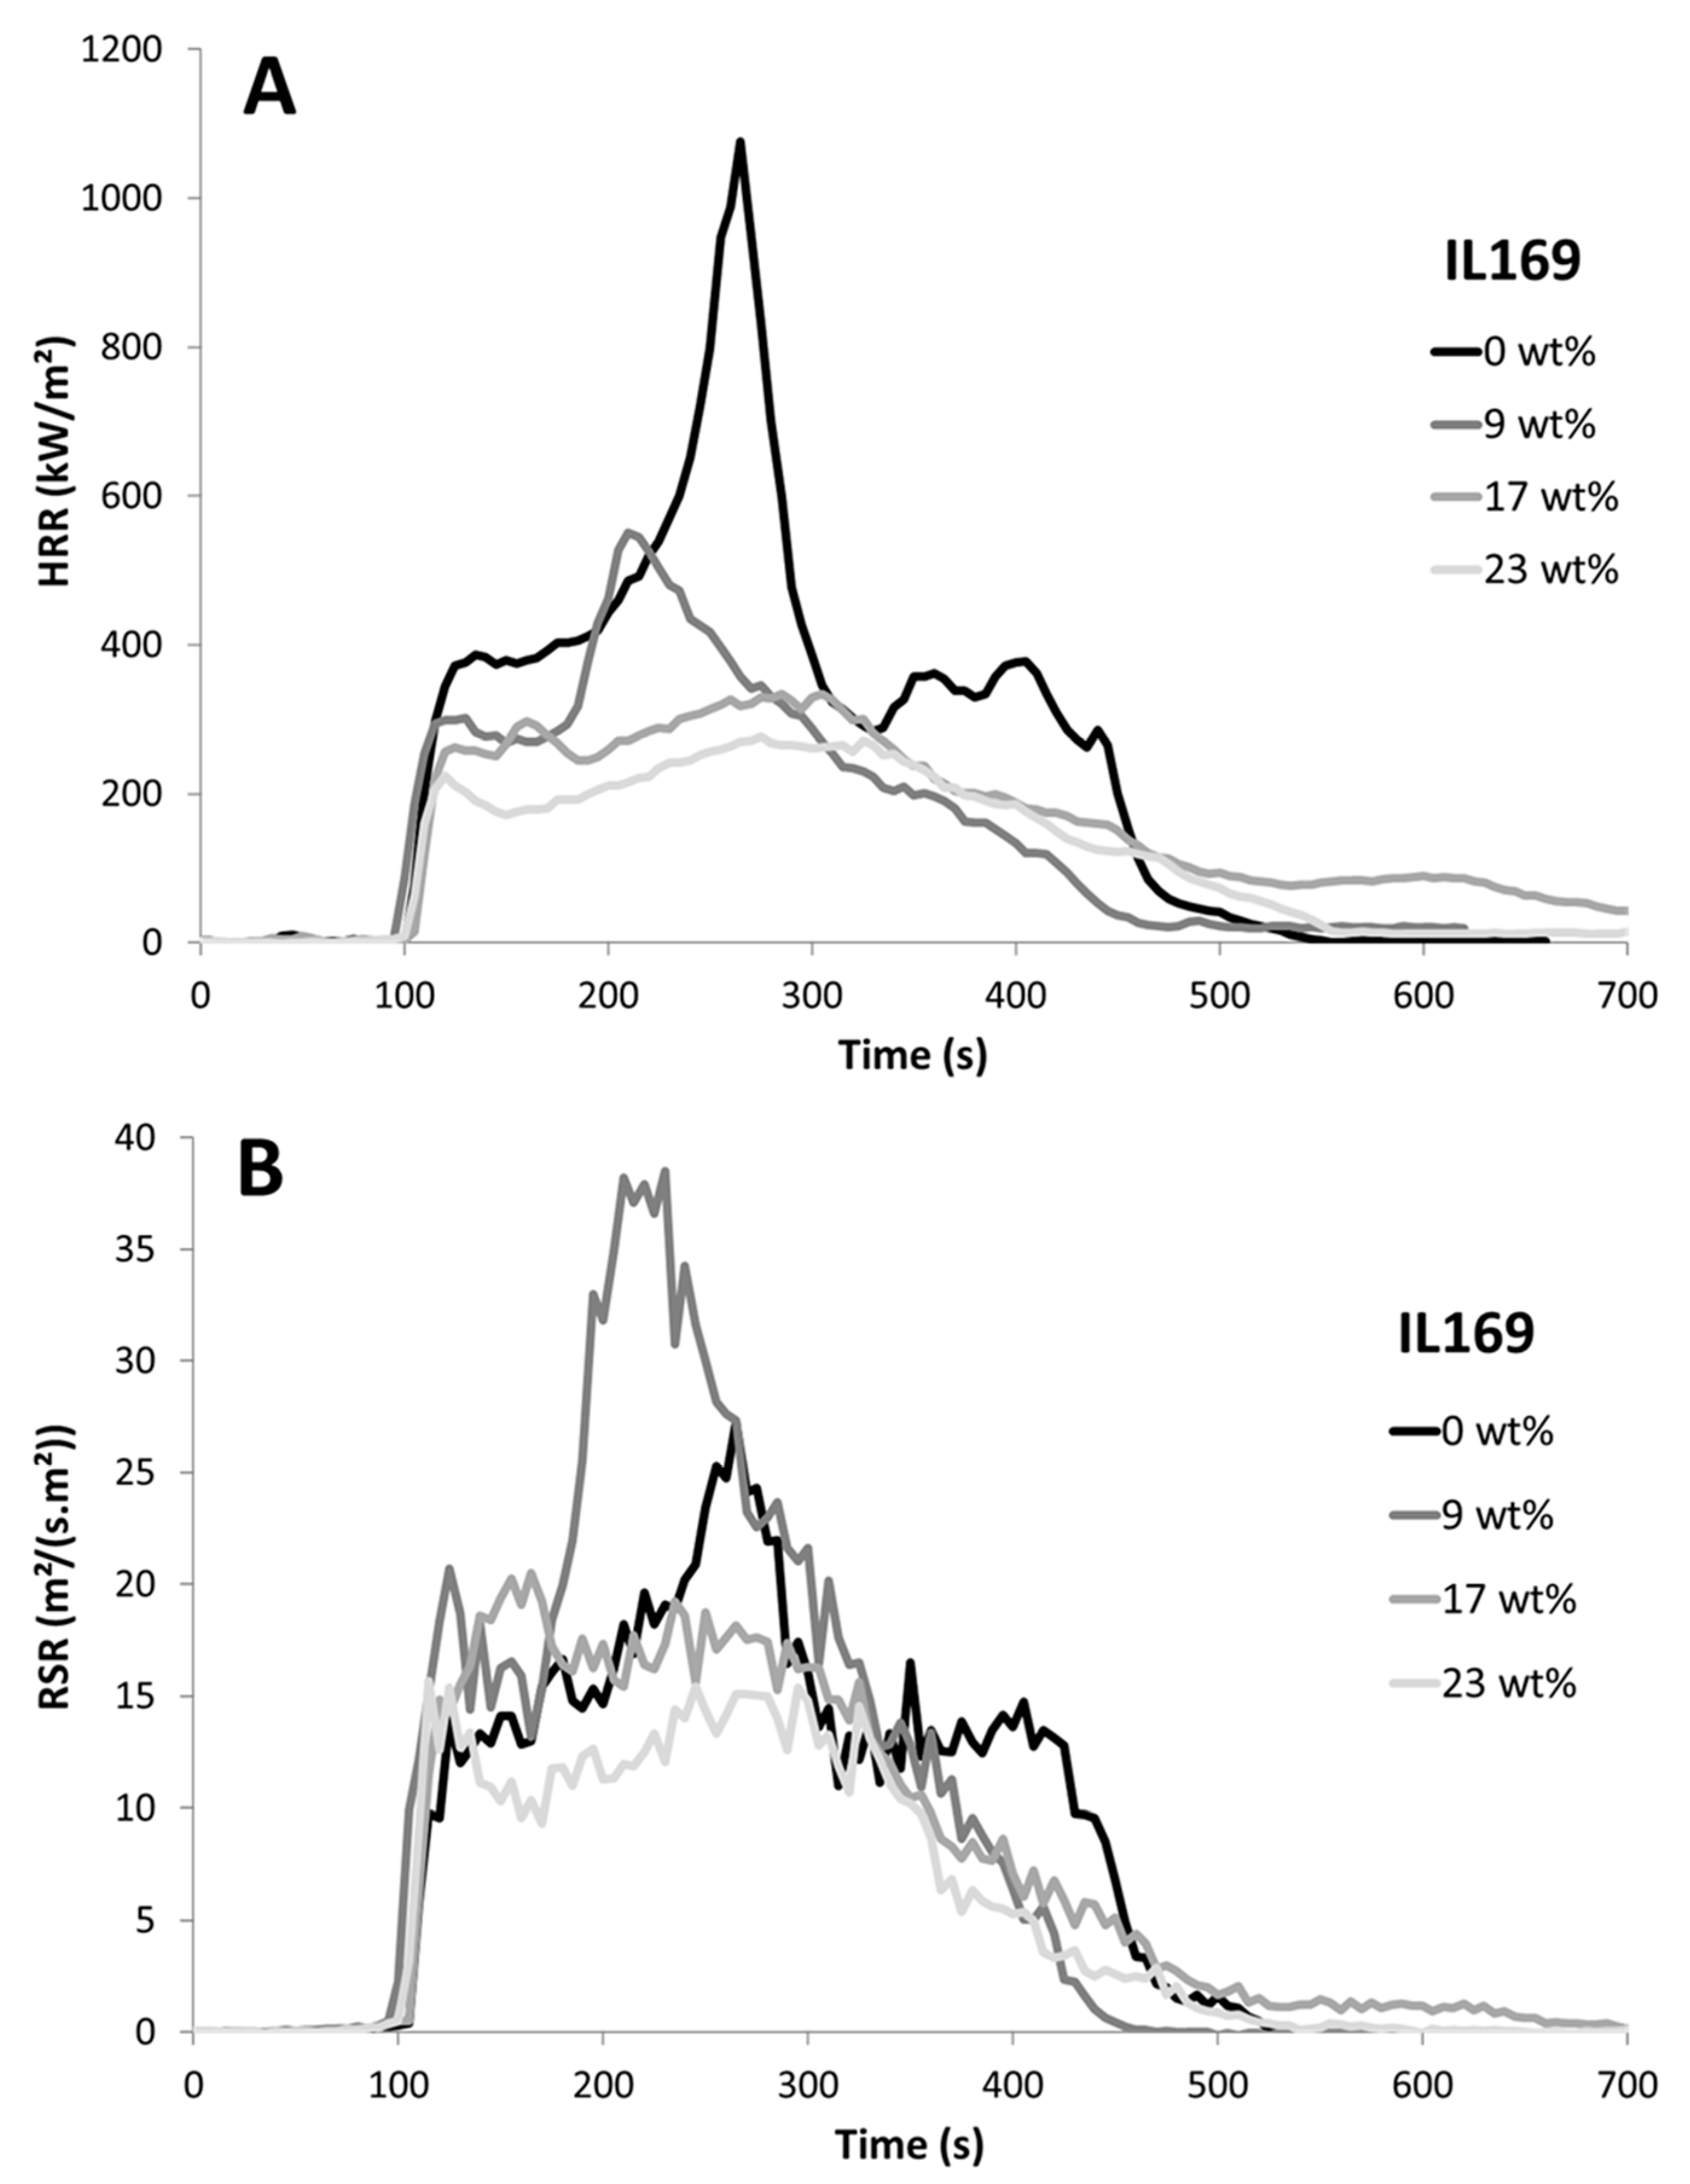
In epoxy resin, IL169 acts as reactive hardener and improves flame retardancy (Figure 3A). More details can be found in Sonnier et al. [16]. It is noteworthy that RSR is much higher in epoxy resin than in Elium resin, independently of the presence of IL169. RSR reaches 25 m2/(g.m2) for FR-free epoxy resin at 35 kW/m2, versus less than 3 m2/(g.m2) for FR-free Elium resin at 50 kW/m2 (and only 14 m2/(g.m2) with 10 wt% of IL169). In epoxy resin, IL169 tends to increase RSR at low content (9 wt%) and to slightly decrease it at higher content. Nevertheless, the decrease in RSR is much more limited than the decrease in HRR (compare Figure 3A,B).
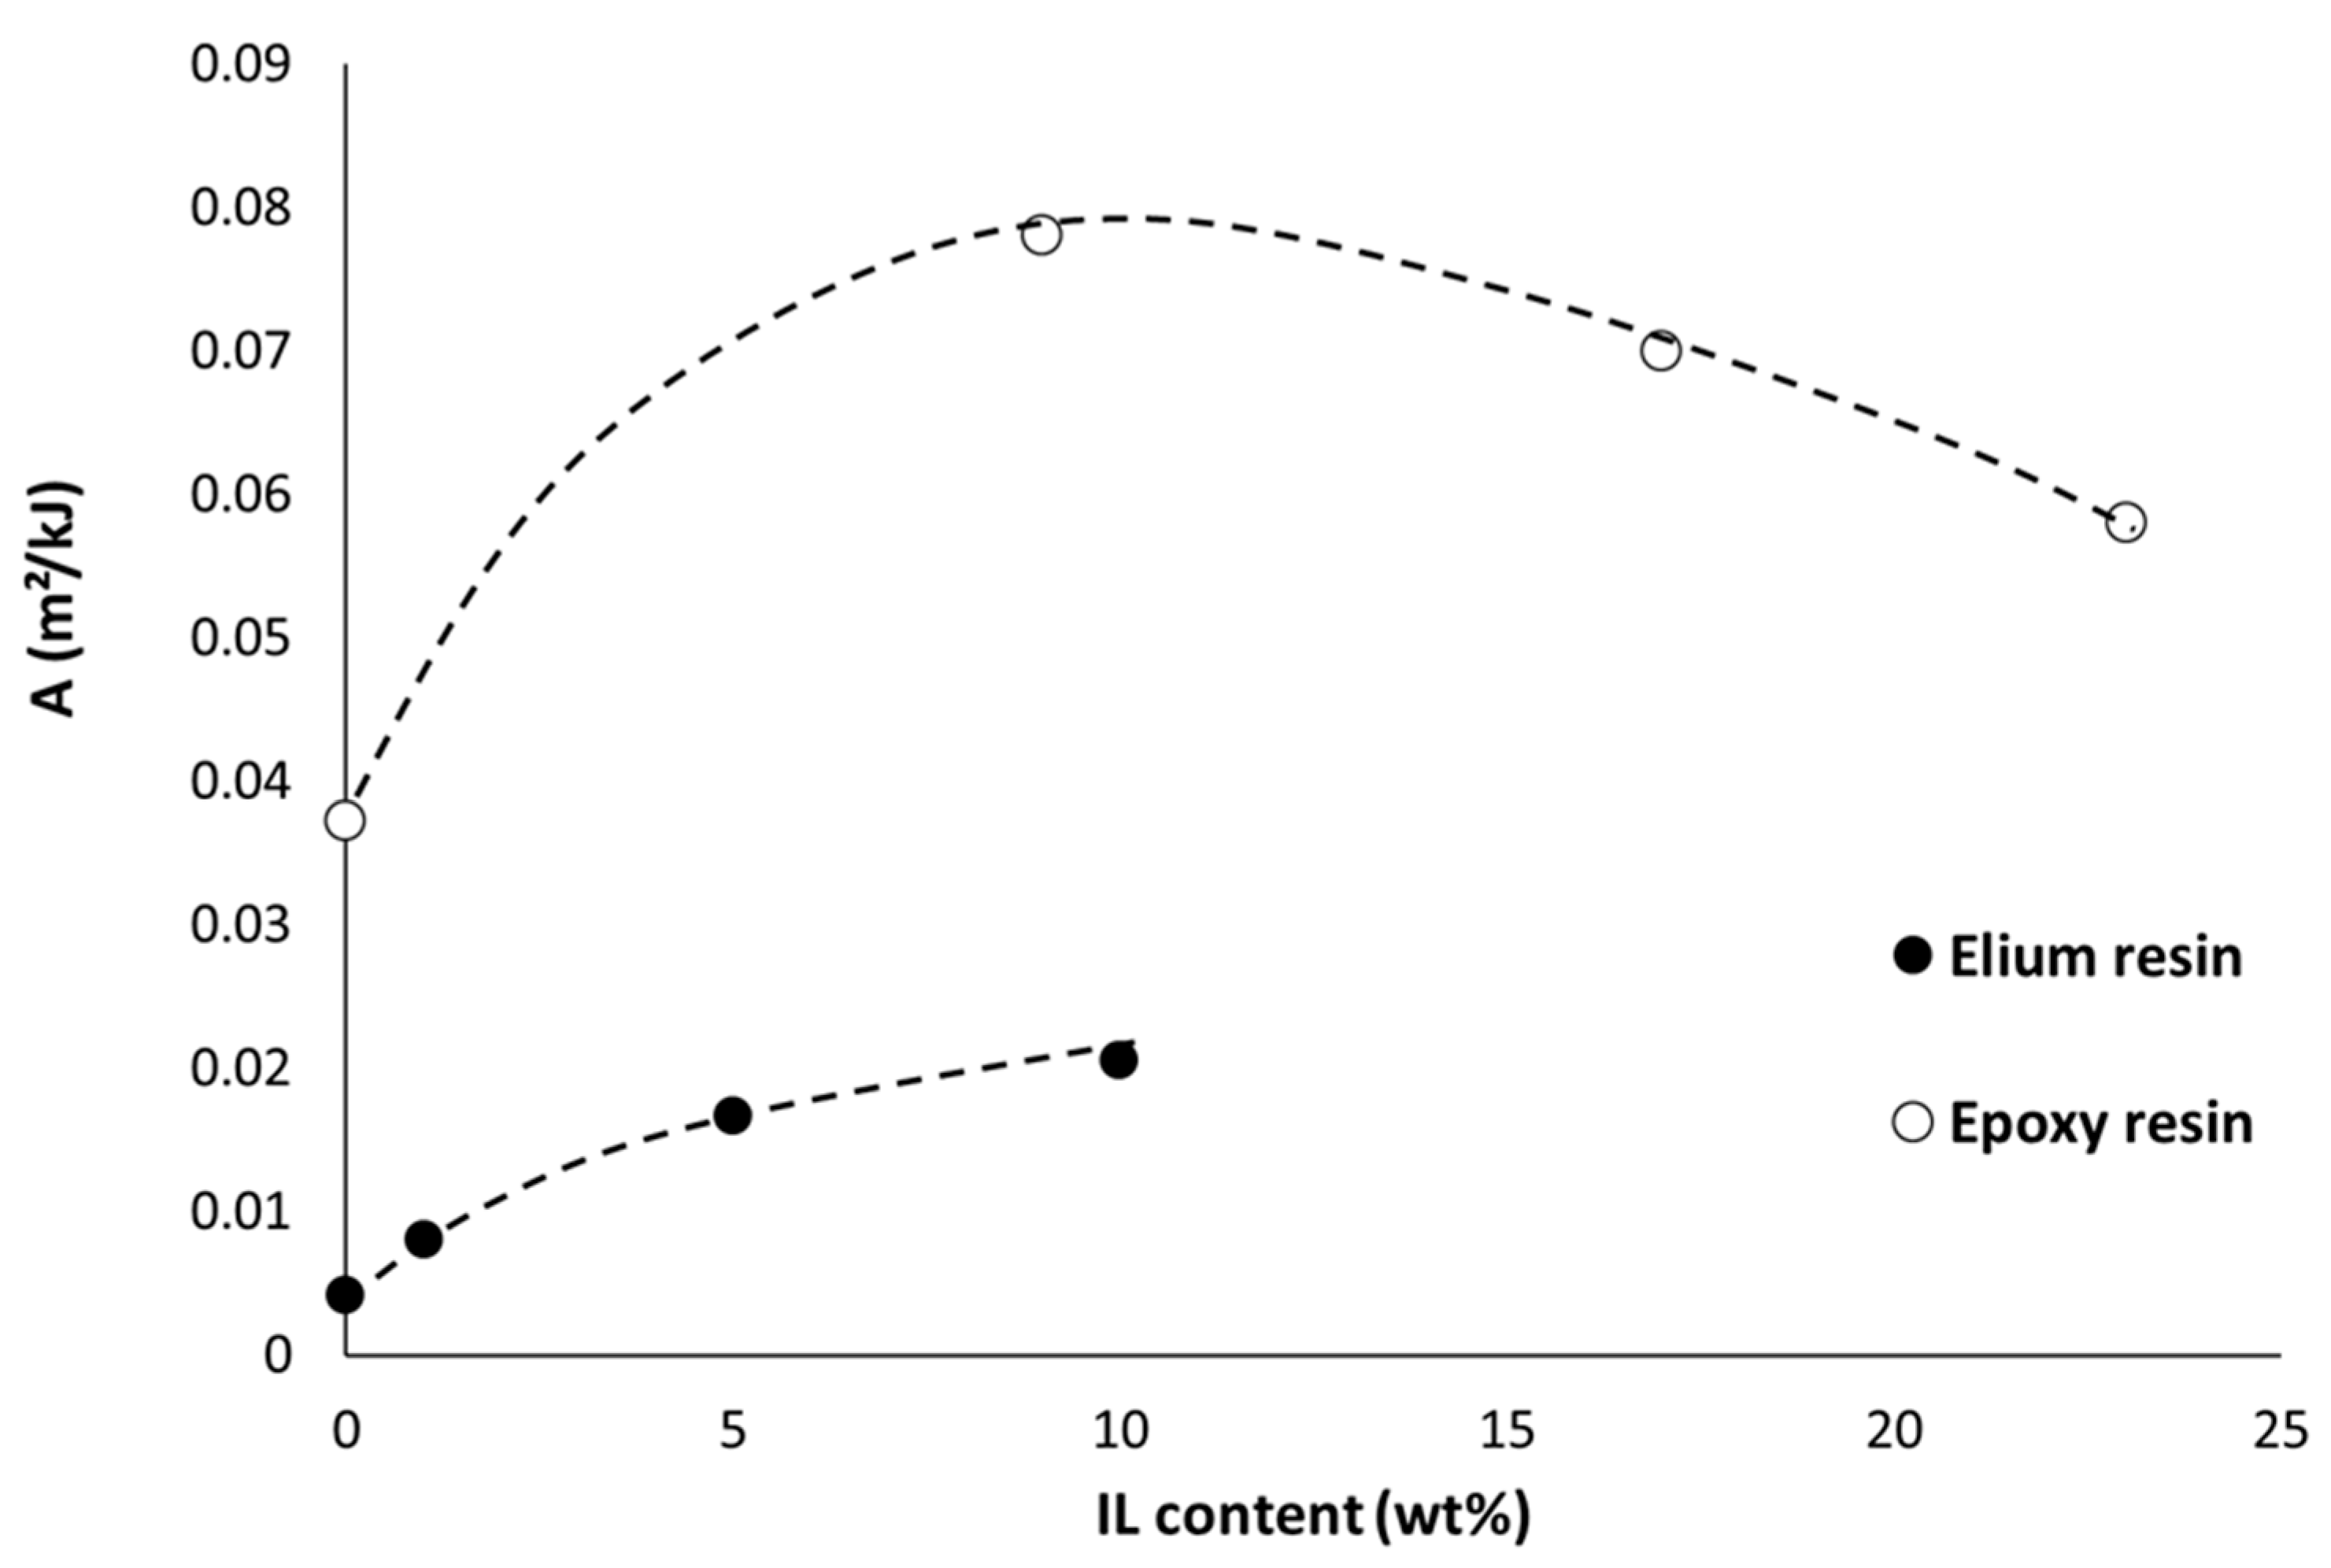
A and B values were calculated for both systems (Figure 4). A value for pure Elium resin is close to 0.005 m2/kJ, in good agreement with the value previously calculated for PMMA. A increases continuously with IL169, up to 0.02 m2/kJ for 10 wt% of ionic liquid (IL). B increases from 0.10 m2/g to 0.43 m2/g when IL169 content increases from 0 to 10 wt%. It can be assumed that IL169 acts as smoke promoter due to its limited but non-negligible effect as a flame inhibitor.
Epoxy resins release much more smoke than Elium. A and B values are close to 0.04 m2/kJ and 0.9 m2/g, respectively. The incorporation of IL169 at 9 wt% significantly increases these values (A increases up to 0.078 m2/kJ). Further incorporation leads to a decrease of these values but A and B for FR epoxy resins remain higher than for FR-free resin.
Formulations based on PE/EVA (series D) and ABS (series E) were also tested (Figure 5 and Figure 6). Their fire properties (PCFC, cone calorimeter and LOI) can be found elsewhere [18]. 
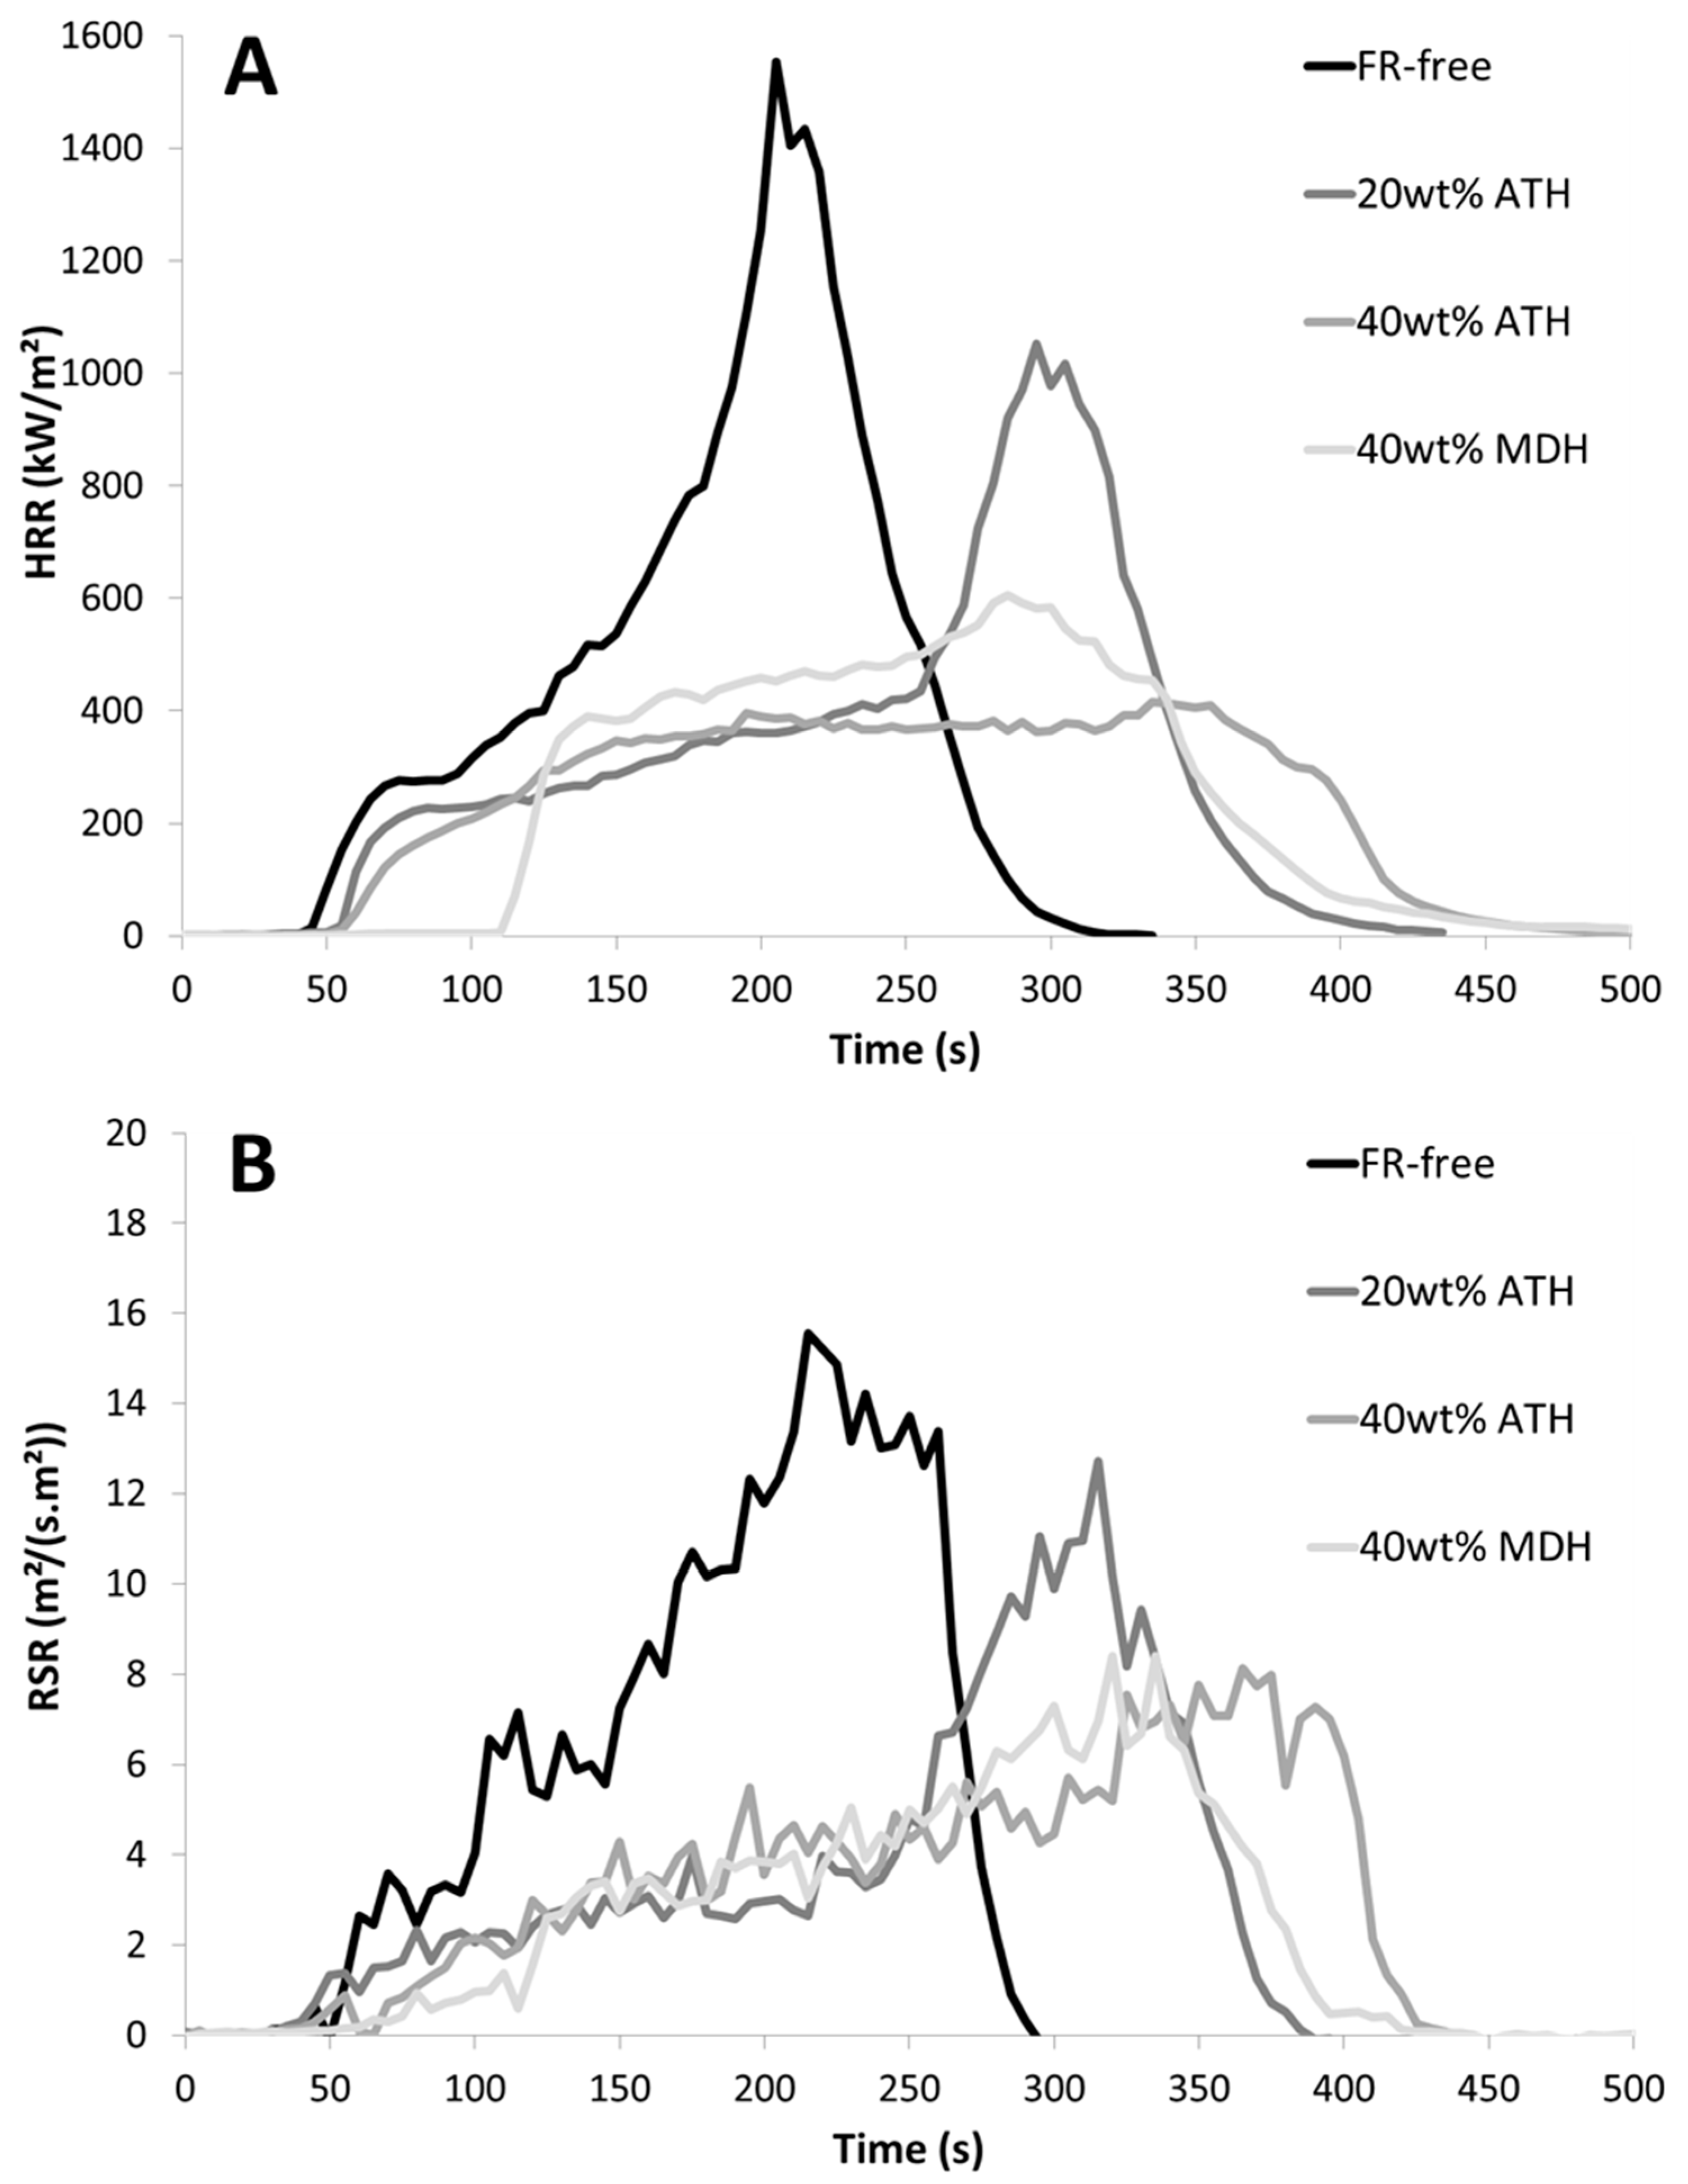
Figure 5 shows HRR and RSR curves for some PE/EVA composites. It can be found that the incorporation of fillers decreases both heat release and smoke production. The decrease seems to be proportional to the filler content and more or less similar for HRR and RSR. ATH is more effective than MDH at the same content. For 60 wt% of FR (ATH, MDH or a blend of both fillers), the smoke production becomes very low and intrinsic smoke properties cannot be properly calculated. The ranking between the formulations is the same in terms of HRR and RSR.
Some curves are plotted in 
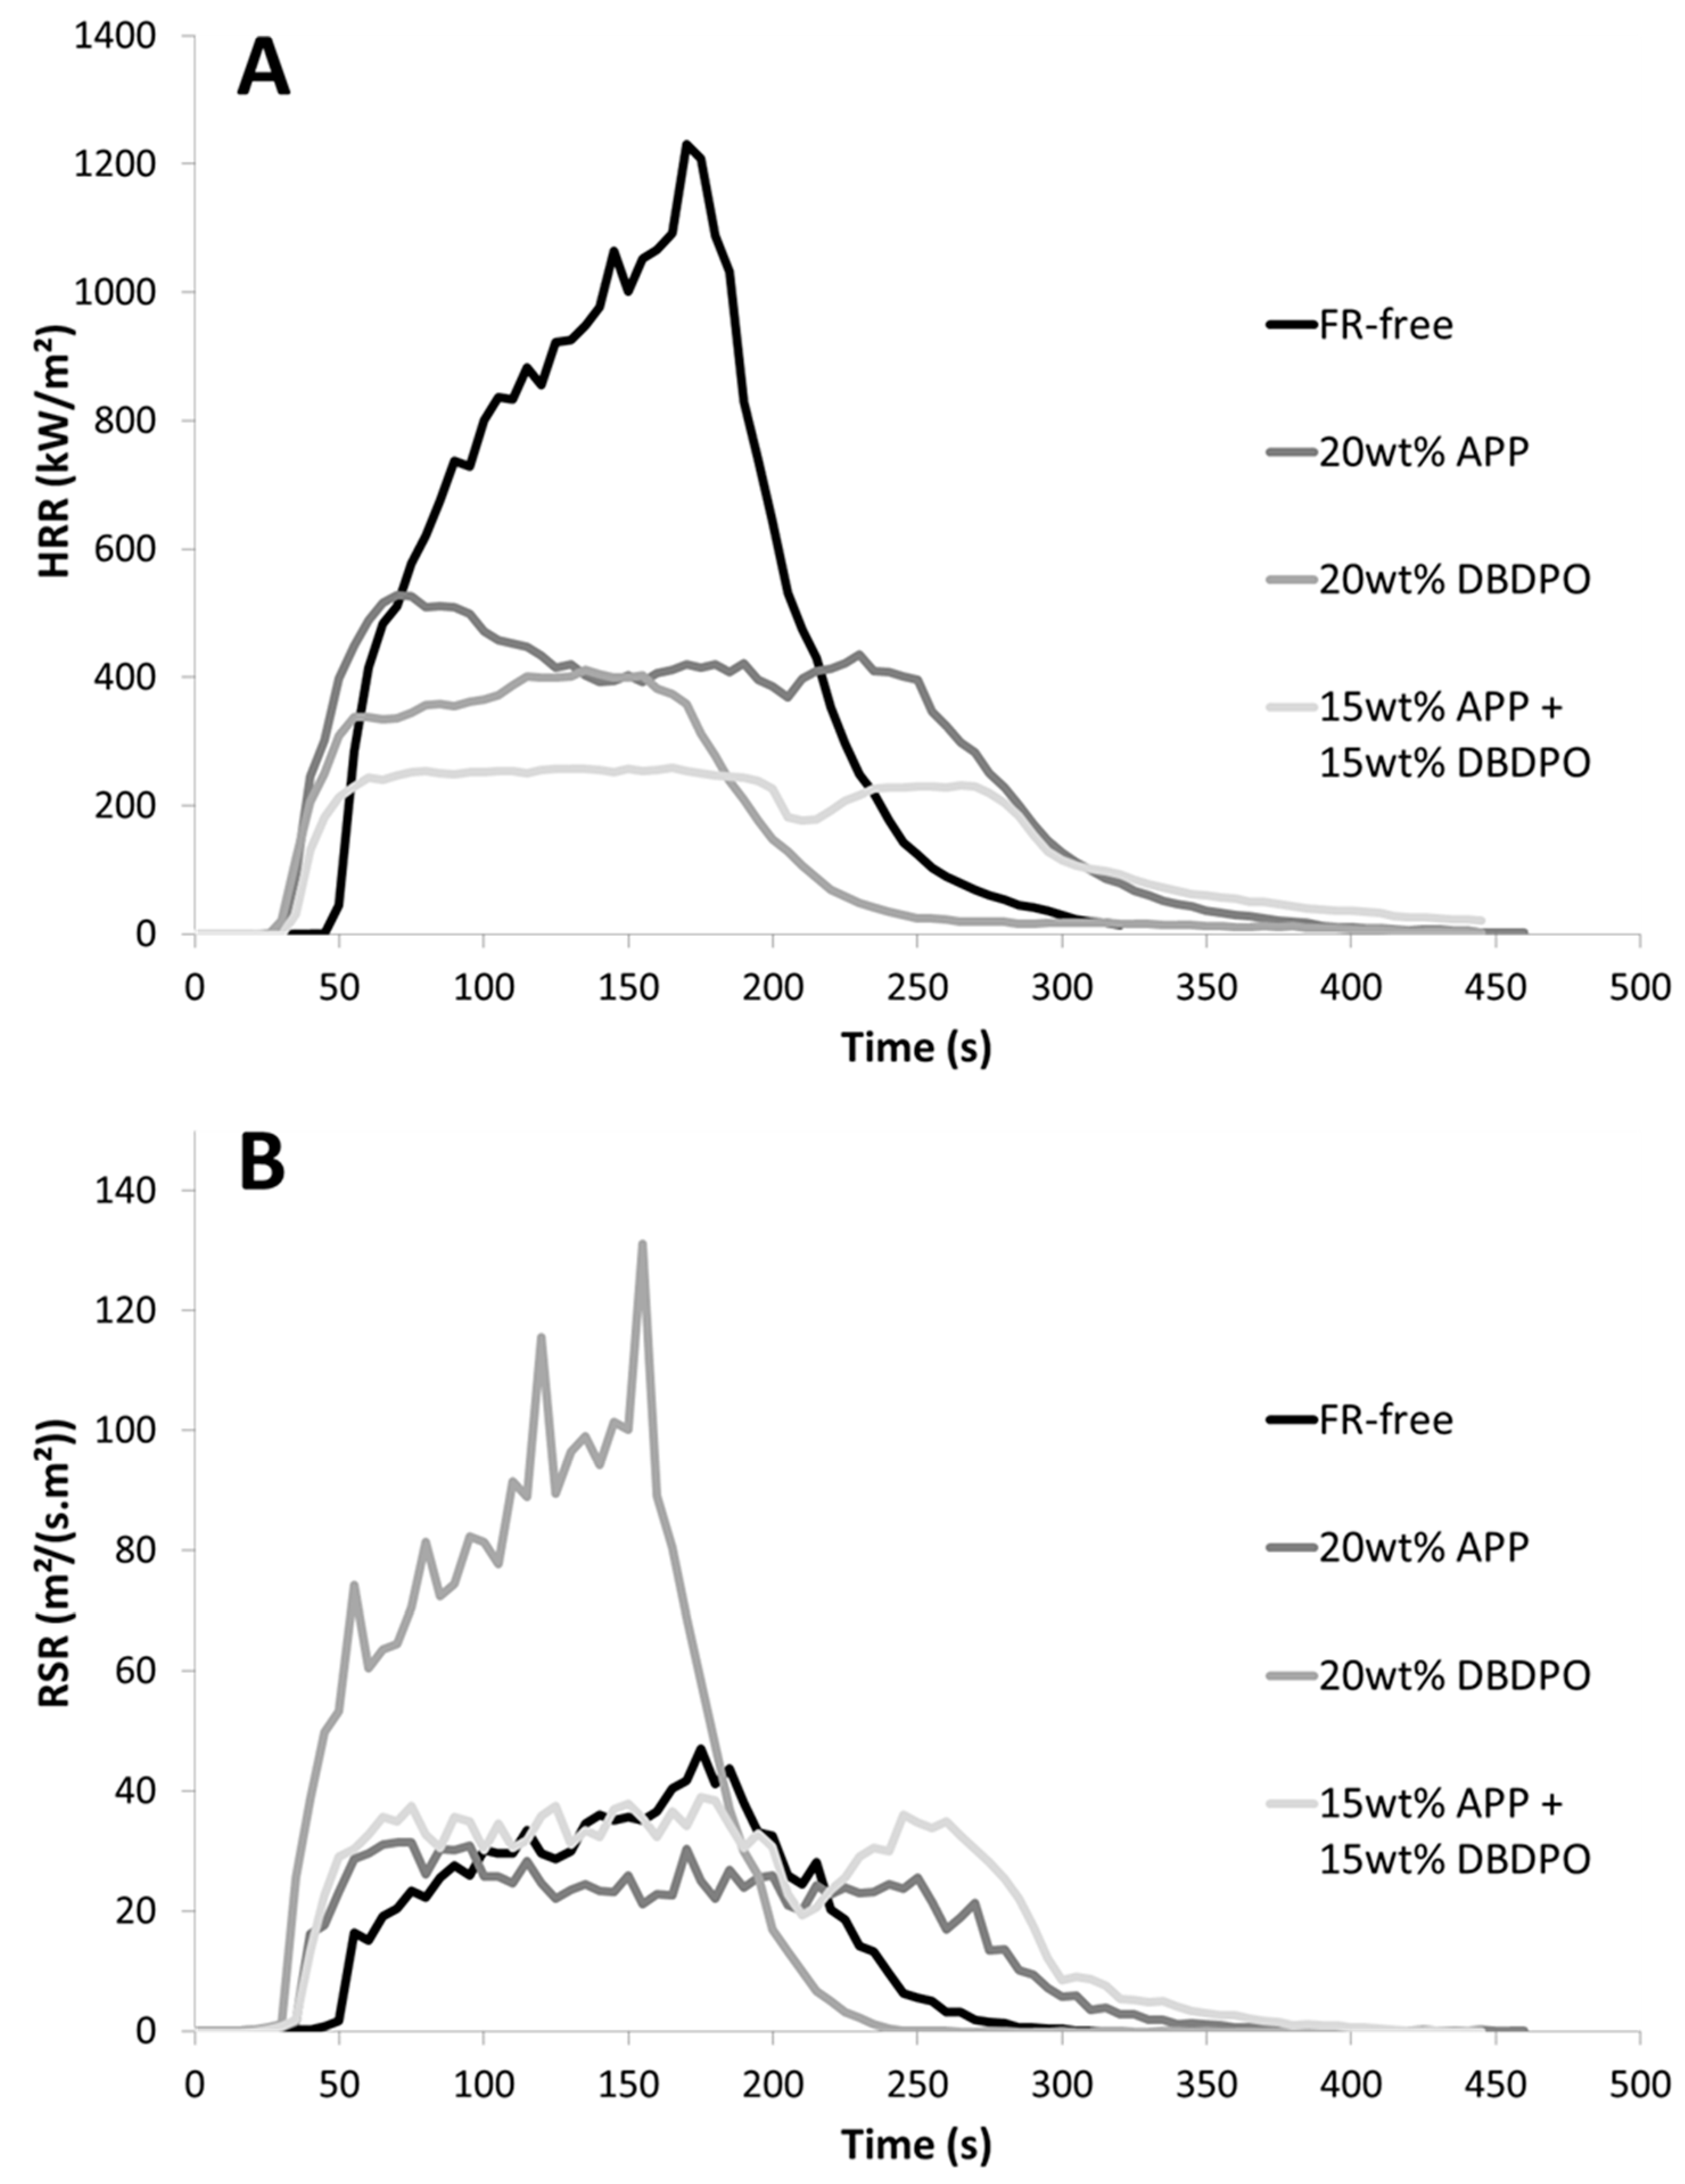
Figure 6 for series E. Contrarily to previous results, a strong discrepancy is observed between HRR and RSR curves. Especially, 20 wt% DBDPO efficiently reduces HRR but leads to a huge increase in RSR. A total of 20 wt% APP allows the reduction of RSR (in comparison to pure ABS) but at a much lower extent than HRR. Among the curves shown in Figure 6, the combination of 15 wt% APP + 15 wt% DBDPO is the most efficient to reduce the HRR but releases more smoke than 20 wt% APP. It is noteworthy that the HRR and RSR curves for the combination of both fillers is closer to the curves for 20 wt% APP than the curves for 20 wt% DBDPO.
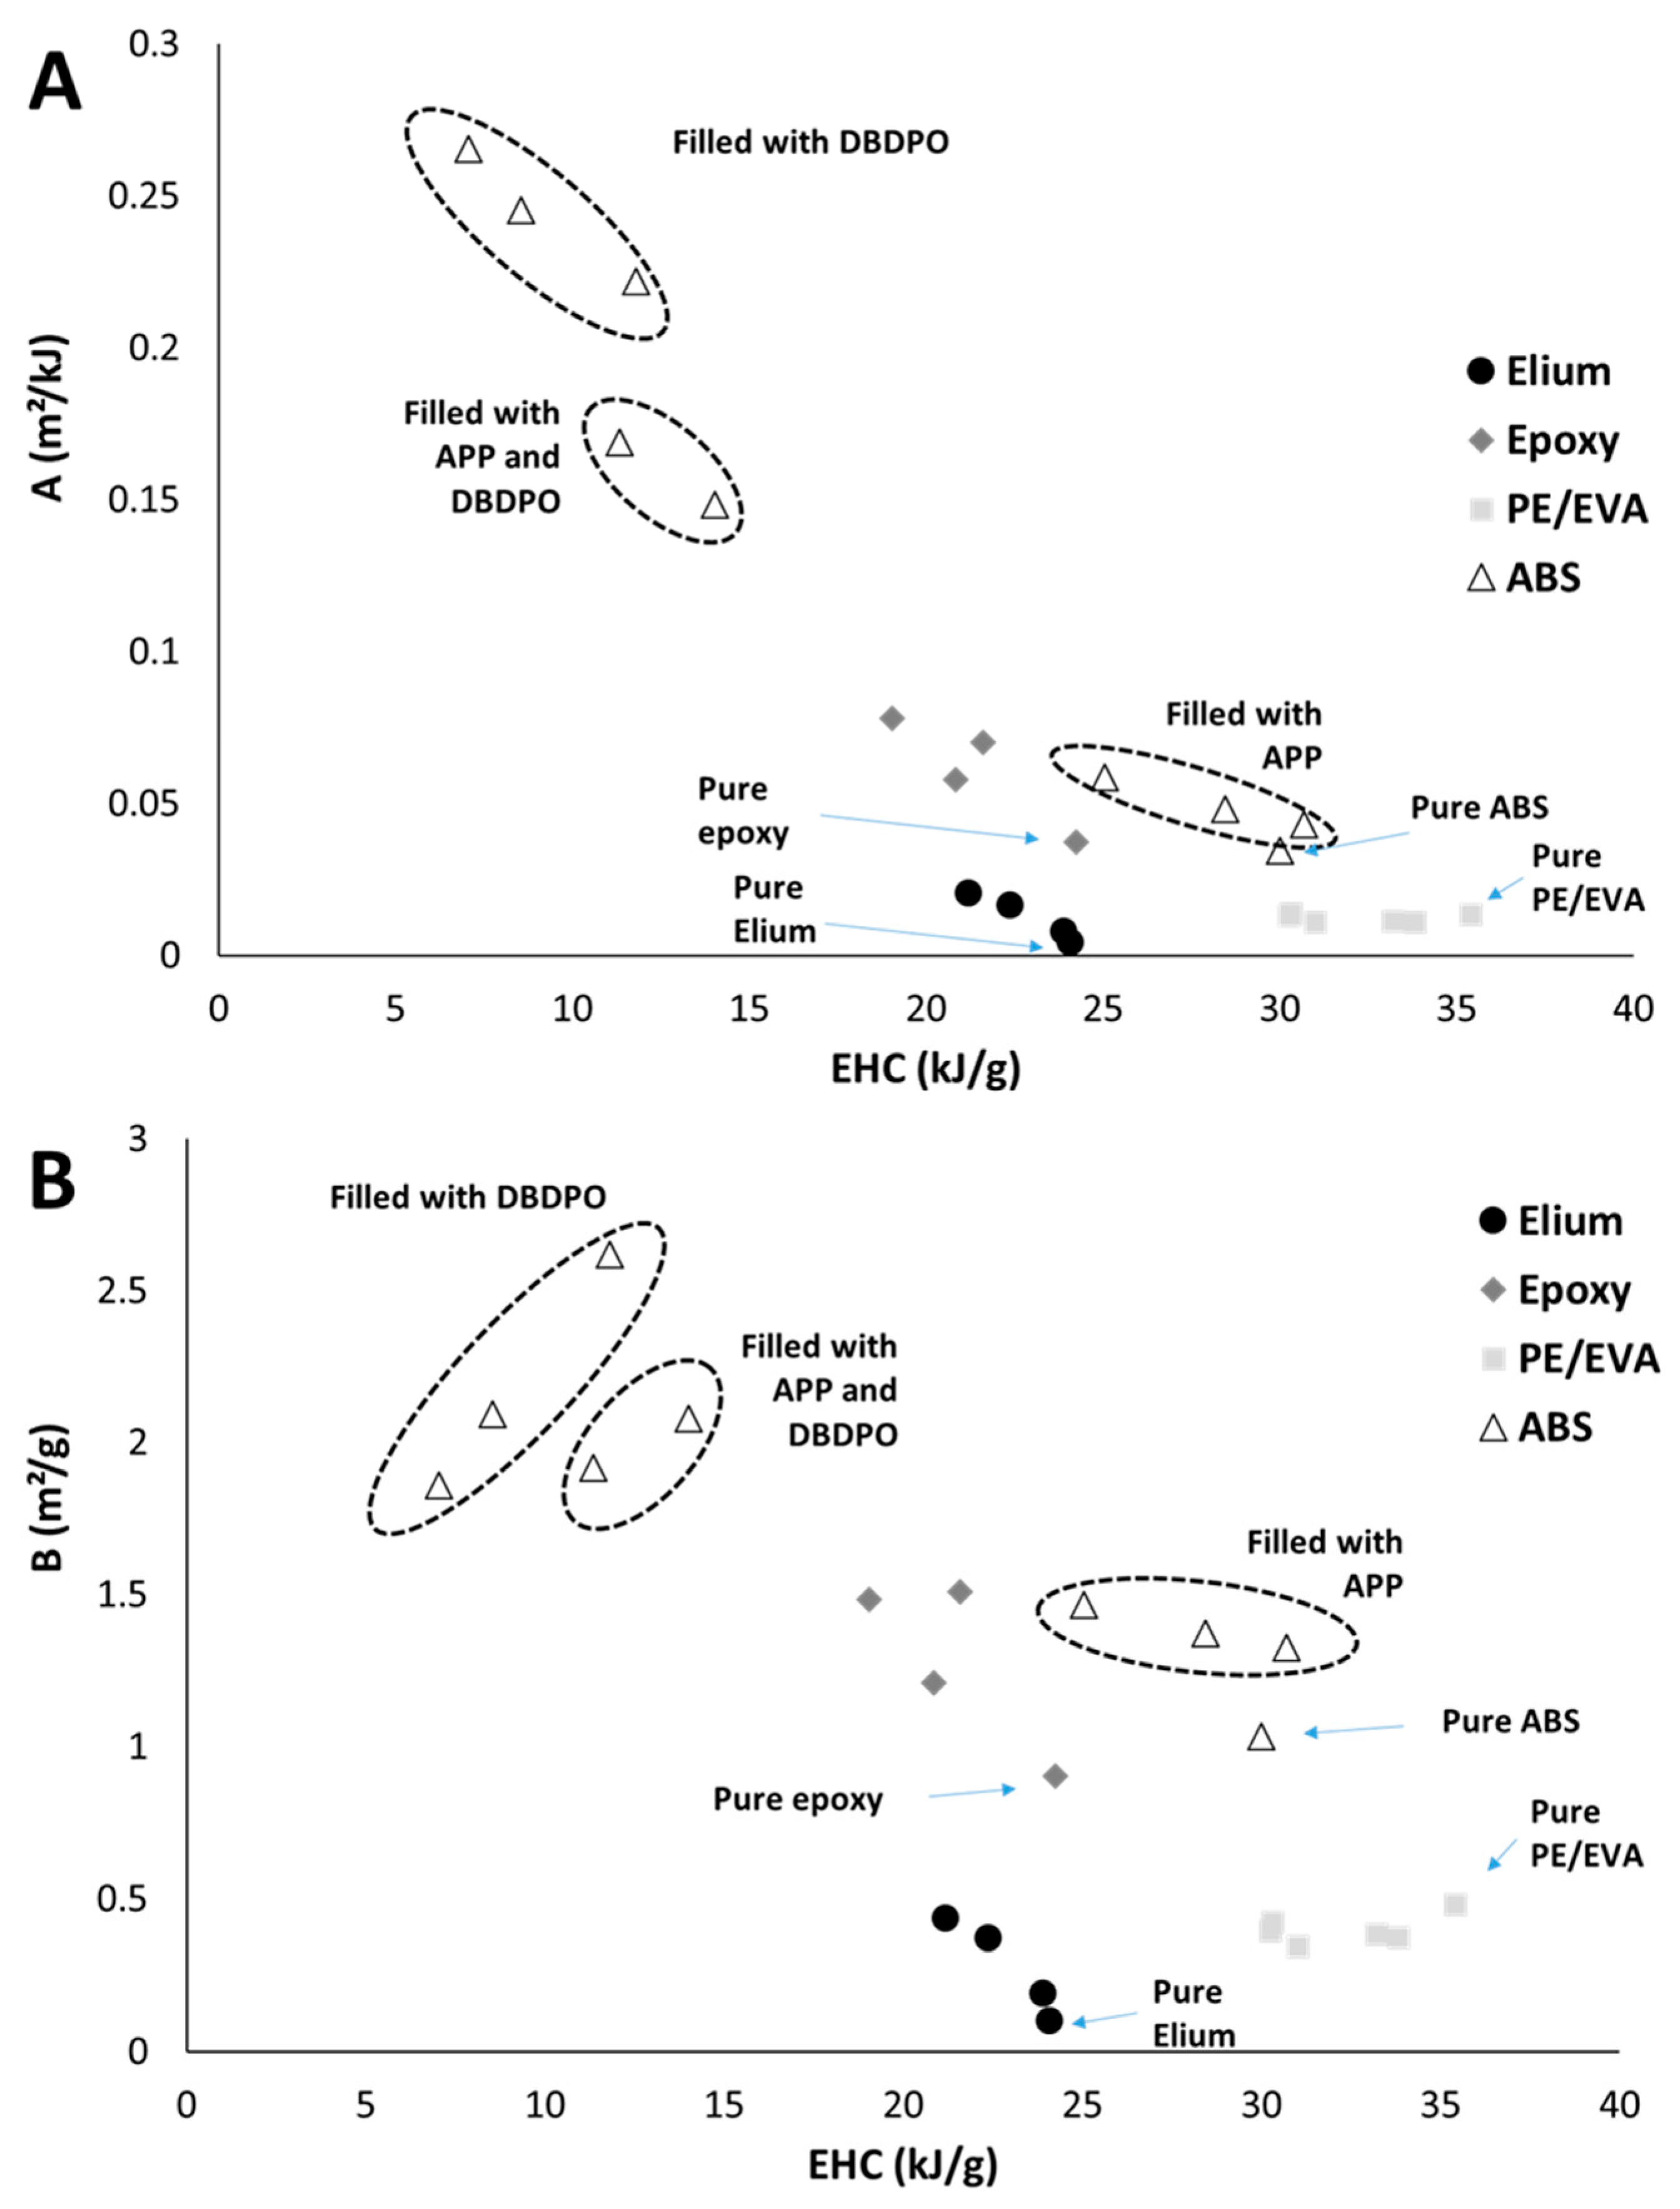
Figure 7A,B shows the A and B values versus the effective heat of combustion for all these formulations. In many cases, for the same class of materials, it can be found that A and B values increase when the effective heat of combustion decreases. Nevertheless, depending on the polymer and FR, huge differences are observed.
As already stated, IL169 increases the A and B values of Elium and epoxy resins in a similar way, but FR-free epoxy resin exhibits A and B values nine times higher than FR-free Elium resin.
The incorporation of ATH, MDH or blends at a total content of 20 or 40 wt% leads to a decrease in the heat of combustion (because water is released from the mineral fillers) without significant change in smoke properties. A and B are close to 0.01 m2/kJ and 0.4 m2/g, respectively. It can be assumed that these mineral fillers do not modify the intrinsic ability of PE/EVA to produce smoke. The decrease in smoke production is only due to a decrease in decomposition kinetics (i.e., a decrease in mass loss rate and heat release rate).
APP and DBDPO lead to strong smoke production, especially through an increase of A and B values. This increase is moderate for APP: from 0.03 to 0.06 m2/kJ and from 1 to 1.5 m2/g, respectively, for A and B. APP is known to act in the condensed phase as a char promoter. It has no direct effect on combustion but the modification of the pyrolysis pathway by APP is associated with a change in smoke production as well as in heat of combustion because the gases released change (the char formed in presence of APP contains a high content of carbon). On the contrary, DBDPO is a flame inhibitor disturbing the combustion. The decrease in the heat of combustion is huge, but the values for A and B increase significantly: between 0.22 and 0.28 m2/kJ for A and between 1.8 and 2.6 m2/g for B.
Combining DBDPO and APP leads to intermediate values. EHC decreases between 11 and 14 kJ/g (versus 6.3 and 12 kJ/g for ABS filled only with DBDPO). B is similar to the values obtained when DBDPO is used alone (around 2 m2/g) but A is slightly lower (0.15–0.17 m2/kJ).
Table 1 lists the intrinsic smoke properties for all the materials tested. These properties will be used in the following section to predict the smoke production in the smoke density chamber.

3.3. Prediction of Smoke Density in Smoke Chamber Using Smoke Properties

The smoke chamber test provides two main data: the specific optical smoke density (Ds, no unit) and the mass loss rate. Ds is defined as follows:
D s = V Al × log ( I I 0 )
with V being the volume of the chamber and A being the exposed surface area of the sample.
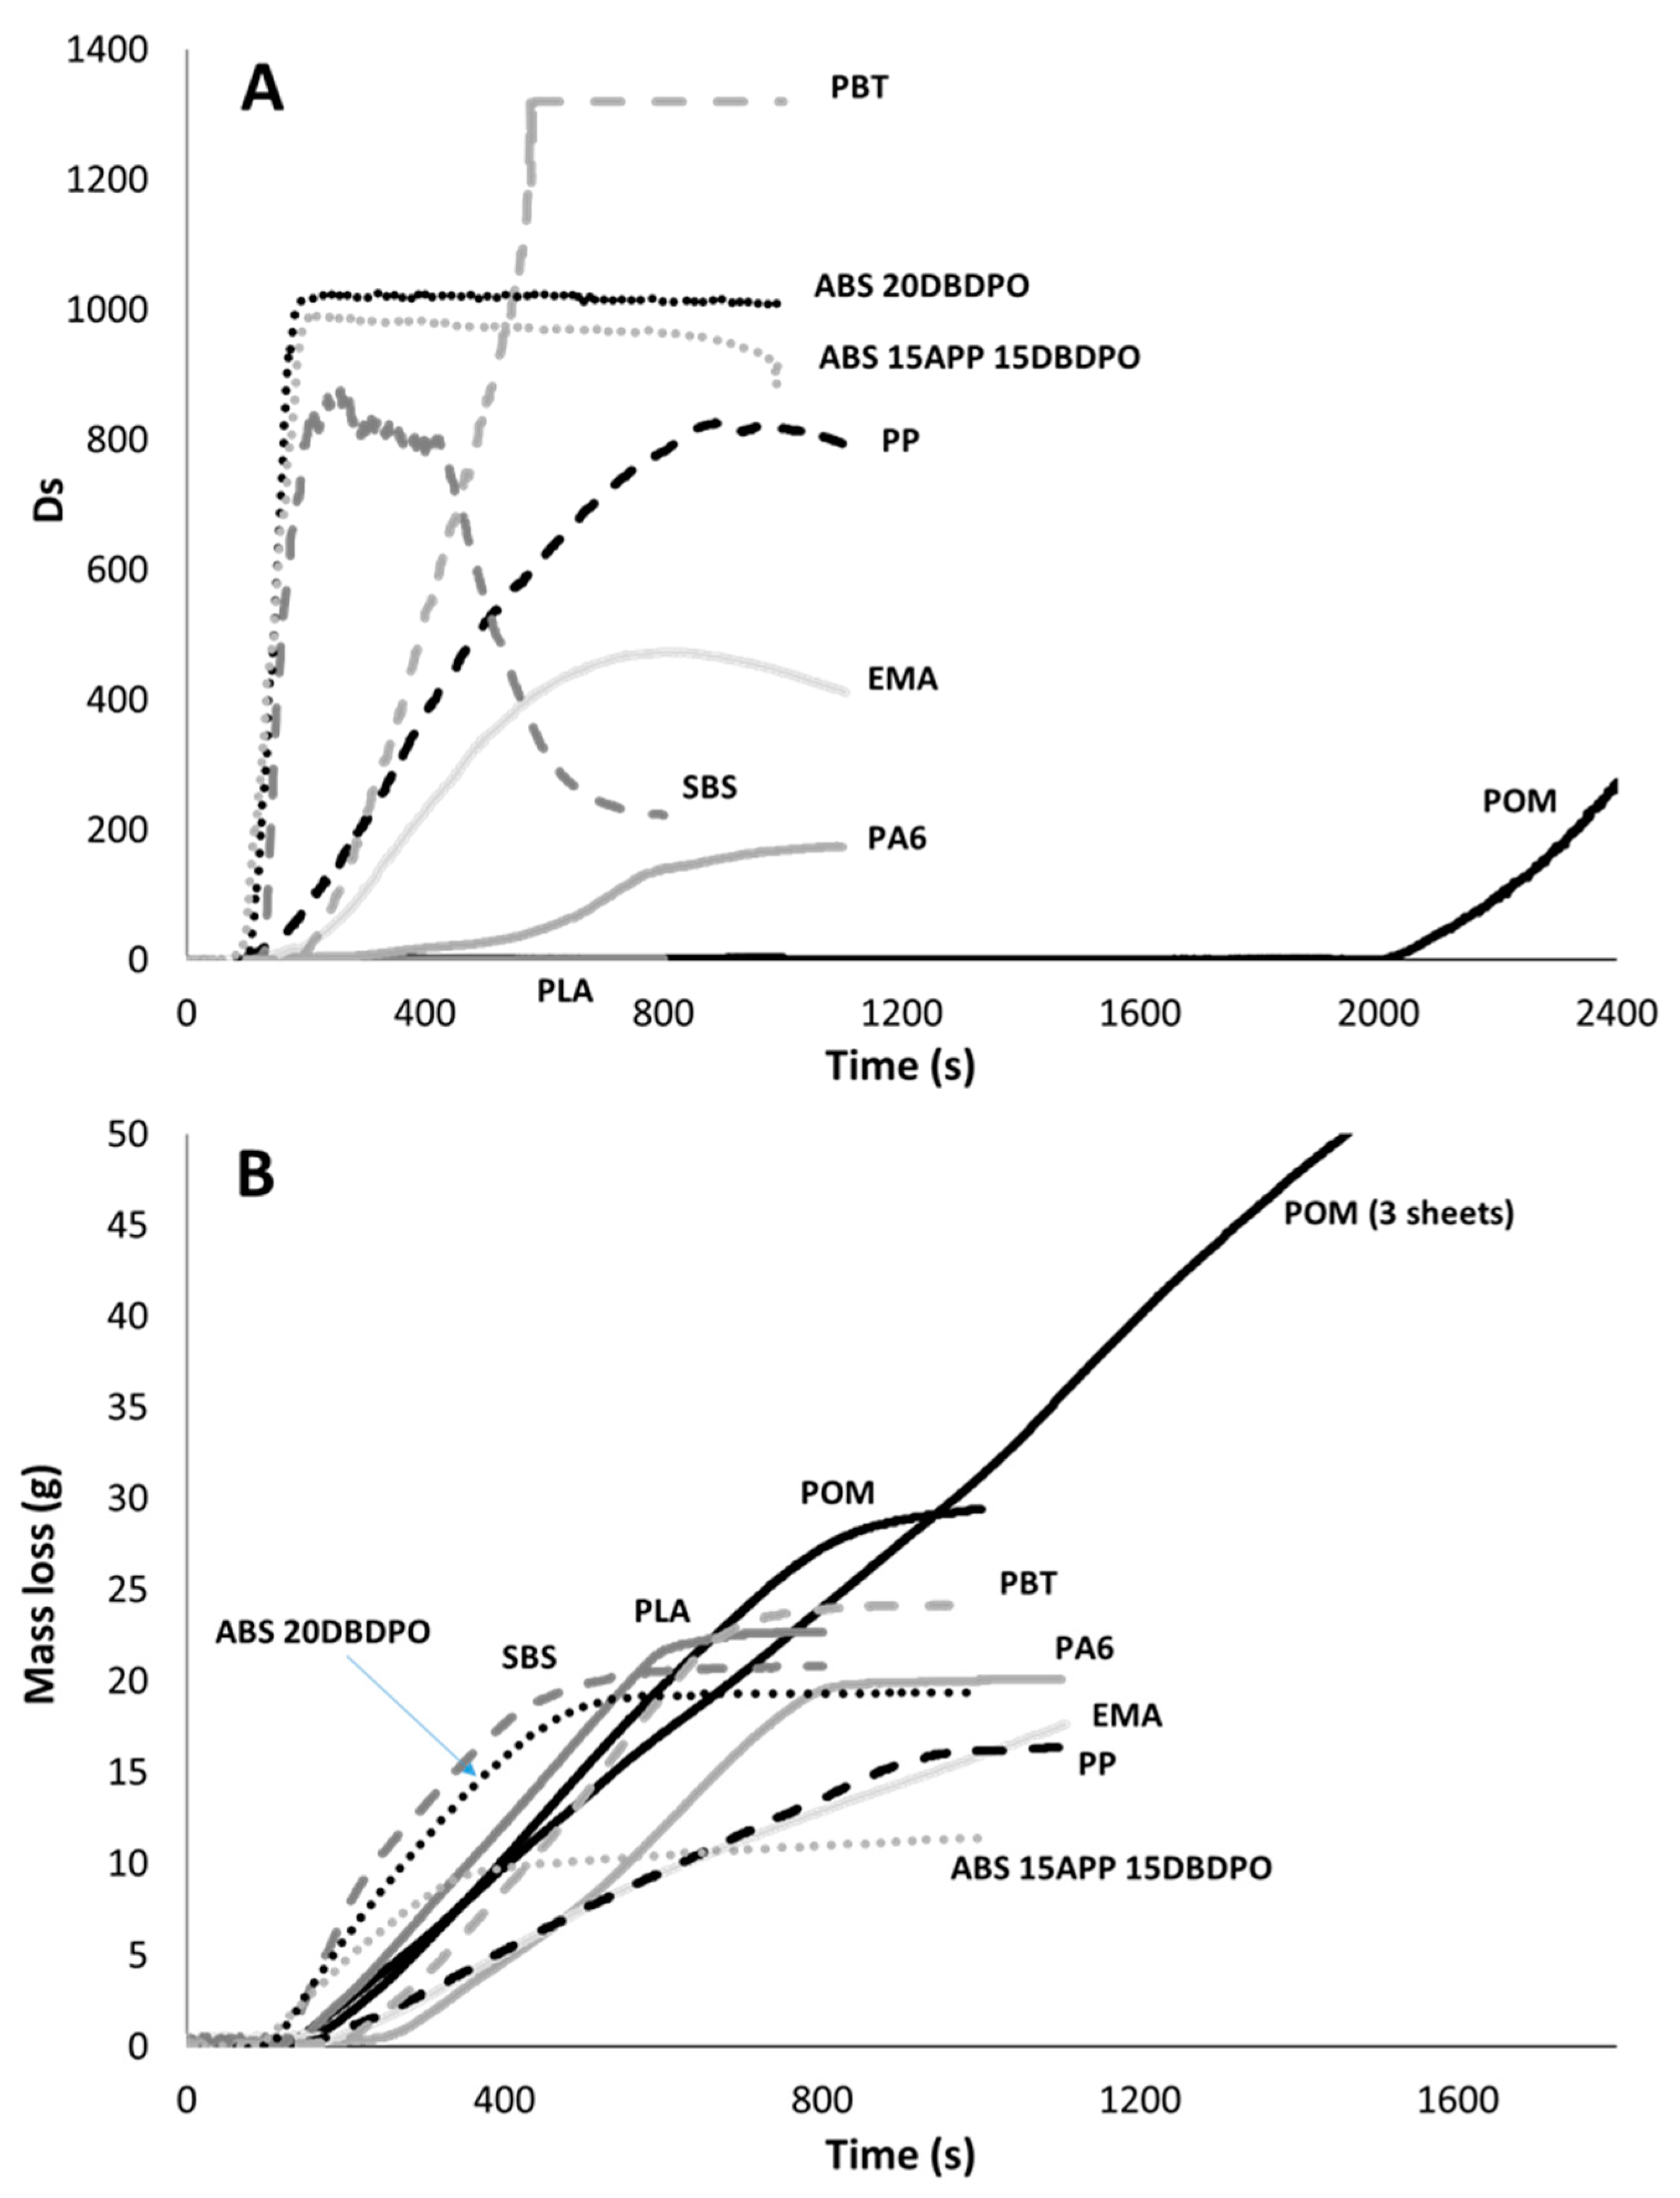
In many articles, the mass loss rate is not considered and only the smoke density is provided. Several curves Ds = f(time) and MLR = f(time) are shown in Figure 8. It is noteworthy that some polymers do not produce smoke (Ds ≈ 0). These polymers (POM and PLA) are those for which the smoke in the cone calorimeter is also null. When three sheets of POM are tested (total mass = 96 g), Ds starts increasing after flaming out. At this time, the remaining mass is 30 g. In other words, the mass loss was 66 g. Since the heat of combustion of POM is 14 kJ/g, 2.23 mol of O2 has been consumed at flame out. It represents almost 50% of the oxygen present in the smoke chamber (considering that air contains 20 wt% of oxygen). It is by far the highest oxygen consumption in our experiments. Of course, this is a rough overestimation, while the effective heat of combustion is not known and may be lower. PA6 produces a moderate amount of smoke (Ds reaches around 180). Other materials produce much more smoke and the maximum Ds is in the range of 470–1320.
It can be noted that Ds starts increasing before ignition, but its value remains quite limited (<30). After ignition, Ds increases regularly to reach high values (600–1000). The signal transmission is very low when Ds reaches such values. At the end of the test, Ds may stabilize even if the decomposition is not finished (see, for example, SBS curves: Ds reaches a plateau before 200 s and decreases after 400 s, while the mass loss rate tends to 0 only after 500 s). Ds is likely to decrease (SBS, PP or EMA), maybe due to soot deposition on the chamber walls. In a recent paper dealing with flame retarded PA66, Goller et al. assigned the decrease of Ds in NBS smoke chamber to the gravitation of particles [19]. In one case (PBT), Ds increases very fast before stabilizing at 1320.
Smoke production was calculated according to the method already presented (Equation (5)), i.e., RSR was calculated using smoke properties B and MLRth. RSR is given equal to 0 when MLR < MLRth. As smoke is accumulated in smoke chamber test (this is a major difference with cone calorimeter test), TSR was calculated as the area under the curve RSR = f(time) (Equation (7)). Finally, TSR was compared to optical smoke density Ds. This method was applied after time-to-ignition. Before TTI, smoke production was considered null. As already stated, Ds is always low before ignition. Note that this method uses the mass loss rate measured in the smoke chamber but also the smoke properties measured in the cone calorimeter at an arbitrary heat flux.
{ TSR = 0 t RSR ( t ) dt For   t > TTI ,   RSR = max ( 0 ; B × ( MLR MLR th ) ) For   t < TTI ,   RSR = 0
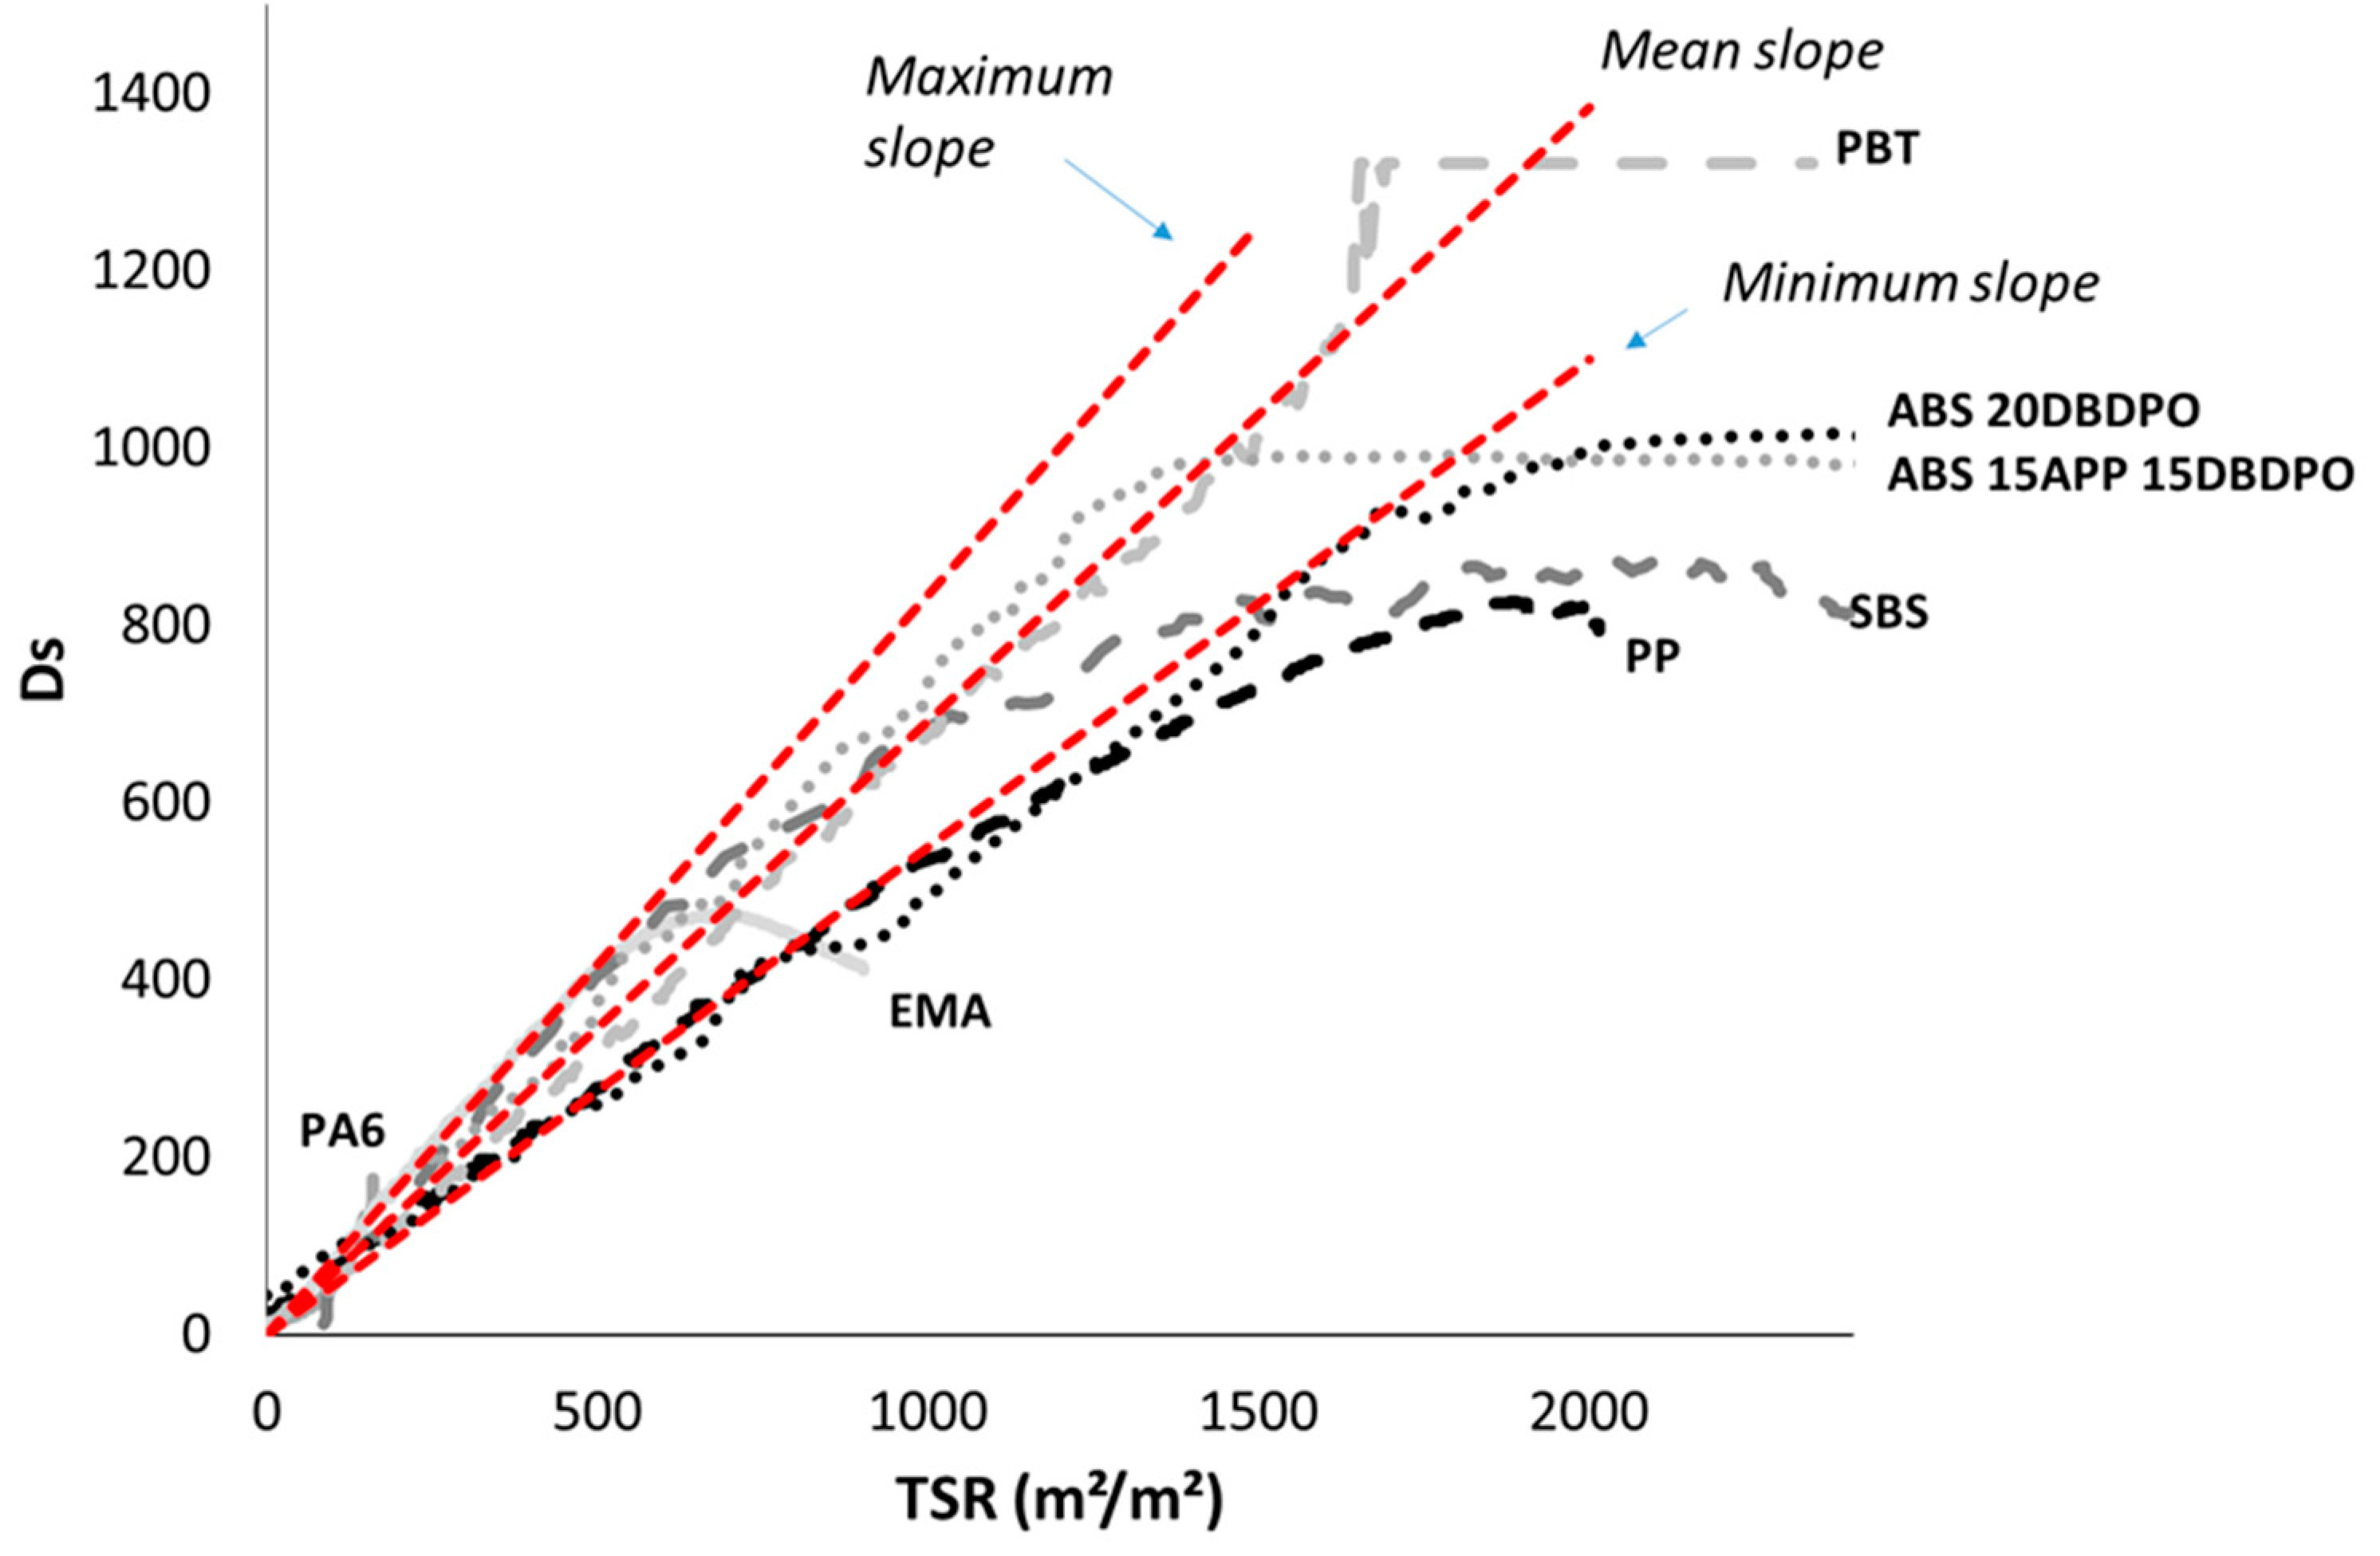
Figure 9 shows the relationship between Ds and TSR for various materials. During the main part of the test, all the curves Ds = f(TSR) evolve in a narrow range between two curves of minimum and maximum slopes (respectively, 0.55 and 0.83). In other words, considering a mean value 0.69, it can be proposed that
Ds = 0.69 × TSR
While this constant value is independent of the material or heat flux, it means that it is only related to the apparatus (chamber volume, detector…).
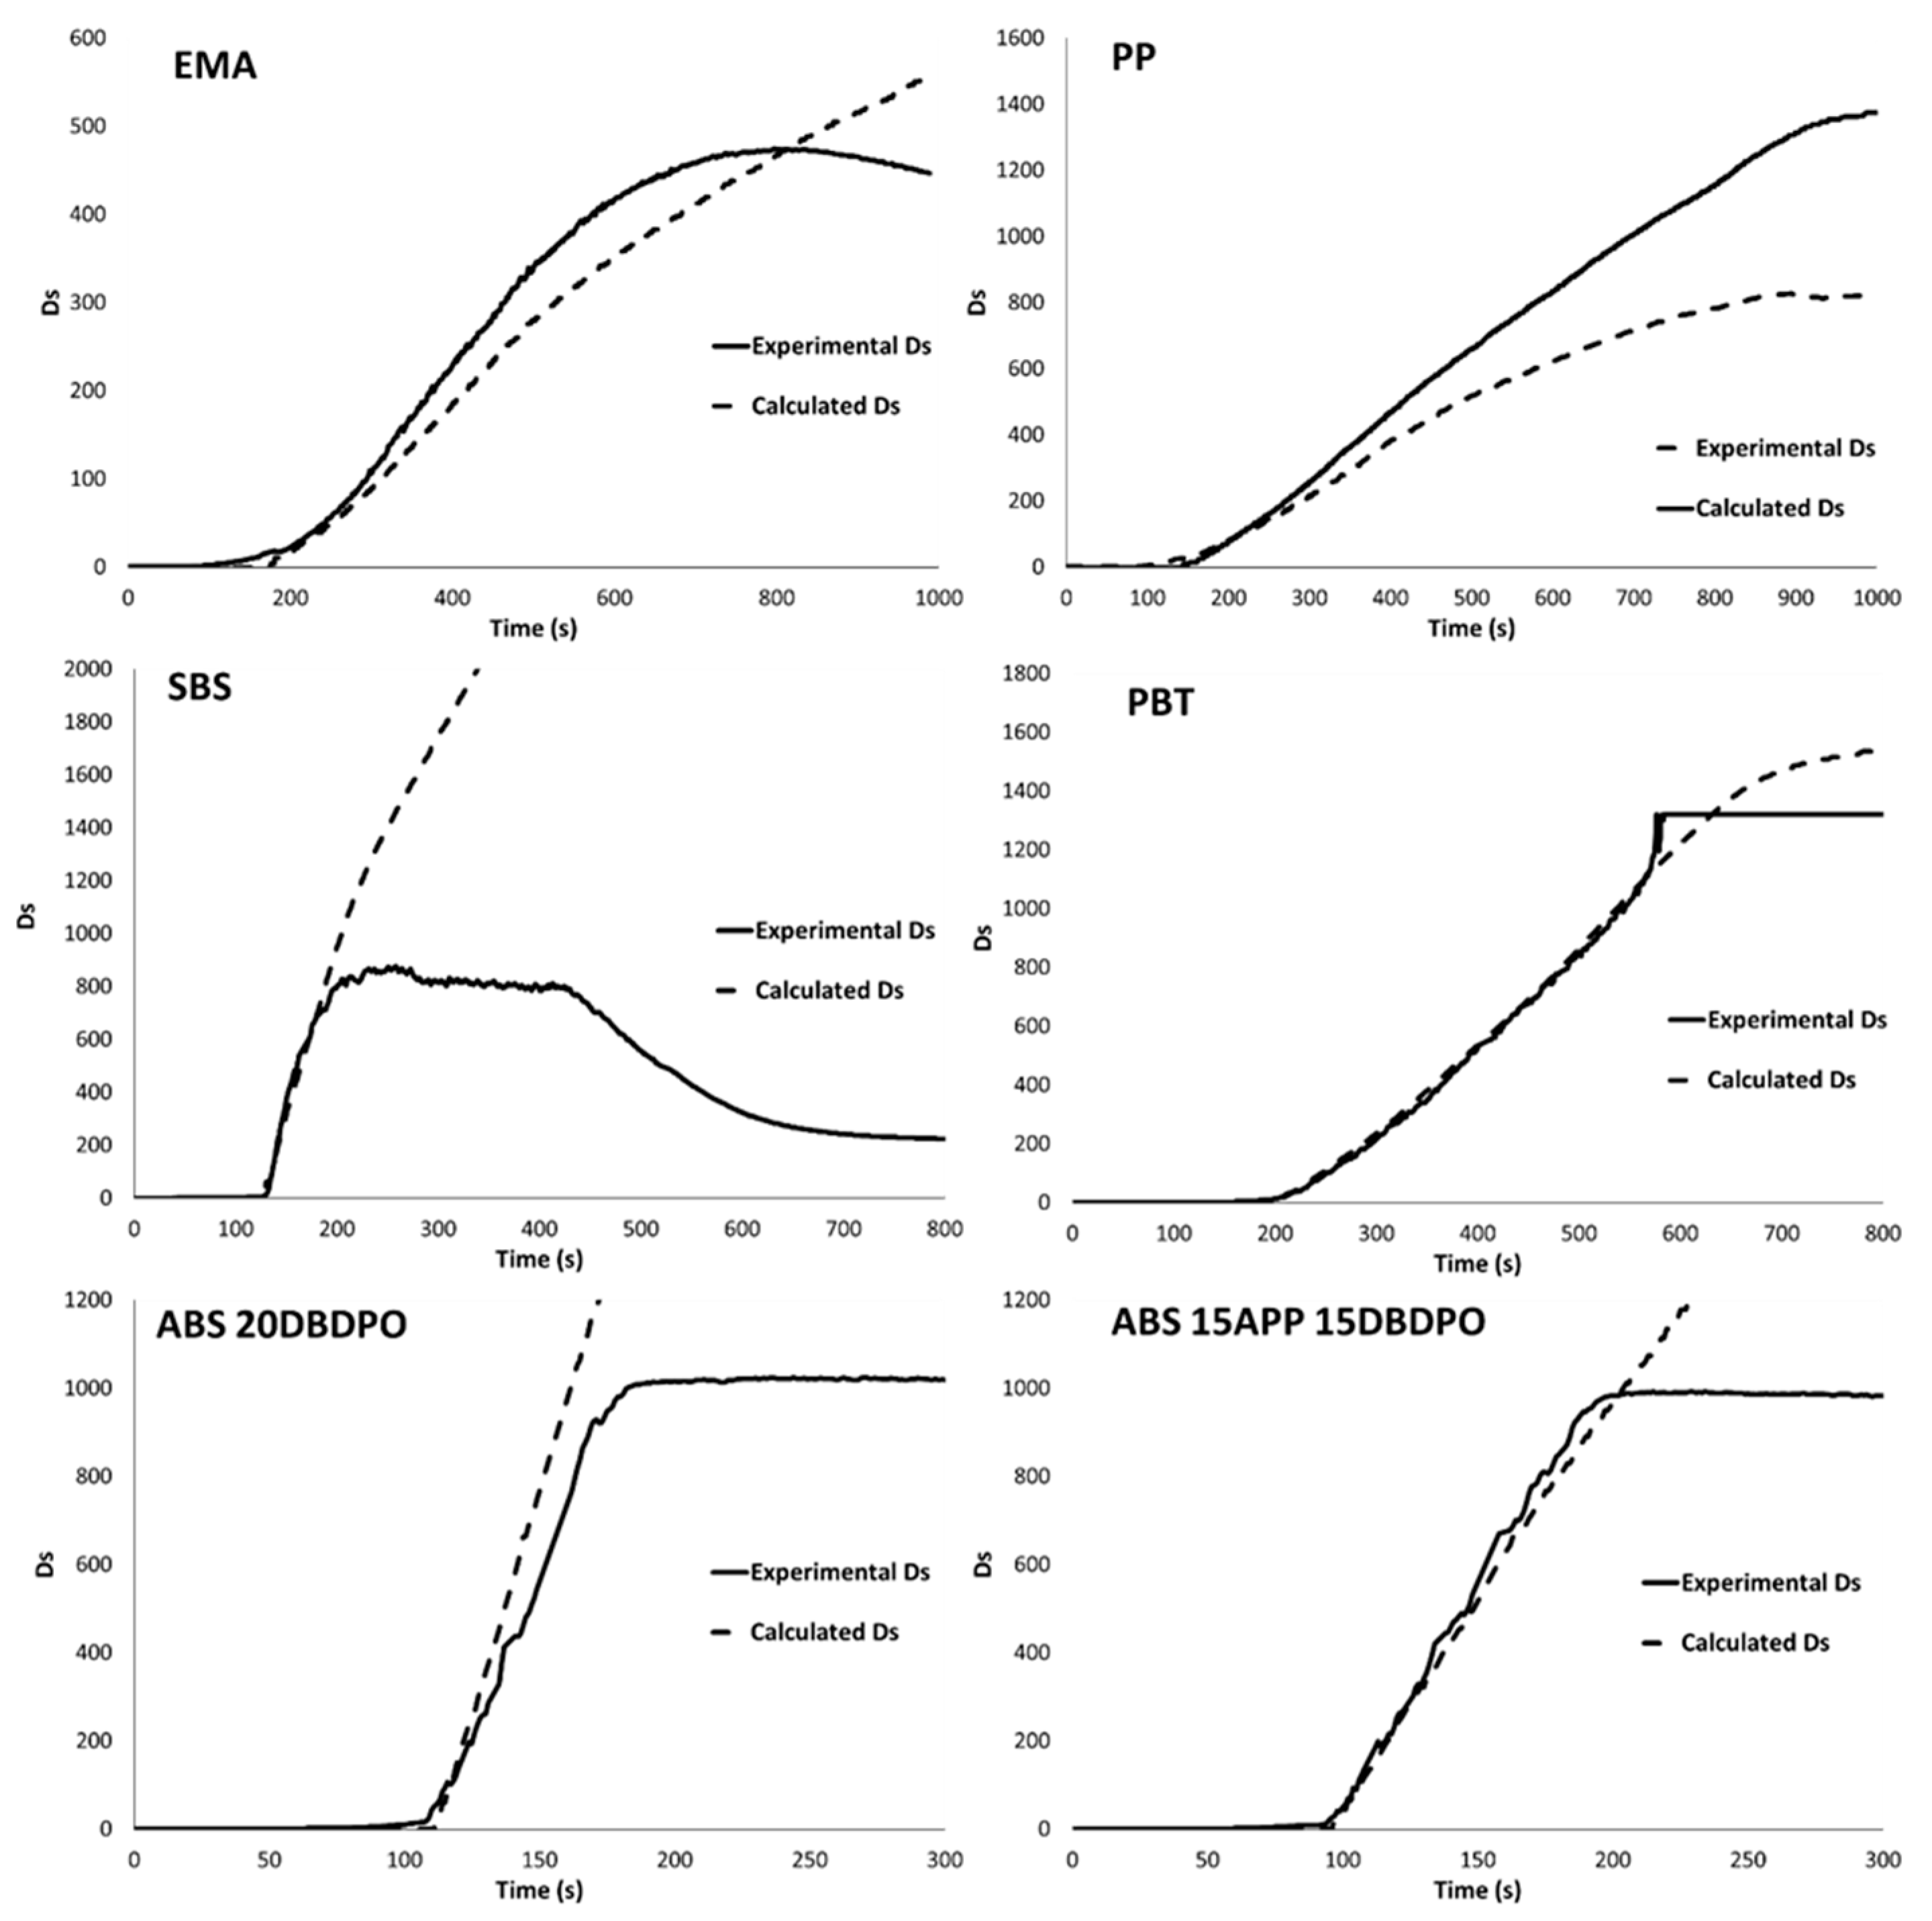
Figure 10 shows the experimental curves Ds = f(time) together with the calculated ones using Equations (7) and (8) for the seven materials producing the most amount of smoke. A remarkable agreement can be observed for most materials. The fit is less satisfactory for PP and EMA. The calculated Ds at 500 s is 657 and 279, respectively (versus 518 and 339 for experimental Ds).
Of course, the calculated Ds tends to continuously increase as long as decomposition occurs. The phenomena occurring at the end of the test, especially a plateau before the decomposition is finished or with a decrease of Ds, cannot be properly fitted. This plateau may be an artefact due to a very low light intensity. This limitation may negatively impact the prediction of smoke production when this prediction is based on a single value, as Ds after 4 min (if the plateau is reached before 4 min) or the maximum value of Ds. However, practically, such a plateau is reached only for materials releasing a large amount of black smoke.
In the previous section, the prediction of Ds still needs the knowledge of TTI and mass loss rate in the smoke chamber. ABS filled with 20 wt% of APP was also tested at 25 kW/m2 in the cone calorimeter. The smoke production in the smoke chamber was calculated using the mass loss rate curve obtained in the cone calorimeter and the smoke properties listed in Table 1 (previously calculated using cone calorimeter data at 50 kW/m2).
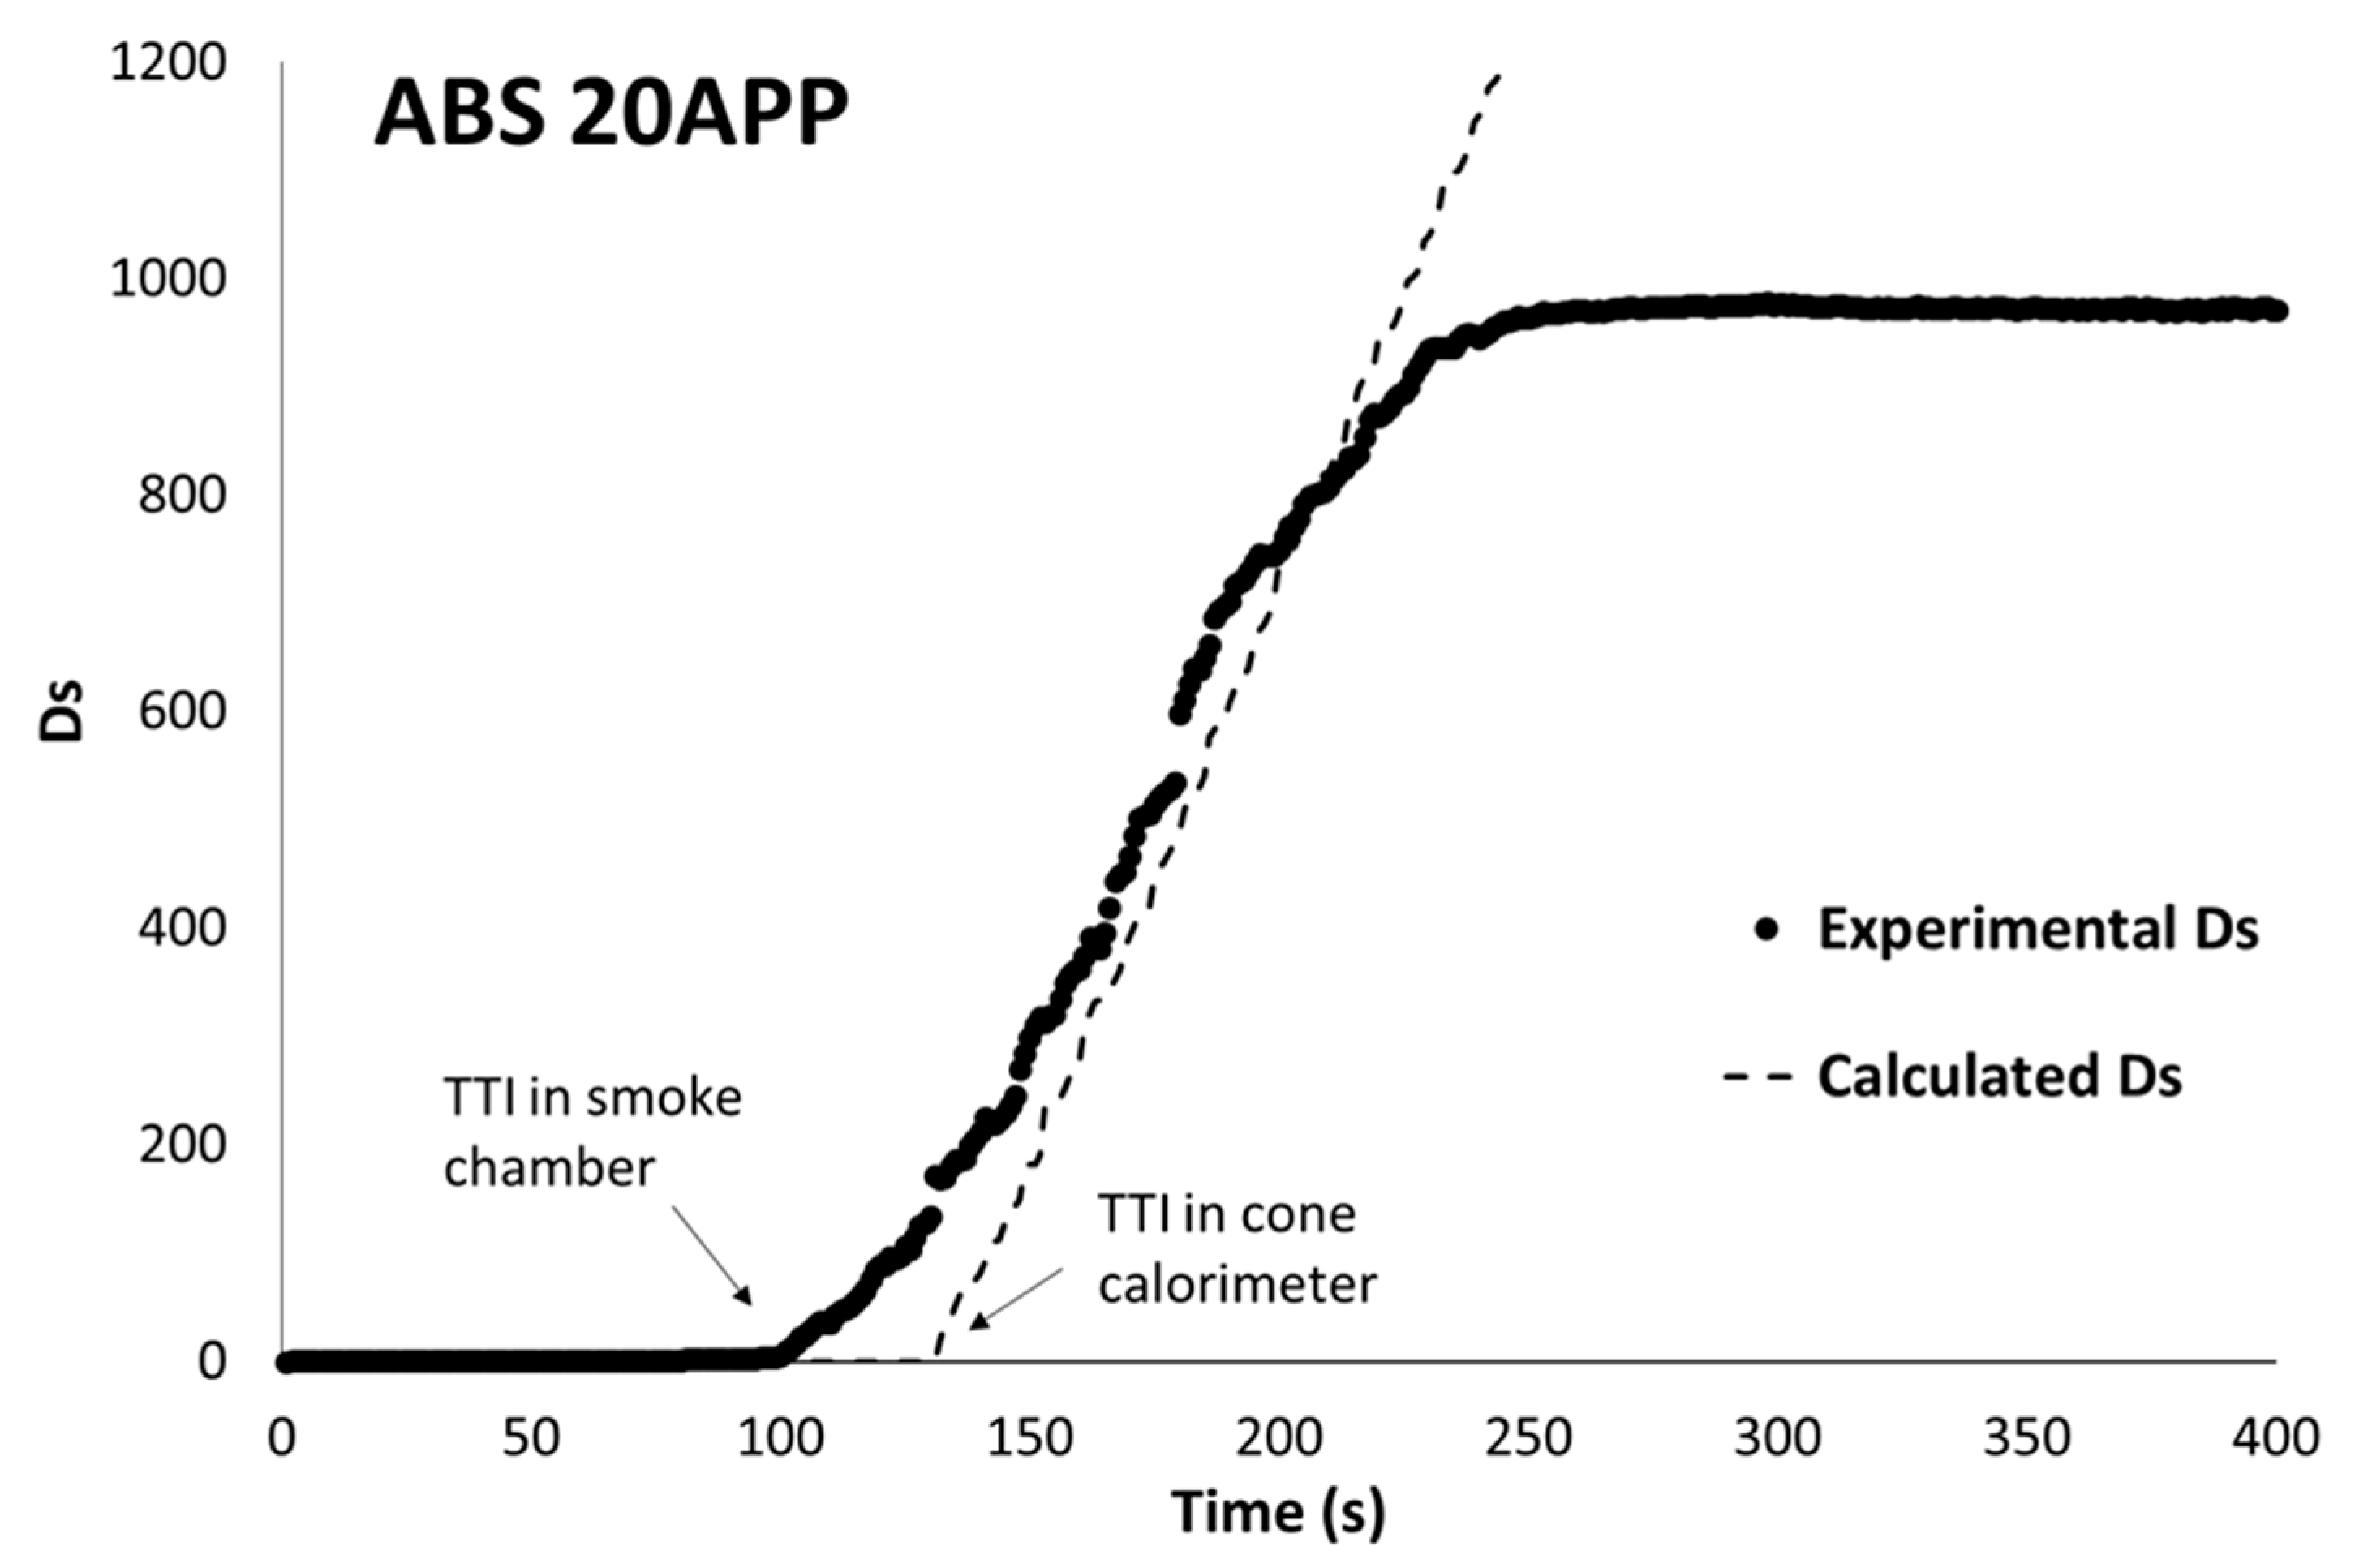
The comparison between calculated and experimental curves Ds = f(time) can be seen in Figure 11. In the 200–800 Ds range, the slopes of the curves Ds = f(time) are 7 and 10.5 s−1, respectively, for experimental and calculated curves. The experimental curve reaches a maximum value (973) above which the optical density does not increase anymore. There is also a shift at the beginning of the curve because the time-to-ignition was shorter in the smoke chamber (100 s) than in the cone calorimeter (133 s), possibly due to an edges effect (sample area is smaller in smoke chamber). On the whole, the calculated curve provides quite a good approximation of experimental values only by using cone calorimeter data.

3.4. Discussion

These results evidence that the optical density in the smoke chamber is well correlated with the total smoke release in the cone calorimeter at the same heat flux, i.e., 25 kW/m2. The decomposition rate should be the same in both devices, but practically, some differences in TTI may be detrimental to an accurate prediction of smoke production.
Intrinsic smoke properties remain useful firstly because they provide a way to quantitatively assess the effect of FR on smoke production. For example, ATH or MDH are not smoke suppressants. Their incorporation decreases the smoke release only because the decomposition rate is reduced. On the contrary, the role of halogenated FR (DBDPO) as a smoke promoter is well evidenced. Phosphorus FR (including when they act mainly or fully in condensed phase as APP) also tends to increase the smoke production but to a much lower extent. The intrinsic smoke properties make it possible to compare various couples (polymer, FR) in order to design new low-smoke materials.
The intrinsic smoke properties also allow calculating the smoke production for an arbitrary fire scenario according to two modes: with or without smoke accumulation. A and B can be easily calculated but HRRth (and MLRth) may be more difficult to measure properly. This may explain why the prediction is less satisfactory with EMA and PP (for which HRRth is high and maybe overestimated—see Appendix A).
There is no difference in nature between both modes. The correlation between smoke production in the cone calorimeter (without accumulation) and in the smoke density chamber (with accumulation) is simple and reliable. It means that the vitiated atmosphere in the smoke chamber has no effect on smoke production or, more certainly, that the oxygen in the large smoke chamber is not consumed enough to severely impact the smoke production.

4. Conclusions

Smoke production (i.e., optical density Ds) was successfully calculated in the smoke chamber considering the mass loss rate and intrinsic material properties calculated from cone calorimeter tests. The mass loss rate curve in the smoke chamber may be also assessed from the cone calorimeter test at the same heat flux (namely 25 kW/m2), allowing a complete prediction from the cone calorimeter.
It means that the total smoke release in the cone calorimeter at 25 kW/m2 (i.e., the area under the curve RSR = f(time)) is well correlated to the optical density in the smoke chamber, although the smoke accumulates in this last apparatus without renewing oxygen. Discrepancy can be observed after a long time when optical density is very high, maybe due to additional phenomena, including oxygen depletion or soot deposition on chamber walls.
It can be assumed that the volume of the smoke chamber is high enough to avoid the atmosphere becoming vitiated during a long period. We expect that this work will allow a huge gain in time because cleaning the smoke chamber between successive tests is a harsh operation.
Additionally, it has been highlighted that intrinsic smoke properties calculated from cone calorimeter data can be used as a quantitative assessment of the role of FR as a smoke suppressant or promoter.

Author Contributions

Conceptualization, R.S.; methodology, R.S.; validation, All; formal analysis, R.S., M.V., C.B. and L.D.; investigation, L.D., C.B. and M.V.; resources, R.S. and L.F.; data curation, R.S.; writing—original draft preparation, R.S.; writing—review and editing, All; supervision, R.S.; project administration, R.S. and L.F.; funding acquisition, R.S. and L.F. All authors have read and agreed to the published version of the manuscript.

Funding

This research received no external funding.

Institutional Review Board Statement

No applicable.

Informed Consent Statement

Not applicable.

Data Availability Statement

Data can be provided on request.

Acknowledgments

The authors thank Camille Licour and Colin Raoul for their help to carry out the first preliminary tests in the smoke density chamber. ACOME and ARKEMA companies are acknowledged for their financial support.

Conflicts of Interest

The authors declare no conflict of interest.

Appendix A

Figure A1 shows the change in calculated Ds when MLRth changes from 2.84 g/(s.m2) (the value calculated from data in Sonnier et al. [14]) to 0 (i.e., without HRR or MLR threshold, as usually observed for aromatic-based polymers). The influence of the choice of MLRth is significant, considering MLRth = 0 leads to non-negligible uncertainties. Nevertheless, for most of the polymers, the value of MLRth is much lower.
Figure A1. Experimental and calculated Ds versus time for PP–Ds was calculated considering two values of MLRth.
Fire 06 00109 g0a1

References

  1. Hong, T.-K.; Roh, B.-S.; Park, S.-H. Measurements of Optical Properties of Smoke Particulates Produced from Burning Polymers and Their Implications. Energies 2020, 13, 2299. [Google Scholar] [CrossRef]
  2. Mulholland, G.W.; Croarkin, C. Specific extinction coefficient of flame generated smoke. Fire Mater. 2000, 24, 227–230. [Google Scholar] [CrossRef]
  3. Tissot, J.; Talbaut, M.; Yon, J.; Coppalle, A.; Bescond, A. Spectral Study of the Smoke Optical Density in Non-flaming Condition. Procedia Eng. 2013, 62, 821–828. [Google Scholar] [CrossRef]
  4. Guo, H.; Walters, R.N.; Lyon, R.E.; Crowley, S. Effect of phosphorus on soot formation and flame retardancy in fires. Fire Saf. J. 2020, 120, 103068. [Google Scholar] [CrossRef]
  5. Babrauskas, V. Applications of predictive smoke measurements. J. Fire Flammabl. 1981, 12, 51. [Google Scholar]
  6. Hirschler, M.M. The measurement of smoke in rate of heat release equipment in a manner related to fire hazard. Fire Saf. J. 1991, 17, 239–258. [Google Scholar]
  7. Ostman, B.; Tsantaridis, L.; Stensaas, J.; Hovde, P.J. Smoke Production in the Cone Calorimeter and the Room Fire Test for Surface Products—Correlation Studies; Rapport I 9208053; Trätek: Stockholm, Sweden, 1992. [Google Scholar]
  8. Dietenberger, M.; Grexa, O. Correlation of smoke development in room tests with cone calorimeter data for wood products. In Proceedings of the 4th International Wood and Fire Safety Conference, Zvolen, Slovakia, 14 May 2000; Faculty of Wood Technology, Technical University of Zvolen: Zvolen, Slovakia, 2000; p. 45. [Google Scholar]
  9. Ou, S.; Seader, J. Correlation of Gravimetric Smoke Measurement by the Arapahoe Chamber with Optical Smoke Measurement by the NBS Chamber for Flaming Combustion. Fire Saf. J. 1977, 78, 135. [Google Scholar] [CrossRef]
  10. Tran, H.C. Quantification of Smoke Generated from Wood in the NBS Smoke Chamber. J. Fire Sci. 1988, 6, 163–180. [Google Scholar] [CrossRef]
  11. Molesky, F.; Falk, D.P. Comparison of Smoke Measurements of the Cone Calorimeter and ASTM E-662 Smoke Chamber in Flame Retardant Polypropylene. J. Fire Sci. 1991, 9, 60–68. [Google Scholar] [CrossRef]
  12. Cornelissen, A. Smoke Release Rates: Modified Smoke Chamber versus Cone Calorimeter-Comparison of Results. J. Fire Sci. 1992, 10, 3–19. [Google Scholar] [CrossRef]
  13. Flisi, U. Testing the Smoke and Fire Hazard. Polym. Degrad. Stab. 1990, 30, 153. [Google Scholar] [CrossRef]
  14. Sonnier, R.; Vahabi, H.; Chivas-Joly, C. New Insights into the Investigation of Smoke Production Using a Cone Calorimeter. Fire Technol. 2019, 55, 853–873. [Google Scholar] [CrossRef]
  15. Linteris, G.; Rafferty, I. Flame size, heat release, and smoke points in materials flammability. Fire Saf. J. 2008, 43, 442–450. [Google Scholar] [CrossRef]
  16. Sonnier, R.; Dumazert, L.; Livi, S.; Nguyen, T.K.L.; Duchet-Rumeau, J.; Vahabi, H.; Laheurte, P. Flame retardancy of phosphorus-containing ionic liquid based epoxy net-works. Polym. Degrad. Stab. 2016, 134, 186. [Google Scholar] [CrossRef]
  17. NF EN ISO 5659-2; Plastics—Smoke Generation—Part 2: Determination of Optical Density by a Single-Chamber Test. International Organization for Standardization: Geneva, Switzerland, 2017.
  18. Vangrevelynghe, M.; Le Nouvel, L.; Pesenti, C.; Sonnier, R.; Ferry, L.; Gesta, E.; Lagrève, C. A method to quantitatively assess the modes-of-action of flame-retardants. Polym. Degrad. Stab. 2022, 195, 109767. [Google Scholar] [CrossRef]
  19. Goller, S.; Krüger, S.; Schartel, B. No business as usual: The effect of smoke suppressants commonly used in the flame retardant PA6.6 on smoke and fire properties. Polym. Degrad. Stab. 2023, 209, 110276. [Google Scholar] [CrossRef]
Figure 1. RSR versus HRR in cone calorimeter for ABS filled 20 wt% of APP at two heat fluxes (25 and 50 kW/m2—two tests are plotted for this heat flux.
Fire 06 00109 g001
Figure 2. (A)/HRR versus time in cone calorimeter (50 kW/m2) for Elium resin filled with various contents of IL169. (B)/RSR versus time in cone calorimeter (50 kW/m2) for Elium resin filled with various contents of IL169.
Fire 06 00109 g002
Figure 3. (A)/HRR versus time in cone calorimeter (35 kW/m2) for epoxy resin filled with various contents of IL169. (B)/RSR versus time in cone calorimeter (35 kW/m2) for epoxy resin filled with various contents of IL169.
Fire 06 00109 g003
Figure 4. A value versus IL content in Elium and epoxy resins filled with IL169.
Fire 06 00109 g004
Figure 5. (A)/HRR versus time in cone calorimeter (50 kW/m2) for PE/EVA filled with ATH or MDH. (B)/RSR versus time in cone calorimeter (50 kW/m2) for PE/EVA filled with ATH or MDH.
Fire 06 00109 g005
Figure 6. (A)/HRR versus time in cone calorimeter (50 kW/m2) for ABS filled with APP and/or DBDPO. (B)/RSR versus time in cone calorimeter (50 kW/m2) for ABS filled with APP and/or DBDPO.
Fire 06 00109 g006
Figure 7. (A)/A values versus EHC for several series of polymers filled with FR. (B)/B values versus EHC for several series of polymers filled with FR.
Fire 06 00109 g007
Figure 8. Optical density versus time (A) and mass loss versus time (B) for materials tested in smoke chamber at 25 kW/m2.
Fire 06 00109 g008
Figure 9. Experimental Ds versus calculated TSR for materials tested in smoke chamber at 25 kW/m2.
Fire 06 00109 g009
Figure 10. Experimental and calculated Ds versus time for materials tested in smoke chamber at 25 kW/m2.
Fire 06 00109 g010
Figure 11. Calculated and experimental Ds versus time in smoke chamber for ABS filled with 20 wt% APP.
Fire 06 00109 g011
Table 1. Main intrinsic smoke properties.
MaterialsEHC in Cone Calorimeter (kJ/g)A (m2/kJ)HRRth (kW/m2)B (m2/g)MLRth (g/(s.m2))
Series A
POM14No smoke
PLA16
PA630.00.0062460.188.2
EMA34.60.0131000.452.89
PP40.80.0251161.022.84
SBS34.10.031−181.06−0.53
PBT19.60.026−50.51−0.25
Series B
Elium24.10.004NA0.10NA
Elium + 1 wt% IL16923.90.008NA0.19NA
Elium + 5 wt% IL16922.40.017NA0.37NA
Elium + 10 wt% IL16921.20.021NA0.43NA
Series C
Epoxy resin24.30.037NA0.90NA
Epoxy resin + 10 wt% IL16919.10.078NA1.48NA
Epoxy resin + 20 wt% IL16921.60.070NA1.51NA
Epoxy resin + 30 wt% IL16920.90.058NA1.21NA
Series D
PE/EVA35.40.014NA0.48NA
PE/EVA + 20 wt% ATH33.20.012NA0.39NA
PE/EVA + 20 wt% MDH33.80.011NA0.37NA
PE/EVA + 40 wt% ATH30.30.013NA0.39NA
PE/EVA + 40 wt% MDH31.00.012NA0.35NA
PE/EVA + 20 wt% ATH + 20 wt% MDH30.30.014NA0.42NA
Series E
ABS300.034NA1.03NA
ABS + 20 wt% DBDPO11.70.222102.620.87
ABS + 20 wt% APP25.10.05991.470.35
ABS + 30 wt% DBDPO8.60.245NA2.09NA
ABS + 30 wt% APP28.50.048NA1.37NA
ABS + 15 wt% DBDPO + 15 wt% APP14.10.150262.101.82
ABS + 40 wt% DBDPO7.10.265NA1.86NA
ABS + 40 wt% APP30.70.043NA1.33NA
ABS + 20 wt% DBDPO + 20 wt% APP11.40.169NA1.92NA
Disclaimer/Publisher’s Note: The statements, opinions and data contained in all publications are solely those of the individual author(s) and contributor(s) and not of MDPI and/or the editor(s). MDPI and/or the editor(s) disclaim responsibility for any injury to people or property resulting from any ideas, methods, instructions or products referred to in the content.

