
Exploring Variability of Visual Accessibility Options in Operating Systems


1
École Nationale Supérieure Polytechnique de Yaoundé, Université de Yaoundé I, Yaoundé P.O. Box 8390, Cameroon
2
LIRMM, University of Montpellier, CNRS, F34095 Montpellier, France
*
Author to whom correspondence should be addressed.
Future Internet 2021, 13(9), 230; https://doi.org/10.3390/fi13090230
Submission received: 31 July 2021
/
Revised: 31 August 2021
/
Accepted: 1 September 2021
/
Published: 4 September 2021
(This article belongs to the Section Big Data and Augmented Intelligence)
Abstract
:Digital technologies are an opportunity to overcome disabilities, provided that accessibility is ensured. In this paper, we focus on visual accessibility and the way it is supported in Operating Systems (OS). The significant variability in this support has practical consequences, e.g., the difficulty to recommend or select an OS, or migrate from one OS to another. This suggests building a variability model for OS that would classify them and would serve as a reference. We propose a methodology to build such a variability model with the help of the Formal Concept Analysis (FCA) framework. In addition, as visual accessibility can be divided into several concerns (e.g., zoom, or contrast), we leverage an extension of FCA, namely Relational Concept Analysis. We also build an ontology to dispose of a standardized description of visual accessibility options. We apply our proposal to the analysis of the variability of a few representative operating systems.
1. Introduction
Digital technologies provide many opportunities, including overcoming a disability and simplifying access to knowledge and services [1,2,3]. Several initiatives and laws, e.g., the Americans with Disabilities Act (https://adata.org/topic/technology-accessible, accessed on 1 September 2021), promote full participation of individuals to all areas of the society and reduction of discriminations, including the digital sector [4]. For fostering software accessibility on personal computers and mobile devices, computer accessibility guidelines and standards have been proposed by organizations [5], including the International Organization for Standardization, the International Electronical Commission [6], the European Commission, the US Congress [4], and the W3C [7,8,9,10].
In this paper, we focus on visual accessibility in operating systems (OS). Vision is the focal point of the recent studies in software accessibility [5]. Unfortunately, there is no unique reference for software accessibility [5,11] and OS manufacturers make various interpretations of the existing international recommendations [4]. As a consequence, each OS proposes its own set of visual accessibility options, with specific terms, organization and implementation. This variability has a number of practical consequences. We hereafter mention just a few. During requirement analysis, it may be challenging for a manufacturer to both integrate international recommendations and analyze competing OS, in order to identify core solutions, or to propose advanced ones. For end users, finding the OS that best matches their needs may be tricky. In addition, when users need to move to a new system, it is difficult to assist them to select the OS preserving a significant part of their current settings. This is very sensitive for users who have specific needs, especially those who are visually impaired. For a single option, this may be relatively easy, e.g., a user wishing option “invert colors” will find it in Android, iOS, MacOS and Ubuntu, but not in Windows. However, if the user has complex settings, composed of many specific options, it might be difficult to find which system will provide the same or the closest configuration from OS descriptions with different vocabulary and presentations.
Solutions to these issues involve comprehending OS variability. This can be based on comparative studies, metrics, classifications and mappings between needs and OS. Comparative studies, classification and mappings are addressed in studies on OS accessibility that have been conducted in the past on a limited set of OS and options [12,13,14,15]. They mainly present and discuss tables that show which option appears in which OS, and they remain at a coarse-grained level of description. These results are evidently useful, but we think that it is possible to go beyond texts and tables and propose another approach for analyzing and rendering variability at a fine-grained level. In particular, we would like to provide a variability model supporting more assistance tools. e.g., finding the OS providing a configuration best-matching the user needs or previous settings is not easy with a table, especially if there are no details on options implementing a high-level feature, or if there are many columns. Variability metrics are surveyed in [16]. Some of them are directly connected to our work and some correspond to code variability that we do not approach. Here, we aim to propose a variability model which can be navigated, and metrics.
The approach we propose is based on Formal Concept Analysis (FCA, [17]). This framework builds classifications (also called conceptual structures) in which concepts group similar objects. The hierarchical structure (concept lattice) highlights commonalities and differences. In addition, it provides an easy support for navigation in the classifications [18,19,20]. We also leverage an extension of FCA, namely Relational Concept Analysis (RCA, [21]), to analyze variability along separate concerns, such as contrast and color theme, text style, brightness or zoom. With RCA, we analyze variability within each concern, and considering all of them as well. As FCA applies to standardized descriptions, which do not exist for all visual accessibility options in OS, we build an ontology. We develop an exploratory case study, where we observe different types of variability relationships on eight operating systems.
To summarize our contributions, we propose:
- A methodology to build a variability model in the form of conceptual structures. This model can be navigated to comprehend variability. It can also be observed through various metrics. The novelty is that it allows us to analyze variability along separate concerns, or as a whole. The variability model is a classification built with a fine-grained knowledge on options. It thus opens the possibilities, for example, to help manufacturers to position their offer with respect to competing ones, to help users to choose an OS from scratch, given their preferences or needs, or to find an OS providing settings close to their current settings in another OS by introducing their settings in the classification (i.e., classifying the settings).
- An ontology for visual accessibility options stemming from representative OS and the mappings between the OS terms and the ontology concepts. The existence of the ontology is useful in this work to standardize the vocabulary and build an OS classification. Outside this work, it may serve as the basis for other tasks. During OS development, it may sensitize developers, help to standardize the documentation, structure the work along a package hierarchy and test cases, and have a harmonized description over different versions. If a documentary base is built on visual accessibility, the ontology may be used to improve efficiency and reduce ambiguity in document indexing and query expression. For teaching and communicating on visual accessibility, it may be used to organize the presentation of visual accessibility features, and the mappings help in understanding how and where the features are implemented. In addition, the ontology may help in sketching questionnaires to capture the user’s needs.
- A proof-of-concept with an exploratory case study. This case study includes several OS from the mainstream OS families. This case study is guided by the research question “How do accessibility options vary in practice?”. We answer by observing feature relationships (omnipresence, co-occurrences, binary implications, mutual exclusions) and operating system relationships (similarity, superiority, incomparability).
In Section 2, we draw the outline of the approach, which follows the knowledge discovery process proposed in [22]. Data preparation is detailed in Section 3. Section 4 presents the selected data mining method (FCA and RCA) and how it applies in our context. Section 5 shows how results are interpreted. Section 6 develops the exploratory case study. Section 7 discusses related work. We conclude and draw future research directions in Section 8.
2. Outline of the Variability Model Building
To build the variability model, we follow the general view of the Knowledge Discovery process presented in [22] and largely adopted in the literature. This process is outlined as a linear flow, although steps may be repeated to consolidate results. During the first major step, data preparation, data is selected, pre-processed and transformed to conform to the chosen data mining method and tool input. Data mining algorithms are applied during the second step. They output knowledge patterns, that are subject to interpretation in the third step: they are analyzed, post-processed and delivered to domain experts. Figure 1 draws the main steps of our implemented KD process.
Data preparation step (see Section 3) is composed of several sub-steps. The first one consists in selecting representative operating systems (Section 3.1). Then, in Section 3.2, we formalize the domain knowledge of each single operating system in a Feature Model (FM). This corresponds to a) a list of features (also called options in our paper) and b) hierarchical relationships between these features. FMs are variability models used in Software Product Line Engineering [23,24]. We manually build these FMs during an exhaustive navigation of the accessibility option set. To this aim, we explore the user interface provided by the operating system. Vocabulary and organization of these FMs are very different. Thus, we also manually build a domain ontology, capturing concepts of the studied visual accessibility mechanisms (Section 3.3). This ontology is used to have a standard description. In addition, we establish a mapping between each option of each single operating system and one ontology concept (Section 3.4). This mapping ensures that a correspondence exists between: the interpretation and vocabulary used in each operating system version, on one side, and the common domain knowledge, on the other side. The last part of data preparation consists in translating and enriching the descriptions of the different accessibility option sets. This is made using the ontology concepts to obtain a consistent and standardized description. Section 3.5 explains how we encode these descriptions in a simple data model composed of objects, boolean attributes and binary relations between objects (RCFT). This data model conforms to the input of Relational Concept Analysis (RCA).
Data mining step (Section 4) uses RCA to build a set of interconnected conceptual structures. The final variability model is composed with these structures. They exhaustively contain logical variability information.
During Interpretation step (Section 5), we post-process the conceptual structures with a tool for extracting variability relationships. We also navigate them to produce knowledge that can be delivered to non-experts. In the future, this analysis could be guided by appropriate tools. This would enable non-experts to interpret the output.
In what follows, the data preparation step is illustrated using the real description of the brightness mechanism in representative operating systems (those that are used in the case study). This mechanism is indeed sufficiently small in these systems. Brightness is also chosen because of its primary importance to assist people with low vision. Then the following steps are illustrated with a small fictitious yet realistic example. It includes five operating systems, and options inspired by four mechanisms (contrast, text style, brightness and zoom). It has been chosen to illustrate all the possible situations.
3. Data Preparation
This step builds data conform to the input of the data-mining method (Relational Concept Analysis). It comprises five sub-steps: selection of representative operating systems (Section 3.1); building of Feature Models (Section 3.2); building of an ontology (Section 3.3); mapping between the FMs and the ontology (Section 3.4); building of a set of binary tables for RCA (Section 3.5).
3.1. Operating System Selection
To have a variety of systems, we consider a few versions of widely used operating systems, that we expect representative: , /, and . They are used to explain the first steps of data preparation and in the case study. We analyze 8 different operating systems, two from each family: , , , , , , and . In these systems, we consider separately four mechanisms: brightness, contrast and color, text style and zoom. This division has been proposed by one co-author who is an expert in visual accessibility for persons with low vision.
3.2. Modeling Accessibility Mechanisms through Features Models
The formalism for modeling options in a single operating system is borrowed from the product line engineering paradigm [25]. In this paradigm, the high-level features are gathered in feature sets and then organized into Feature Models (FMs). FMs are kinds of logical trees [23,24]. The nodes represent the features and the child-parent edges represent various types of refinement. Decorations on edges give information about optionality versus obligation, and about feature groups (Or, Xor). The FMs also include textual logical constraints. At the data-mining step, we will consider only the features and child-parent relationships. Textual constraints will not be considered in this paper. Nevertheless, we thought useful to formalize them for exhaustive description and further research. Figure 2 (left-hand side) shows the FM for brightness in operating system . In this system, an end user configuration contains or may contain:
- the root feature (mandatorily);
- feature (mandatorily);
- feature (optionally);
- features and (mandatorily).
Let us note that alternative modeling could be done during this phase. For example, all possible values of brightness (if in finite number) could be shown as different features in an Xor group, rather than making explicit an interval and its bounds. FM building is summarized as follows (Box 1).
Box 1. Feature Model building.
FM building. Let us denote the set of operating systems by and the set of mechanisms by . At FM building step, , we build the Feature Set and the Feature Model . The whole feature set is denoted by . The relation associating the systems with the features they own is denoted by .
We do it concretely by exhaustively and manually exploring the accessibility options as users who would be creating their accessibility profile. We use the path which allows us to find the options of the mechanisms through the user interface to incrementally add the options and organize them in the FM. The FM is built with FAMILIAR (https://familiar-project.github.io/, accessed on 1 September 2021) (FeAture Model scrIpt Language for manIpulation and Automatic Reasoning) [27]. Figure 2 shows two FMs for brightness. The other FMs can be seen in the online repository (https://gite.lirmm.fr/AccessibiliteNumerique/osvisualaccessibilityoptions, accessed on 1 September 2021).
3.3. Ontology Construction
Some high-level domain options with the same name share the same meaning in several systems, e.g., and provide options called (increase brightness). However, for other terms, there is a need of clarification and standardization. We here use ontologies as a specification of a conceptualization designed for the purpose of enabling knowledge sharing and reuse [28]. We illustrate this with the brightness mechanism.
- Some options have the same meaning (e.g., “adjust automatically brightness”), but different names (e.g., in and in ); in and in seem to be synonyms as well.
- Some options can be considered as specializations of others (and the corresponding names can be considered as hyponyms), e.g., term of , where this term means “manually set brightness”, can be considered a specialization of term and in .
- Some options gathered during the manual exploration of systems do not describe brightness concepts, they correspond to paths in user interface, such as OpenDisplayPreferences in . We consider that they are accidentally present for our analysis.
To standardize these descriptions, we designed an ontology composed of 4 parts, one per mechanism (they also can be considered as 4 ontologies). The ontology plays the role of a formal and common vocabulary composed of concepts and relations. Each option of a particular system can be mapped onto one ontology concept. In practice, to build the brightness ontology, we analyzed the features in all the systems and we modeled and organized the underlying concepts. The brightness ontology is shown in Figure 3. It highlights the concept which can be specialized into two types of setting functionalities: and , represented by two sub-concepts. The first consists of enabling or disabling: if the user enables it, the system automatically sets the value. For the second one, the user chooses one value among a set of values. As a result, we define the concept as a specialization of . Alternatively the setting consists to increase (resp. decrease) the brightness level. That is why we define the concepts and as specializations of .
In addition to specialization, other relations can be included in the ontology, and numerical values need to be represented. For example, in the text style ontology, we establish between concepts and (see Figure 4).
The ontology has been technically developed using the Conceptual Graphs ontology editor CoGui (http://www.lirmm.fr/cogui/3/, accessed on 1 September 2021) [29]. CoGui ontologies can be exported into Protégé (https://protege.stanford.edu/, accessed on 1 September 2021) ontologies.
3.4. Feature-to-Ontology Concept Mapping
In parallel, a mapping between the specific features and the ontology concepts is established. Table 1 shows the 8 OS brightness features mapped onto the ontology. This is schematized for and in Figure 5. This mapping is very important because it traces the identified correspondences. It is also used to build standardized input data for the data-mining step. It shows, for example, that of and of are mapped to . of is mapped onto concept, making it a specialization of on which of is mapped. Accidental options, such as or are discarded from the ontology and the mapping. The two steps (ontology building and mapping) are summarized as follows (Box 2).
Box 2. Ontology and mapping building.
Ontology and mapping building. We build the ontology feature concepts and relations, as well as the mapping between the specific operating system features and the ontology elements. The ontology element set is denoted by , and the mapping is denoted by .
3.5. Construction of the Data Mining Method Input
The selected data mining method, i.e., FCA and its RCA extension expect as input simple binary tables. The input table for FCA, called a formal context (FC), describes objects and their attributes. RCA considers several object categories. The objects are described by attributes, and by links to other objects of the same category, or of a different category. RCA expects a set of binary tables, called a Relational Context Family (RCF). These tables are of two kinds: formal contexts (FC), as FCA, and relational contexts (RC). RCA is used to study the mechanisms both independently and combined in systems. Each mechanism (e.g., brightness) is described by a formal context associating the implementations of this mechanism in systems to the corresponding options. Another central formal context globally describes the systems. It is left empty here, but could introduce some intrinsic attributes. Relational contexts associate each system to its mechanism implementations. We detail this description in the remainder of this section.
3.5.1. FCA Input: Formal Context (FC)
For each mechanism m, we build a formal context designed to describe the operating systems by their accessibility options, after terminology standardization. For example, Table 2 shows the formal context for brightness mechanism. It is built as follows.
- The objects of are the operating system implementations of m. The attributes of are the ontology elements, i.e., concepts or roles other than specialization (e.g., ). Roles and concepts both represent provided options using the standardized terminology.
- The incidence relation associates operating systems with ontology elements:
- A second rule encodes the ontology specialization. For example, has a feature mapped to , and is a subconcept of . Thus is associated in the formal context to both and (see in Table 2). Notice that initially, has no feature which is mapped to . This is an information which is added for the purpose of generalization and to better identify commonalities in the systems. Formally, for two ontology elements such that is a specialization of , if , then we also have .
3.5.2. RCA Input: Relational Context Family (RCF)
We switch to a fictitious smallest example, inspired by the real systems. This example allows us to illustrate all possible situations a conceptual structure may contain. We consider 5 fictitious operating systems: , , , , and . Figure 6 shows the parts of the ontology for 2 mechanisms (zoom, contrast) out of 4 (additionally including brightness and text style mechanisms). The whole example is available online (https://gite.lirmm.fr/AccessibiliteNumerique/osvisualaccessibilityoptions, accessed on 1 September 2021).
Table 3 shows the contrast formal context. It can be used separately to analyze each system with respect to contrast, as the formal context shown in Table 2 can be used to separately analyze brightness. For example, each row (i.e., each object) of Table 3 (Contrast Formal Context) represents the contrast implementation of a particular operating system. Each attribute is an ontology element that appears in Figure 6b. A formal context is built for each mechanism.
The systems are described in an empty formal context System Formal Context representing the systems. It is shown in Table 4. This formal context is empty because there is no intrinsic attribute used in this analysis. However, we could imagine introducing attributes, like the system families (system for personal computer, system for mobile phone, Unix, Linux, MacOS, Windows, etc.).
Relational contexts, also called object-object contexts, express relations between objects of several formal contexts. Here they are introduced to connect the systems and their four mechanism implementations. Table 5 (Relational Context os2Contrast) shows the relational context which connects systems (rows) to their contrast mechanism implementations (columns). They are all built using the same scheme, with a diagonal of crosses.
RCF building is summarized as follows (Box 3).
Box 3. Relational Context Family Building.
RCF building. We build a Relational Context Family composed of:
- One system formal context: objects are the operating systems, attributes are empty (or intrinsic attributes), e.g., Table 4.
- Several mechanism formal contexts, one for each mechanism: objects are operating system implementations for this mechanism, e.g., Table 3 for Contrast.
- Several Systems-to-mechanisms relational contexts, one for each mechanism: source context objects are the operating systems, target context objects are the operating system implementations for this mechanism, e.g., Table 5 for Systems-to-Contrast.
4. Data Mining Method
Knowledge Discovery (KD) methods are many, ranging from decision trees to deep learning, covering various needs including classification, categorization, regression, clustering, pattern recognition, rule mining, recommendation or data summarizing. They also differ in their capacity to deal more or less easily with different kinds of data, such as data structured along data model, numerical data, images, sound, text, etc. As introduced before, the selected data mining method for this paper relies on Formal Concept Analysis (FCA), a KD method grounded on lattice theory [17]. FCA aims to extract knowledge, mainly in the form of classifications, and associations or implications rule bases [30]. FCA is well adapted to symbolic data mining. It provides solutions for complex data, and belongs to the KD methods that enable output result explanation, visualization and exploration. It has many extensions from the original binary formalism, to deal with numbers, intervals, sequences, trees, graphs and multi-relational datasets [21,31,32,33]. FCA methods fit our problem area since operating system description is mainly symbolic, with a few numerical descriptions, for example for text size. There is an implicit underlying data model, revealed during feature model and ontology extraction. Separating the analysis of the different mechanisms is made possible by Relational Concept Analysis (RCA). In this section, we detail FCA and RCA for our purpose.
4.1. FCA Basics
FCA primary purpose is the extraction of a set of formal concepts. For a formal context , each concept is a maximal group of objects E associated with a maximal group of attributes I these objects share. is the concept extent (objects sharing the attributes of I) and is the concept intent (attributes owned by the objects of E). For example, in the concept , objects share attributes (see in Table 3 and in Figure 7).
A specialization relation is established between the extracted concepts. Let us consider two concepts , and , the specialization relation states that if and only if (and equivalently ). For example, if we consider the concept with and }, we have . The concept lattice is the set of all concepts of the formal context K, provided with the specialization relation . We denote by the set of concepts introducing attributes (attribute introducer). A concept is an introducer concept for attribute a, whenever it is the highest concept containing this attribute. For example introduces , because it is the highest concept containing this attribute (see Figure 7).
We used the tool RCAexplore (http://dataqual.engees.unistra.fr/logiciels/rcaExplore, accessed on 1 September 2021) to generate these lattices. Based on the specialization order definition, a sub-concept inherits the attributes of its super-concepts. The inherited attributes can thus be omitted in the graphical representation of the sub-concept, as it is shown in the figures. Symmetrically, a super-concept inherits the objects of its sub-concepts (and the inherited objects can be omitted in the graphical representation in the super-concept, as it is shown in the figures).
4.2. RCA Basics
Relational Concept Analysis (RCA) has been designed to deal with multi-relational datasets [21]. In the present study, the different relations represent either the systems, or the different implementations of the mechanisms in the systems, or they connect the systems to their mechanism implementation. RCA input, i.e., a relational context family (RCF), is formally a pair (K,R) with: K = a set of formal contexts and a set of relational contexts R = . for . RCA groups objects (e.g., operating systems), not only by their intrinsic attributes, but also by the relations they share to other objects or object groups (concepts). This is highlighted through relational attributes. From a relation , relational attributes for are built using relations between objects of and concepts built upon objects of . A relational attribute is similar to a formula in Description Logics. It is composed of a quantifier (e.g., ∃, ), a relation (e.g., ), and a concept (e.g., ) [34]. For example, using Relational Context os2Contrast from Table 5 and contrast concept lattice from Figure 7 (right): The relational attribute is associated with and because they have at least one link for with an object of the extent.
As previously shown, in our framework, the RCF is composed of a central formal context, describing operating systems, together with four formal contexts describing the different mechanisms and relations connecting the operating systems to the mechanism implementations. This is reproduced at the level of lattices. The central concept lattice, shown in Figure 8, combines information given in the different concept lattices defined for the different mechanisms. Its top concept () shows the relational attributes that are common to all studied systems. One example is relational attribute which indicates that all operating systems have at least one link towards an object in . This means that all operating systems have accessibility options that concern the contrast mechanism. More informative relational attributes will be presented hereafter.
The data mining output method is summarized below (Box 4). Its results are interpreted in the next section for the target domain in the software product line paradigm.
Box 4. Output of Relational Concept Analysis.
RCA output. From the formal and relational contexts, we generate, through the RCAexplore tool, one concept lattice for each formal context:
5. Interpretation
Several types of observations can be made from the concept lattices: Relations between features and systems (Section 5.1), relations between systems (Section 5.2) and logical relations between features (Section 5.3). These relations can be extracted visually, from the RCAexplore tool interface or from the generated image files, that are used in most of the figures of this paper. Logical relations between features are extracted with the Java library CLEF [35]. This library generates textual files.
5.1. Relations between Features and Systems
From the lattices, we can observe how features are spread over the systems. Features in the highest levels of the lattices are more frequent than features in lowest levels, and the frequency is measured by the concept extent size compared to the total number of systems. For example, as shows the Contrast concept lattice (Figure 7b), few systems (1/5) have , while most of them (4/5) have . In central concept lattice (Figure 8), shows that 2 systems share a rather complete zoom option set with styles and magnification values (indicated by )). Besides, shows more limited contrast possibilities, with high and normal contrast, as well as reduce transparency ()).
5.2. Relations between Systems
Relations between systems for a specific mechanism are observed in the specific mechanism lattices. e.g., Contrast concept lattice (Figure 7b) shows that owns more contrast features than , being introduced in a sub-concept. The central lattice, for its part, reveals these relations when all the mechanisms are included, e.g., (Figure 8):
- and are similar because they are contained in the same concept ();
- and are not comparable because they are contained in non comparable concepts and . This comes from two contradictory classifications: while Contrast concept lattice (Figure 7b) shows that owns more contrast features than , reversely Zoom concept lattice (Figure 7a) highlights the fact that owns more zoom features than ;
- owns more features than , as shown by the specialization relation between their introducer concepts: .
5.3. Logical Relations between Features
We retained three types of logical relations: co-occurrences, binary implications, and mutual exclusion (called mutex). For each logical relation, we give respectively a definition, the extraction method, and one example. Table 6 presents the number of features, as well as the exact and the upper bound of binary implications, co-occurrences, and mutex number. The upper bounds are computed using the formulas in [36]. We notice that the Brightness mechanism has the smallest values; the Contrast mechanism has the average values; the Text style mechanism, the Zoom mechanism and the central lattice have the largest values. We also notice that the number of binary implications and co-occurrences seems to depend from the total number of features, which is not always the case with mutex relationships. All logical relations are available online (https://gite.lirmm.fr/huchard/visualaccessibilityoptionsinos, accessed on 1 September 2021). Table 7 presents the number of objects, attributes and concepts.
- A Co-occurrence is a pair of features that always appear together in configurations. A simple method can be used to extract the co-occurrences from a conceptual structure. The method considers the attribute introducer concept set . Each concept of is analyzed: if it contains more than one feature, the introduced features are co-occurrent. An example of co-occurrence relation from in Figure 7a is . The worst case is when all features appear together, thus any feature pair is a co-occurence. There are at most co-occurrences (where A is the feature number) [36].
- Binary implications correspond to the case where when a first feature is present, a second one is mandatorily present too. A method to extract binary implications is described in [36]. The method uses the set of all pairs such that . For each feature introduced in and each feature introduced in , is a valid implication. An example of binary implication relation is because (see Figure 7b). In a concept lattice, there are at most binary implications (where A is the feature number) [36].
- Mutex are pairs of mutually exclusive features {,} which satisfy (or equivalently ). In a concept lattice, when the extent of the bottom concept is not empty, this means that there exists at least one configuration which owns all the features, and that there is no mutual exclusion situation. To extract mutex in a conceptual structure, each feature introducer concept pair with is analyzed to check if their extents intersect. If they do not intersect, a feature introduced in and a feature introduced in are mutually exclusive and correspond to a mutex. An example of mutex relation is , because the intersection of the extents of the feature introducers is empty. This can be seen in Figure 7b, where introduces , and introduces . The upper bound of the mutex number is [36].
Examples of co-occurrences, implications and mutex involving relational attributes are given and interpreted in the next section. The interpretation step is summarized as follows (Box 5).
Box 5. Interpretation step.
Interpretation step. We proceed to the interpretation of the concept lattices by observing the specialization relation, the content of the concepts and by extracting co-occurrences, binary implications, and mutex.
6. Case Study
In this section, we conduct an exploratory case study based on our proposed method applied to concrete operating systems. The case study is guided by four research questions which are presented in Section 6.1. These questions are refinements of the general question “How do accessibility options vary in practice?”. Section 6.2 presents the experimental setup. Observations are presented and discussed in Section 6.3, and threats to validity are discussed in Section 6.4.
6.1. Research Questions
We focus on four main research questions (RQ1, RQ2, RQ3, and RQ4). The first three questions are related to the variability relationships between features. They correspond to typical feature relationships that are studied in variability analyses [25]. The last one is related to the possible relationships between operating systems regarding their offered accessibility options (similarity, superiority, incomparability).
- RQ1: Omnipresence of options. Which (and how many) accessibility options are present in all operating systems?
- RQ2: Binary implications and co-occurrences. What kind of (and how many) binary implications and co-occurrences between features can we find?
- RQ3: Mutual exclusions. What kind of (and how many) mutual exclusion relationships between features can we find?
- RQ4: System relationships. What kind of relationships between the different operating systems can we find?
6.2. Experimental Setup and Process
As presented before, we analyze 8 operating systems: , , , , , , and . We study zoom, contrast/colors, text style (font size and style) and brightness. When we apply the KD process on these systems, data preparation step produces:
- 32 feature models corresponding to the 4 mechanisms for the 8 systems;
- then we reduced the dataset to: 3 ontology parts and 3 mapping tables, for brightness, contrast and colors, and text styles mechanisms; this reduction has been decided for time and human effort reduction purpose; it is worth to note that we included the largest mechanism (contrast and colors).
- using the ontology, mapping tables and feature models, we derive the formal contexts: one central formal context lists the 8 OS; 3 formal contexts are derived for the 3 mechanisms. Each of them describes the implementation of the mechanism by the 8 OS on this mechanism. Finally, 3 relational contexts link the OS of the central context to their implementation on one mechanism.
The data mining step produces 4 concept lattices: one for each mechanism (contrast and colors, text styles, brightness), and one for the OS (the central one). Table 8 presents the number of objects, attributes and concepts. Then the 4 resulting lattices are analyzed at the interpretation step.
Table 9 shows metrics about OS feature models, that is about variability inside each OS, taken individually. To compute these metrics, we used the FAMILIAR tool which provides the values of these metrics for any given feature model [27]. The feature models in FAMILIAR format are available in the repository associated to this paper (See Data Availability Statement and Footnote 2). FAMILIAR is a feature model editor that we used in the data preparation step. It also provides many other operations for reasoning about feature models. These feature models are built in the data preparation step and are the input of the data mining step, where OS are classified. From Table 9, we know that the description of OS by feature models has a reasonable size, having a small or medium number of features. The number of configurations is the number of possible user settings. It is an indicator of how difficult it will be to choose an OS in this search space, or to move from one OS to another. We might expect it will be easy for brightness, but tricky for contrast and color. The four columns contain respectively: the FM name, the feature number, the valid configuration number, and the depth (edge number of a longest path). We can make the following observations. FMs and (resp. and ) have the highest (resp. the lowest) number of features. FM (resp. ) has the maximum (resp. the minimum) number of contrast features. FM (resp. ) has the maximum (resp. the minimum) number of size and font type features. FM (resp. and ) has (resp. have) the maximum (resp. the minimum) number of Zoom features.
Due to their size, input data and results cannot be entirely given in this paper. They are available on the gitlab repository (https://gite.lirmm.fr/AccessibiliteNumerique/osvisualaccessibilityoptions, accessed on 1 September 2021).
During this evaluation, the concept lattice building has been achieved with the tool RCAexplore. RQ1 did not need extra tools for the analysis, as the results are easy to get visually. RQ2 and RQ3 required the use of an additional tool for extracting implications and mutex. We used the Java library CLEF [35]. We visually analyzed the object introducer concepts of the central lattice for answering RQ4.
6.3. Results
In this section, we successively present results for omnipresent features (RQ1, Section 6.3.1), binary implications and co-occurrences (RQ2, Section 6.3.2), mutex (RQ3, Section 6.3.3) and relationships between systems (RQ4, Section 6.3.4).
6.3.1. Omnipresent Features (RQ1)
To find omnipresent features, we observe the top concept intents in the different lattices (Figure 9), which indicate the features that are present in all systems. We consider meaningful an attribute which is different from the root of an hypothetical feature model. For example, the Brightness lattice top concept intent ( in Figure 9d) introduces and . would be the root feature in a feature model for the Brightness mechanism. As the root, it is trivially omnipresent, thus it is not considered as meaningful here.
The Central lattice top concept intent (Figure 9a) introduces relational attributes that point to the top concepts of Contrast, Brightness and Text style lattices respectively. This means that all operating systems provide options in the three mechanisms.
The extraction shows that omnipresent features are very few. We learn that all systems propose manual setting for brightness, the possibility to set text size in various elements, a gallery, a screen saver option and the possibility to define a contrast type. This low number of shared features reveals a diversity in approaching the visual accessibility option design.
6.3.2. Binary Implications and Co-Occurrences (RQ2)
We apply here the method explained in Section 5.3 to extract binary implications and co-occurrences. Table 10 presents the number of features, the number of binary implications and co-occurrences and their respective upper bounds in the different lattices. We notice that the Brightness mechanism has the smallest values. The Text style mechanism and central lattice have the average values. The Contrast and Color mechanism has the largest values. We observe in the central concept lattice a number of features, corresponding to the relational attributes, which is not so high, compared to the number of features in the different mechanisms. This is explained by the fact that the features for systems are groups of features from the different mechanisms. This reduction is a quality of RCA. The features are separated along the different concerns and the central lattice gives a global and summarized overview. Thanks to FCA, the variability of operating systems is analyzed with regard to co-occurring feature groups. RCA helps analyzing the different concerns (mechanisms) separately or as a whole. The number of logical relationships increases when the feature number increases. Besides, in Text style and Contrast contexts, the number of relationships is higher than the number of features. A high number of co-occurrences (i.e., of pairs of co-occurring features) may hide a few number of large groups of co-occurring features, as in the contrast mechanism case. In this case, their analysis and use as a requirement guideline is not too heavy. For example, in the Brightness concept lattice (see Figure 10):
- Binary implicationcomes from the fact that .
- Co-occurrencecomes from the fact they are both introduced in .
From the central concept lattice (see Figure 11), the relationships refer to the other lattices and may involve several mechanisms, for example:
- Binary implication,because .All system mechanisms in have . All systems in have . Thus we can deduce a cross-mechanism information between contrast and text style: Systems that provide , also provide .
- Co-occurrencebecause both attributes are introduced in .All systems in have . We can deduce a cross-mechanism information between contrast and text style: Systems that provide , also provide and reciprocally.
Co-occurrences at the system level reveal groups of features having a common purpose, as increase versus decrease brightness in Ubuntu, which may correspond to a feature group in a feature model at the user level. They also highlight groups of features having different purposes, as contrast type and screen saver. From this information, the OS manufacturers can decide if these co-occurrences are accidental or part of a relevant requirement specification.
6.3.3. Mutex (RQ3)
We use the method explained in Section 5.3 to extract mutex. The fifth and the last columns of Table 10 respectively represent the exact number and the maximal number of mutex. There is a high and very high number of mutex respectively for Text style and for Contrast and Color mechanisms. Again we can notice the reduction effect of RCA in the number of mutex concerning the relational attributes (central lattice).
The Brightness concept lattice (see Figure 10) supports the mutex , since: (introducing ) and (introducing ) have an empty intersection.
The following mutex can be extracted from the central concept lattice (see Figure 12): .
They come from the empty intersection of the extents of the feature introducers (introducing ) and (introducing ). All Systems in have ; All Systems in have . Hence we can deduce this information involving brightness and text style: Systems that provide , do not provide . The central lattice again highlights cross-mechanism information, here about mutex. Mutex can be accidental, but some correspond to orthogonal design choices, as the one presented for Brightness mechanism between and on one side, versus on the other side, and are relevant to know.
6.3.4. Relationships between Operating Systems (RQ4)
For RQ4, we analyze the extents of the object introducer concepts. The concept lattice excerpts highlight a few examples. We analyze into details the Brightness lattice. Then we show how relationships are combined in the central lattice.
The Brightness lattice (shown Figure 10) is small, but it contains the main possible situations. We can observe for example:
- System option set equivalence:
- –
- and are in the same simplified extent (). This means that and provide exactly the same Brightness features.
- System option set specialization:
- –
- highlights the fact that and have more Brightness features than , , and .
- Incomparable option sets with shared intersection:
- –
- As is incomparable for with , this indicates that , , , , and only share the top concept features with and .
The central concept lattice (excerpt in Figure 13) allows us to analyze the different systems taking into account all mechanisms together. Systems are respectively introduced in separate concepts, e.g., is introduced in . This means that there are no identical systems.
For example, from the concept specialization, we obtain the following information:
- meaning that provides more features than , which means that the option set has been reduced during system upgrade;
- meaning that provides more options than ;
- is the least upper bound (and the direct cover) of and , highlighting some proximity of and ;
- is the least upper bound (and the direct cover) of and , revealing and closeness.
The results of this analysis illustrate the system diversity and the needs to propose guidance to OS manufacturers. From the analysis of the various systems, and by navigating the concept lattices, they can overview common options (that they should implement) and more rare ones (that they can decide to add or not). It also informs end users about the existing configurations in the different systems, that can guide them in the choice of a system, or guide the migration.
The concept lattices are the search space for solving tasks, such as comparing OS, classifying user settings, either independently in each mechanism, or considering all mechanisms together. Table 7 and Table 8 show the size of this search space for the fictitious example and our case study, respectively. The number of concepts in a concept lattice varies between 1 (i.e., when all OS have an identical description) and (i.e., when the concept lattice is isomorphic to the powerset of the OS set). This number of concepts thus indicates a variability level between the OS, and also the size of the search space. The figures presented in Table 7 and Table 8 show that this search space is of reasonable size (between 5 and 34 concepts for the case study) and practical for navigation purposes. For example, for contrast and color, the concept lattice groups attributes into a structure with 21 concepts which is far more easy to comprehend and exploit, compared to a table with 88 columns.
6.4. Threats to Validity
In this section, we discuss the threats to validity of this approach. We first analyze internal validity through data collection and used tools reliability, in order to explore the possible biases. Construct validity is then assessed: We examine the relevance of the used metrics. Then we study conclusion validity to ascertain the conclusions we draw from our results are reasonable. Finally, we approach external validity, to evaluate to what extent our results can be generalized.
6.4.1. Internal Validity
Two persons, co-authors of this paper, were strongly involved in the data collection. One of them is visually impaired and has a very good knowledge of operating systems and their accessibility options. During the data collection, both had to exchange their understanding of accessibility options and to reconcile their points of view, that were sometimes diverging, in order to build the ontology and the mappings. One person spent about 1 month to manually cross all access paths of accessibility options related to low vision in the 8 systems, and report them in the feature models. Both manually checked the feature models during about 10 days. About 10 other days were spent by the same two persons to build the ontology and the mappings. This was time consuming, but this was needed as a bootstrap to obtain meaningful results. We plan to use the built ontology and mappings to feed supervised learning-based automated analyses to avoid or at least reduce the manual work in next system analyses. Two days were spent to build the formal and relational contexts with partially automated procedures. From these contexts, the lattices were built with RCAexplore in a few minutes. One day was needed to analyze the lattices by a non expert person. Manually collecting the accessibility options can be source of error, thus having the check by two persons has been important for reliability. Another co-author was familiar with the usage of the tools and the lattice analysis. CLEF has been used in previous evaluations [37]. RCAexplore is used for several years in a significant number of experiments [38].
6.4.2. Construct Validity
We did not evaluated the ontology, and it has a subjective aspect. Its organization in four parts can be compared to the W3C accessibility requirements for people with low vision (https://www.w3.org/TR/low-vision-needs/#overview-of-low-vision, accessed on 1 September 2021). Our Brightness and Contrast and color mechanisms correspond to several subsections of Brightness and color. Text styles and Zoom mechanisms correspond to different subsections of Perceiving. The W3C wiki (https://www.w3.org/WAI/GL/low-vision-a11y-tf/wiki/Main_Page, accessed on 1 September 2021) present settings of a few platforms, but there is no standardized description e.g., in Firefox (Mac) we find Colors..>Text and Background>Background: (Default white) Choose a color from popup color picker, and in Windows 10, we find Personalization>background color. We are confident in the proposed ontology, because it has been made with a person expert in the domain. Ontology building methodologies have been proposed to guide humans in this task [39]. They can be assisted by automatic extraction from texts, but the human knowledge remains the main component to ensure the quality of the result [40].
We evaluated our results through metrics that show the number of existing relationships between features or between systems. The counted relationships are those that are typically searched during variability analysis, and among the main logical relationships that are considered during the building of variability models, such as feature models in their most common form. It would be interesting to look for feature groups, as in [41]. We did not perform this kind of analysis at that time, as this is time-consuming and not always relevant: It may be unfeasible to reach a result; many accidental groups may be built.
6.4.3. Conclusion Validity
The lattices show a reasonable classification of systems, e.g., systems of the same family provide close or similar features. The variability relationships number is not surprising, with regard to previous evaluations we did [36]. There are likely many accidental relationships.
6.4.4. External Validity
The analysis is limited to 8 operating systems, when many exist. Besides, our study only focuses on visual impairment, when operating systems also address other impairments, such as hearing or motor disabilities. These threats are mitigated by the fact that: low vision is a very common impairment, with many different forms; it is relevant to study separately one deficiency; the chosen systems are representative of the mainstream operating systems. It would be interesting to investigate the application of the methodology to other fields. This would help to assess whether visual accessibility features are specific and to which extent the method can be generalized. Firstly, other disabilities could be addressed. Let us take the example of mobility. In this case, the accessibility features provided by the OS are divisible into separate concerns, e.g., accessibility keyboard, control with adaptive switch hardware, or voice to navigate, as reported in [15]. By reading OS documentations, the need for writing (or not) an ontology and mappings for these features would appear. After this preparation step, formal and relational contexts would be built and the remainder of the methodology would be applied. Applying the methodology and analyzing the results would enable discussing the generalization at this level. If this is positive, i.e., if the method has been fruitfully applied in this similar situation, we can envision a larger application context, to any field where: variability has to be studied in a family of products; studying this variability through different concerns or as a whole is relevant. It can be the case for cars, where managing variation in car families is useful for mass production and personalization. Different concerns are visible in the car configurators of the car brands: motorization, seats, driving assistance and so on.
7. Related Work
In this section, we present papers reporting OS comparisons on visual accessibility (Section 7.1). Then we revisit our approach with the software product lines perspective (Section 7.2).
7.1. OS Visual Accessibility Comparisons
Earlier studies compared the main OS (Table 11), or analyzed the standards [6] and their implementation [4]. Papers [4,6] are not recent, and indicated the needs for guidelines [4] or for standard dissemination [6]. Going from accessibility standards and recommendations to concrete software implementation is a recurring problem, as was again highlighted in [11], and is still to be addressed, as shown in the recent survey on software accessibility in [5].
For most of the papers about OS, the context is education [12,13,14] as in software in general [5]. In [13,14,15], the authors discuss different disabilities: visual, hearing and motor disabilities in [13,14,15]; cognitive disability in [15]. Some papers study to what extent the OS comply to these standards, in order to help administrations to choose a non-discriminatory system. e.g., in [42], it is shown that Ubuntu 6.10 provides more accessibility features than Windows XP Service Pack 2. In [12], authors determine the most common features in three OS (Linux, MacOS and Windows). E.g., they show that features Display Customization and Basic Screen Magnification Software belong to all systems. Ref. [15] analyzes the latest OS versions of Apple, Microsoft and Google and concludes that the same high-level vision accessibility features are implemented in these platforms. In [13,15], the versions of the systems involved in the analysis are not explicitly specified. Their findings, restricted to the accessibility options we are studying in this paper, are respectively presented in Table 12, Table 13 and Table 14. These tables show that these studies are very concentrated on a few aspects, a restricted set of systems and high-level descriptions.
Compared to these approaches that focus on a particular problematic and coarse-grained features, we give a general framework for a more systematic analysis and comparison. Existing comparative tables cannot be used to make precise comparisons or help users or manufacturers. In our work, all visual options (fine-grained features) are considered. We also identified the problem of defining a unifying ontology and the mappings between OS and the ontology. Some logical relationships are systematically extracted. In addition, the concept lattices provide a space for accessibility exploration, at the level of a single mechanism or considering the whole set of mechanisms as well.
7.2. Software Product Lines
Our approach was inspired by the software product line (SPL) paradigm, which promotes the efficient development of families of similar products [25]. In this paradigm, properly representing and managing variability analysis is a core issue, as it greatly influences all the process. This is made through variability models, which can take various forms, including textual, graphical or hybrid (both textual and graphical) [43,44].
Metrics for analyzing variability have been proposed in the past, and collected in a recent survey [16]. In our paper, we use some of them, such as Number of Features (NoF), Number of Valid Configurations (NVC) and Depth of tree (DT)). From their paper, we could use metrics in the spirit of Commonality of feature (Comm), or Variability influence (VI). The metrics we use (1) either show the complexity of the initial FMs, i.e., variability in individual OS (Table 9), (2) or show variability among all OS, regarding each mechanism separately (Table 10). In this second case, we measure the logical relationships that a classical feature model (for all OS) should include and highlight (commonalities, binary implications, and mutex). In addition to these metrics, we build an exploration space for variability in the form of a collection of concept lattices, with metrics presented in Table 8.
Variability models based on Formal Concept Analysis (FCA) have been investigated for many years. FCA builds conceptual classifications that provide a support for feature relationships analysis, variability metrics, and construction of other variability models, e.g., feature models [37,45,46,47]. It also supports requirement engineering [48], feature location [49] or software product line architecture recovery [50]. We use FCA here for variability modeling. In previous work in the domain of software product lines, we show that FCA provides a single structure to embed all the logical variability relationships [37,51]. We also show that any feature model can be embedded in the concept lattice. Many logical relationships can be extracted. This is made for co-occurrences, implications and mutex. We use this framework in a new context, namely the visual accessibility options in OS. In addition, we extend the FCA existing approaches for variability modeling by two new contributions, (1) the joint use of an ontology, and (2) the principle of concern separation, which is implemented with RCA.
8. Conclusions
In this paper, we propose a methodology to build a variability model on operating systems (OS) regarding visual accessibility. We divide the visual accessibility options into different mechanisms, such as contrast and color, brightness, text style, or zoom. We standardize the vocabulary and organization via the building of an ontology. Using the division into mechanisms, we build interconnected classifications. OS are classified according each mechanism: we build one classification for contrast and color, one classification for brightness, and so on. In addition, OS are classified according all mechanisms, in a structure that contains links to the mechanism classifications. These classifications are built with Relational Concept Analysis (RCA). They can be analyzed visually. They also exhaustively embed logical variability relationships, that can be derived in a textual form. We extract some variability relationships, i.e., co-occurrences, binary implications, and mutex. An exploratory case study is conducted on 8 representative operating systems. This allows us to observe the way accessibility options vary in practice.
As future work, we plan to analyze more platforms, namely more OS and software distributed on the web, such as web browsers. We also plan to automate more the analysis process. One track will be to benefit from the manually built ontology, from external lexical and semantical resources, and from natural processing tools, to analyze new systems, at least semi-automatically. For this analysis, we will have to establish a mapping from new system features to ontology concepts. We probably will have to evolve the ontology and the mappings by integrating new concepts in the right place in the ontology. We also will work on the ontology dissemination. We have not found other ontologies at the moment on this precise topic. In other domains, there are initiatives to gather ontologies (e.g., Bioportal (https://bioportal.bioontology.org/, accessed on 1 September 2021) or Agroportal (http://agroportal.lirmm.fr/, accessed on 1 September 2021) [52,53]). As far as we know, there is no such initiative about technical visual accessibility. Existing ontologies deal with handicap description from the health and skills point of view, e.g., ICF (http://bioportal.lirmm.fr/ontologies/ICF, accessed on 1 September 2021) or [54]. Open repositories can be used for sharing (https://ontologforum.org/index.php/WikiHomePage, accessed on 1 September 2021). Our ontology can be exported in Protege (https://protege.stanford.edu/, accessed on 1 September 2021), making it portable, easy to distribute and reusable. We will follow guidelines gathered in [55,56] for the delivery. A user assistance would be useful for guiding OS manufacturers, or software developers in general, as well as end users. Proposing such assistance requires to develop complete solutions for comprehension, system requirement analysis, or user setting recommendation and migration. Concept lattices are built in the same spirit as Feature models in the domain of software product lines. They can serve to derive product (here OS) configurators in the form of structured checkboxes. We also plan to exploit this analysis in our project EWPA (http://ewpa.lirmm.fr/en/, accessed on 1 September 2021) to improve the proposed options in the context of web page adaptation. Variability analysis can be refined as well. A first track could be to distinguish mandatory features versus optional features in the OS description. A second track could be to consider different variability levels, namely (1) intra-OS families (e.g., Ubuntu family) versus inter-OS families and (2) variability among end user settings.
Author Contributions
Conceptualization, A.W.K., Y.B., M.H.; methodology, A.W.K., Y.B., M.H.; validation, A.W.K., Y.B.; formal analysis, A.W.K., Y.B., M.H.; investigation, A.W.K., Y.B., M.H., T.B.B.; resources, A.W.K., Y.B.; data curation, A.W.K., Y.B.; writing—original draft preparation, A.W.K., M.H.; writing—A.W.K., M.H.; supervision, T.B.B., M.H.; funding acquisition, T.B.B., A.W.K. All authors have read and agreed to the published version of the manuscript.
Funding
The work has been supported by “Collège Doctoral Mathématiques, Informatique, Biosciences et Géosciences de l’environnement (Mathinbio)”, Central Africa and the Great Lakes Region, “Agence universitaire de la Francophonie” (AUF), French Ambassy at Cameroon, through “Service de Coopération et d’Action Culturelle” (SCAC) and Development Research Institute (IRD)”.
Institutional Review Board Statement
Not applicable.
Informed Consent Statement
Not applicable.
Data Availability Statement
Data are available at: https://gite.lirmm.fr/AccessibiliteNumerique/osvisualaccessibilityoptions, accessed on 1 September 2021. CLEF, the Java library [35] is available at https://gite.lirmm.fr/jcarbonnel/CLEF, accessed on 1 September 2021. RCAexplore is available at http://dataqual.engees.unistra.fr/logiciels/rcaExplore, accessed on 1 September 2021. CoGUI is avalaible at http://www.lirmm.fr/cogui/, accessed on 1 September 2021.
Acknowledgments
The authors thank Alain Gutierrez, the author of CoGUI software for his valuable help and guidance in using it to elaborate the ontology. They also thank: Jessie Galasso for her great help in using the CLEF software and the discussions we had on the connections between Software Product Lines and this work; Clément Jonquet for fruitful discussions about ontologies; the anonymous reviewers who gave valuable feedbacks that help to considerably improve the different versions of the paper.
Conflicts of Interest
The authors declare no conflict of interest. The funders had no role in the design of the study; in the collection, analyses, or interpretation of data; in the writing of the manuscript, or in the decision to publish the results.
References
- Musthafa, N.H.; Sulaiman, S. A Review on Accessible Design Requirement for Mobile Application among Physically Impaired Users. Aip Conf. Proc. 2016, 020107. [Google Scholar] [CrossRef]
- Salvador-Ullauri, L.; Acosta-Vargas, P.; Luján-Mora, S. Web-Based Serious Games and Accessibility: A Systematic Literature Review. Appl. Sci. 2020, 10, 7859. [Google Scholar] [CrossRef]
- Chadwick, D.; Wesson, C.; Fullwood, C. Internet Access by People with Intellectual Disabilities: Inequalities and Opportunities. Future Internet 2013, 5, 376–397. [Google Scholar] [CrossRef]
- Kavcic, A. Software Accessibility: Recommendations and Guidelines. In Proceedings of the EUROCON, Belgrade, Serbia, 21–24 November 2005; pp. 1024–1027. [Google Scholar]
- Paiva, D.M.B.; Freire, A.P.; de Mattos Fortes, R.P. Accessibility and Software Engineering Processes: A Systematic Literature Review. J. Syst. Softw. 2021, 171, 110819. [Google Scholar] [CrossRef]
- Gonzalez, A.L.; Mariscal, G.; Martinez, L.; Ruiz, C. Ergonomic accessibility standards. In Proceedings of the 16th World Congress on Ergonomics (IEA 2006), Maastricht, The Netherlands, 10–14 July 2006. [Google Scholar]
- Consortium, W.W.W. Web Content Accessibility Guidelines. Available online: http://www.w3.org/TR/WCAG20/ (accessed on 1 September 2021).
- Consortium, W.W.W. Authoring Tools Accessibility Guidelines. Available online: http://www.w3.org/TR/ATAG20/ (accessed on 1 September 2021).
- Consortium, W.W.W. User Agent Accessibility Guidelines. Available online: https://www.w3.org/TR/UAAG20/ (accessed on 1 September 2021).
- Consortium, W.W.W. Web Accessibility Initiative—Accessible Rich Internet Applications. Available online: http://www.w3.org/WAI/intro/aria (accessed on 1 September 2021).
- Shirogane, J. Support Method to Elicit Accessibility Requirements. In Requirements Engineering; Zowghi, D., Jin, Z., Eds.; Springer: Berlin/Heidelberg, Germany, 2014; pp. 210–223. [Google Scholar]
- Accessible Information Technology in Education. How Does Accessibility Differ Across Operating Systems? Available online: https://www.washington.edu/accesscomputing/how-does-accessibility-differ-across-operating-systems (accessed on 1 September 2021).
- SET-BC. Built-in Accessibility Features Windows OS, Mac OSX, Apple iOS, Chrome. Available online: https://cpb-ca-c1.wpmucdn.com/learningnetwork.setbc.org/dist/a/487/files/2017/04/Built-in-Accessibility-Features-comparsion-Windows-Apple-Chrome-24y95z0.pdf (accessed on 1 September 2021).
- Kimball, W.H.; Cohen, L.G.; Dimmick, D.; Mills, R. No Special Equipment Required:The accessibility features built into the Windows and Macintosh operating systems make computers accessible for students with special needs. Learn. Lead. Technol. 2003, 31, 12–15. [Google Scholar]
- Szopa, A. Comparison Analysis of Accessible Features Built into Operating Systems. In Advances in Industrial Design (AHFE 2021); Lecture Notes in Networks and Systems; Springer: Cham, Switzerland, 2021; Volume 260, pp. 338–343. [Google Scholar]
- El-Sharkawy, S.; Yamagishi-Eichler, N.; Schmid, K. Metrics for analyzing variability and its implementation in software product lines: A systematic literature review. Inf. Softw. Technol. 2019, 106, 1–30. [Google Scholar] [CrossRef]
- Ganter, B.; Wille, R. Formal Concept Analysis—Mathematical Foundations; Springer: Berlin, Germany, 1999. [Google Scholar]
- Ducrou, J.; Vormbrock, B.; Eklund, P.W. FCA-Based Browsing and Searching of a Collection of Images. In Proceedings of the 14th International Conference on Conceptual Structures (ICCS’06), Aalborg, Denmark, 16–21 July 2006; pp. 203–214. [Google Scholar]
- Eklund, P.W.; Wray, T.; Goodall, P.; Lawson, A. Design, information organisation and the evaluation of the Virtual Museum of the Pacific digital ecosystem. J. Ambient Intell. Humaniz. Comput. 2012, 3, 265–280. [Google Scholar] [CrossRef]
- Greene, G.J.; Esterhuizen, M.; Fischer, B. Visualizing and exploring software version control repositories using interactive tag clouds over formal concept lattices. Inf. Softw. Technol. 2017, 87, 223–241. [Google Scholar] [CrossRef]
- Rouane-Hacene, M.; Huchard, M.; Napoli, A.; Valtchev, P. Relational Concept Analysis: Mining concept lattices from multi-relational data. AMAI 2013, 67, 81–108. [Google Scholar] [CrossRef]
- Fayyad, U.M.; Piatetsky-Shapiro, G.; Smyth, P. From Data Mining to Knowledge Discovery in Databases. AI Mag. 1996, 17, 37–54. [Google Scholar] [CrossRef]
- Kang, K.; Cohen, S.; Hess, J.; Novak, W.; Peterson, A. Feature-Oriented Domain Analysis (FODA) Feasibility Study. In Technical Report CMU/SEI-90-TR-021; Software Engineering Institute: Pittsburgh, PA, USA, 1990. [Google Scholar]
- Czarnecki, K.; Wasowski, A. Feature Diagrams and Logics: There and Back Again. In Proceedings of the 11th International Software Product Line Conference (SPLC’07), Kyoto, Japan, 10–14 September 2007; pp. 23–34. [Google Scholar]
- Pohl, K.; Böckle, G.; van der Linden, F.J. Software Product Line Engineering: Foundations, Principles, and Techniques; Springer Science and Business Media: Berlin/Heidelberg, Germany, 2005. [Google Scholar]
- Acher, M.; Collet, P.; Lahire, P.; France, R.B. Familiar: A domain-specific language for large scale management of feature models. Sci. Comput. Program. 2013, 78, 657–681. [Google Scholar] [CrossRef]
- Acher, M. Familiar-Documentation. Available online: https://github.com/FAMILIAR-project/familiar-documentation (accessed on 1 September 2021).
- Gruber, T.R. Toward principles for the design of ontologies used for knowledge sharing? Int. J. Hum. Comput. Stud. 1995, 43, 907–928. [Google Scholar] [CrossRef]
- Baget, J.F.; Chein, M.; Croitoru, M.; Gutierrez, A.; Leclère, M.; Mugnier, M.L. Logical, graph based knowledge representation with CoGui. Available online: https://hal-lirmm.ccsd.cnrs.fr/lirmm-00537351/document (accessed on 1 September 2021).
- Poelmans, J.; Kuznetsov, S.O.; Ignatov, D.I.; Dedene, G. Formal Concept Analysis in knowledge processing: A survey on models and techniques. Expert Syst. Appl. 2013, 40, 6601–6623. [Google Scholar] [CrossRef]
- Ferré, S.; Ridoux, O. An Introduction to Logical Information Systems. Inf. Process. Manag. 2004, 40, 383–419. [Google Scholar] [CrossRef] [Green Version]
- Kaytoue, M.; Codocedo, V.; Buzmakov, A.; Baixeries, J.; Kuznetsov, S.; Napoli, A. Pattern Structures and Concept Lattices for Data Mining and Knowledge Processing. In Proceedings of the ECML-PKDD, Porto, Portugal, 7–11 September 2015; pp. 227–231. [Google Scholar]
- Ferré, S.; Cellier, P. Graph-FCA: An extension of formal concept analysis to knowledge graphs. Discret. Appl. Math. 2020, 273, 81–102. [Google Scholar] [CrossRef]
- Carbonnel, J.; Huchard, M.; Nebut, C. Exploring the variability of interconnected product families with relational concept analysis. In Proceedings of the 23rd International Systems and Software Product Line Conference, SPLC 2019, Paris, France, 9–13 September 2019; Volume B, pp. 90:1–90:8. [Google Scholar] [CrossRef]
- Carbonnel, J. CLEF, a Java library to Extract Logical Relationships from Multivalued Contexts. In Proceedings of the ICFCA 2019 Conference and Workshops, Frankfurt, Germany, 25–28 June 2019; Volume 2378, pp. 45–49. [Google Scholar]
- Carbonnel, J.; Huchard, M.; Nebut, C. Towards complex product line variability modelling: Mining relationships from non-boolean descriptions. J. Syst. Softw. 2019, 156, 341–360. [Google Scholar] [CrossRef] [Green Version]
- Carbonnel, J.; Huchard, M.; Nebut, C. Modelling equivalence classes of feature models with concept lattices to assist their extraction from product descriptions. J. Syst. Softw. 2019, 152, 1–23. [Google Scholar] [CrossRef]
- Dolques, X.; Braud, A.; Huchard, M.; Ber, F.L. RCAexplore, a FCA based Tool to Explore Relational Data. In Proceedings of the ICFCA 2019 Conference and Workshops, Frankfurt, Germany, 25–28 June 2019; pp. 55–59. [Google Scholar]
- Noy, N.F.; McGuinness, D.L. Ontology Development 101: A Guide to Creating Your First Ontology; Stanford Knowledge Systems Laboratory Technical Report KSL-01-05 and Stanford Medical Informatics Technical Report SMI-2001-0880; Stanford University: Stanford, CA, USA, 2001. [Google Scholar]
- Gawrysiak, P.; Protaziuk, G.; Rybinski, H.; Delteil, A. Text Onto Miner—A Semi Automated Ontology Building System. In Foundations of Intelligent Systems; An, A., Matwin, S., Raś, Z.W., Ślęzak, D., Eds.; Springer: Berlin/Heidelberg, Germany, 2008; pp. 563–573. [Google Scholar]
- Carbonnel, J.; Huchard, M.; Nebut, C. Analyzing Variability in Product Families through Canonical Feature Diagrams. In Proceedings of the The 29th International Conference on Software Engineering and Knowledge Engineering, Wyndham Pittsburgh University Center, Pittsburgh, PA, USA, 5–7 July 2017; pp. 185–190. [Google Scholar] [CrossRef]
- Ángel Lucas, G.; Mariscal, G.; Martínez, L.; Ruiz, C. Comparative analysis of the accessibility of desktop operating systems. In Universal Access in Human Computer Interaction. Coping with Diversity; Springer: Berlin/Heidelberg, Germany, 2007; pp. 676–685. [Google Scholar]
- Benavides, D.; Segura, S.; Cortés, A.R. Automated analysis of feature models 20 years later: A literature review. Inf. Syst. 2010, 35, 615–636. [Google Scholar] [CrossRef] [Green Version]
- Eichelberger, H.; Schmid, K. Mapping the design-space of textual variability modeling languages: A refined analysis. Int. J. Softw. Tools Technol. Transf. 2015, 17, 559–584. [Google Scholar] [CrossRef]
- Loesch, F.; Ploedereder, E. Restructuring Variability in Software Product Lines using Concept Analysis of Product Configurations. In Proceedings of the 11th European Conference on Software Maintenance and Reengineering (CSMR’07), Amsterdam, The Netherlands, 21–23 March 2007; pp. 159–170. [Google Scholar]
- Ryssel, U.; Ploennigs, J.; Kabitzsch, K. Extraction of feature models from formal contexts. In Proceedings of the Workshop Proceedings (Volume 2) of the 15th International Conference on Software Product Lines (SPLC’11), Munich, Germany, 21–26 August 2011; pp. 4:1–4:8. [Google Scholar]
- Al-Msie’deen, R.; Huchard, M.; Seriai, A.; Urtado, C.; Vauttier, S. Reverse Engineering Feature Models from Software Configurations using Formal Concept Analysis. In Proceedings of the 11th International Conference on Concept Lattices and Their Applications (CLA’14), Košice, Slovakia, 7–10 October 2014; pp. 95–106. [Google Scholar]
- Niu, N.; Easterbrook, S.M. Concept analysis for product line requirements. In Proceedings of the 8th International Conference on Aspect-Oriented Software Development (AOSD’09), Charlottesville, VA, USA, 2–6 March 2009; pp. 137–148. [Google Scholar]
- Salman, H.E.; Seriai, A.; Dony, C. Feature-to-code traceability in a collection of software variants: Combining formal concept analysis and information retrieval. In Proceedings of the 14th IEEE International Conference on Information Reuse and Integration (IRI’13), San Francisco, CA, USA, 14–16 August 2013; pp. 209–216. [Google Scholar]
- Shatnawi, A.; Seriai, A.; Sahraoui, H.A. Recovering software product line architecture of a family of object-oriented product variants. J. Syst. Softw. 2017, 131, 325–346. [Google Scholar] [CrossRef] [Green Version]
- Carbonnel, J.; Delahaye, D.; Huchard, M.; Nebut, C. Graph-Based Variability Modelling: Towards a Classification of Existing Formalisms. In Proceedings of the Graph-Based Representation and Reasoning—24th International Conference on Conceptual Structures, ICCS 2019, Marburg, Germany, 1–4 July 2019; Endres, D., Alam, M., Sotropa, D., Eds.; Lecture Notes in Computer Science. Springer: Berlin/Heidelberg, Germany, 2019; Volume 11530, pp. 27–41. [Google Scholar] [CrossRef] [Green Version]
- Jonquet, C.; Toulet, A.; Arnaud, E.; Aubin, S.; Dzalé Yeumo, E.; Emonet, V.; Graybeal, J.; Laporte, M.A.; Musen, M.A.; Pesce, V.; et al. AgroPortal: A vocabulary and ontology repository for agronomy. Comput. Electron. Agric. 2018, 144, 126–143. [Google Scholar] [CrossRef]
- Jonquet, C.; Annane, A.; Bouarech, K.; Emonet, V.; Melzi, S. SIFR BioPortal: Un portail ouvert et générique d’ontologies et de terminologies biomédicales françaises au service de l’annotation sémantique. JFIM 2016. e-health pour tous. Available online: https://hal.archives-ouvertes.fr/hal-01398250/document (accessed on 1 September 2021).
- Torres-Carazo, M.I.; Rodríguez-Fórtiz, M.J.; Torres, M.V.H. Development of an Ontology for the Inclusion of App Users With Visual Impairments. IEEE Access 2021, 9, 44339–44353. [Google Scholar] [CrossRef]
- Dutta, B.; Toulet, A.; Emonet, V.; Jonquet, C. New Generation Metadata vocabulary for Ontology Description and Publication. In MTSR: Metadata and Semantics Research Conference; Garoufallou, E., Virkus, S., Siatri, R., Koutsomiha, D., Eds.; Communications in Computer and Information Science; Springer: Tallinn, Estonia, 2017; pp. 173–185. [Google Scholar] [CrossRef] [Green Version]
- Matentzoglu, N.; Malone, J.; Mungall, C.; Stevens, R. MIRO: Guidelines for minimum information for the reporting of an ontology. J. Biomed. Semant. 2018, 9. [Google Scholar] [CrossRef]
Figure 1.
Outline of our implemented KD process.

Figure 2.
Feature models for Brigthness of iOS (left-hand side, version ) and MacOS (right-hand side, version ) represented with FAMILIAR [26]. Black circles indicate mandatory features; white circles indicate optional features.
Figure 2.
Feature models for Brigthness of iOS (left-hand side, version ) and MacOS (right-hand side, version ) represented with FAMILIAR [26]. Black circles indicate mandatory features; white circles indicate optional features.

Figure 3.
Brightness Mechanism Ontology made with CoGui editor.

Figure 4.
Excerpt of Text Style Mechanism Ontology (CoGui editor).

Figure 5.
Mapping and brightness to ontology.

Figure 6.
Ontology from domain knowledge on zoom and contrast.

Figure 7.
Concept lattices on zoom and contrast.

Figure 8.
Concept lattice of Operating System accessibility options. In figures that correspond to RCAexplore tool output, quantifiers appear as plain text (e.g., ) rather than symbols (e.g., ∃) to avoid encoding issues.
Figure 8.
Concept lattice of Operating System accessibility options. In figures that correspond to RCAexplore tool output, quantifiers appear as plain text (e.g., ) rather than symbols (e.g., ∃) to avoid encoding issues.

Figure 9.
Top concepts of the different concept lattices (redrawn from the lattices output of the tool for the sake of explainability).
Figure 9.
Top concepts of the different concept lattices (redrawn from the lattices output of the tool for the sake of explainability).

Figure 10.
Excerpt of the Brightness concept lattice.

Figure 11.
Excerpt of several concept lattices (redrawn from the lattices output of the tool for the sake of explainability) to illustrate co-occurrences and implications in the central lattice.
Figure 11.
Excerpt of several concept lattices (redrawn from the lattices output of the tool for the sake of explainability) to illustrate co-occurrences and implications in the central lattice.

Figure 12.
Excerpt of several concept lattices (redrawn from the lattices output of the tool for the sake of explainability) to illustrate mutex in the central lattice.
Figure 12.
Excerpt of several concept lattices (redrawn from the lattices output of the tool for the sake of explainability) to illustrate mutex in the central lattice.

Figure 13.
Excerpt of the central concept lattice (redrawn from the output of the tool for the sake of explainability) to illustrate relationships between systems.
Figure 13.
Excerpt of the central concept lattice (redrawn from the output of the tool for the sake of explainability) to illustrate relationships between systems.


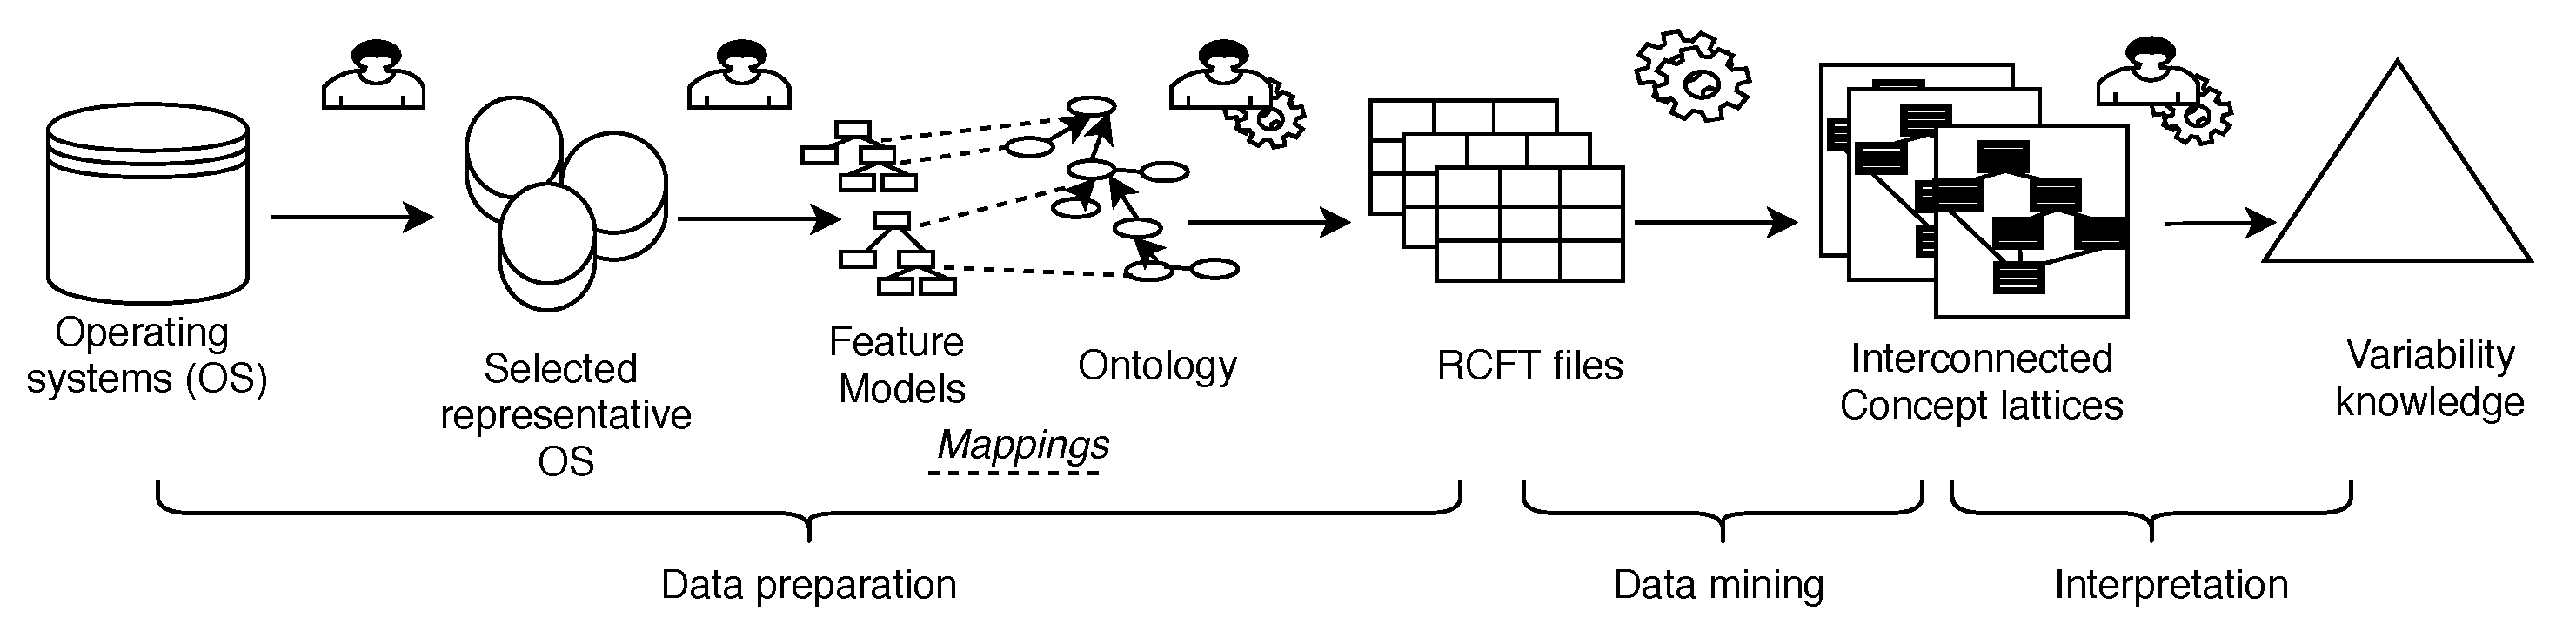
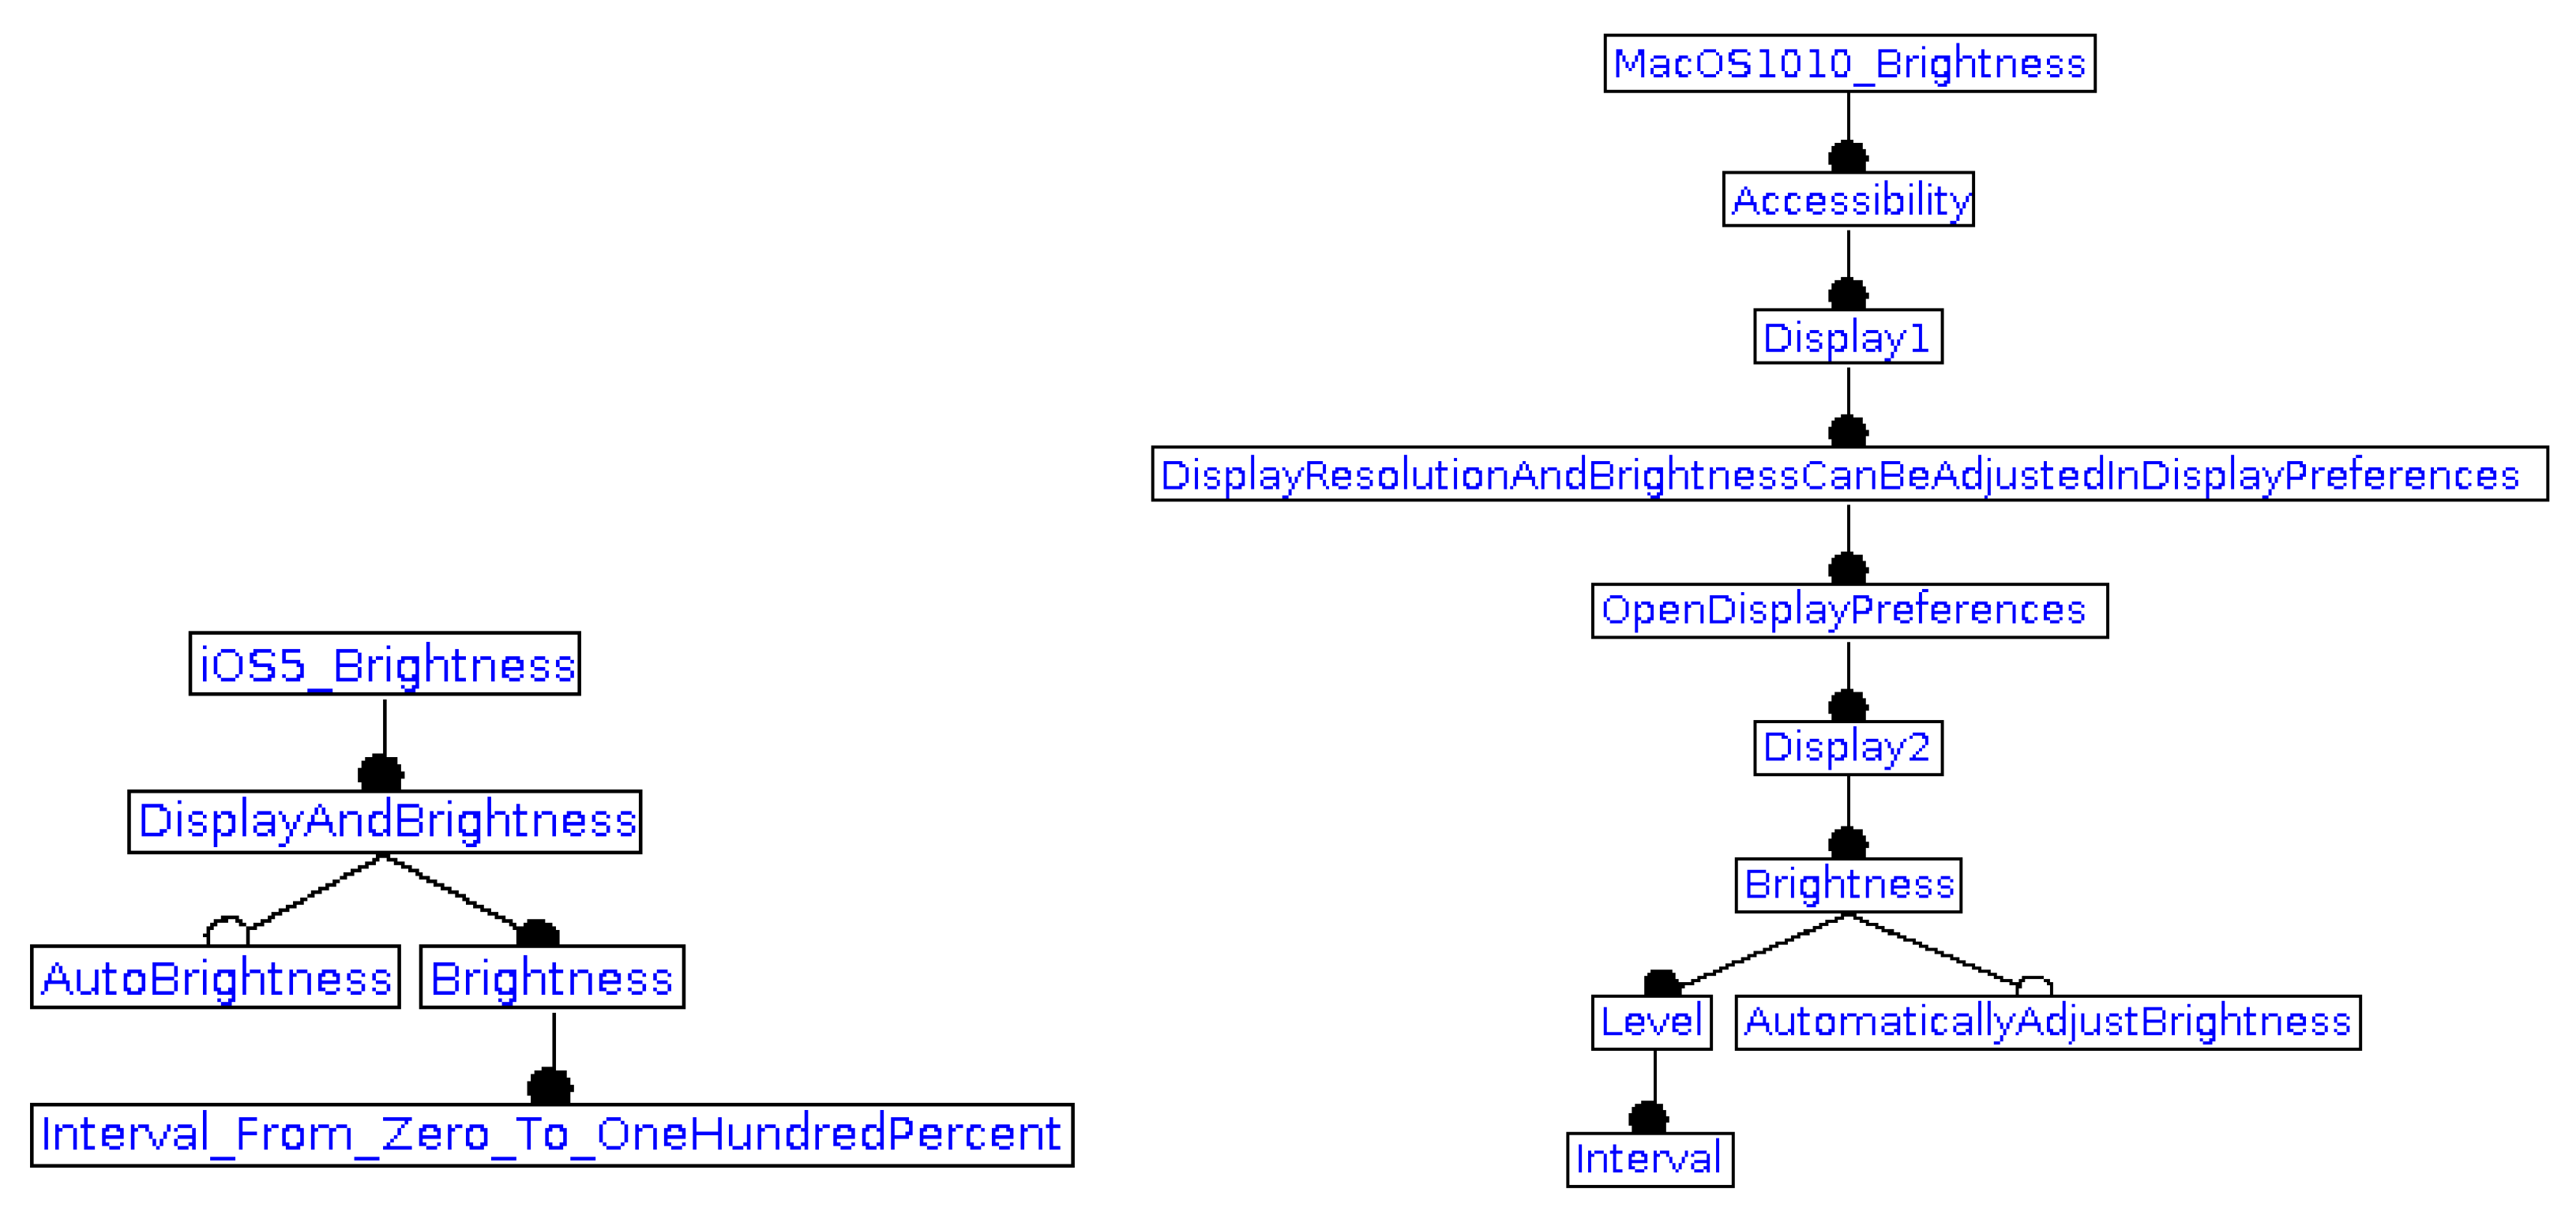
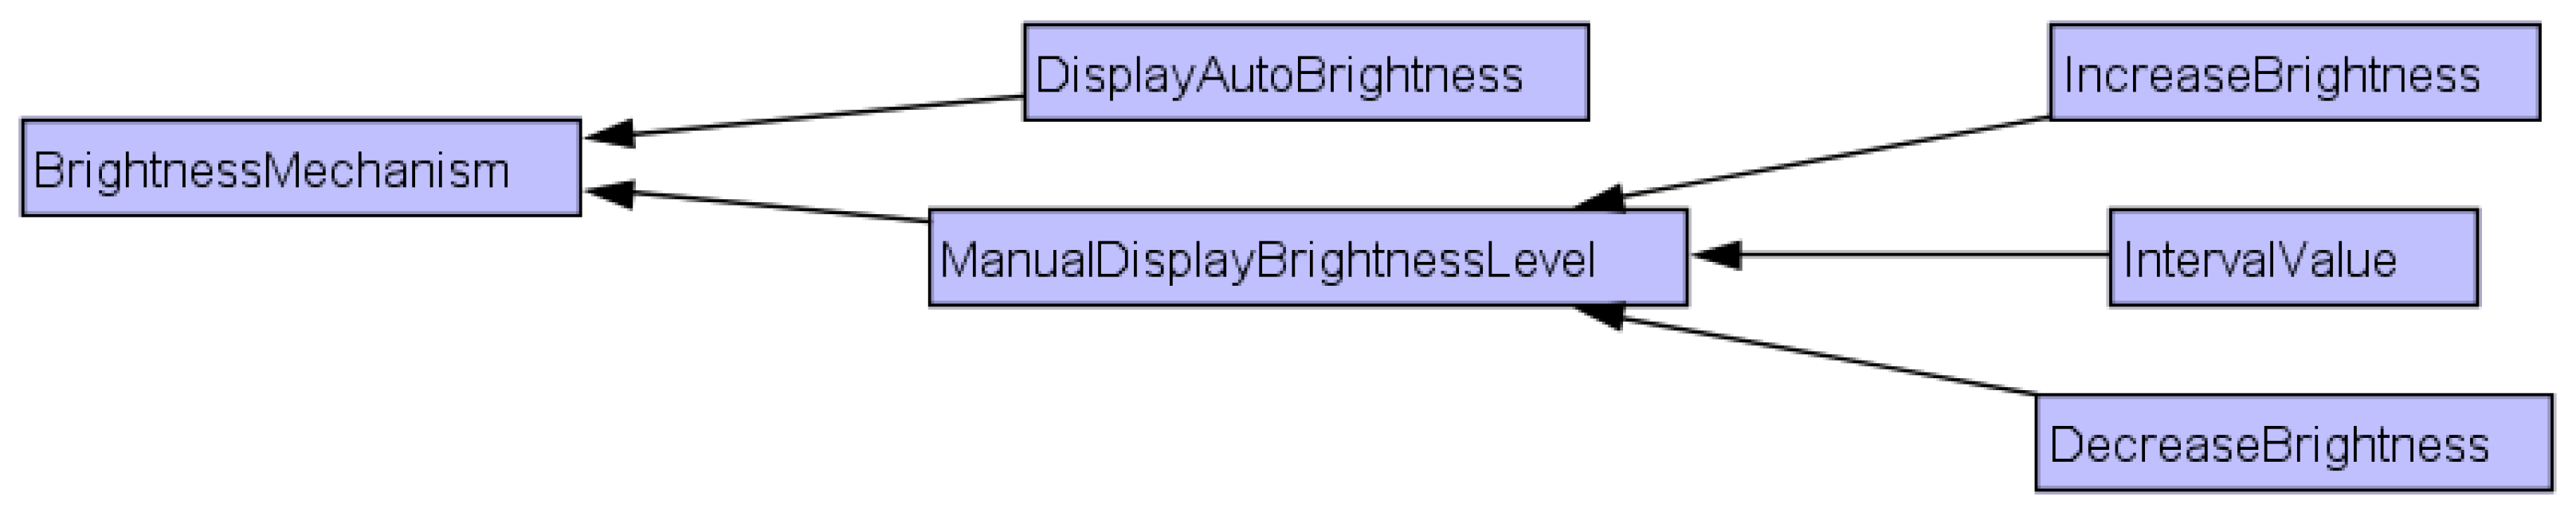
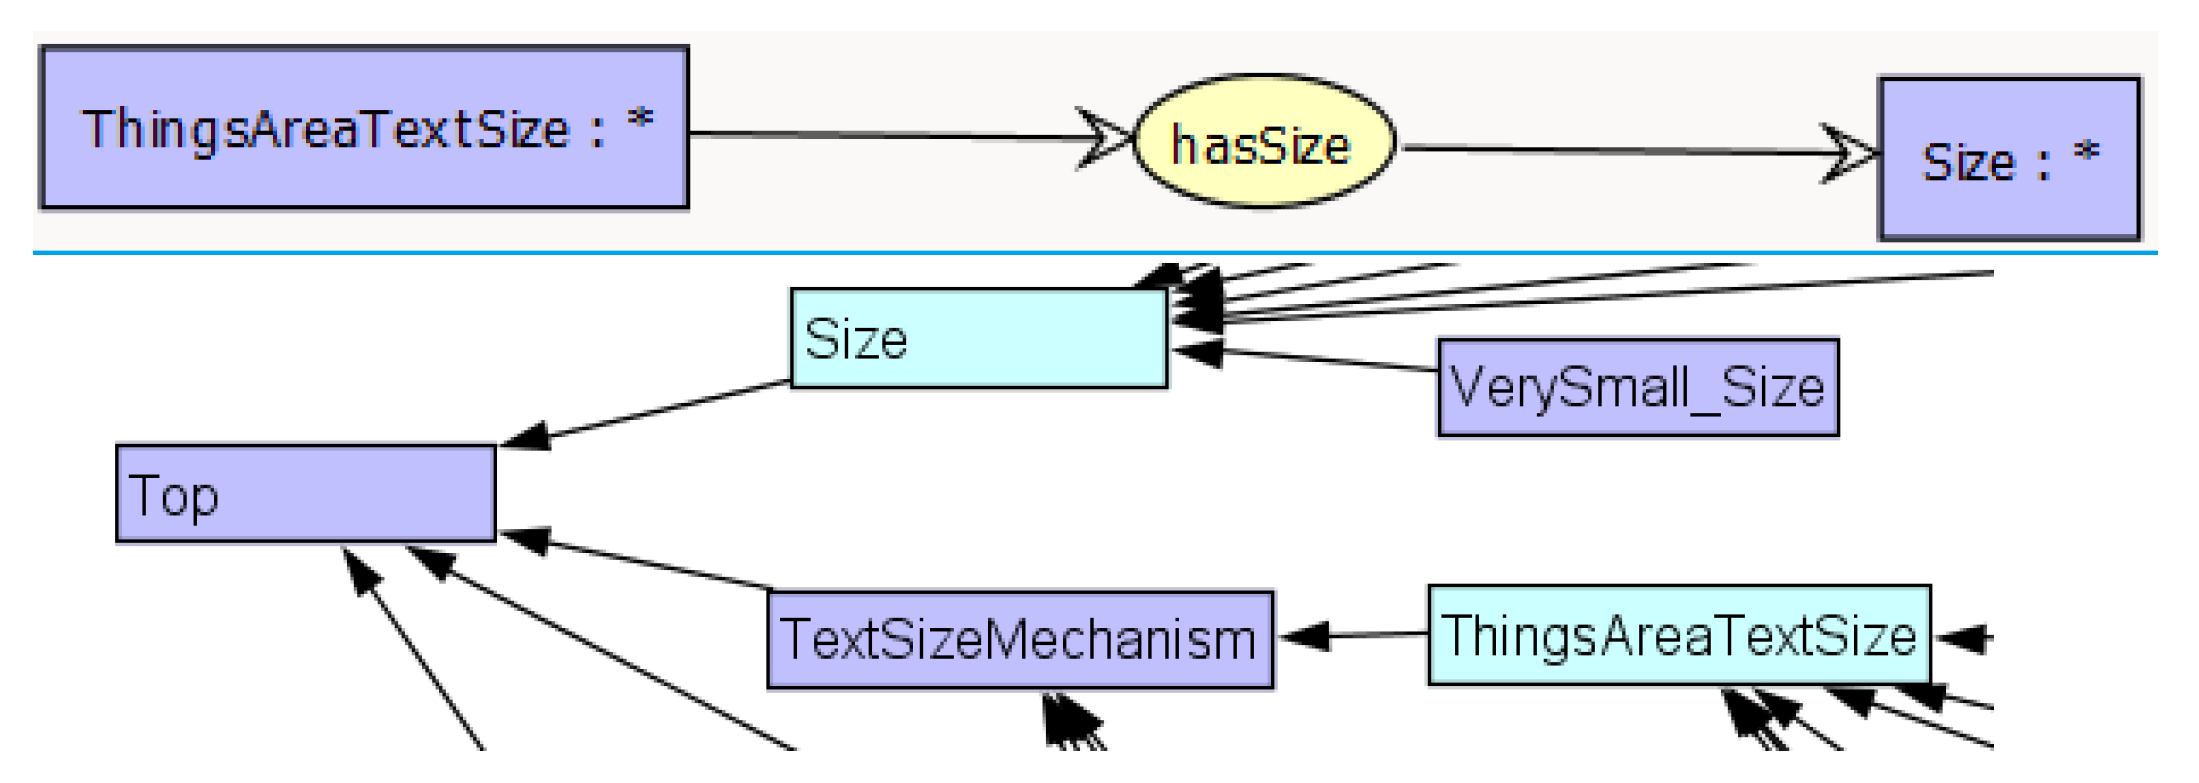
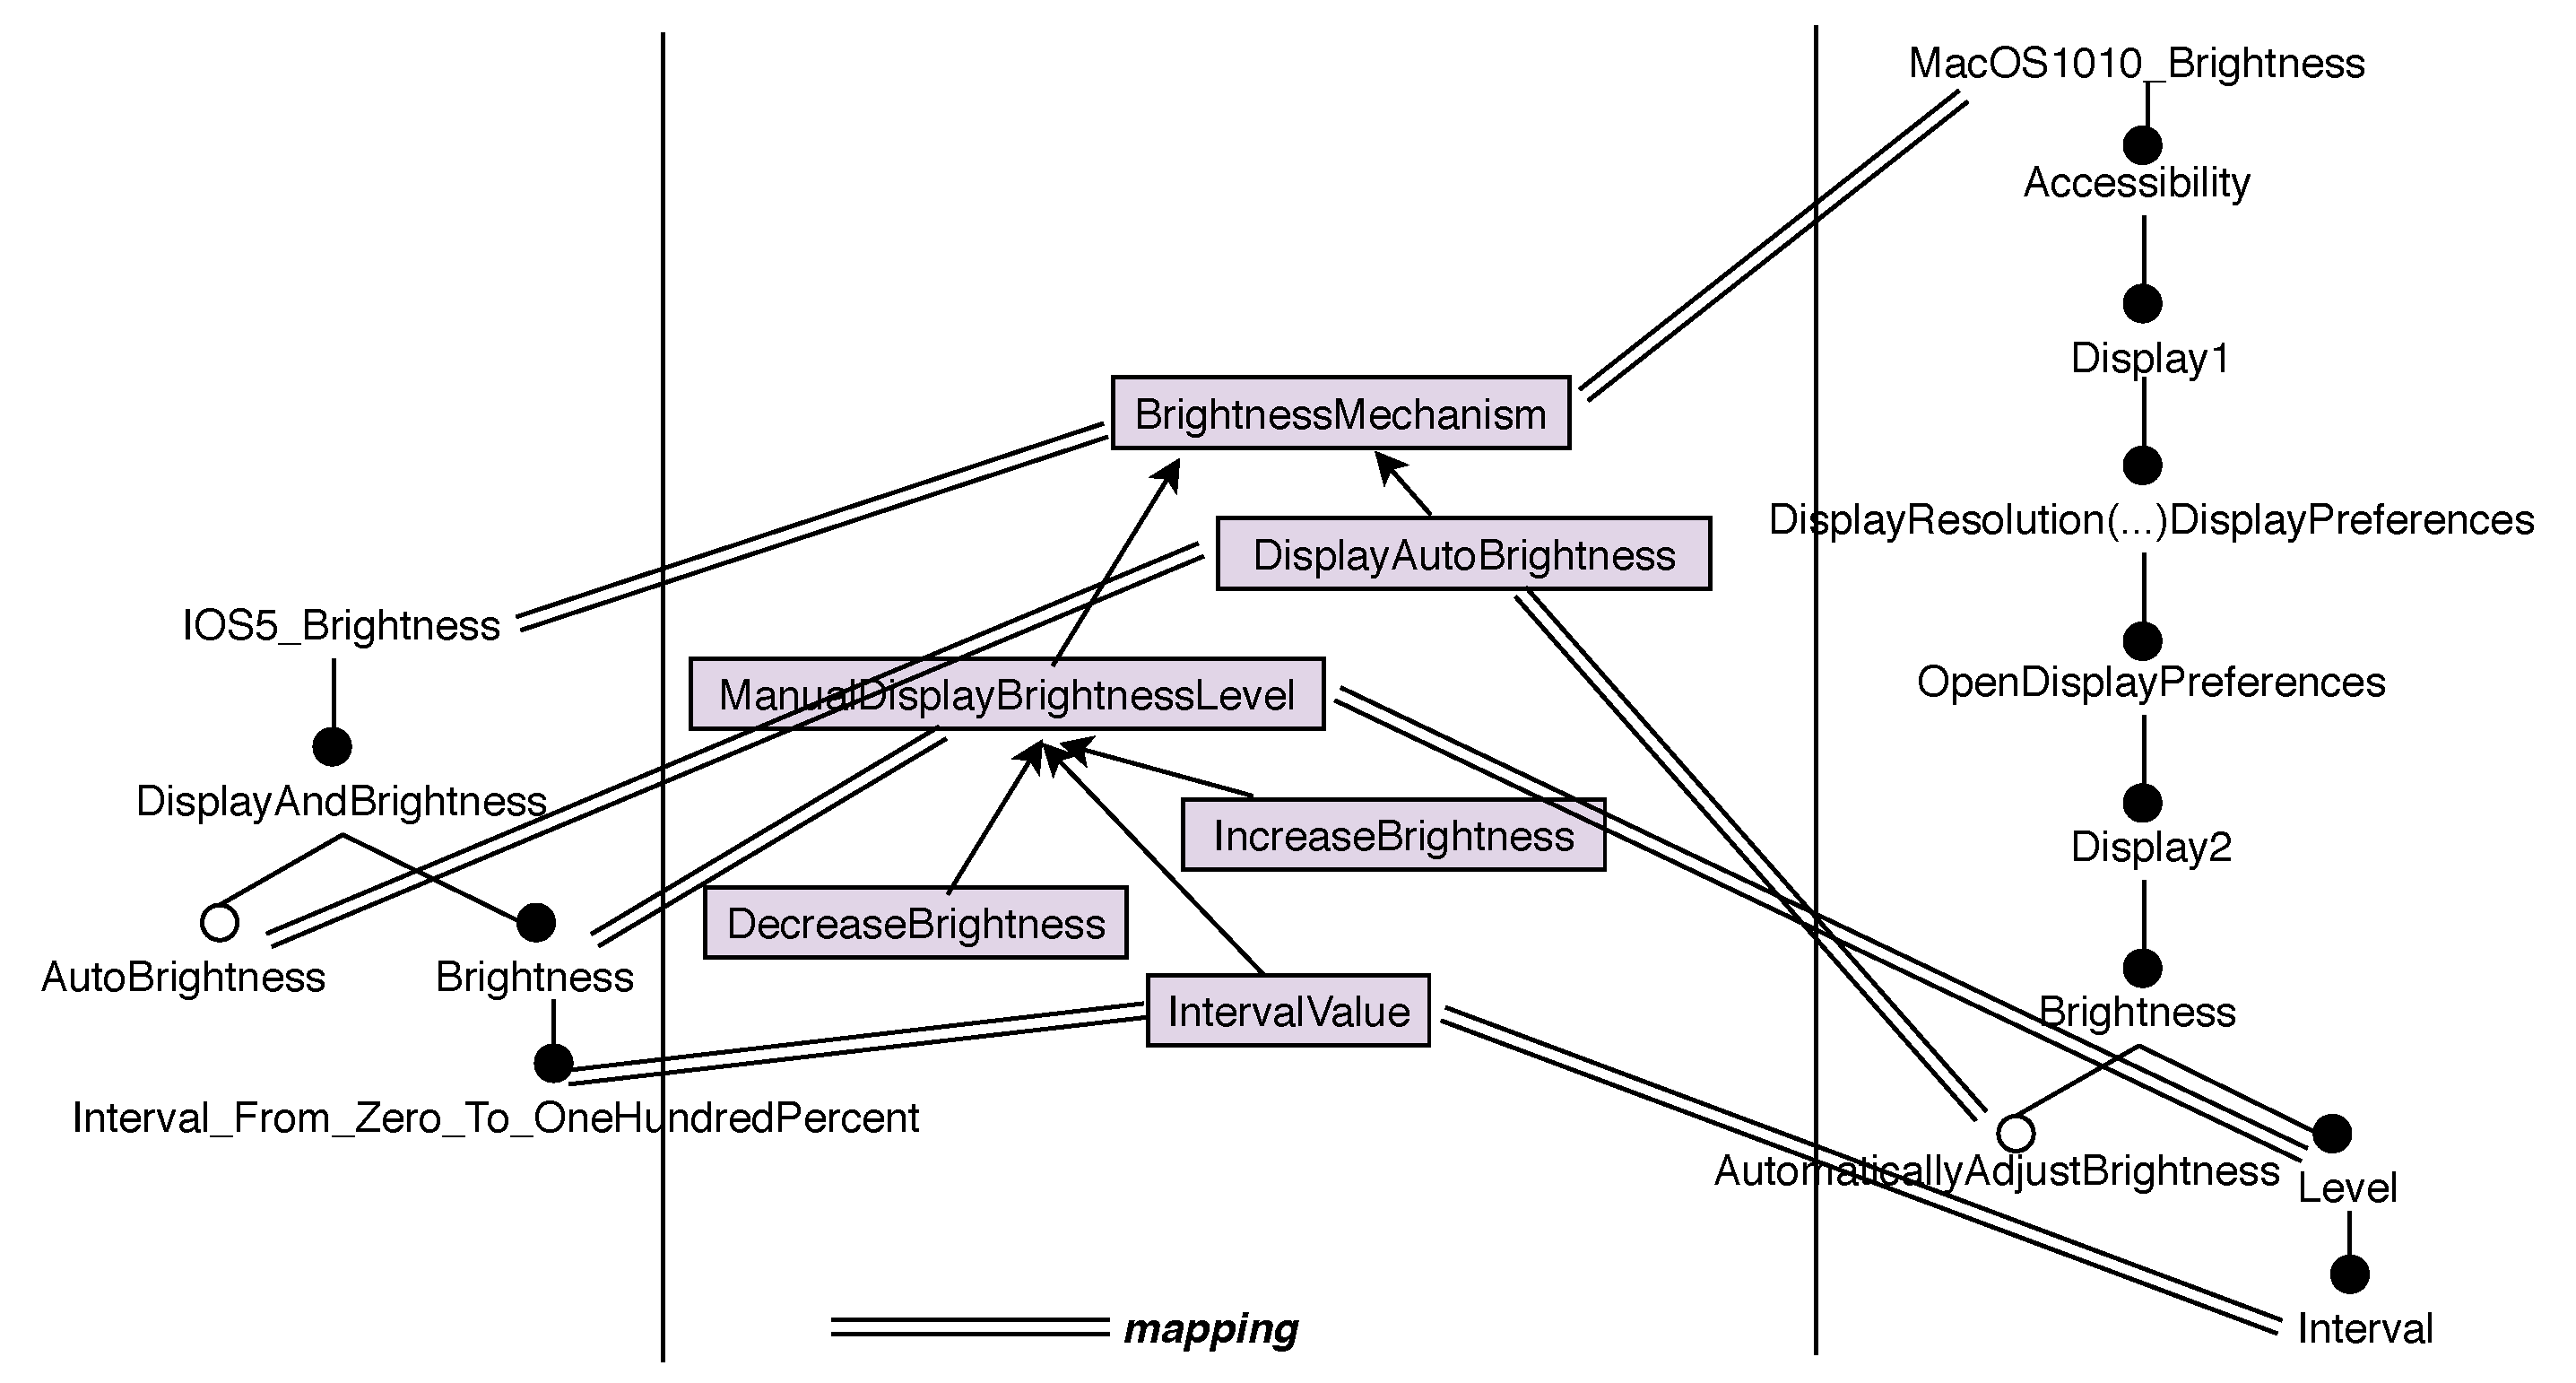
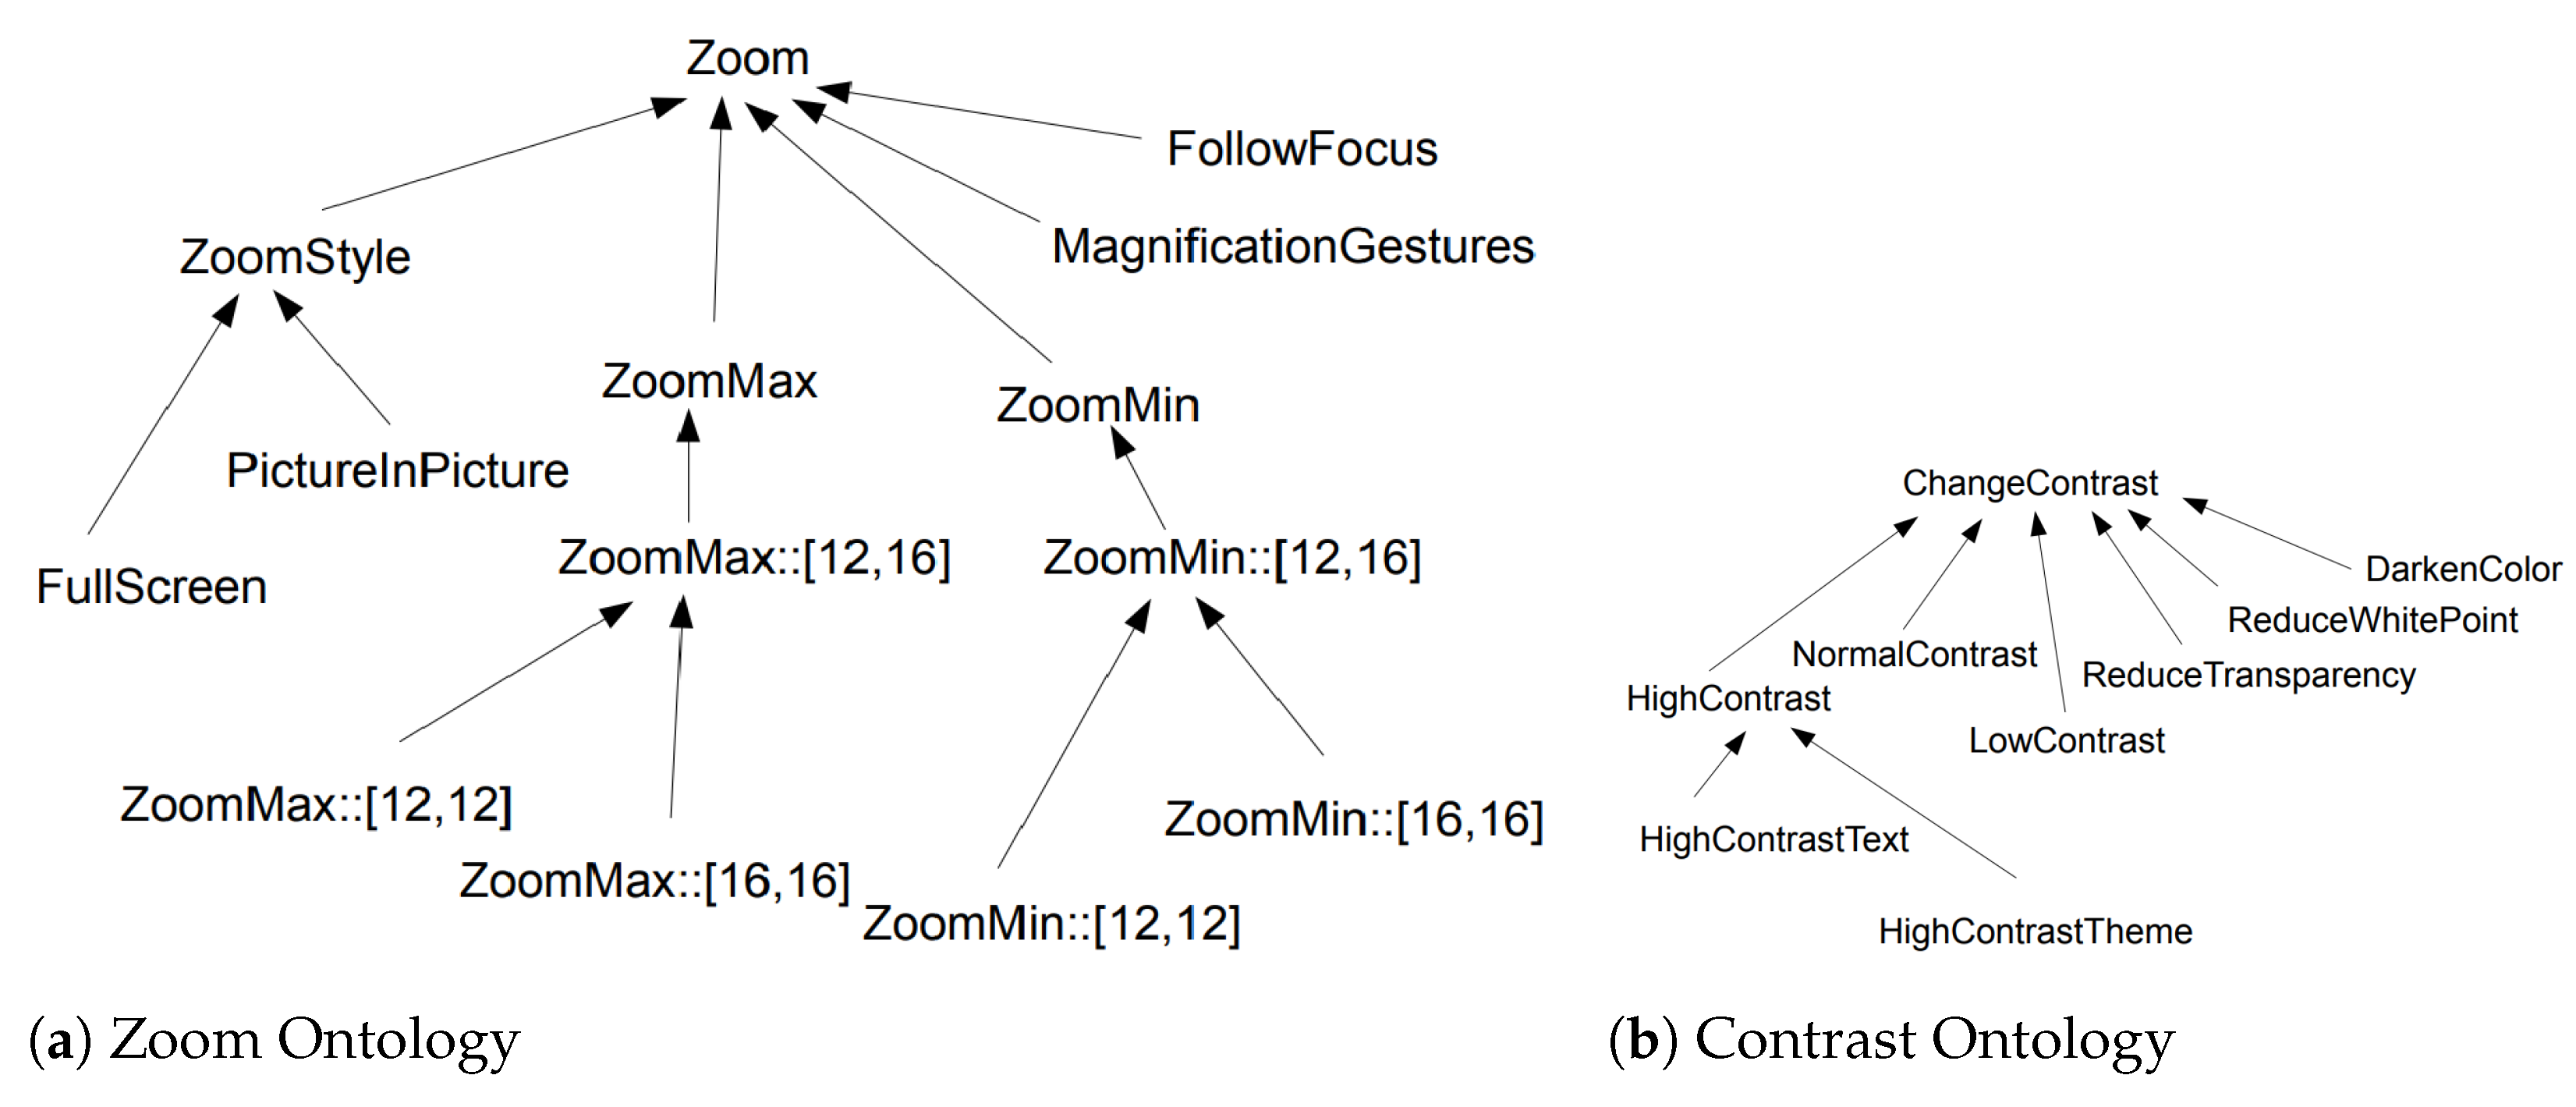
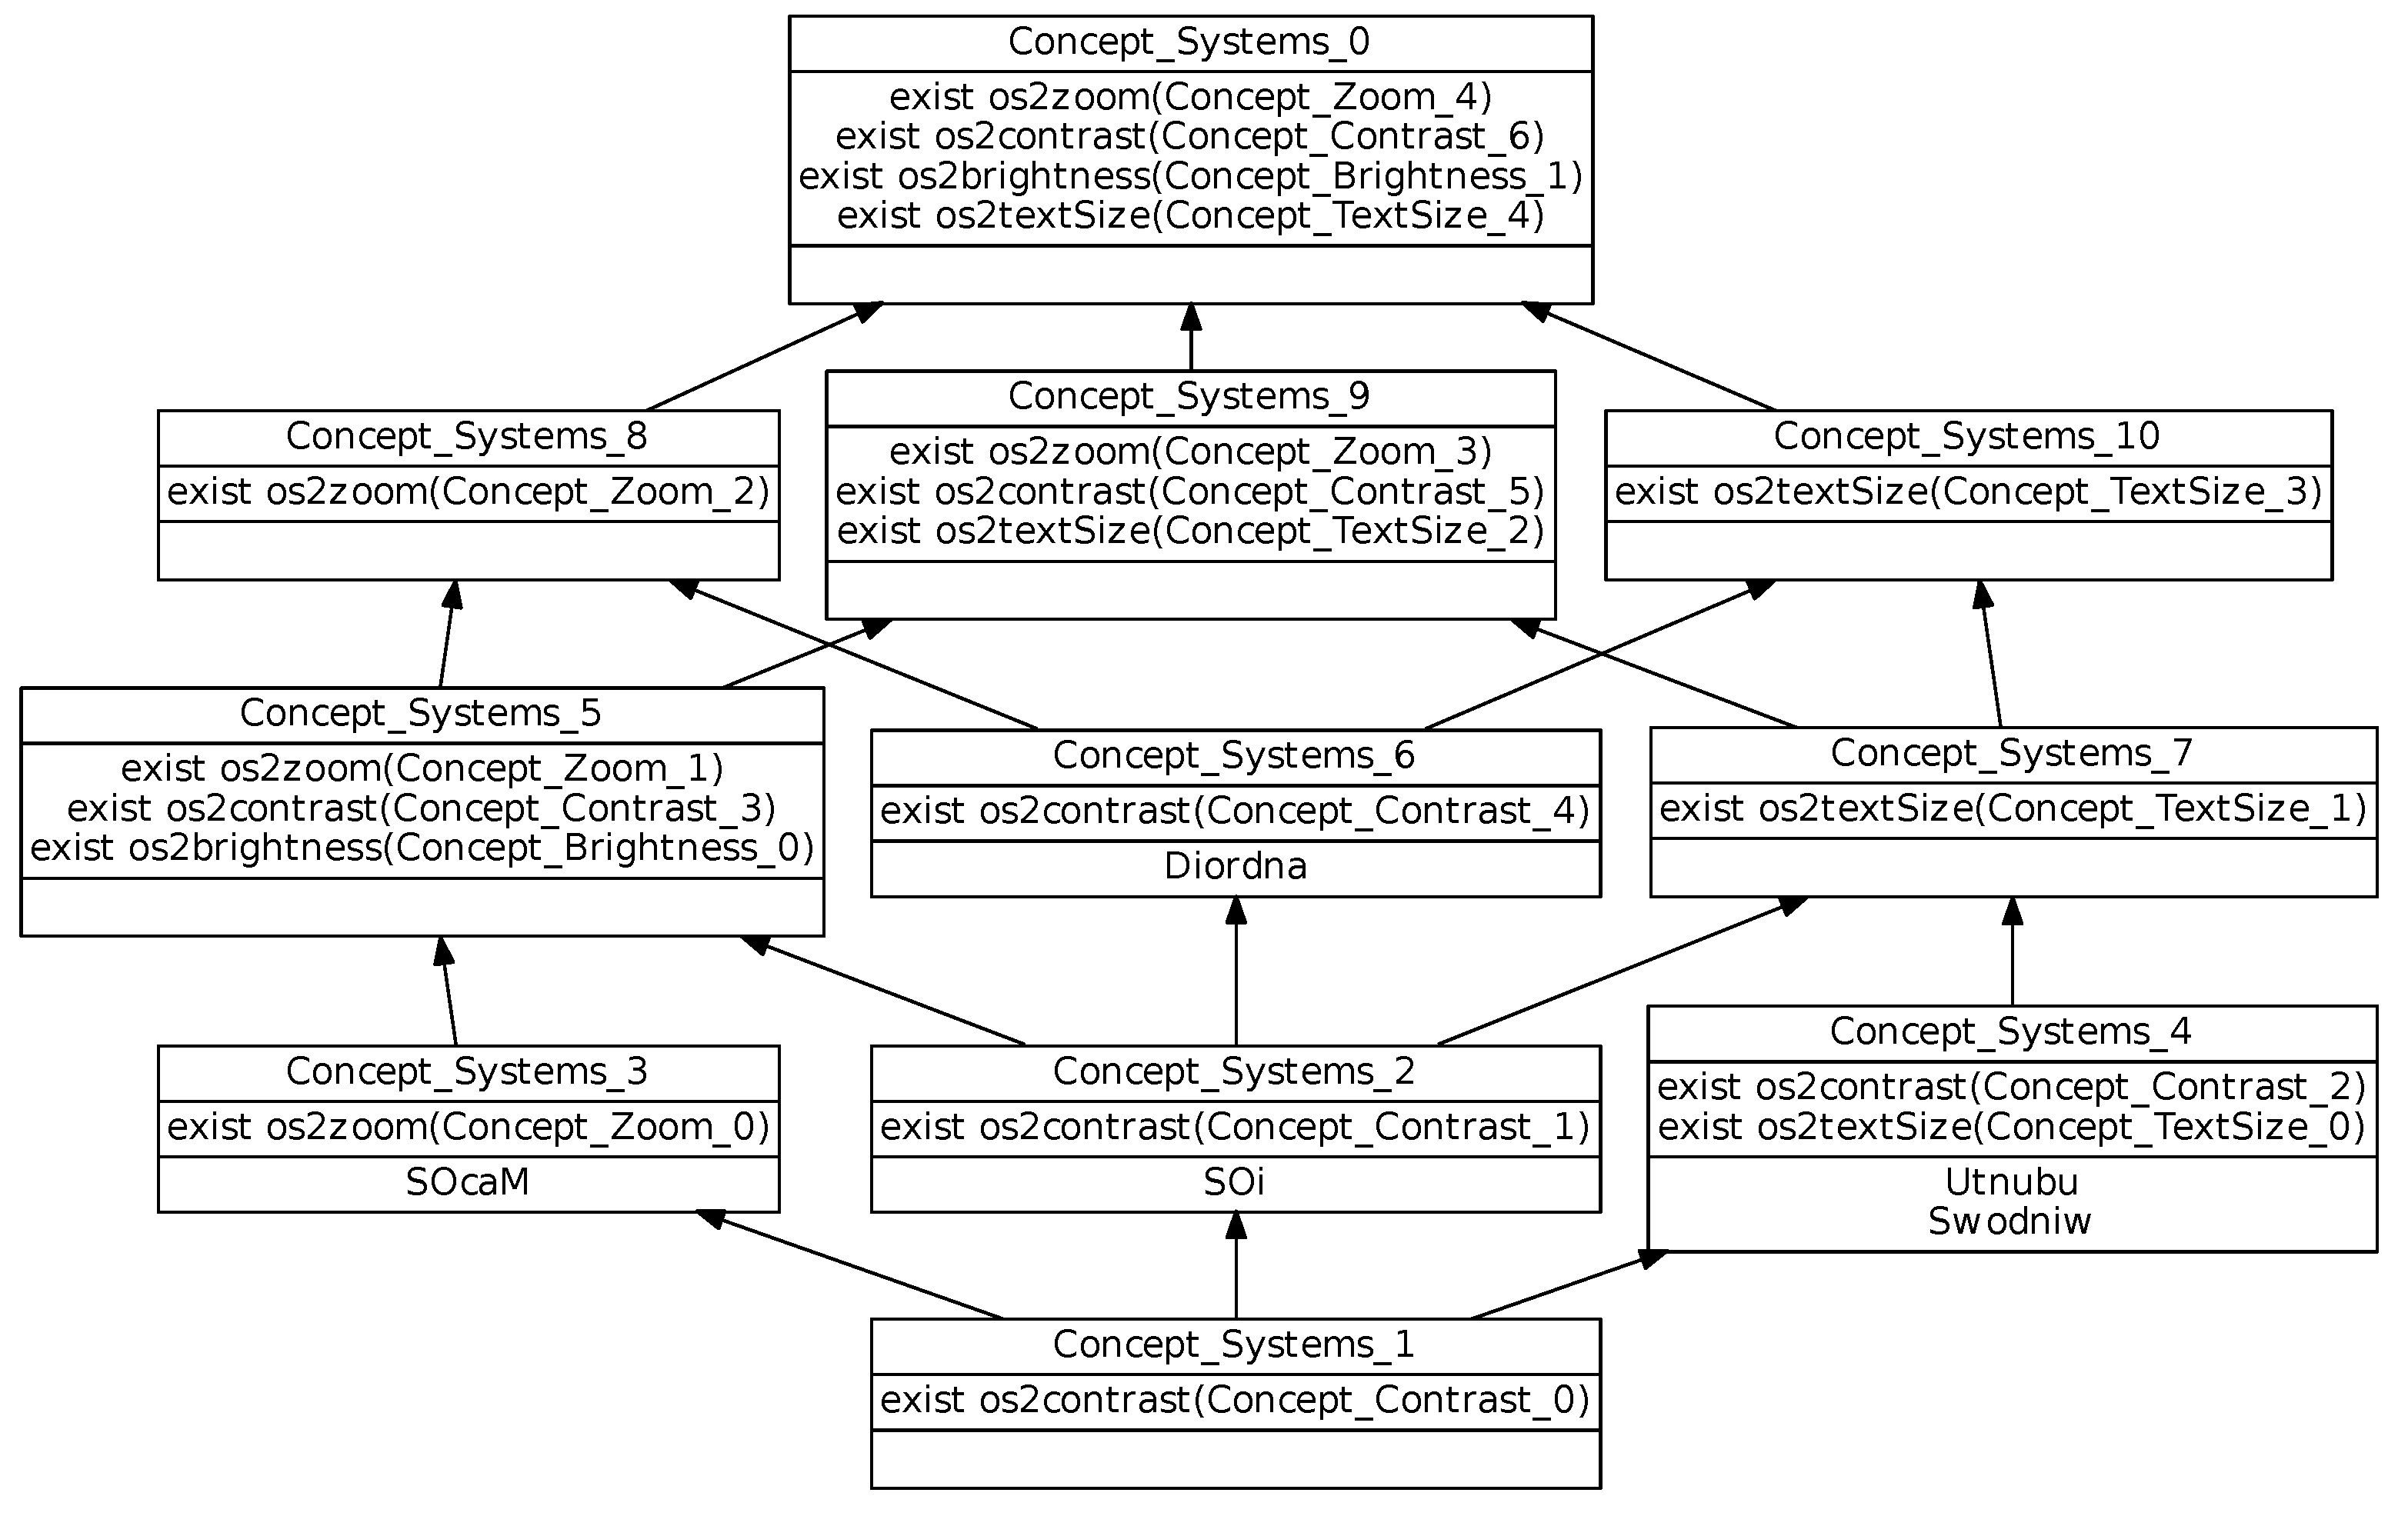
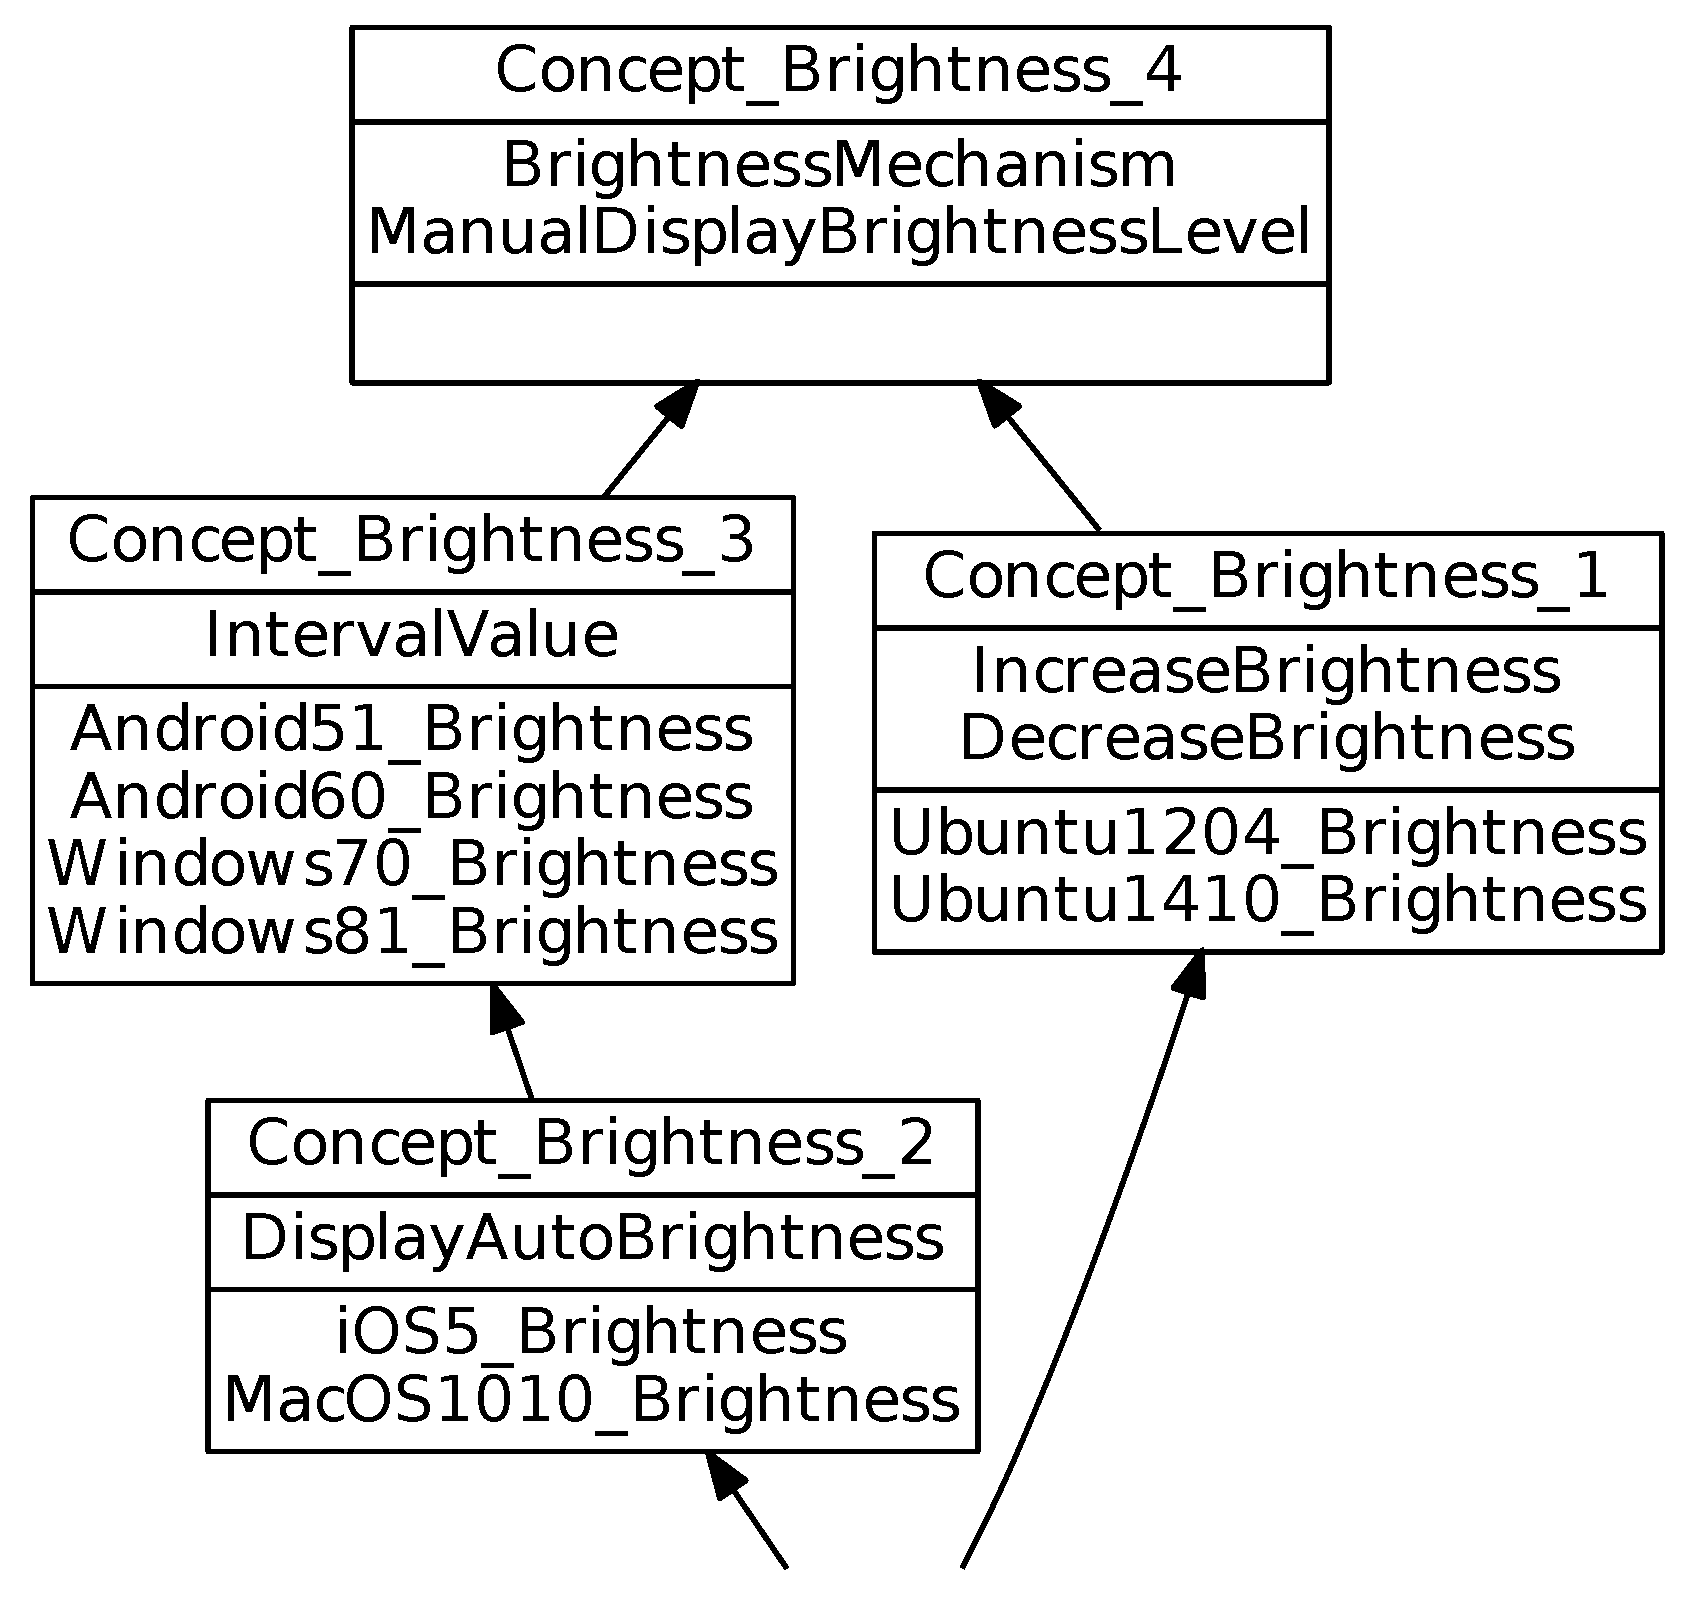
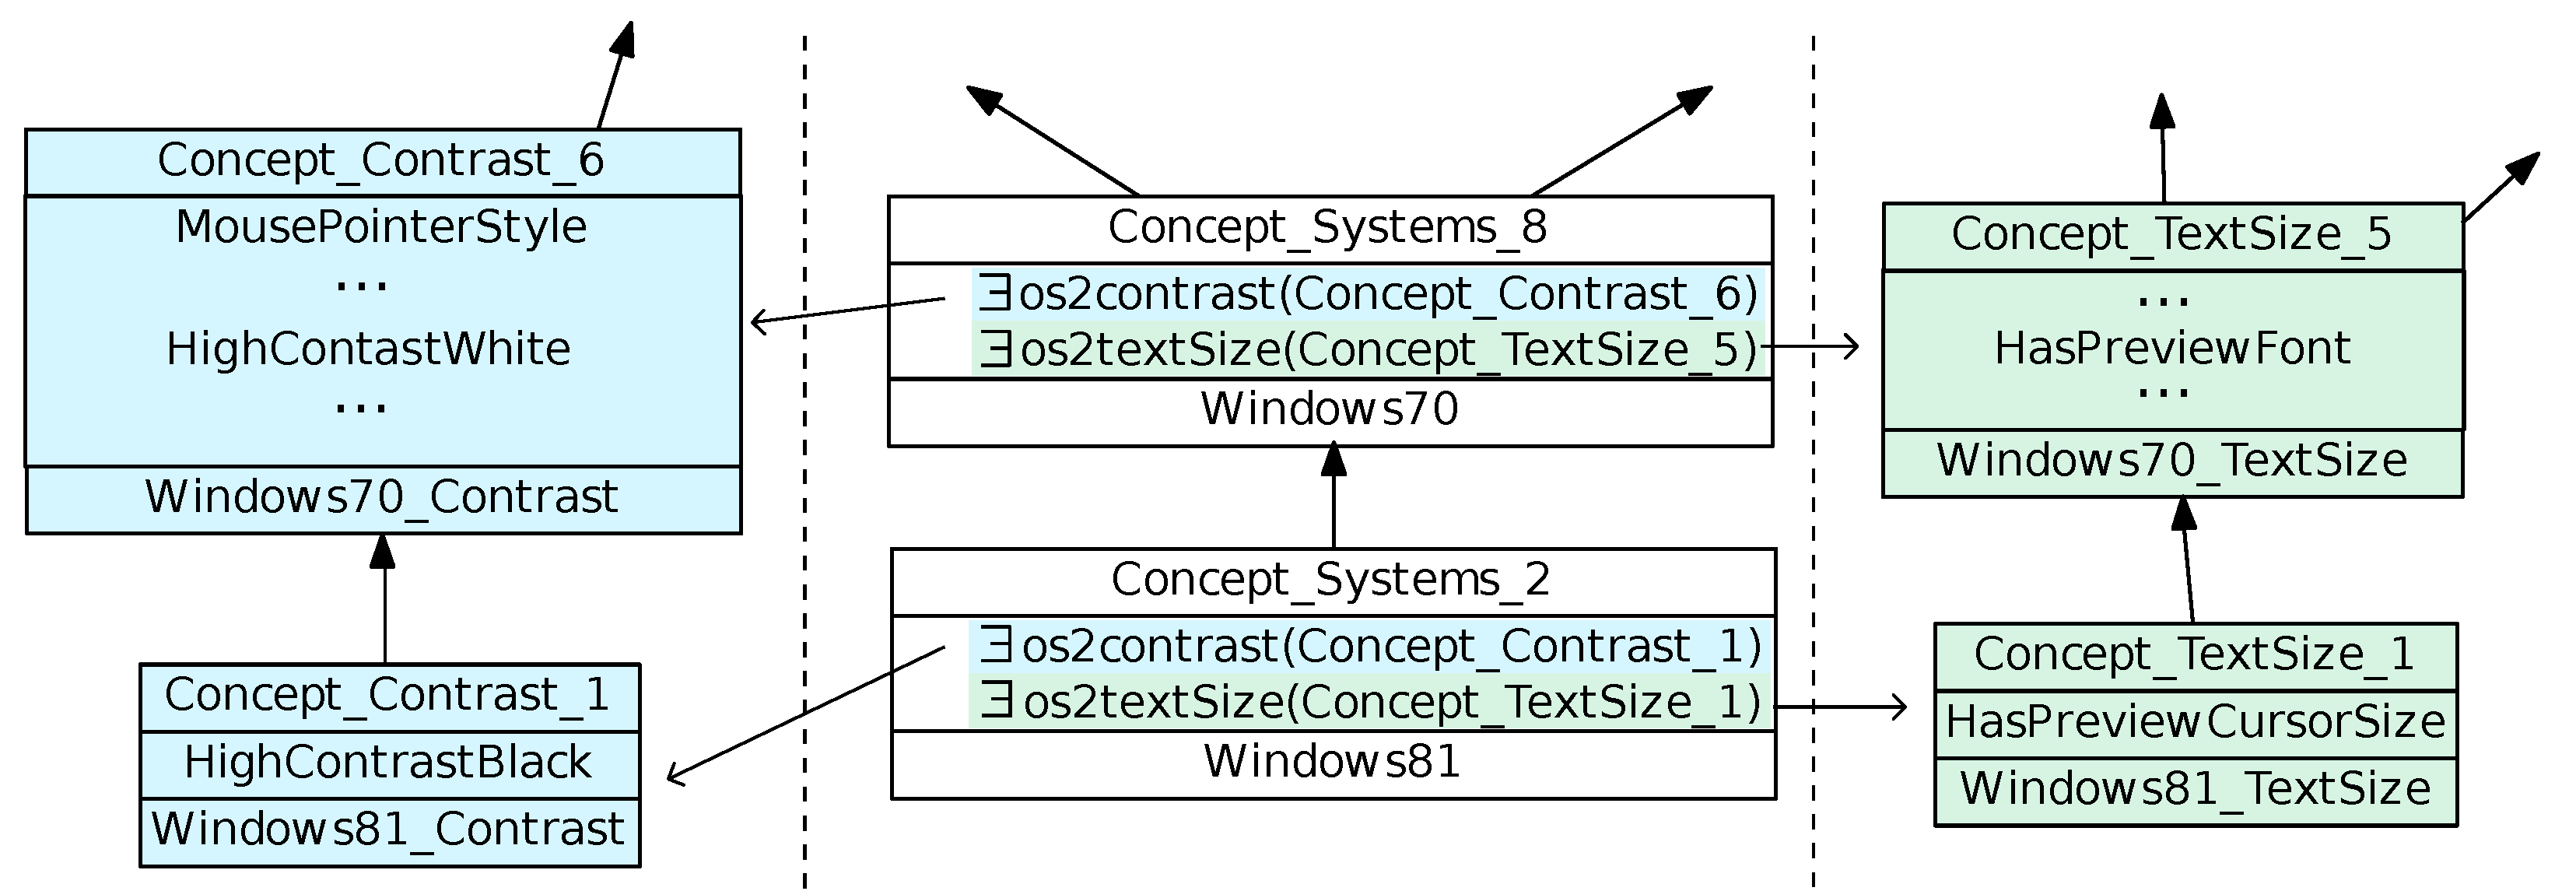
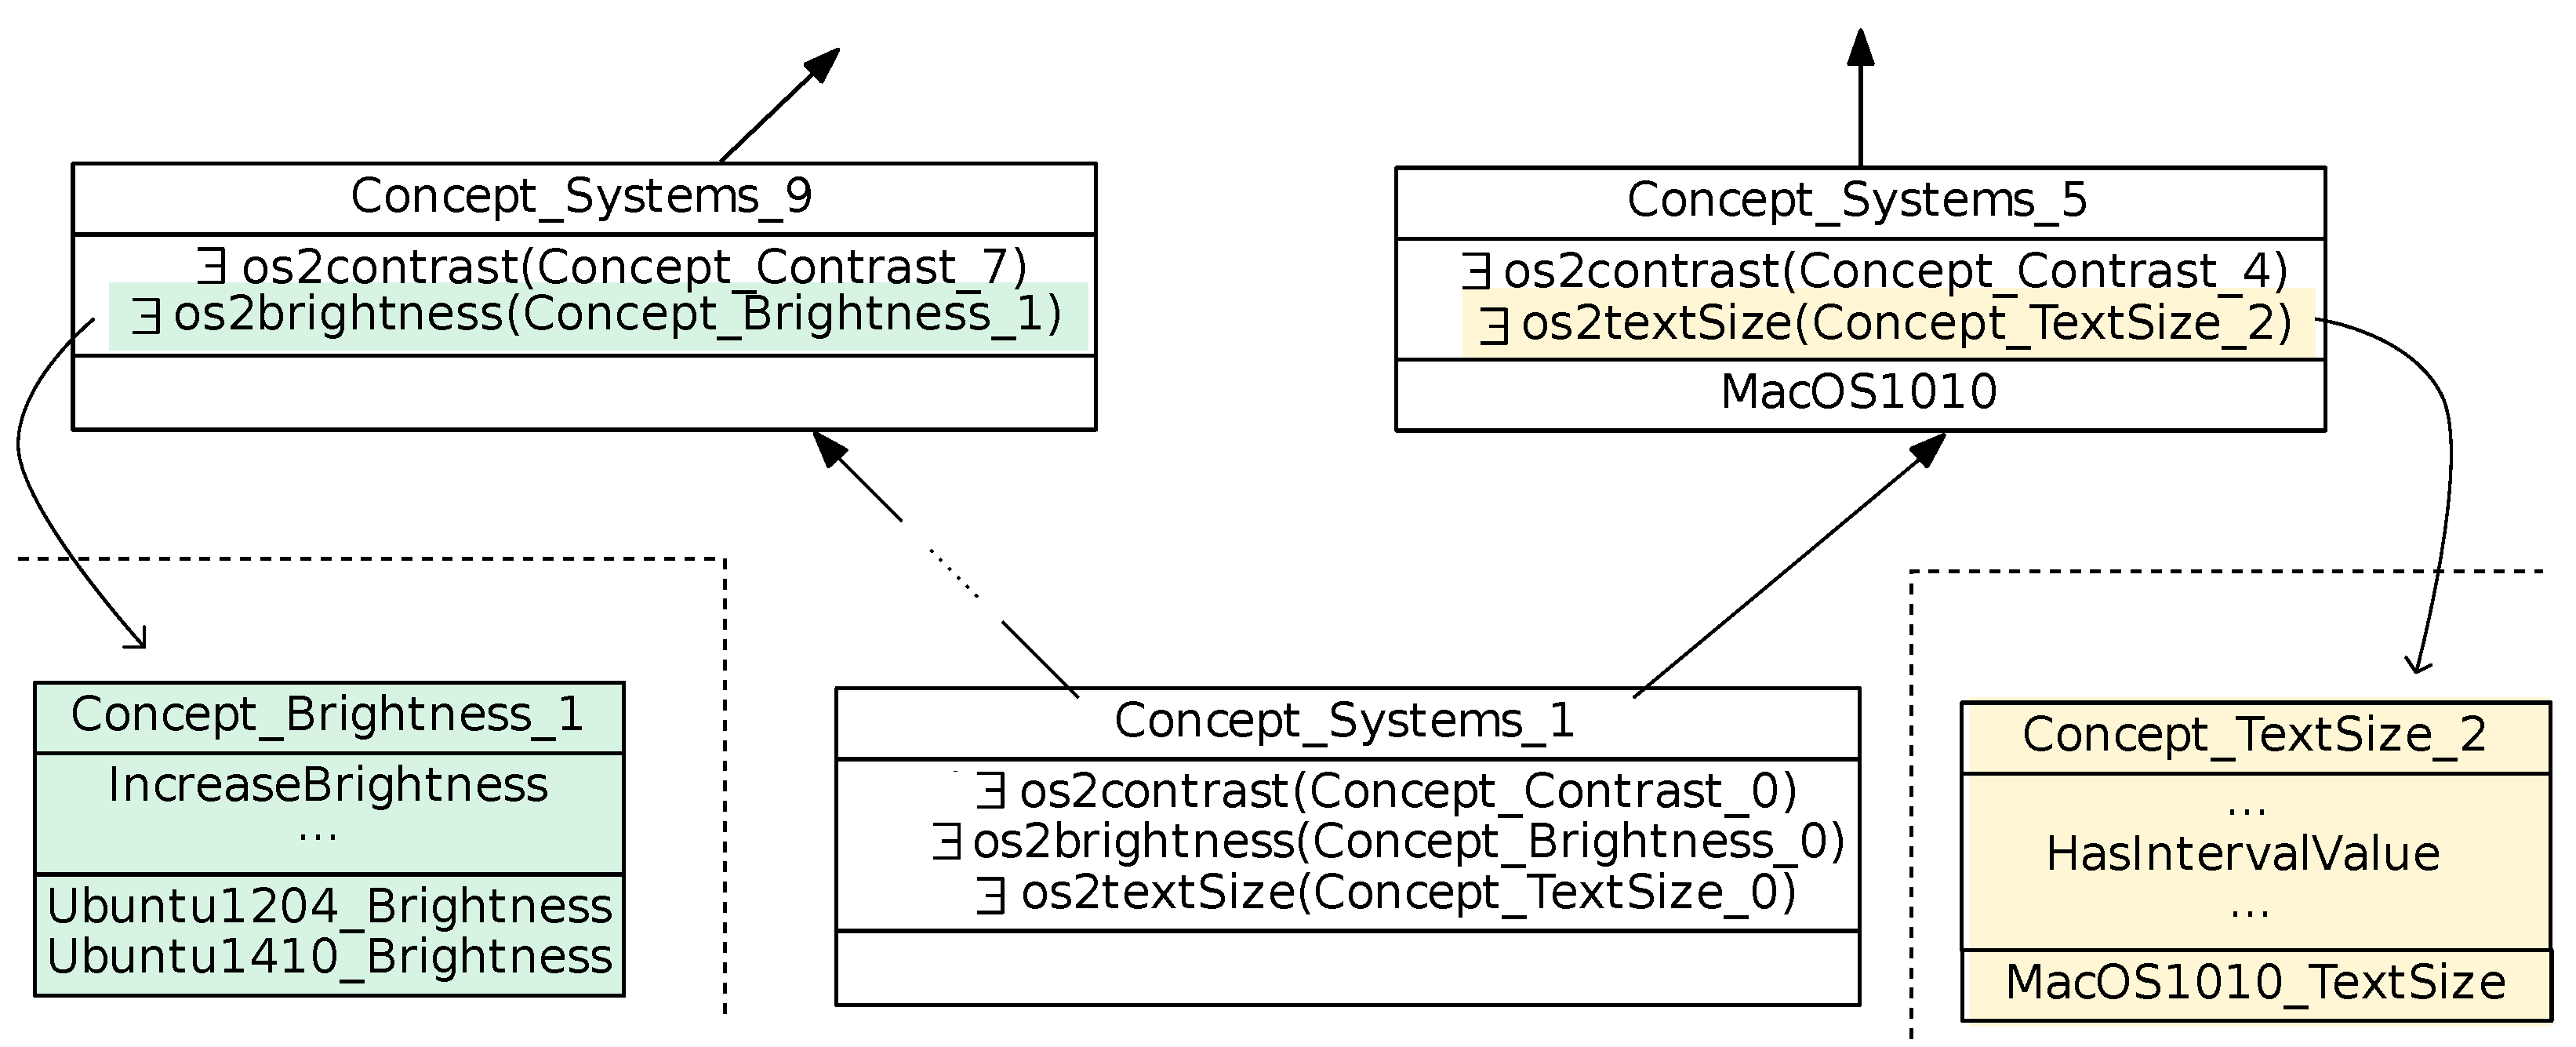
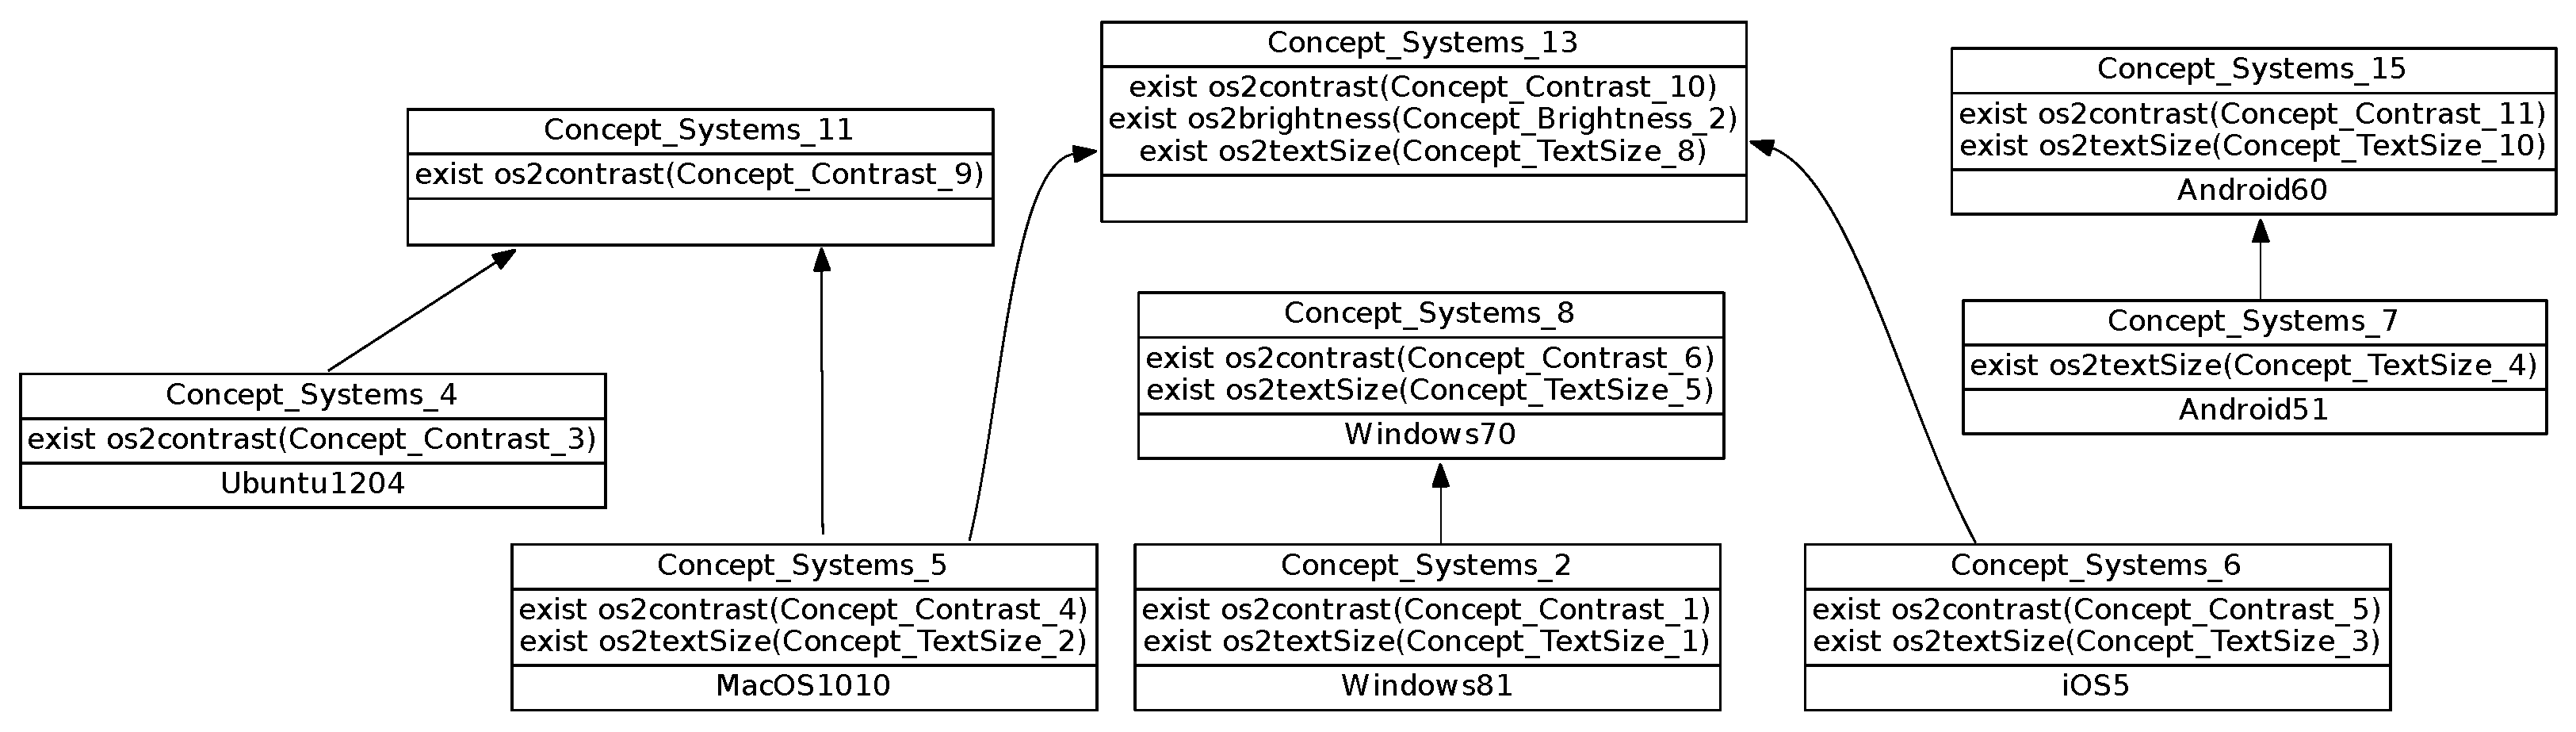
Table 1.
Mapping between features and ontology concepts for Brightness. In row , names have been shorten, e.g., stands for .
Table 1.
Mapping between features and ontology concepts for Brightness. In row , names have been shorten, e.g., stands for .
| N. | Concepts | Features | |||||||
|---|---|---|---|---|---|---|---|---|---|
| Android5.1 | Android6.0 | iOS5 | MacOS10.10 | Ubuntu12.04 | Ubuntu14.10 | Windows7.0 | Windows8.1 | ||
| 1 | BrightnessMechanism | ||||||||
| 2 | ManualDisplay-BrightnessLevel | BrightnessLevel | Brightness | Brightness | Level | Brightness | Brightness | ||
| 3 | DisplayAuto-Brightness | Automatically-AdjustBrightness | |||||||
| 4 | IntervalValue | IntervalFrom | IntervalFrom | IntervalFrom | IntervalFrom | IntervalFrom | IntervalFrom | ||
| 5 | IncreaseBrightness | BrightnessUp | BrightnessUp | ||||||
| 6 | DecreaseBrightness | BrightnessDown | BrightnessDown | ||||||
Table 2.
Brightness mechanism formal context.
| Formal Context Brightness | BrightnessMechanism | ManualDisplayBrightnessLevel | DisplayAutoBrightness | IntervalValue | IncreaseBrightness | DecreaseBrightness |
|---|---|---|---|---|---|---|
| Android51_Brightness | x | x | x | |||
| Android60_Brightness | x | x | x | |||
| iOS5_Brightness | x | x | x | x | ||
| MacOS1010_Brightness | x | x | x | x | ||
| Ubuntu1204_Brightness | x | x | x | x | ||
| Ubuntu1410_Brightness | x | x | x | x | ||
| Windows70_Brightness | x | x | x | |||
| Windows81_Brightness | x | x | x |
Table 3.
Formal context Contrast for the fictitious example.
| Contrast | ChangeContrast | LowContrast | NormalContrast | HighContrast | DarkenColors | ReduceWhitePoint | ReduceTransparency | HighContrastText | HighContrastTheme |
|---|---|---|---|---|---|---|---|---|---|
| DiordnaContrast | x | x | x | ||||||
| SOcaMContrast | x | x | x | x | |||||
| UtnubuContrast | x | x | x | x | x | ||||
| SwodniwContrast | x | x | x | x | x | ||||
| SOiContrast | x | x | x | x | x | x | x |
Table 4.
Formal context Systems for the fictitious example. It has no columns.
| Systems |
|---|
| Diordna |
| SOcaM |
| Utnubu |
| Swodniw |
| SOi |
Table 5.
Relational context os2Contrast for the fictitious example.
| os2Contrast | DiordnaContrast | SOcaMContrast | UtnubuContrast | SwodniwContrast | SOiContrast |
|---|---|---|---|---|---|
| Diordna | x | ||||
| SOcaM | x | ||||
| Utnubu | x | ||||
| Swodniw | x | ||||
| SOi | x |
Table 6.
Metrics on binary implications, co-occurrences and mutex for the fictitious systems.
| Formal Contexts | # Features | # Relationships | # Relationships Upper Bound | ||||
|---|---|---|---|---|---|---|---|
| Bin. Impl. | Co-Occurr. | Mutex | Bin. Impl. | Co-Occurr. | Mutex | ||
| Brightness | 3 | 2 | 1 | 0 | 9 | 3 | 3 |
| Contrast and Color | 9 | 23 | 3 | 8 | 81 | 36 | 36 |
| Text style | 15 | 63 | 40 | 0 | 225 | 105 | 105 |
| Zoom | 14 | 35 | 32 | 0 | 196 | 91 | 91 |
| Central lattice | 19 | 129 | 15 | 25 | 361 | 171 | 171 |
Table 7.
Metrics on the objects, attributes and concepts for the fictitious systems.
| Concept Lattice | #Objects (=#OS) | #Attributes (=#Features or #Relational Attributes) | #Concepts |
|---|---|---|---|
| Brightness | 5 | 3 | 2 |
| Text style | 5 | 15 | 4 |
| Contrast | 5 | 9 | 7 |
| Zoom | 5 | 14 | 8 |
| Central lattice | 5 | 19 | 11 |
Table 8.
Metrics on the objects, attributes and concepts for the case study.
| Concept Lattice | #Objects (=#OS) | #Attributes (=#Features or #Relational Attributes) | #Concepts |
|---|---|---|---|
| Brightness | 8 | 6 | 5 |
| Text style | 8 | 38 | 21 |
| Contrast and Color | 8 | 88 | 21 |
| Central lattice | 8 | 47 | 34 |
Table 9.
Metrics on the FMs.
| Brightness | Contrast and Colors | |||||
| FM | # Features | # Configurations | Depth | # Features | # Configurations | Depth |
| Android5.1 | 4 | 1 | 3 | 41 | 13,200 | 6 |
| Android6.0 | 4 | 1 | 3 | 42 | 26,400 | 6 |
| iOS5 | 5 | 2 | 3 | 16 | 254 | 5 |
| MacOS10.10 | 10 | 2 | 8 | 45 | 12,288 | 7 |
| Ubuntu12.04 | 10 | 14 | 7 | 49 | 5776 | 7 |
| Ubuntu14.10 | 9 | 13 | 6 | 43 | 13,680 | 6 |
| Windows7.0 | 5 | 1 | 4 | 59 | 379,260 | 7 |
| Windows8.1 | 5 | 1 | 4 | 83 | 3,580,200 | 7 |
| Text Styles | Zoom | |||||
| FM | # Features | # Configurations | Depth | # Features | # Configurations | Depth |
| Android5.1 | 33 | 480 | 6 | 4 | 4 | 3 |
| Android6.0 | 10 | 16 | 3 | 4 | 3 | 3 |
| iOS5 | 16 | 76 | 5 | 16 | 132 | 5 |
| MacOS10.10 | 36 | 216 | 7 | 38 | 1536 | 6 |
| Ubuntu12.04 | 17 | 32 | 7 | 12 | 32 | 7 |
| Ubuntu14.10 | 13 | 60 | 6 | 11 | 31 | 6 |
| Windows7.0 | 16 | 2 | 6 | 39 | 46,764 | 6 |
| Windows8.1 | 32 | 64 | 6 | 35 | 5859 | 7 |
Table 10.
Metrics on the binary implications, co-occurrences and mutex.
| Mechanisms | # Features | # Relationships | Relationships Upper Bound | ||||
|---|---|---|---|---|---|---|---|
| Bin. Impl. | Co-Occurr. | Mutex | Bin. Impl. | Co-Occurr. | Mutex | ||
| Brightness | 6 | 9 | 2 | 4 | 100 | 45 | 45 |
| Text style | 38 | 261 | 75 | 295 | 1444 | 703 | 703 |
| Contrast and Color | 88 | 990 | 577 | 2174 | 7744 | 3828 | 3828 |
| Central lattice | 47 | 510 | 17 | 348 | 2209 | 1081 | 1081 |
Table 11.
List of operating systems analyzed in the literature.
| Previous Work | Operating Systems |
|---|---|
| [12] | Linux, MacOS, Windows |
| [13] | iOS, Mac, Windows |
| [14] | MacOS 7-9, MacOS X, Windows 95-2000, Windows XP |
| [42] | Linux Ubuntu 6.10, Windows XP Service Pack 2 |
| [15] | Windows, Android, Apple Operating System |
Table 12.
OS and their features from [14].
Table 12.
OS and their features from [14].
| Features | Operating Systems | |||
|---|---|---|---|---|
| Mac OS 7-9 | Mac OS X | Windows 95-2000 | Windows XP | |
| Magnification | CloseView | Zoom | Magnifier | Magnifier |
| Contrast | Yes | Yes | Yes | Yes |
| Display | Yes | Yes | Yes | Yes |
Table 13.
OS and their features from [13].
Table 13.
OS and their features from [13].
| Features | Operating Systems | ||
|---|---|---|---|
| Windows | Mac OS | iOS | |
| Magnification | customizable, to 16× | customizable, to 40× | customizable, to 15× |
| visual Format | invert colours, transparency | invert colours, grayscale, transparency | invert colours, grayscale, contrast |
| cursor size | Yes | No | No |
Table 14.
OS and their features from [15].
Table 14.
OS and their features from [15].
| Features | Operating Systems (Latest Version) | ||
|---|---|---|---|
| Windows | Android | Apple Operating System | |
| Magnifier | Yes | Yes | Yes |
| Hover Text | Yes | Yes | Yes |
| Dark Mode | Yes | Yes | Yes |
| Flexible Display | Yes | Yes | Yes |
Publisher’s Note: MDPI stays neutral with regard to jurisdictional claims in published maps and institutional affiliations. |
© 2021 by the authors. Licensee MDPI, Basel, Switzerland. This article is an open access article distributed under the terms and conditions of the Creative Commons Attribution (CC BY) license (https://creativecommons.org/licenses/by/4.0/).
Share and Cite
MDPI and ACS Style
Kouhoué, A.W.; Bonavero, Y.; Bouétou Bouétou, T.; Huchard, M. Exploring Variability of Visual Accessibility Options in Operating Systems. Future Internet 2021, 13, 230. https://doi.org/10.3390/fi13090230
AMA Style
Kouhoué AW, Bonavero Y, Bouétou Bouétou T, Huchard M. Exploring Variability of Visual Accessibility Options in Operating Systems. Future Internet. 2021; 13(9):230. https://doi.org/10.3390/fi13090230
Chicago/Turabian StyleKouhoué, Austin Waffo, Yoann Bonavero, Thomas Bouétou Bouétou, and Marianne Huchard. 2021. "Exploring Variability of Visual Accessibility Options in Operating Systems" Future Internet 13, no. 9: 230. https://doi.org/10.3390/fi13090230
Note that from the first issue of 2016, this journal uses article numbers instead of page numbers. See further details here.