Academic Excellence, Website Quality, SEO Performance: Is there a Correlation?
by
 ,
,
Andreas Giannakoulopoulos
1,* ,
,
Nikos Konstantinou
1,
Dimitris Koutsompolis
2,
Minas Pergantis
3,* and
Iraklis Varlamis
4,* 1
Department of Audio and Visual Arts, Ionian University, 7 Tsirigoti Square, 49100 Corfu, Greece
2
Faculty of Communication and Media Studies, National and Kapodistrian University of Athens, 5 Stadiou Str., 10562 Athens, Greece
3
Laboratory of Interactive Arts, Ionian University, 7 Tsirigoti Square, 49100 Corfu, Greece
4
Department of Informatics and Telematics, Harokopio University of Athens, 70 Eleftheriou Venizelou Str., 17676 Athens, Greece
*
Authors to whom correspondence should be addressed.
Future Internet 2019, 11(11), 242; https://doi.org/10.3390/fi11110242
Submission received: 15 October 2019
/
Revised: 5 November 2019
/
Accepted: 12 November 2019
/
Published: 18 November 2019
(This article belongs to the Special Issue Search Engine Optimization)
Abstract
:The academic excellence of universities around the globe has always been a matter of extended study and so has the quality of an institution’s presence in the World Wide Web. The purpose of this research is to study the extent to which a university’s academic excellence is related to the quality of its web presence. In order to achieve this, a method was devised that quantified the website quality and search engine optimization (SEO) performance of the university websites of the top 100 universities in the Academic Ranking of World Universities (ARWU) Shanghai list. A variety of tools was employed to measure and test each website and produced a Web quality ranking, an SEO performance ranking, as well as a combined overall web ranking for each one. Comparing these rankings with the ARWU shows that academic excellence is moderately correlated with website quality, but SEO performance is not. Moreover, the overall web ranking also shows a moderate correlation with ARWU which seems to be positively influenced by website quality and negatively by SEO performance. Conclusively, the results of the research indicate that universities place particular emphasis on issues concerning website quality, while the utilization of SEO does not appear to be of equal importance, indicating possible room for improvement in this area.
1. Introduction
The present research investigates the relevance of universities’ performance in international rankings based on academic criteria and their ranking according to the quality of their online presence, their ability to properly promote their content in search engines and finally, in combination, their overall web presence.
Undoubtedly, the idea of a university ranking was not introduced in 2003 with the celebrated Shanghai list or with the TIMES ranking in 2004 [1]. It can be traced as far back as 1900, when there were studies concerning the most successful men in England, linking their professional and broader social achievements with their studies and the universities they had attended. In essence, this was an attempt to correlate the academic quality of universities with indicators less academic and more applicable to everyday life. This correlation was based on measurable and verifiable indicators.
Some might argue that rankings do not always correlate with the actual quality of an institution, but they are a factor for prospective students to decide on whether they will enroll in a specific institute or not [2].
Bell et al. [3] contacted an online survey to examine the scale of online education in Australian universities. These included features such as online courses and access to web libraries. This study had shown that Australian universities had a good level of online components’ embracement. In fact, more than 54% of universities were found to contain online features and elements. Since this study is outdated, we can safely assume that not only will this percentage be higher by now, but it will also include more aspects.
In addition, Will et al. [4] performed a study, analyzing more than 3000 university websites in order to examine the ways academic institutions (in higher education) are making use of the Web to facilitate student relations. In this study, the emphasis on higher education websites was given on alumni and their friends and then on prospective students. Will et al. [4] stress how prospective students are going online in order to research academic institutions. McAllister-Spooner [5] confirms that some years later, the web remains the basic research tool for prospective students, counselors and parents.
Baka et al. [2] also affirm that the success or failure of an academic institution to market a program is dependent on its website. When a user and consequently a prospective student—in our case—enters a website, they seek information [6]. In fact, a few years earlier, Abrahamson [7] mentioned that if the potential students do not have a pleasant experience with the website of an academic institution, they will quit the process of enrolling. More than a decade later, Kaur et al. [8] are emphasizing the importance of performance in order for a website to be successful. Kaur et al. [8] analyzed the websites of major universities in Punjab (India) in order to evaluate website elements that could optimize web performance such as speed, SEO and security. Khwaldeh et al. [9], in their study about the relationship between the information quality of e-Services of the websites of Jordanian universities and ICT Competence are mentioning e-Services in general as a basic factor of competence.
In general, there have been many studies that attempt to examine the online presence of academic institutions focusing on usability, user experience or services they provide. The majority of them are referring to universities in a specific location (for instance Jordanian universities, USA universities and Indian universities). What is of great interest is the emphasis given on usability. Conway et al. [10] in a similar study about political websites had argued that usability is more important than quantity. If the information is difficult to be found by a user, then the website will be deemed as less useful.
Furthermore, when it comes to ranking and accessibility and visibility, Baka et al. [2] found that there is a correlation between the top academic institutions on the list, compared to those that they are on the lowest positions on the list. At the same time, Acosta-Vargas et al. [11] on their study on 20 universities found out that despite the ranking and the status of a university, there are still accessibility issues that have yet to be solved, a fact confirmed by Alahmadi et al. [12] who mention that the more websites are evolving, the more information they offer and the more inaccessible to people with disabilities they are becoming.
From the above, it becomes apparent that university websites should have two main goals in mind: Existing students and alumni and potential students. The first goal should be linked with material focused on e-Services and e-Learning while for the second goal, the website should offer informative material. In order for the academic institution’s presence to be deemed as satisfactory, the website should keep in mind the terms of usability and accessibility along with material of good quality.
Furthermore, related to our research in the broader sense is the topic of academic SEO (ASEO) that has been gaining attention in the recent years. ASEO applies the SEO principles in the search for academic documents in academic search engines such as Google Scholar and Microsoft Academic. [13]. Towards this, a variety of algorithms are used. All of them utilize the number of citations the articles received combined with other factors like the author’s index, the date of publication, the institution etc. [14]. Beel et al. [13] in their study a decade earlier found that most likely Google Scholar and Microsoft Academic are taking into account the number of citations in order to rank the publications and present them to the user. Just by having a look at these Search Engines today, we can see more or less that the number of citations is still relevant, combined with some other factors, confirming Rovira et al [14].
Beel et al. [13] are stressing the importance for researches to ensure that their publications will receive a high rank on the academic search engines. By making good use of ASEO, researches will have a higher chance of improving the visibility of their publications and have their work read and cited by more researchers. Ale [15] has come up with simple steps that researchers can follow, in order to improve their visibility on the academic search engines. Despite the importance of ranking higher, researchers believe that the authors should not try to hack ASEO in order to approve higher on the list, but use the principles of ASEO in order to help users understand the relevance of the topic [13,14]. In this way, ASEO is similar to traditional SEO, where institutions want to make a good use of a SEO without ending up spamming the users, because this will have an undesirable effect to the end user.
As a measure of academic excellence this research used the Academic Ranking of World Universities (ARWU—also known as the Shanghai list). It is a recognized prestigious university ranking system that is widely accepted and includes measurable and verifiable indicators that reflect the work done in many different aspects of academic life (teaching, research, international relations, and collaborations).
As discussed above, an important parameter for any university these days is the quality of its website presence, i.e., the adequacy of each university’s website and its ability to properly present the university’s image to the general audience. The work of each university exists only when it encounters and interacts with society. At the same time, this research analyzes the importance of SEO—search engine optimization for universities, as it essentially represents the right concern to facilitate content search; that is to say, it meets to the utmost degree the need of connecting with society.
Therefore, these two key parameters which dominate the digital age, website quality, and SEO (search engine optimization) are combined into a single average index, which is illustrated as web presence, and an attempt is made to investigate their association with the ARWU ranking.
2. International Rankings
International rankings are a tool comparing the multidimensional academic and—mainly—research work undertaken at universities in recent years. Their popularity with the public is steadily growing. Indeed, for the prestigious and traditional higher education institutions, they often constitute a key driver of their growth, as they act as a catalyst in attracting not only new students, but also funders and donors [16].
There is no doubt that there are a large number of higher education institutions operating worldwide. Within this almost chaotic context, it is necessary to establish academic criteria with international common reference and high credibility. Quality assurance systems do not have much history, and efforts at European or international level to cooperate on this issue cannot be said that found common ground.
According to Isidro Aguillo [17], who heads the Webometrics research team, there are 28,000 universities worldwide. Most rankings collect and process data for all of these universities. Based on specific and predefined criteria, they elaborate indicators and the overall score of each university. They then select the first 500 or 600 or 1000 universities and compile the final ranking table. A university in the top 300 with a simple percentage reduction is ranked among the top 1% of the world’s best universities. If it is in the top 1000 then it is at the top 3.5% of the best universities in the world. However, we must note that this illustration is an ongoing process, where individual indicators are regularly updated in an effort to make the ranking systems better reflect the true position of the universities.
Ranking is an ever-changing and comparative process. This practically means that, even though a university may go up on individual indicators, if other universities go up faster on the same indicators, that particular university may be lower in the rankings; the same goes for a university that manages to maintain its indicators at the same level. Competition between universities internationally has intensified in recent years and the differences in ranking are in many cases marginal.
Thus, it is necessary to increase the total number of universities included in the ranking lists. For example, from 2003 to 2018 the ARWU ranking, known as the Shanghai list, was publishing rankings of the top 500 universities worldwide. For the first time in 2019 it published a list of the top 1000 universities. Correspondingly, Times Higher Education increased the number of universities included in the rankings from 500 to 800, and the Center of World University Ranking from 1000 to 2000.
2.1. Major Rankings
2.1.1. Academic Ranking of World Universities (ARWU)
The Academic Ranking of World Universities (ARWU) [18], known as the Shanghai list, is perhaps one of the best-known rankings. It was created and is maintained by Shanghai Jiaotong University in China. Ratings have been updated every year since 2003.
The rankings compare and classify the top 1200 higher education Institutions according to an algorithm that includes the following individual indicators:
- The number of graduates who have received major prizes (Nobel Prize, Fields Medal, etc.).
- The number of faculty members who have received major prizes (Nobel Prize, Fields Medal etc.).
- The number of faculty members included in the lists of researchers with a very high number of citations.
- The number of publications in nature and science journals.
- The number of publications included in the Science Citation Index and Social Sciences Citation Index databases.
- The fully measurable per capita academic performance, according to a published algorithm.
The methodology is presented in an article written by the list creators Liu and Cheng [19] in which they state that their original goal was to study “the gap between Chinese and other universities around the world, according to academic criteria”.
2.1.2. Webometrics Ranking of World Universities
The Webometrics ranking is compiled by Cybermetrics (CCHS) [20] and it provides information on more than 18,000 universities according to their online presence and the impact of their research work. Universities are ranked by criteria which concern their presence and popularity on the web, the impact of their research work as reflected in the total number of cross-references to the articles and publications of their professors and researchers, as well as the percentage of their publications.
The ranking of each university is based on the following individual indicators:
- Presence rank;
- impact rank;
- openness; and
- excellence rank
2.1.3. Times Higher Education World University Rankings
Times Higher Education (THE) rankings [21] are considered to be one of the three most influential rankings at international level. In 2009, THE started collaborating with Thomson Reuters to develop a new university ranking system called Times Higher Education World University rankings. The THE World University Rankings methodology includes 13 indicators classified in 5 categories, which are analyzed into individual indicators as follow:
- Private sector revenue;
- international dimension;
- teaching; and
- research and research impact.
The specific body implementing the evaluation selected 980 universities from an initial selection of 1313 universities that are distinguished in scientific research.
2.1.4. QS World University Rankings
QS World University Rankings [22] include the top 500 universities, were created by Quacquarelli Symonds (QS) and are published annually since 2004. The QS rankings use peer review data collected by researchers, academics, and employers; they also take into account the number of international staff, of students, of Scopus citations and teacher/student ratios.
The QS ranking table for 2017 includes the 950 best universities in the world, after analyzing at least 10,000 Institutions. The scores and rankings in each of the individual five indicators are announced for the top 500 only. The overall score and position in the world rankings are announced for the top 950 universities.
2.1.5. Center for World University Rankings (CWUR)
The Center for World University Rankings (CWUR) [23] publishes a global ranking of universities, perhaps the only one that measures of the quality of the education and training of the student, as well as the prestige of faculty members and the quality of their research without relying on surveys, questionnaires, interviews, and data submission by the universities themselves.
CWUR [23] uses the following indicators, which are based on measurable data and are generally accepted for ranking the top 1000 universities in the world:
- Quality of education and faculty;
- alumni employment;
- publications and citations;
- influence and wider impact; and
- patents
2.1.6. US News—Best Global University Rankings
US News rankings of the best universities in the world were created to provide a picture of how universities can compare worldwide [24]. Of all the universities in the world, the final rankings of the 1250 best universities cover a range of 60 countries. The first step in producing these rankings [25] involves the compilation of a first group of top universities, which are used in a second phase to rank the top 1250. For a university to be included in the top 1250 ones, it must first be among the top 250 universities in the results of Thomson Reuters’ global research reputation.
The “U.S. News and World Report” ranks the top 1250 institutions using a wide range of different criteria:
- Global and local research reputation;
- publications, textbooks, conferences;
- total and weighted impact of citations;
- number and percentage of publications that are among the 10% of the most cited publications; and
- international collaborations.
2.1.7. National Taiwan University (Performance Ranking of Scientific Papers)
The ratings of National Taiwan University are mainly based on the research work produced and published by each Institution, on the impact of the published work, and on their final particular distinction [26]. They are under the auspices of the Taiwan Higher Education Quality Assurance Authority and have been ranking the top 500 universities in the world since 2007, based solely on their scientific publications and the impact they have on the international scientific community.
The key axes of evaluation are summarized in three basic variables: Research production, research impact, and research excellence.
The main points of all the above are summarized in Table 1:
2.2. Choosing the Most Appropriate Academic Excellence Ranking
The selection of the Academic Ranking of World Universities (ARWU), known as the Shanghai list [18], is ultimately the most consistent choice for evaluation rankings as it combines the following characteristics:
- It is one of the most popular rankings, with many years of publications and consistent credibility over the years.
- All of the indicators used to create the ranking are measurable.
- All of the indicators used to create the ranking are publicly verifiable by third parties.
- Evaluations are updated every year. Since 2009 the rankings have been published by the Shanghai Ranking Consultancy.
As it has already been mentioned, the ranking table includes various indicators. For each indicator, the highest-performing institution receives a score of 100, so all other institutions receive a score below the score of the first one. The indicators are [27]:
- The number of graduates who have received major prizes (Nobel Prize, Fields Medal, etc.).
- The number of faculty members who have received major prizes (Nobel Prize, Fields Medal etc.).
- The number of faculty members included in the lists of researchers with a very high number of citations.
- The number of publications in nature and science journals.
- The number of publications included in the Science Citation Index and Social Sciences Citation Index databases.
- The fully measurable per capita academic performance, according to a published algorithm.
The criteria of ARWU are therefore purely academic and largely focused on research. The research characterizes universal universities and distinguishes them from colleges and education centers. Moreover, the Shanghai list publishes rankings based on data that anyone can verify. It draws on data from official authorities in each country and avoids both data that may be questionable and subjective evaluation judgments, such as opinion polls, which, although based on common sense, actually raise questions about the way they are carried out and the weight assigned to them in many rankings (in 30–40% of them). Finally, it is important to use scaled scores for each ranking, but each individual score must always be relative to the highest score in its ranking, i.e., on a 100-degree scale, the first institution receives a score of 100 and all the others receive a score below that.
Additionally, the ranking system has not remained static over the course of its existence. In an effort to measure achievements in multiple different fields of study while retaining the same transparency of its criteria the Shanghai ranking has engaged with over 6000 professors from top 100 universities globally [28]. These individuals whose names are publicly available have been surveyed and their answers were used to create a list of internationally accepted awards and journals which are recognized as top awards or top journals and which are used in the ranking. Even now, any professor from a top 100 institution can actively contribute to this survey.
Despite the fact that other rankings focus more on the teaching aspect or the overall presence of an institution (including its online presence) the result focused nature of Shanghai was more suited as a starting point for our research. Evaluation methods on these different aspects can be a source of subjectivity while no one can argue against the output-oriented methodology of the ARWU.
For this reason, the Shanghai list is the most reliable and appropriate one for the purposes of the present research and, therefore it is the one that was selected.
3. Methodology
With regards to methodology, the research process consisted of a series of exact measurements and tests that were carried through using a set of reckoning tools specifically developed for their appropriate purpose. All measurements and tests took place in September 2019. In order to consolidate the different measurements and test results into ratings, the gravity of each measurement was judged by its scope and importance and the measurement was assigned a weight according to its contribution in evaluating the equivalent characteristic of each website. Then each rating was calculated by means of a weighted average. The rationale behind each weight is touched upon but ultimately the evaluating process is a result of the researchers’ experience with both the reckoning tools and the specific requirements of website design and development.
3.1. Measuring the Quality of a Website
In order to examine whether there exists a quantifiable correlation between a university’s academic excellence ranking and the quality of its website it was necessary to quantify the latter through a series of tests and measurements. The results of these tests and measurements were then used in a unifying equation that yielded a metric of website quality in a 100-degree scale.
For the purpose of this quantification we assumed three major characteristics of a website that indicate its quality:
- Website structure;
- website accessibility; and
- website performance.
For each of these characteristics multiple tests were performed and the results of these tests were combined to achieve a rating that was an accurate representation of the characteristic.
3.1.1. Evaluation of Website Structure
The structure of each university’s website was evaluated based on the following aspects:
- Validity of HTML;
- validity of CSS;
- Google’s mobile friendliness test; and
- Google lighthouse best practices audit.
Evaluation of a Website’s HTML
One of the most important aspects of a website’s structure is the validity of its HTML. A valid code ensures a website’s compatibility with multiple browsers, the uniformity and speed of rendering as well as a sound foundation for future technology support. It also positively affects both SEO performance and accessibility, both metrics that were measured individually for the purpose of this methodology [29].
In order to test HTML validity, the Markup Validation Service of the World Wide Web Consortium (W3C) [30] was employed. W3C is “an international community where different member organizations, a full-time staff, and the public work together to develop Web standards” [31]. It is the most prominent international web standards organization and is widely acknowledged by the scientific community. “Most Web documents are written using markup languages, such as HTML or XHTML. These languages are defined by technical specifications, which usually include a machine-readable formal grammar (and vocabulary). The act of checking a document against these constraints is called validation and this is what the Markup Validator does” [32]. The W3C Validator also conforms “to International Standard ISO/IEC 15445—HyperText Markup Language, and International Standard ISO 8879—Standard Generalized Markup Language (SGML)” [32]. For the purposes of this test the homepage of every university website was passed through the W3C validator. This action yielded as a result the number of HTML errors and warnings present in each website’s HTML. The websites were graded based on errors by subtracting one point off their HTML error score on a 100-degree scale for each error (as long as the score remained above or equal to zero). Similarly, by subtracting one point off their HTML Warning score for every 10 warnings they were graded on warnings. The increased number of warnings required for the subtraction of a point was decided because warnings are both much more common and also much less detrimental to the overall quality of the HTML.
Evaluation of a Website’s CSS
A website’s appearance is not only a result of its HTML code but also of the CSS sheet embedded in the HTML document. All modern websites make ample use of CSS’s inherent ability to improve their appearance, but an invalid CSS can cause, compatibility, usability, and performance issues [33]. In a similar way to the HTML process, W3C’s CSS Validation Service [34] was used to test the websites’ validity. “The validity of a style sheet depends on the level of CSS used for the style sheet. […] valid CSS 2.1 style sheet must be written according to the grammar of CSS 2.1. Furthermore, it must contain only at-rules, property names and property values defined in this specification” [35]. The grading method was identical to the one used for HTML in order to achieve consistency of the results. This means for every error one point was deducted from the error score on a 100-degree scale and for 10 warnings one point was deducted from the warning score.
Mobile Friendliness
In the modern world, website access through mobile devices has overtaken desktop access [36], which makes the mobile friendliness of a website an extremely important factor. The websites’ ability to display properly on mobile was tested through Google’s appropriate test [37]. Google has been at the forefront of the World Wide Web innovation for more than two decades and provides multiple impartial and very reliable tools to evaluate all aspects of a website. Many of these tools have been used throughout this methodology. The mobile friendliness test checks for a series of errors that might occur in a page when displayed on a mobile device. These errors are: “Use of incompatible plug-ins, viewport not set, viewport not set to “device-width”, content that exceeds the screen width, text too small to read and clickable elements too close together” [38]. For the purpose of evaluating a Website’s structure, mobile friendliness was treated as a binary aspect. Websites that were mobile friendly received full marks in a 100-degree scale, while websites that were not, received none. Other aspects of mobile usability such as performance were measured in the later parts of the methodology.
Best Practices
Besides validation and mobile compatibility there are some other aspects of a website that indicate its effort for maximum compatibility and usability. Google Lighthouse’s best practices test measures a series of such aspects [39]. “Google Lighthouse is an open-source, automated tool for improving the quality of web pages” [40] that can be used through Google Chrome’s development tools. This tool has been used in multiple instances of our testing methodology as it combines Google’s reliability with ease of use and access. Specifically the best practices test check that a website performs the following: “Avoids Application Cache, Avoids console.time(), Avoids Date.now(), Avoids Deprecated APIs, Avoids document.write(), Avoids Mutation Events In Its Own Scripts, Avoids Old CSS Flexbox, Avoids Requesting The Geolocation Permission On Page Load, Avoids Requesting The Notification Permission On Page Load, Displays Images With Incorrect Aspect Ratio, Includes Front-End JavaScript Libraries With Known Security Vulnerabilities, Manifest’s short_Name Won’t Be Truncated When Displayed On Homescreen, Links to cross-origin destinations are unsafe, Prevents Users From Pasting Into Password Fields, Some Insecure Resources Can Be Upgraded To HTTPS, Uses HTTPS, Uses HTTP/2 For Its Own Resources, Uses Passive Event Listeners To Improve Scrolling Performance, Avoids Web SQL” [39].
Consolidating Website Structure Ratings
The different aspects that were discussed above were consolidated in a single Website Structure Evaluation metric. This single metric was calculated as a weighted average of all individual metrics. The purpose of assigning weights was to finetune the influence of each metric on the final individual rating according to its importance as judged by the researchers. Since both HTML and CSS errors were deemed much more damaging to a website than warnings, both error metrics received a higher weight, while warning metrics received a much lower one. This is also in accordance with the rate of appearance of each: Warnings are much more common. Mobile friendliness should be considered of utmost importance in a continuously more mobile environment so it received a weight that sets it in the same level of importance as HTML or CSS validity as a whole. Google Lighthouse’s best practices audit is used to check for secondary practices that improve a website’s quality, so it is valued a little lower than the other major metrics. The weight of each individual metric contributing to the consolidated Website Structure Evaluation metric is presented in Table 2.
In addition to the initial scores a bonus was given for websites that had a perfect error score in either the HTML or CSS error metrics. While having as few errors as possible is always a good sign of the care and attention given to a website, having no errors whatsoever indicates an adherence to practices that is even more commendable. Because of that, websites that took the extra mile to achieve zero errors were awarded with 2 extra points on a 100-degree scale in their final scores (to a maximum of 4 points if both error ratings were flawless). In order to avoid ruining the scale’s proportionality the final result was recalculated as a percentage of the maximum score that was 104.
3.1.2. Evaluation of Website Accessibility
The accessibility of each university’s website was evaluated based on the following aspects:
- WCAG 2.0 compatibility problems as indicated by aChecker;
- WCAG 2.0 compatibility problems as indicated by the WAVE accessibility tool; and
- Google Lighthouse accessibility audit.
Evaluation of a Website’s WCAG 2.0 Compatibility
Accessibility is an issue of extreme importance in all aspects of human activity and the World Wide Web is no exception [41]. It is a website’s primary objective to be inclusive of the maximum number of individuals and that is especially true for websites of academic nature. The Web Content Accessibility Guidelines (WCAG) “are developed through the W3C process in cooperation with individuals and organizations around the world, with a goal of providing a single shared standard for web content accessibility that meets the needs of individuals, organizations, and governments internationally” [42]. A website’s adherence to these guidelines is a good indicator of the care given to make the website accessible and usable. Because the nature of these guidelines is not as strict or well-defined as the syntax of HTML or CSS, in order to get a more accurate measurement, two distinct WCAG validators were used. The first was aChecker [43], “a Web accessibility evaluation tool designed to help Web content developers and Web application developers ensure their Web content is accessible to everyone regardless of the technology they may be using, or their abilities or disabilities” [43]. The second was WAVE [44], a tool provided by WebAim, “an organization dedicated to bringing more accessibility to the Web” [45]. Both of these tools are mentioned and linked in W3C’s official Web Accessibility Evaluation Tools List [46].
For the purpose of the test, the frontpage of every university’s website was processed through both tools and four individual metrics were established. One metric for aChecker’s known problems, one for aChecker’s potential problems, one for WAVE’s Errors and one for WAVE’s alerts. In a manner equivalent to our process during the website structure evaluation one point was subtracted for every aChecker known problem, WAVE error or WAVE alert from a 100-degree scale and one for every ten aChecker potential problems. The reason potential problems are measured by tens is because they were much more numerous on average.
Evaluation of a Website’s Accessibility with Google Lighthouse
Google’s Lighthouse was used to get a complimentary Accessibility metric. Lighthouse measures multiple accessibility aspects and returns a weighted average in a 100-degree scale. The tests run to determine accessibility check for the following: “Buttons Have An Accessible Name, Document Doesn’t Have A Title Element, Every Form Element Has A Label, Every Image Has An alt Attribute, No Element Has A tabindex Attribute Greater Than 0” [39].
Consolidating Website Accessibility Ratings
The different aspects that were discussed above were consolidated in a single Website Accessibility Evaluation metric. This single metric was calculated as a weighted average of all individual metrics. aChecker known problems and WAVE errors were deemed more important than potential problems and Alerts so they received a higher weight. Potential problems and alerts received a lower weight. This is also in accordance with the rate of appearance of each, similarly to the HTML/CSS errors and warnings that were measured in the structure section. The Google Lighthouse accessibility audit’s rating was given an overall lower weight than the major metrics since its scope is limited and tends to provide a more generalized estimate of accessibility. The weight of each individual metric contributing to the consolidated Website Accessibility Evaluation metric is presented in Table 3.
In addition to the weights, a bonus system was employed similar to the one used on the website structure evaluation metric. Perfect scores on aChecker known problems and WAVE errors were rewarded with 2 points each up to a maximum of 4 and the final result was recalculated as a percentage of the maximum score.
3.1.3. Evaluation of Website Performance
A website’s performance is quintessential to its presence in the World Wide Web. It helps it retain the attention of users and increase each user’s level of engagement [47]. It streamlines user experience and the overall quality of our virtual lives.
The performance of each university’s website was evaluated based on the following aspects:
- WebPagetest’s performance metrics
- Google PageSpeed Insights for mobile and desktop
Evaluation of a Website’s Performance with WebPagetest
WebPagetest [48] is an open source tool for measuring different aspects of a website’s performance. Its online version, which was used for the purposes of this methodology, “is hosted by multiple companies and individuals providing the testing infrastructure around the globe” [49]. It is an efficient and impartial tool that has been used for more than a decade and is widely trusted by the online community.
For each university’s website, the first view of its frontpage was tested and measured. The tests were run using Chrome and form a trusted location near the university’s physical location. These locations included Dulles VA USA, Ireland EU, Sydney Australia, Seoul Korea, and Tokyo Japan. The USA tests were carried out using WebPagetest’s own infrastructure while all the rest were carried out from infrastructure provided by Akamai through EC2 in order to achieve maximum conformity.
The metrics taken into consideration were:
- First Byte“The First Byte time (often abbreviated as TTFB) is measured as the time from the start of the initial navigation until the first byte of the base page is received by the browser (after following redirects)” [50].
- Usage of the Keep-Alive extension“The Keep-Alive extension to HTTP/1.0 and the persistent connection feature of HTTP/1.1 provide long-lived HTTP sessions which allow multiple requests to be sent over the same TCP connection. In some cases, this has been shown to result in an almost 50% speedup in latency times for HTML documents with many images” [51].
- Compression of documents“Compression is an important way to increase the performance of a Web site. For some documents, size reduction of up to 70% lowers the bandwidth capacity needs” [52].
- Compression of images“Images often account for most of the downloaded bytes on a web page and also often occupy a significant amount of visual space. As a result, optimizing images can often yield some of the largest byte savings and performance improvements for your website” [53].
- Use of progressive imagesProgressive images are images that display first a lower quality of themselves in full dimensions and then achieve a higher quality by the end of their load time. It is a smart way to optimize a user’s experience and reduce bandwidth [54].
- Cache Static Content“Static Content are the pieces of content on your page that don’t change frequently (images, javascript, css). You can configure them so that the user’s browser will store them in a cache so if the user comes back to the page (or visits another page that uses the same file) they can just use the copy they already have instead of requesting the file from the web server” [55].
- Use of a Content Delivery Network (CDN).
Websites use networks of proxy servers and data servers known as CDNs to serve their static data to users without having to directly communicate with the original website server. This enables each user to be served by their closest node thus improving performance by decreasing the data’s travel time.
WebPagetest’s First Byte rating is provided in a scale from A to F. In order to convert the First Byte rating into a 100-degree scale, numerical values were assigned to different grades: A = 100, B = 80, C = 60, D = 40, and F = 20. The rest of the values were provided by WebPagetest as percentages.
Evaluation of a Website’s Performance with Google PageSpeed Insights
While WebPagetest provides insight strictly to a website’s network performance values, Google PageSpeed utilizes not only lab results and metrics provided by Google Lighthouse, but also data provided by the Chrome user experience report, which includes both First Contentful Paint and First Input Delay metric data [56]. This means that previous user experiences with how a website performed were also taken into account. This led to the decision to include Google PageSpeed Insights’ data in our test methodology. PageSpeed’s final result is a separate grade in the 100-degree scale for mobile and desktop views of the website. In order to measure the mobile version’s performance, the system emulates the performance of a mid-tier mobile device on a mobile network [57].
Consolidating Website Performance Ratings
The different aspects that were discussed above were consolidated in a single Website Performance Evaluation metric. This single metric was calculated as a weighted average of all individual metrics. WebPage tests First Byte, transfer compression, image compression and static cache measurements all receive the same weight as they are considered more or less equally important to achieve good performance from a technical perspective. Keep-alive functionality was given a lower weight since it is a very common feature for almost all modern websites. Progressive images were given an even lesser weight since their use, or lack thereof, may not always be beneficial especially with specific image types. Each website’s CDN usage received double the weight of the average WebPageTest metric not only because it is considered especially important for the websites of world-renowned Institutions, but also due to its contribution to their overall global presence. In order to keep WebPageTest’s influence of the final result in line with Google PageSpeed insights’ both the desktop and mobile measurements of performance by Google were given the appropriate weight to bring Google’s measurements to an almost equal footing since both systems are trustworthy and widely used. The slight edge goes to WebPageTest mainly because of its CDN measurement. The weight of each individual metric contributing to the consolidated Website Performance Evaluation metric is presented in Table 4.
Consolidating All Ratings into a Comprehensive Website Quality Rating
The values received through rigorous and meticulous measuring and testing were consolidated into ratings for all three of the major assumed characteristics of a website’s quality (structure, accessibility, and performance). In order to reach an all-encompassing rating these three ratings were unified as a weighted average. The purpose of assigning weights was to finetune the influence of each metric on the final overall rating according to its importance as judged by the researchers.
Each website’s structure received a standard weight value as it represents the most basic of the three characteristics: An essentiality that every website must adhere to.
Each website’s accessibility received a higher weight value since it represents a quality that is paramount due to the nature of both the Web and education. The Web is an intrinsic part of our everyday lives and as such its availability to people with disabilities is of utmost importance and a serious obligation. Similarly, ensuring accessibility for higher education has been an ongoing effort for decades and has been an incentive not only for affirmative action but also for legislation reform in many parts of the world.
Each Website’s performance received a weight value between those of structure and accessibility. Performance is important in maintaining a user’s attention and increasing both retention and engagement in a modern website.
Using these three values and their equivalent weights we calculated a rating indicative of the quality of each website. The weights of the values used in the calculation of the website quality rating are presented in Table 5.
3.2. Measuring a Website’s SEO Performance
Search Engine Optimization is a series of methods used to increase the traffic of a website through attaining better ranking results in search engines and thus gaining better visibility in the Web as a whole. “Generally, the earlier, and more frequently a site appears in the search engine results page, the more visitors it will receive from the search traffic. In other words, it is a set of techniques that take into account the evaluation criteria of search engines regarding website content and structure” [58]. Although not part of a website’s quality in the strict sense of the term it is a good indicator of the effort put into making the website available to a larger audience. As such it is important to also get a clear picture of the relationship between a university’s academic excellence ranking and its website’s SEO performance.
Measuring a website’s SEO performance is not an exact science since a lot of the mechanics behind gaining rank in Search Engine rankings are under wraps. Despite that, there are multiple tools that use available guidelines, provided by Search Engine developers such as Google, as well as other methods to quantify a website’s achievements in this aspect. These tools are usually commercial and as such they do not disclose their exact methodology, techniques or practices. This makes the results opaque and maybe even questionable. In order to get a more impartial rating for each university’s website multiple tools were used. On top of that, a method was devised that was employed to normalize extreme differences in the results. It is further explained later.
The tools used for this metric were:
- Neil Patel’s SEO analyzer;
- SEO site checkup;
- WooRank website review; and
- Google Lighthouse SEO audit
The Web marketing dedicated website Neil Patel [59] has been a staple in the SEO research community for the past few years and has been recently updated. It uses a crawling algorithm that scans through each website’s 150 first pages for common SEO related errors and quantifies the result [60]. Besides SEO errors it also focuses on the SEO quality of the content, which is measured by keyword usage, number of words per page, size of page titles, and descriptions and similar metrics.
The website SEO Site Checkup [61] is a commercial tool used to measure the SEO efficiency of competitors and provide insight for the improvement of a website’s SEO optimization [62]. Alongside the usual metrics the tool provides an array of Advanced SEO such as the use of HTML Microdata specifications or the existence of a dedicated 404 page.
WooRank [63] is a tool that boasts more than one million registered users. It uses a variety of methods to measure the overall SEO performance of a website including usage of backlinks, mobile optimization, and social media connectivity [64]. Mobile friendliness is not only measured by performance but also secondary metrics such as the size of tap targets etc. The emphasis on social media is measured both by evaluating engagement in the website’s linked social media pages and also by keeping track of how many times a website has been shared in the major social media networks.
Google Lighthouse SEO audit tests for adherence to the essential structure of SEO related data that is provided in Google’s own guidelines. The test checks for the following errors: “Document Does Not Have A Meta Description, Document Doesn’t Have A Title Element, Document doesn’t have a valid hreflang, Document doesn’t have a valid rel=canonical, Document Doesn’t Use Legible Font Sizes, Document uses plugins, Links Do Not Have Descriptive Text, Page has unsuccessful HTTP status code, Page is blocked from indexing, robots.txt is not valid, Tap targets are not sized appropriately” [40]. All of the SEO tools employed in this study are listed in Table 6.
Calculation of a single metric for a site’s SEO performance was achieved through means of a weighted average. In general, the different SEO tools all provided us with a rating in the 100-degree scale and to a large extent preformed similar tests that they evaluated differently.
Neil Patel’s results received a standard weight. The crawling method it uses provides a wider sample for testing but the tool’s content-oriented testing seems to have shortcomings when dealing with academic websites. This is demonstrated by a lack of variation in ratings and a small standard deviation.
SEO Site Checkup received a slightly higher weight. As a commercial application it provides a vast variety of different checks and that results in a bigger standard deviation of result values. Its performance and measurements were deemed the most trustworthy.
WooRank received a standard weight. Its main contribution beyond basic SEO structure and usage metrics is its focus on mobile friendliness and social media. Both these aspects are becoming ever more important in the world wide web.
Finally, Google Lighthouse’s SEO audit covered the most basic prerequisites and so received a slightly lower weight.
The weight of each individual metric contributing to the consolidated SEO Performance Evaluation metric is presented in Table 7.
Since all four methods yield a result in the 100-degree scale and all use similar methods to calculate SEO performance, it was deemed necessary, in order to ensure the impartiality of the results, to diminish the weight of measurements that diverge from the norm. To achieve that, our algorithm checks if a rating given by any of the tools is further away than the equivalent average distance between itself and all of the other three tools. This way an outlier value is identified. If that is the case the weight of this specific tool for this specific university website’s rating is halved.
For example, if a website got ratings of 75, 72, 32 and 80 from the different tools, the weight of the tool that returned the outlier result (32) would have been halved in order to avoid the outlier value bearing too much influence.
This also holds true if more than one outlier is discovered. If all the tools give results that are above the appropriate average distances, then all weights are halved except for SEO site checkup’s weight that has been deemed as the most trustworthy tool.
In the end we found ourselves with a single value indicating a website’s overall SEO performance on a 100-degree scale.
3.3. Web Presence as a Combination of Quality and SEO Performance
Even though website quality and SEO performance are different metrics they both represent, in tandem, a more abstract notion of a website’s strength that can be defined as the website’s overall web rating. Assigning a value to this is as simple as taking the average of both the major metrics as described above (Web quality and SEO performance). This value’s relation with a university’s academic excellence ranking was also studied.
The three major scales (website quality rating, SEO performance rating and overall web rating) were used to create the three individual rankings that we used in our calculations: Web quality ranking (WQR), SEO performance ranking (SEOPR), and overall web ranking (OWR).
4. Results
Table 8 depicts our data formation. The first column shows the top ten universities according to their ranking on a 100-degree scale, the second column presents institution ranking according to ARWU. Columns 3, 4, and 5 show the corresponding ratings of our measurements on a 100-degree scale, website quality rating, SEO performance rating, and overall web rating. Columns 6, 7, and 8 show the corresponding rankings namely website quality ranking (WQR), SEO performance ranking (SEOPR) and overall web ranking (OWR). The whole table with 100 universities can be found in the dataset provided in Supplementary Materials.
To analyze the interrelation between ARWU rankings and our WQR, SEOPR, and OWR, Spearman rho coefficients have been applied due to the ordinal scale of data [65]. The results are shown in Table 9 where there appears to be a correlation between Shanghai’s ranking and WQR (0.355) and OWR (0.32), which leads us to reject the null hypothesis (that there might be no correlation between ARWU and our rankings). The significance level is 0.000 and 0.001 respectively confirming the statistically significant correlation. However, there is no correlation between ARWU and SEOPR, which leads us to conclude that the SEO may not be particularly taken into account by major academic institutions. Further analysis may verify the first results of the survey.
The 100-degree scale on both the ARWU ratings and our ratings allows us to go a step further in the statistical criterion of regression analysis in order to measure to what extend there is a correlation between our variables [66,67]. Since there is no correlation between ARWU and SEOPR, and variable OWR is derived from the mean of WQR and SEOPR, there is no reason to use multiple regression analysis but simple regression between ARWU rating and website quality rating. In our case the independent variable is ARWU rating and the dependent variable is website quality rating.
First, we need to calculate the Pearson correlation coefficient to see if there is a correlation between them. The Pearson correlation is 0.266 at 0.007 2-sided significance, which shows a weak but statistically significant result.
At the model summary in Table 10, we can observe that according to R2 the 7% of the total variance of website quality is due to ARWU with standard estimation error of 10.35 which is a slightly weak outcome.
The variance analysis in Table 11, examines the null hypothesis that there is no linear relationship between website quality and ARWU. The result F (1.98) = 7.04, p = 0.007 < 0.05 is statistically significant and we reject the null hypothesis. Therefore, our predictive model is considered sufficient to continue the additional evaluation of simple regression. In the following Table 11 it is depicted that the value of B is 0.224 (0.007 < 0.01). We also find that there is a positive correlation between the two variables, that is, for each unit increasing ARWU we have an increase of 0.22 units of website quality.
The regression analysis test between ARWU and website quality is depitcted in the histogram and scatterplot of Figure 1. The histogram shows that the slightly skewed, distribution satisfies the normality assumption. The scatterplot has the predicted values in the x-axis and residuals on the y-axis as shown below. Although it shows a slight “heteroscedasticity” (meaning that the residuals get larger as the prediction moves from large to small), the regression coefficients still have a correlation. However, we cannot use this model as a strong and accurate predictive approach.
To investigate the influence of weights on the outcome of the relationship between Shanghai ranking and WQR, SEOPR, and OWR, we repeated the test using flat weights. Table 12 shows that the Spearman correlation coefficient decreases for all variables WQR, SEOPR, an OWR in a similar way. This proves that the correlation between Shanghai ranking, WQR and QWR exists and the use of weights makes this relationship more explicit.
We found that ARWU ratings and website quality are correlated. However, investigating the correlation between website quality and SEO performance can reveal further information. The aim of this step is to examine these variables’ association in order to draw useful conclusions about their co-variation. The simple regression follows by setting website quality as the independent variable and SEO performance as the dependent variable. First the Pearson correlation is r (100) = 0.40 (Sig. 2-sided 0.000) which means that we have a positive correlation between them.
At the model summary in Table 13, the R2 is 0.165 meaning that 16.5% of the total variance of SEO performance is due to website quality and error estimation is 5.48.
The ANOVA examines the null hypothesis that there is no linear relationship between SEO performance and website quality. The result F (1.98) = 19.36 p = 0.000 < 0.05 is statistically significant so we reject the null hypothesis.
In the Table 14 it is depicted that the value of B is 0.22 (0.0000 < 0.01) which means that variable website quality rating can be a predictor of variable SEO performance. Also, there is a positive correlation between the two variables.
These results are visualized in Figure 2.
5. Discussion
Webometrics [17,68] is probably the most well-known approach in producing a ranking of universities taking into account their web presence. In a similar approach the same authors [69] attempted to evaluate institutional repositories as well as other open repositories that contain scientific literature (e.g., Arxiv.org and Hal CNRS, Citeseer). The indicators they employed for the evaluation of repositories were mostly targeting the activity and visibility of the website, where the activity accounts the number of pages, pdf files and items in Google Scholar, and the visibility the incoming links received by the repository. The earlier framework for webometrics from Björneborn and Ingwersen [70] used a similar methodology that was based on in and out links only.
Recent works by Hasan [71], Kaur et al. [72], and Nagpal et al. [73] examine online presence and content for academic institutions. In [71] the author successfully lists various criteria that are used by university ranking systems. It is noticeable that ranking systems who try to use an institution’s web presence as a metric mainly focus on the volume of that presence. This volume is measured by activity, in and out links, high visibility in search engine results and other similar metrics that aim to determine the interconnectivity between the institutions and the general audience.
This study’s approach is different. Firstly, the focus shifts from popularity metrics, such as activity and visibility, to quality metrics such as usability, accessibility and performance. Secondly, instead of trying to evaluate the institutions based on different aspects of their web presence it focused on evaluating the main website of each institution itself. This is less complicated to achieve since there are relatively objective criteria related with evaluating a website, both for its quality or for other aspects like its SEO performance. The study then proceeded to analyze whether these specific aspects of an Institution’s online presence are related to its academic excellence ranking.
The present work leads relatively safely to the conclusion that academic excellence, as generally acknowledged in the Shanghai list, correlates with website quality, but not with SEO performance.
The overall web ranking confirms the main conclusion: this ranking has emerged as an average rating and its correlation with the Shanghai list is positively influenced by website quality and negatively by SEO performance. As the impact of website quality is stronger, the final result shows a positive, though not as strong, correlation.
Generally speaking, there is a positive correlation between academic excellence and the web presence of an institution. This observation is justified by the important role the Internet is currently serving as the basic medium for the development and implementation of communication policy at all levels, especially in organizations such as universities. With the further penetration of higher education into both societies and economies, with the increasing number of people attending university education and training programs, the resonance, the importance and, ultimately, the impact of website quality are evident. Universities are growing, their turnover is increasing, their funding and accountability needs are also increasing and, therefore, what they need now is not only to present their structures online, but engage daily, through their news and the digital storytelling of their activities, large sections of both the general and specific population. To this end, only the quality of their online presence can meet the aforementioned needs. That is why academic excellence and the online presence of an Institution are ultimately correlated.
Although the study of [71] examines only a limited set of sites shows that highly ranked universities on webometric sites have the lowest number of usability problems per investigated pages. The present study reinforces the notion that sites of institutions that rank high tend to display better metrics in aspects such as accessibility and usability.
The high correlation between the website quality ranking and SEO performance ranking—in the case of Institutions included in the Shanghai list—confirms that website quality is a factor that can give us a predictive or causal relationship with SEO performance.
From the aforementioned remarks, it appears as a reasonable interpretation of the results, that universities place particular emphasis on issues concerning website quality, while the emphasis on SEO matters does not appear to be of equal importance. This is explained by the fact that the tool we have presented includes evaluations of issues related to international standards (which the academic community endorses), open technologies, socially sensitive issues such as the level of accessibility and inclusion, as well as technological issues highlighting the technological infrastructure of each institution and its integration into the environment of new technologies.
However, the interpretation of the low degree of correlation with SEO performance probably has to do with the fact that SEO has strong marketing features and is highly market oriented. Furthermore, it is constantly used by commercial companies. It is conceivable that universities with a long-lasting presence and a well-established position in the international academic environment may not regard SEO as an important factor of their online presence or treat it more conventionally or as a tool only for commodities and not for ‘goods’ in the broader sense.
Nevertheless, in recent years the expansion of higher education and the need to reach wider audiences has made SEO an important factor in the online presence of universities. It might be the case that SEO is a feature that has not yet been fully exploited and can, with appropriate adaptations, make a difference for higher education institutions.
The present work also highlights the need for future work on two axes:
The first one is tool improvement. This may entail minor adjustments to the website quality tool, thorough examination of the SEO tool (because it had little scope for differential ranking) and reassessment of the composition through a simple average of the extent of the overall web presence or through normalization depending on the number of IT/press/Web development staff.
The second axis is comparison of website quality results with different aspects of academic excellence. Firstly, some of the different official rankings mentioned above. The Shanghai ranking is based purely in research metrics, but other rankings also take into consideration different aspects of academic excellence. For example, the teaching qualities of an institution (number of professors per student, teaching hours etc.) or aspects of its global presence. Additionally, there would be value in seeing how website quality correlates to the research efficiency of an institution. Research efficiency is a way of drawing comparisons between the input (as measured by grants etc.) and research output (articles etc.) and is an increasingly popular measurement of the excellence of an academic institution [74]. Finally, there may be conclusions to be drawn by monitoring more localized rankings and comparing the correlation between WQ and academic excellence in different parts of the world.
6. Conclusions
The present study documented the most important international academic university rankings and selected the Academic Ranking of World Universities (ARWU—also known as Shanghai list) as a base of reference, since it has been proven quite reliable for many years and consists of fully measurable and verifiable ratings.
Consequently, the characteristics of a) website quality and b) SEO performance were identified and the universities of the Shanghai list were ranked into a website quality ranking and a SEO performance ranking. In addition, the average of the two ratings was defined as the overall web ranking.
From the correlation of the traditional academic ranking of Shanghai and the website quality ranking and SEO performance ranking emerged some interesting observations. The positive correlation between academic excellence in general and the online presence of an institution (and especially its website quality) has now become apparent. On the other hand, no correlation was found with SEO performance. This means that the academic performance of an institution is correlated with the quality of a university’s online presence; yet, obviously, this does not indicate a causal relation. Additionally, there seems to be significant room for improvement in regard to better use of SEO, always in accordance with academic criteria. This may present an advantage to the general presence and status of these institutions.
Even though further research is required to solidify the results of the present study, there is a clear indication that the web presence of academic institutions, as part of their wider communication policy, bears great significance not only for the institutions themselves, as it gives prominence to the institutions’ global role, but also for the international community as it facilitates access for each and every individual to content related to higher education.
Supplementary Materials
Giannakoulopoulos, A; Konstantinou, N; Koutsompolis, D; Pergantis, M; Varlamis, I. Data set of the article: academic excellence, website quality, SEO performance: Is there a Correlation? (Version 1) (Data set). Zenodo. Available online: https://doi.org/10.5281/zenodo.3484673 (Accessed on 30 September 2019).
Author Contributions
Conceptualization, A.G.; formal analysis, N.K.; investigation, D.K. and M.P.; methodology, A.G. and M.P.; resources, I.V.; writing—original draft, N.K., D.K. and M.P.; writing—review and editing, A.G., M.P. and I.V.
Funding
This research received no external funding.
Conflicts of Interest
The authors declare no conflict of interest.
References
- Mmantsetsa, Μ.; Wells, P.J.; Silvia, F. University Rankings: The Many Sides of the Debate. Manag. Sustain. Dev. 2014, 6, 39–42. [Google Scholar] [CrossRef]
- Baka, A.B.A.; Leyni, N. Webometric study of world class universities websites. In Qualitative and Quantitative Methods in Libraries; Special Issue: Bibliometrics; 2017; pp. 105–115. Available online: http://qqml-journal.net/index.php/qqml/article/view/367 (accessed on 18 November 2019).
- Bell, M.; Bush, D.; Nicholson, P.; O’Brien, D.; Tran, T. Universities online: A survey of online education and services in Australia. Occas. Pap. Ser. 2002, 02-A, 1–45. [Google Scholar]
- Will, E.M.; Callison, C. Web presence of universities: Is higher education sending the right message online? Public Relat. Rev. 2006, 32, 180–183. [Google Scholar] [CrossRef]
- McAllister-Spooner, S.M. Whose site is it anyway? Expectations of college Web sites. Public Relat. J. 2010, 4, 22–37. [Google Scholar]
- Ford, W.G. Evaluating the Effectiveness of College Web Sites for Prospective Students. J. Coll. Admiss. 2011, 212, 26–31. [Google Scholar]
- Abrahamson, T. Life and death on the Internet: To web or not to web is no longer a question. J. Coll. Admiss. 2000, 6, 168. [Google Scholar]
- Kaur, S.; Kaur, K.; Kaur, P. An empirical performance evaluation of universities website. Int. J. Comput. Appl. 2016, 146, 53–62. [Google Scholar] [CrossRef]
- Khwaldeh, S.; Al-Hadid, I.; Masa’deh, R.E.; Alrowwad, A.A. The association between e-services web portals information quality and ICT competence in the Jordanian universities. Asian Soc. Sci. 2017, 13, 156–169. [Google Scholar] [CrossRef]
- Conway, M.; Dorner, D. An evaluation of New Zealand political party websites. Inf. Res. 2004, 9, 9-4. [Google Scholar]
- Acosta-Vargas, P.; Luján-Mora, S.; Salvador-Ullauri, L. Evaluation of the web accessibility of higher-education websites. In Proceedings of the 15th International Conference on Information Technology Based Higher Education and Training (ITHET), Istanbul, Turkey, 8–10 September 2016; pp. 1–6. [Google Scholar]
- Alahmadi, T.; Drew, S. An evaluation of the accessibility of top-ranking university websites: Accessibility rates from 2005 to 2015. In Proceedings of the DEANZ Biennial Conference, Waikato, New Zealand, 17–20 April 2016; pp. 224–233. [Google Scholar]
- Beel, J.; Gipp, B.; Wilde, E. Academic Search Engine Optimization (aseo) Optimizing Scholarly Literature for Google Scholar & Co. J. Sch. Publ. 2009, 41, 176–190. [Google Scholar]
- Rovira, C.; Codina, L.; Guerrero-Solé, F.; Lopezosa, C. Ranking by relevance and citation counts, a comparative study: Google Scholar, Microsoft Academic, WoS and Scopus. Future Internet 2019, 11, 202. [Google Scholar] [CrossRef]
- Ale Ebrahim, N. Optimize Your Article for Search Engine. Univ. Malaya Res. Bull. 2014, 2.1, 38–39. [Google Scholar] [CrossRef]
- Dimopoulos, M.A.; Mpourazelis, K.; Mpourletidis, K.; Koutsompolis, D.; International University Rankings. Methodology – Indicators and the Position of NKUA 2017–2018; National and Kapodistrian University of Athnes: Athens, Greece, 2018. [Google Scholar]
- Aguillo, I.; Bar-Ilan, J.; Levene, M.; Ortega, J. Comparing university rankings. Scientometrics 2010, 85, 243–256. [Google Scholar] [CrossRef]
- Academic Ranking of World Universities (ARWU). Available online: http://www.shanghairanking.com/arwu2019.html (accessed on 20 September 2019).
- Liu, N.; Cheng, Y. Academic Ranking of World Universities—Methodologies and Problems. High. Educ. Eur. 2005, 30, 127–136. [Google Scholar] [CrossRef]
- Webometrics. Available online: http://www.webometrics.info (accessed on 20 September 2019).
- Times Higher Education Rankings. Available online: https://www.timeshighereducation.com/content/world-university-rankings (accessed on 20 September 2019).
- QS World University Rankings. Available online: https://www.qs.com/rankings/ (accessed on 20 September 2019).
- Center for World University Rankings (CWUR). Available online: https://cwur.org/about.php (accessed on 20 September 2019).
- Bastedo, M.N.; Bowman, N.A. US News & World Report college rankings: Modeling institutional effects on organizational reputation. Am. J. Educ. 2009, 116, 163–183. [Google Scholar]
- Ehrenberg, R.G. Reaching for the brass ring: The US News & World Report rankings and competition. Rev. High. Educ. 2003, 26, 145–162. [Google Scholar]
- Huang, M.H. A comparison of three major academic rankings for world universities: From a research evaluation perspective. J. Libr. Inf. Stud. 2011, 9, 1–25. [Google Scholar]
- Academic Ranking of World Universities: Methodology. Available online: http://www.shanghairanking.com/ARWU-Methodology-2019.html (accessed on 20 September 2019).
- ShanghaiRanking Academic Excellence Survey 2019 Methodology. Available online: http://www.shanghairanking.com/subject-survey/survey-methodology-2019.html (accessed on 20 September 2019).
- Why Validate? Available online: https://validator.w3.org/docs/why.html (accessed on 17 September 2019).
- W3C’s Markup Validation Service. Available online: https://validator.w3.org/ (accessed on 17 September 2019).
- World Wide Web Consortium. Available online: https://www.w3.org/Consortium/ (accessed on 17 September 2019).
- About The W3C Markup Validation Service. Available online: https://validator.w3.org/about.html (accessed on 17 September 2019).
- About the CSS Validator. Available online: https://jigsaw.w3.org/css-validator/about.html (accessed on 17 September 2019).
- CSS Validation Service. Available online: https://jigsaw.w3.org/css-validator/ (accessed on 17 September 2019).
- Conformance: Requirements and Recommendations. Available online: https://www.w3.org/TR/CSS21/conform.html#valid-style-sheet (accessed on 17 September 2019).
- Enge, E. Where is the Mobile vs. Desktop Story Going? Perficient Digital. 2019. Available online: https://www.perficientdigital.com/insights/our-research/mobile-vs-desktop-usage-study (accessed on 17 September 2019).
- Mobile-Friendly Test. Available online: https://search.google.com/test/mobile-friendly (accessed on 17 September 2019).
- Support Google, Mobile-Friendly Test Tool. Available online: https://support.google.com/webmasters/answer/6352293 (accessed on 15 September 2019).
- Developers Google, Lighthouse Scoring Guide. Available online: https://developers.google.com/web/tools/lighthouse/v3/scoring (accessed on 15 September 2019).
- Developers Google, Lighthouse. Available online: https://developers.google.com/web/tools/lighthouse (accessed on 16 September 2019).
- Introduction to Web Accessibility. Available online: https://www.w3.org/WAI/fundamentals/accessibility-intro/ (accessed on 15 September 2019).
- Web Content Accessibility Guidelines (WCAG) Overview. Available online: https://www.w3.org/WAI/standards-guidelines/wcag/#intro (accessed on 15 September 2019).
- AC Checker. Available online: https://achecker.ca/checker/index.php (accessed on 15 September 2019).
- Wave. Available online: https://wave.webaim.org/ (accessed on 16 September 2019).
- WebAIM. Available online: https://webaim.org/about/ (accessed on 16 September 2019).
- Web Accessibility Evaluation Tools List. Available online: https://www.w3.org/WAI/ER/tools/ (accessed on 16 September 2019).
- Wagner, J. Why Performance Matters. WebFundamentals. Available online: https://developers.google.com/web/fundamentals/performance/why-performance-matters (accessed on 16 September 2019).
- WebPagetest. Available online: https://www.webpagetest.org/ (accessed on 18 September 2019).
- About WebPagetest.org. Available online: https://www.webpagetest.org/about (accessed on 18 September 2019).
- WebPagetest Documentation. Available online: https://sites.google.com/a/webpagetest.org/docs/using-webpagetest/metrics (accessed on 18 September 2019).
- Apache. Available online: https://httpd.apache.org/docs/2.4/mod/core.html (accessed on 18 September 2019).
- Compression in HTTP. Available online: https://developer.mozilla.org/en-US/docs/Web/HTTP/Compression (accessed on 18 September 2019).
- Grigorik, I. Image Optimization. WebFundamentals. Available online: https://developers.google.com/web/fundamentals/performance/optimizing-content-efficiency/image-optimization (accessed on 18 September 2019).
- Filestack. Why Progressive Images Matter. Available online: https://blog.filestack.com/thoughts-and-knowledge/progressive-images-matter/ (accessed on 18 September 2019).
- WebPagetest Documentation. Available online: https://sites.google.com/a/webpagetest.org/docs/using-webpagetest/quick-start-quide (accessed on 18 September 2019).
- About PageSpeed Insights. Available online: https://developers.google.com/speed/docs/insights/v5/about (accessed on 18 September 2019).
- GitHub. Available online: https://github.com/GoogleChrome/lighthouse/blob/master/docs/throttling.md (accessed on 18 September 2019).
- Giomelakis, D.; Veglis, A. Search Engine Optimization. In Encyclopedia of Information Science and Technology; IGI Global: Hershey, PA, USA, 2018; Available online: https://www.academia.edu/33637489/Search_Engine_Optimization (accessed on 18 September 2019).
- Neil Patel. Available online: https://neilpatel.com/ (accessed on 18 September 2019).
- Neil Patel Seo Analyzer. Available online: https://neilpatel.com/seo-analyzer/ (accessed on 18 September 2019).
- SEO Site Checkup. Available online: https://seositecheckup.com/ (accessed on 18 September 2019).
- SEO Site Checkup—About Us. Available online: https://seositecheckup.com/about (accessed on 18 September 2019).
- WooRank. Available online: https://www.woorank.com/ (accessed on 18 September 2019).
- WooRank Index: Websites Listed by Countries and Technology. Available online: https://index.woorank.com/en/reviews (accessed on 18 September 2019).
- Roussos, P.L.; Tsaousis, G. Statistics in Behavioural Sciences Using SPSS; TOPOS: Athens, Greece, 2011. [Google Scholar]
- Seltman, H.J. Experimental Design and Analysis; Carnegie Mellon University: Pittsburgh, PA, USA, 2012; Available online: http://www.stat.cmu.edu/~hseltman/309/Book/Book.pdf (accessed on 29 September 2019).
- Lane, D.M. Online statistics education: An interactive multimedia course of study. The Independent, 2015. [Google Scholar]
- Aguillo, I.F.; Ortega, J.L.; Fernández, M. Webometric ranking of world universities: Introduction, methodology, and future developments. High. Educ. Eur. 2008, 33, 233–244. [Google Scholar] [CrossRef]
- Aguillo, I.; Ortega, J.; Fernández, M.; Utrilla, A. Indicators for a webometric ranking of open access repositories. Scientometrics 2010, 82, 477–486. [Google Scholar] [CrossRef]
- Björneborn, L.; Ingwersen, P. Toward a basic framework for webometrics. J. Am. Soc. Inf. Sci. Technol. 2004, 55, 1216–1227. [Google Scholar] [CrossRef]
- Hasan, L. Using university ranking systems to predict usability of university websites. JISTEM-J. Inf. Syst. Technol. Manag. 2013, 10, 235–250. [Google Scholar] [CrossRef]
- Kaur, S.; Kaur, K.; Kaur, P. Analysis of website usability evaluation methods. In Proceedings of the 2016 3rd International Conference on Computing for Sustainable Global Development (INDIACom), New Delhi, India, 16–18 March 2016; BVICAM: New Delhi, India; pp. 1043–1046. [Google Scholar]
- Nagpal, R.; Mehrotra, D.; Bhatia, P.K.; Sharma, A. Rank university websites using fuzzy AHP and fuzzy TOPSIS approach on usability. Int. J. Inf. Eng. Electron. Bus. 2015, 7, 29. [Google Scholar] [CrossRef]
- Wohlrabe, K.; Bornmann, L.; de Moya Anegon, F. How efficiently produce elite US universities highly cited papers? Publications 2019, 7, 4. [Google Scholar] [CrossRef] [Green Version]
Figure 1.
(a) The histogram of the standardized residuals shows a normal distribution. (b) The scatterplot shows that there are no clear patterns except a slight “heteroscedasticity” which makes this predictive model uncertain.
Figure 1.
(a) The histogram of the standardized residuals shows a normal distribution. (b) The scatterplot shows that there are no clear patterns except a slight “heteroscedasticity” which makes this predictive model uncertain.

Figure 2.
(a) The histogram of the standardized residuals shows a normal distribution. (b) The scatterplot shows that this is an acceptable predictive model (the prediction is on the x-axis, and the accuracy is on the y-axis - Residual = Observed – Predicted).
Figure 2.
(a) The histogram of the standardized residuals shows a normal distribution. (b) The scatterplot shows that this is an acceptable predictive model (the prediction is on the x-axis, and the accuracy is on the y-axis - Residual = Observed – Predicted).


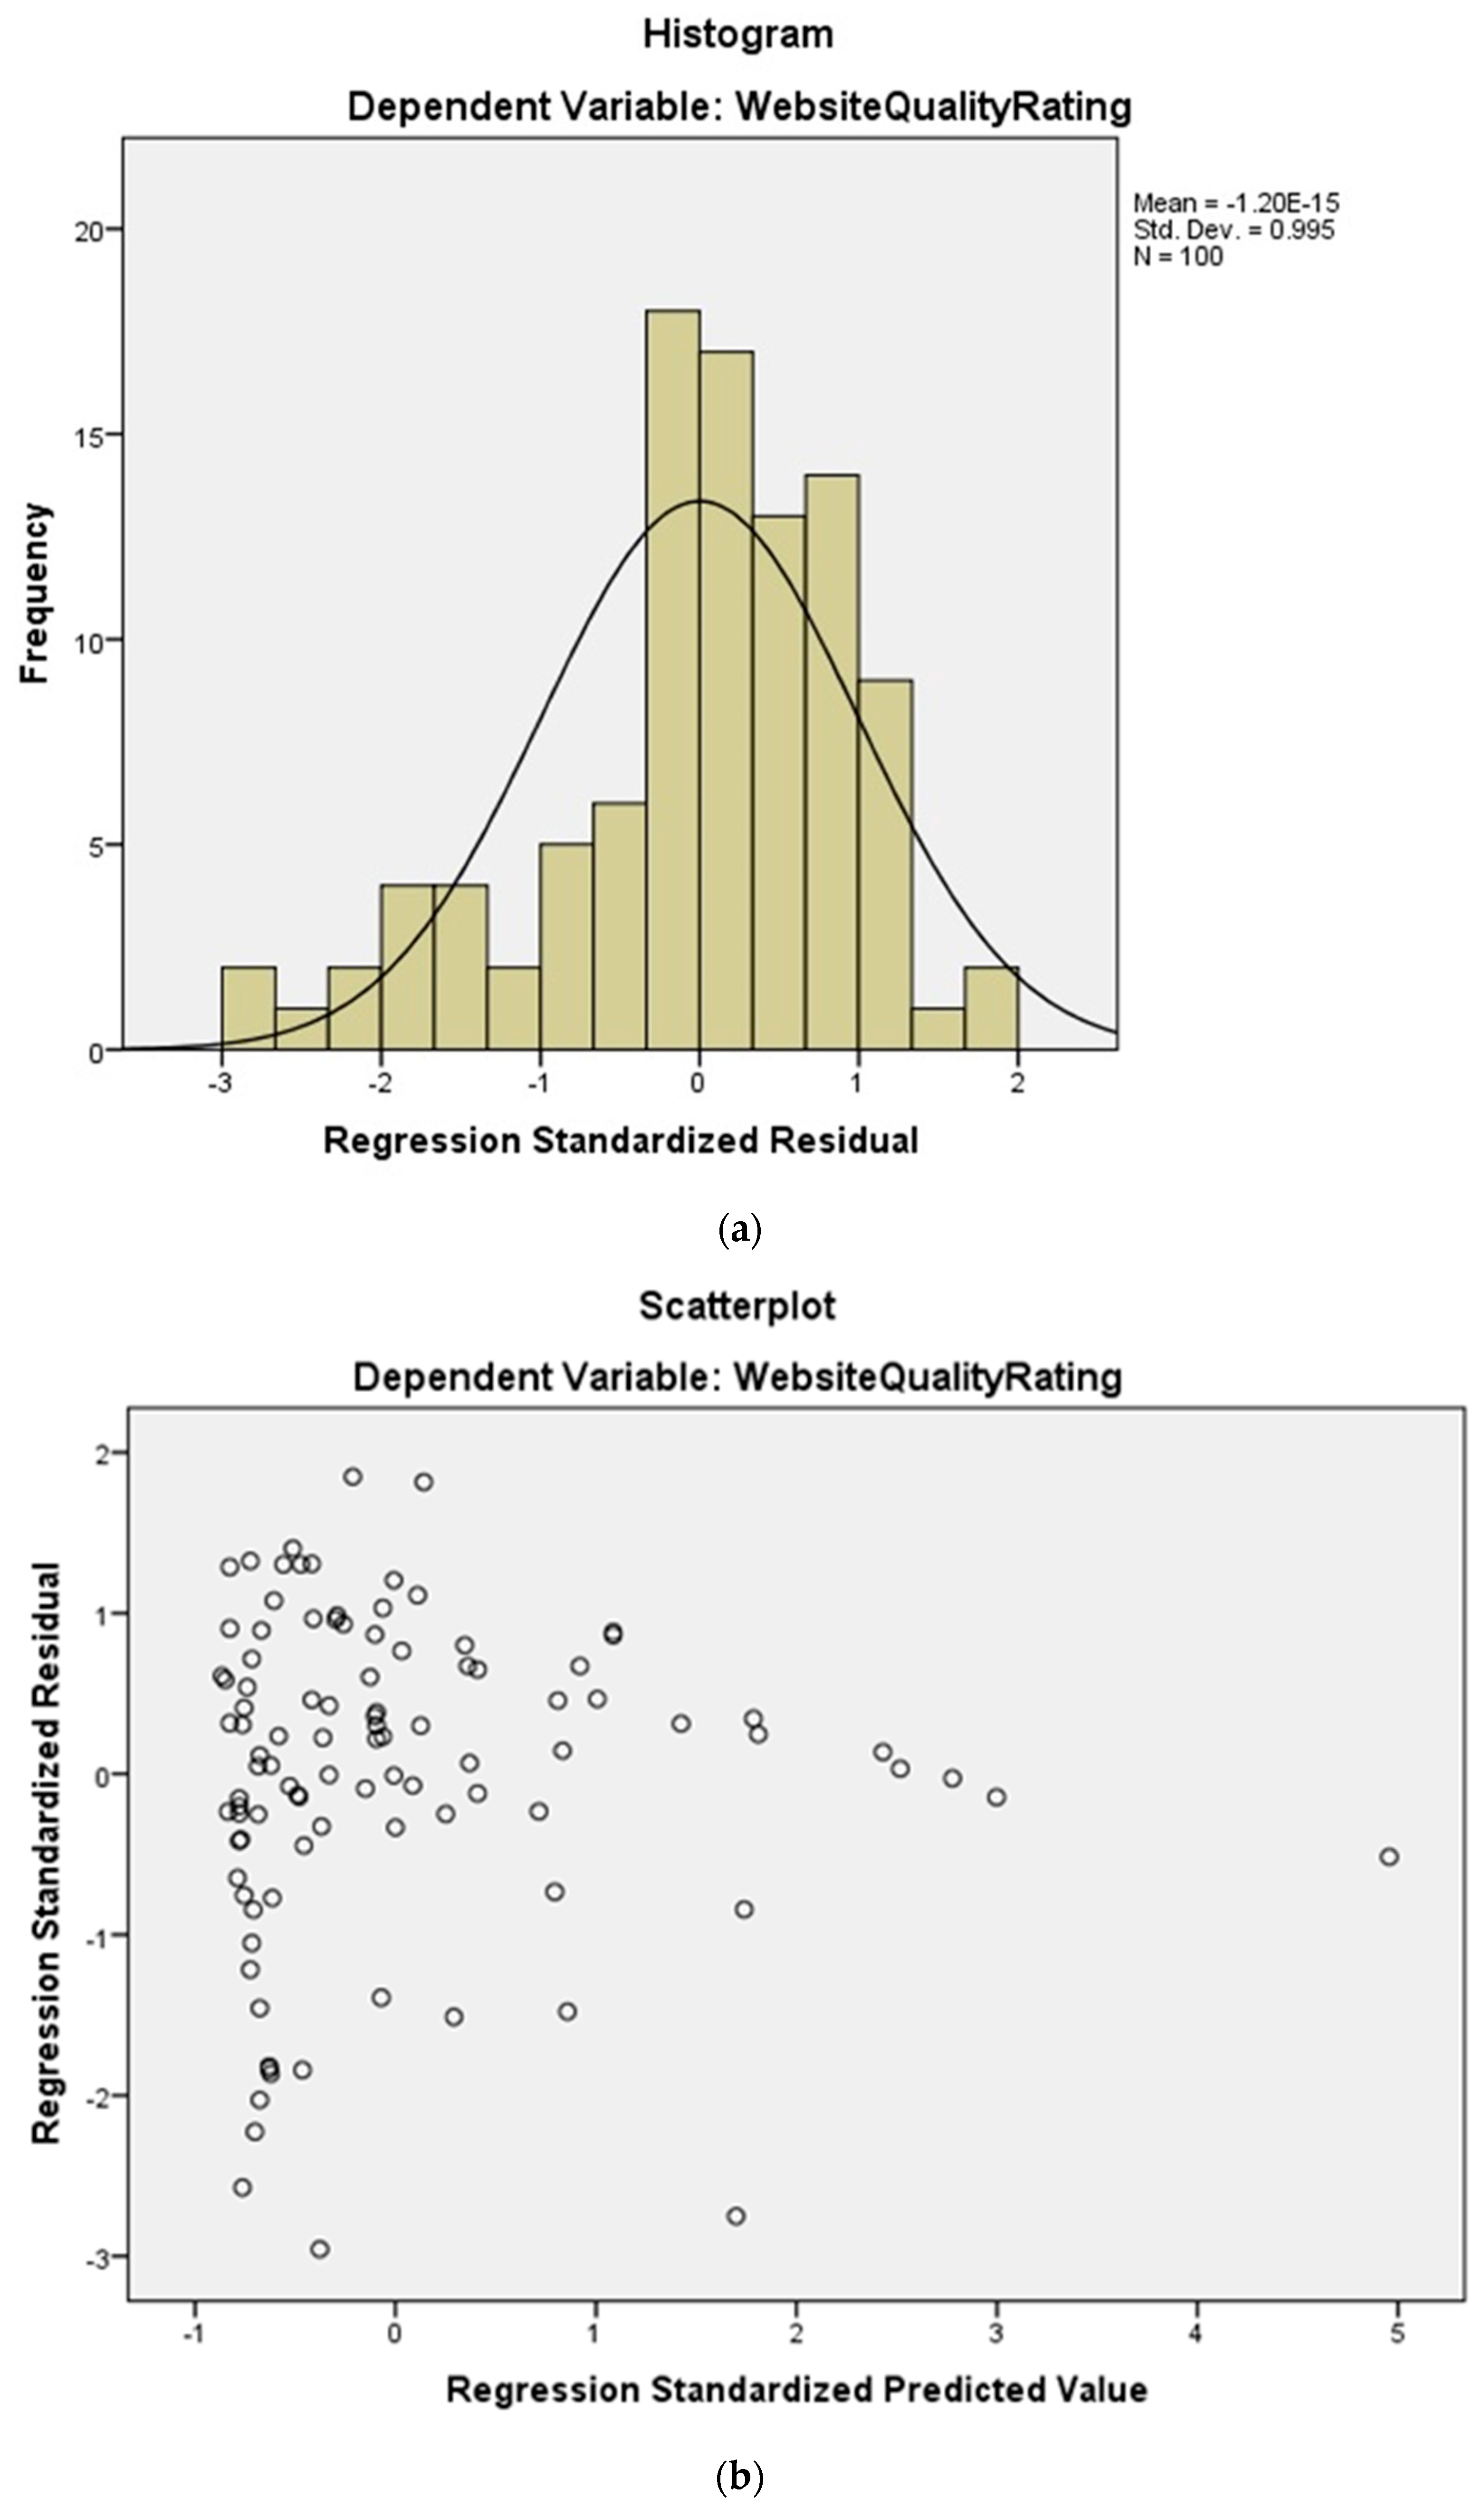
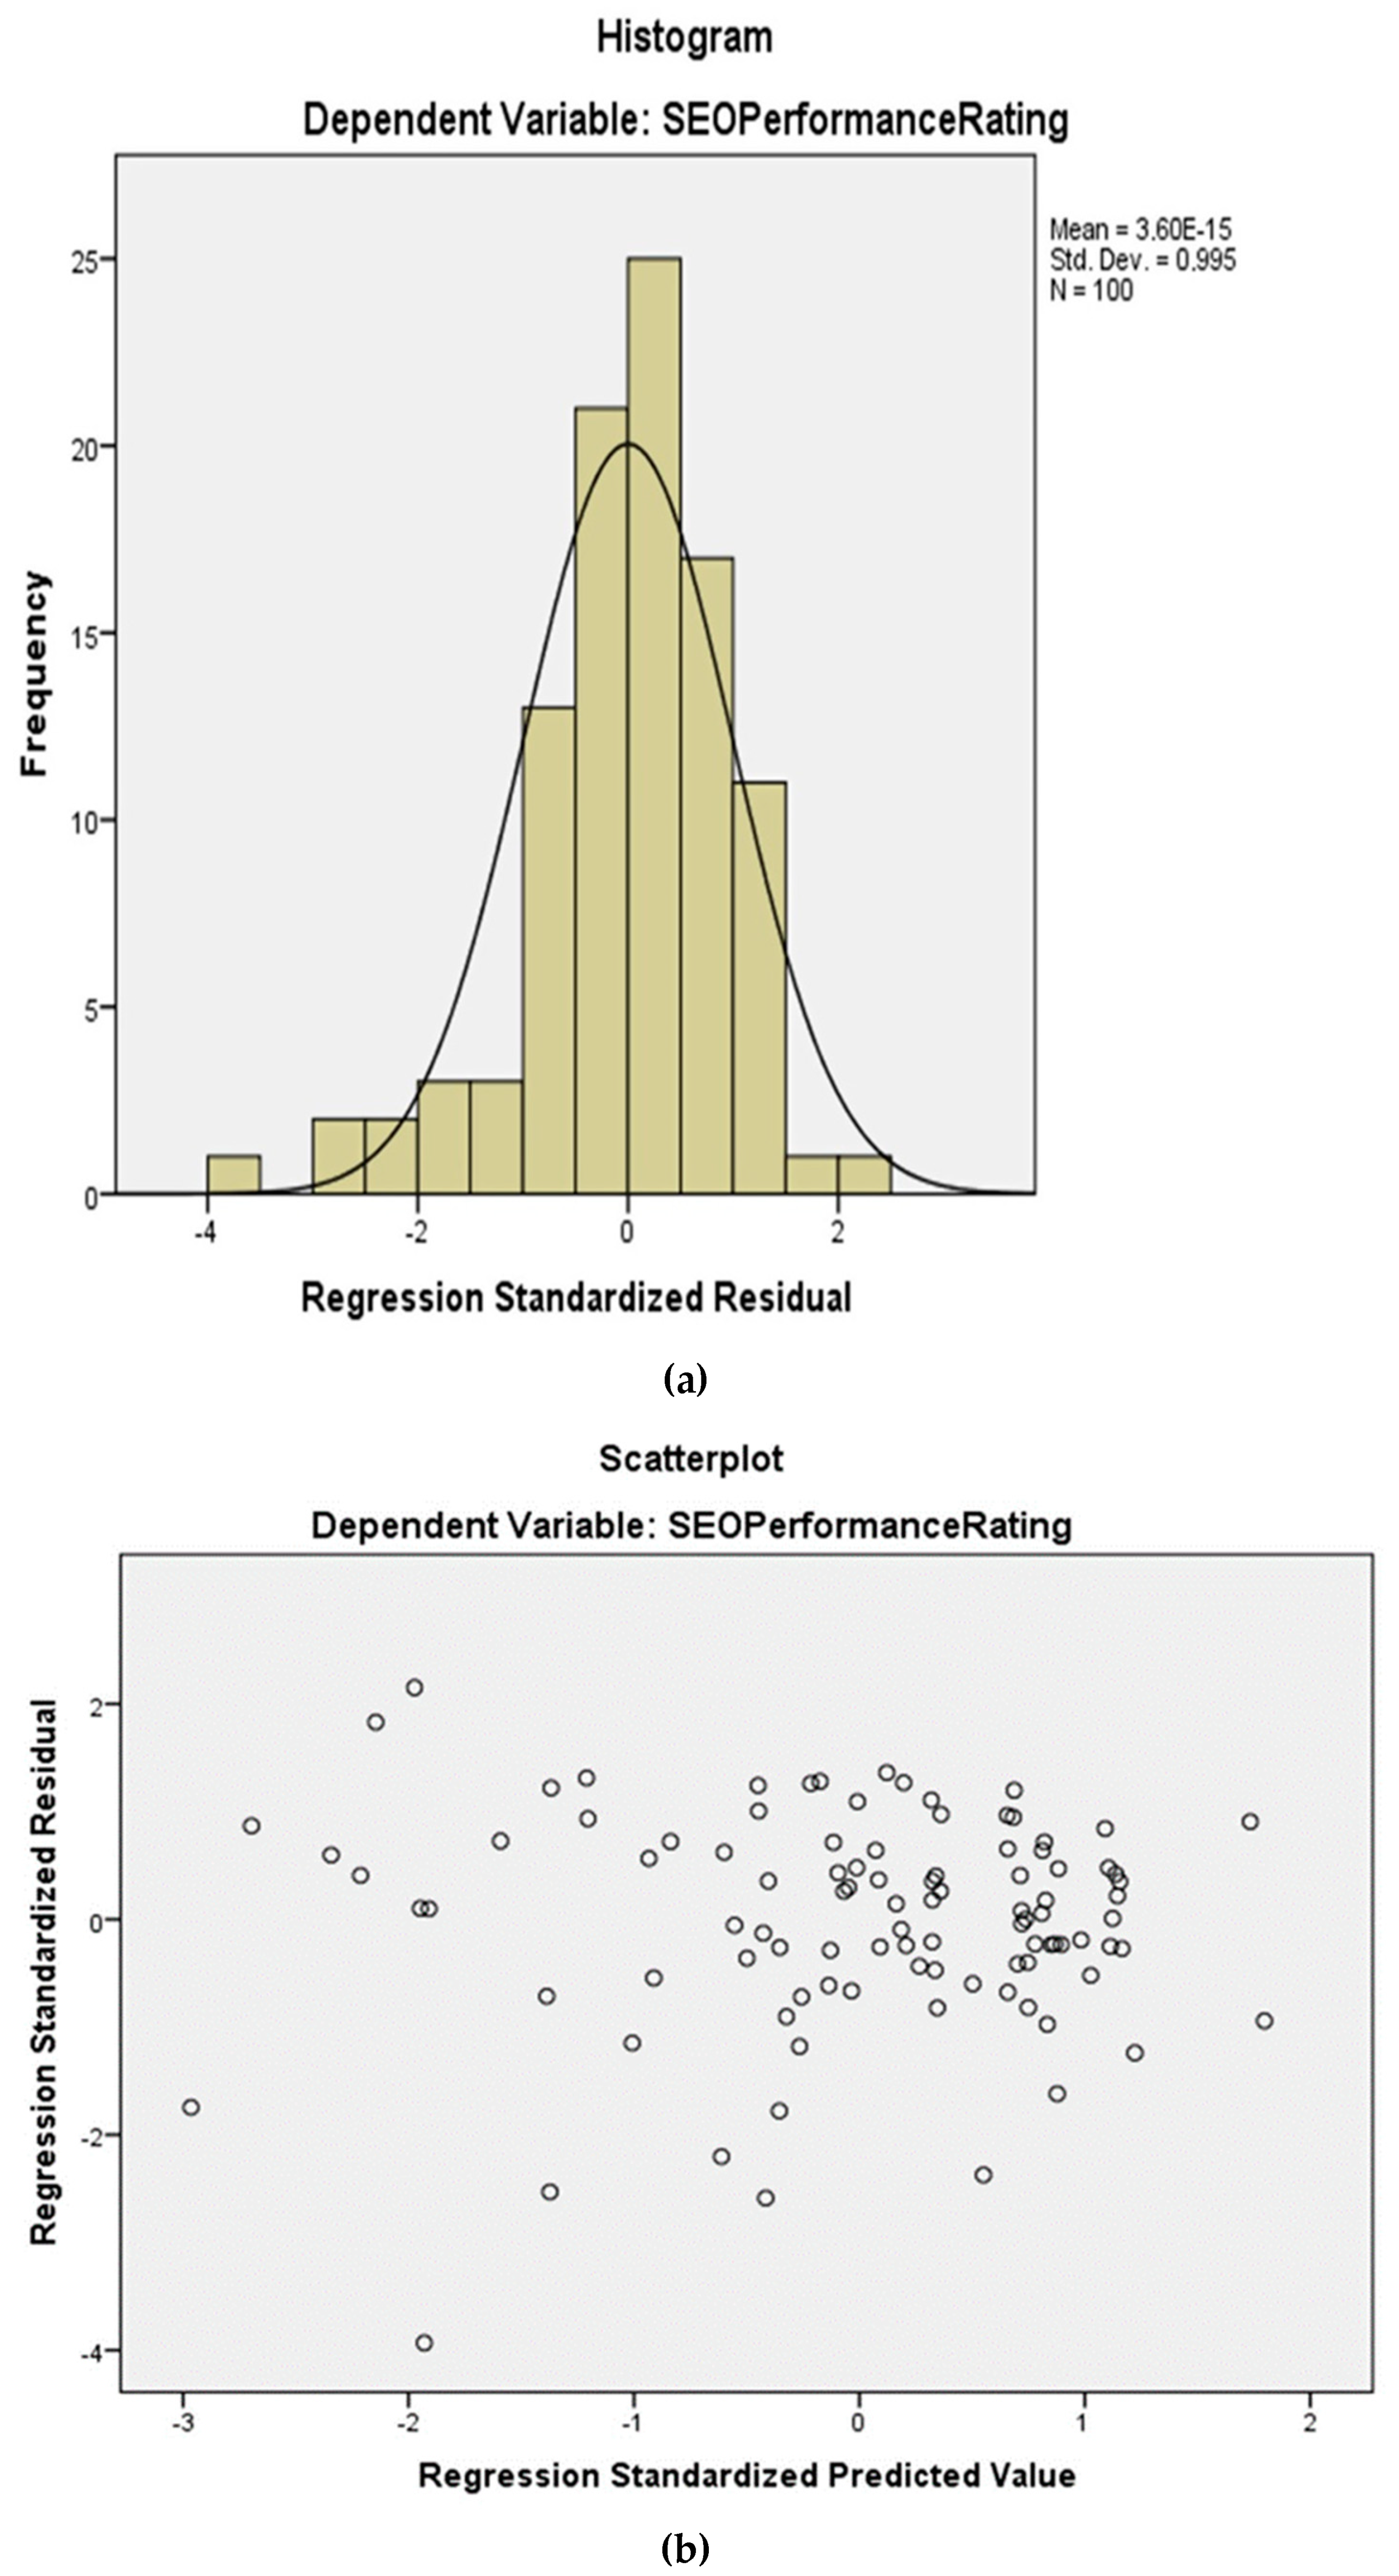
Table 1.
Summary of the main characteristics of the major rankings.
| Subsection | Ranking Name | Main Indicators/Criteria | Generic Characteristics |
|---|---|---|---|
| Section 2.1.1 | Academic ranking of world universities (ARWU)/Shanghai list | The number of graduates and faculty members who have received major prizes. The number of faculty members included in the lists of researchers with a very high number of citations. The number of publications in nature/science journals and in the science/ social sciences citation index. The normalized per capita academic performance. | One of the best-known rankings criteria—academic and oriented. |
| Section 2.1.2 | Webometrics ranking of World universities | Presence rank. Impact rank. Openness. Excellence rank. | Criteria which concern their presence and popularity on the web and the impact of their research work. |
| Section 2.1.3 | Times Higher Education World University Rankings | Private sector revenue. International dimension. Teaching. Research and research impact. | One of the most influential rankings at international level |
| Section 2.1.4 | QS World University Rankings | Peer review data. The number of international staff, students, Scopus citations and teacher / student ratios. | The scores and rankings in each of the indicators are announced for the top 500 only. |
| Section 2.1.5 | Center for World University Rankings (CWUR) | Quality of education and faculty. Alumni employment. Publications and citations. Influence and wider impact. Patents. | Measures of the quality of the education and training of the student, the prestige of faculty members and the quality of their research. |
| Section 2.1.6 | US News—Best Global University Rankings | Global and local research reputation. Publications, textbooks, and conferences. Total and weighted impact of citations. Number and percentage of publications that are among the 10% of the most cited publications. International collaborations. | Were created to provide a picture of how universities can compare worldwide [18]. |
| Section 2.1.7 | National Taiwan University (Performance ranking of scientific papers) | Research production. Research impact. Research excellence. | Based on the research work produced and published by each institution, on the impact of the published papers, and on their final particular distinction. |
Table 2.
Weights for the calculation of the website structure evaluation metric.
| Metric | Weight |
|---|---|
| HTML errors | 22 |
| HTML warnings | 5.5 |
| CSS errors | 22 |
| CSS warnings | 5.5 |
| Mobile friendliness | 27 |
| Lighthouse best practices | 18 |
Table 3.
Weights for the calculation of the website accessibility evaluation metric.
| Metric | Weight |
|---|---|
| aChecker known problems | 30 |
| aChecker potential problems | 7.5 |
| WAVE errors | 30 |
| WAVE alerts | 7.5 |
| Lighthouse accessibility | 25 |
Table 4.
Weights for the calculation of the website performance evaluation metric.
| Metric | Weight |
|---|---|
| WPT first byte | 7 |
| WPT transfer compression | 7 |
| WPT Img compression | 7 |
| WPT static cache | 7 |
| WPT keep-alive | 4 |
| WPT progressive | 3 |
| WPT CDN | 13 |
| Google PageSpeed mobile | 26 |
| Google PageSpeed desktop | 26 |
Table 5.
Weights for the calculation of the overall website quality evaluation metric.
| Metric | Weight |
|---|---|
| Website Structure | 27 |
| Website accessibility | 40 |
| Website performance | 33 |
Table 6.
Search engine optimization (SEO) tools overview.
| Tool | Company | URL | Focus |
|---|---|---|---|
| Neil Patel’s SEO analyzer | Neil Patel digital | neilpatel.com | Crawling multiple pages, content metrics (word counts, title sizes etc.). |
| SEO site checkup | SEO site Checkup LLC | seositecheckup.com | Advanced SEO tests, competition comparisons. |
| WooRank website review | WooRank | www.woorank.com | Mobile friendliness, social media. |
| Lighthouse SEO audit | Google LLC | developers.google.com/web/tools/lighthouse | Essential structure, Google guidelines. |
Table 7.
Weights for the calculation of the SEO performance evaluation metric.
| Metric | Weight |
|---|---|
| Neil Patel | 25 |
| SEO site checkup | 30 |
| WooRank | 25 |
| Lighthouse SEO | 20 |
Table 8.
Data formation.
| Institution | ARWU Rating | ARWU Ranking | Website Quality Rating | SEO Performance Rating | Overall Web Rating | WQR | SEOPR | OWR |
|---|---|---|---|---|---|---|---|---|
| Harvard U. | 100.00 | 1 | 80.67 | 88.46 | 84.56 | 21 | 14 | 10 |
| Stanford U. | 75.10 | 2 | 78.92 | 87.71 | 83.32 | 35 | 18 | 17 |
| U. Cambridge | 72.30 | 3 | 79.51 | 86.49 | 83.00 | 30 | 26 | 20 |
| MIT | 69.00 | 4 | 79.39 | 81.96 | 80.67 | 31 | 63 | 36 |
| UC Berkeley | 67.90 | 5 | 80.23 | 83.17 | 81.70 | 24 | 57 | 34 |
| Princeton U. | 60.00 | 6 | 79.59 | 84.05 | 81.82 | 28 | 45 | 32 |
| U. Oxford | 59.70 | 7 | 80.53 | 84.79 | 82.66 | 23 | 36 | 21 |
| Columbia U. | 59.10 | 8 | 68.12 | 80.24 | 74.18 | 71 | 75 | 72 |
| California Tech | 58.60 | 9 | 48.26 | 79.40 | 63.83 | 97 | 78 | 95 |
| U. Chicago | 55.10 | 10 | 79.18 | 89.38 | 84.28 | 33 | 8 | 13 |
Table 9.
Spearman correlation coefficient between the Academic Ranking of World Universities (ARWU)’s 100 highest universities ranking and our website quality ranking (WQR), SEO performance ranking (SEOPR), and overall web ranking (OWR).
Table 9.
Spearman correlation coefficient between the Academic Ranking of World Universities (ARWU)’s 100 highest universities ranking and our website quality ranking (WQR), SEO performance ranking (SEOPR), and overall web ranking (OWR).
| WQR | SEOPR | OWR | |
|---|---|---|---|
| Shanghai Ranking | Rho (100) = 0.35 (Sig. 2 sided 0.000) | Rho (100) = −0.044 (Sig. 2-sided 0.333) | Rho (100) = 0.32 (Sig. 2-sided 0.001) |
Table 10.
Model summary of simple regression analysis.
| Model | R | R Square | Adjusted R Square | Std. Error of the Estimate |
|---|---|---|---|---|
| 1 | .266 a | .071 | .062 | 10.35 |
a. Predictors: (Constant), Shanghai rating.
Table 11.
Model coefficients simple regression analysis.
| Model | Unstandardized Coefficients | t | Sig. | ||
|---|---|---|---|---|---|
| B | Std. Error | ||||
| 1 | (Constant) | 63.6 | 3.2 | 19.87 | .000 |
| Shanghai rating | .224 | .082 | 2.737 | .007 | |
Table 12.
The use of flat weights in the calculation of Spearman correlation coefficient between the ARWU, website quality ranking (WQR), SEO performance ranking (SEOPR), and overall web ranking (OWR).
Table 12.
The use of flat weights in the calculation of Spearman correlation coefficient between the ARWU, website quality ranking (WQR), SEO performance ranking (SEOPR), and overall web ranking (OWR).
| WQR | SEOPR | OWR | |
|---|---|---|---|
| Shanghai ranking | Rho (100) = 0.31 (Sig. 2-sided 0.002) | Rho (100) = −0.06 (Sig. 2-sided 0.55) | Rho (100) = 0.28 (Sig. 2-sided 0.004) |
Table 13.
Model summary between SEO performance and website quality.
| Model | R | R Square | Adjusted R Square | Std. Error of the Estimate | Change Statistics | |
|---|---|---|---|---|---|---|
| R Square Change | F Change | |||||
| 1 | .406 a | .165 | .156 | 5.48265941 | .165 | 19.360 |
a. Predictors: (Constant), Shanghai rating.
Table 14.
Model coefficients simple regression analysis of website quality and SEO performance.
| Model | Unstandardized Coefficients | Standardized Coefficients | t | Sig. | ||
|---|---|---|---|---|---|---|
| B | Std. Error | Beta | ||||
| 1 | (Constant) | 66.213 | 3.749 | 17.661 | .000 | |
| website quality rating | .227 | .052 | .406 | 4.400 | .000 | |
© 2019 by the authors. Licensee MDPI, Basel, Switzerland. This article is an open access article distributed under the terms and conditions of the Creative Commons Attribution (CC BY) license (http://creativecommons.org/licenses/by/4.0/).
Share and Cite
MDPI and ACS Style
Giannakoulopoulos, A.; Konstantinou, N.; Koutsompolis, D.; Pergantis, M.; Varlamis, I. Academic Excellence, Website Quality, SEO Performance: Is there a Correlation? Future Internet 2019, 11, 242. https://doi.org/10.3390/fi11110242
AMA Style
Giannakoulopoulos A, Konstantinou N, Koutsompolis D, Pergantis M, Varlamis I. Academic Excellence, Website Quality, SEO Performance: Is there a Correlation? Future Internet. 2019; 11(11):242. https://doi.org/10.3390/fi11110242
Chicago/Turabian StyleGiannakoulopoulos, Andreas, Nikos Konstantinou, Dimitris Koutsompolis, Minas Pergantis, and Iraklis Varlamis. 2019. "Academic Excellence, Website Quality, SEO Performance: Is there a Correlation?" Future Internet 11, no. 11: 242. https://doi.org/10.3390/fi11110242
Note that from the first issue of 2016, this journal uses article numbers instead of page numbers. See further details here.