
Aroma Perception of Rose Oxide, Linalool and α-Terpineol Combinations in Gewürztraminer Wine


Department of Food Science and Technology, Oregon State University, Corvallis, OR 97331, USA
*
Author to whom correspondence should be addressed.
Fermentation 2022, 8(1), 30; https://doi.org/10.3390/fermentation8010030
Submission received: 23 December 2021
/
Revised: 10 January 2022
/
Accepted: 11 January 2022
/
Published: 13 January 2022
(This article belongs to the Special Issue Wine Aromas)
Abstract
:Cis-Rose oxide was found to be an important chiral compound in Gewürztraminer wine, with an enantiomeric ratio range from 76 to 58%. The enantiomeric ratio showed an important influence on white wine aroma when other monoterpenes were present. The aim of this study was to evaluate rose oxide at different ratios and changes to aroma perception, and the interaction of rose oxide with linalool and α-terpineol. A wine model was made based on Gewürztraminer wine. Twelve models were created with different ratios of rose oxide and concentrations of linalool and α-terpineol. Triangle tests, check-all-that-apply (CATA) and descriptive analysis were used to evaluate the aroma of the wines. Results show that the rose oxide ratios of 70:30 and 65:35 were statistically different. Additional descriptive analysis showed that the ratios altered aroma when linalool and α-terpineol were at low and medium concentrations. At high concentrations, linalool and α-terpineol masked any influence from rose oxide. Understanding how monoterpenes alter aroma perception of white wine when at different combinations and concentrations is important to achieving desired wine qualities and helps provide information on how flavor chemistry results can be interpreted without having to run sensory analysis.
1. Introduction
The aroma of wine is an important aspect of wine quality [1] and is normally described using pleasant aromas, such as floral, green fruit, citrus fruit, stone fruit, tropical fruit, red fruit, black fruit, dry fruit, herbaceous, herbal, spices, and more [2,3]. Aroma characteristics in wine are of interest to consumers, especially for white wine, as it reflects the typicity for a specific region or terroir [4,5]. One of the most important factors in determining wine typicity and quality is which compounds are most important to aroma perception [4,6].
Aroma is one of the first quality aspects assessed when evaluating wine [7]. The aroma compounds travel from the wine, into the air and through the nose, until they bind to the receptors of the olfactory bulb [8]. The olfactory bulb is the first relay station of the central olfactory system in the mammalian brain, and contains a few thousand glomeruli on its surface. Individual glomeruli represent a single type of odorant receptor [9], and each receptor can detect a limited number of odorants substances [10].
Many olfactory receptors are specific to different enantiomers [11]. Enantiomers are a type of isomer that display a quality called chirality, meaning that they have same molecular formula and the same connectivity, but they differ in the way that they are oriented in three-dimensional space [12]. The olfactory receptors react differently with the two enantiomeric forms of a chiral odorant, leading to differences in odor strength and quality [11]. A slight modification of the chemical structure of a stimulus molecule can lead to large changes in the odor impression. Linalool is an example of this characteristic, as its (+)-enantiomer displays a sweet, petitgrain aroma, and the (−) enantiomer has lavender notes and an oily, woody aroma [11].
The sensory perception of aroma in wine is complex. A single glass of wine can contain hundreds of aroma compounds [8]. Traditionally, it was thought that only compounds at high concentrations, those above their known perception thresholds, influenced aroma perception [13]. However, it has been shown that low impact odorants may act to change the perception of other odorants in a mixture, may interact synergistically or antagonistically, and can significantly impact aroma perception [5].
Many monoterpenes are chiral [14] and their enantiomeric forms can be found in grapes and wine [15]. There has been a growing awareness and interest in their enantiomer specific properties [16], as aroma characteristics of wine cannot be understood only from the knowledge of aroma composition alone [17]. In some cases, both enantiomers have similar odors and thresholds [12], such as α-pinene [18]. In others, one enantiomer is odorous and some do not have odors [12] like androstenone [11], while others have different detection thresholds, such as cis-rose oxide [12,19]. Few studies have evaluated the different chiral monoterpenes and the effect of interactions among them. Monoterpenes are of interest, as monoterpene combinations have been found to influence the aroma of wine, resulting in different aroma qualities [17].
Monoterpenes are present in grapes of all wine varieties, but the highest concentrations occur in aromatic varieties such as Muscat, Gewürztraminer, Irsai Oliver, and Riesling [20]. Considerable research has been done with respect to the identification and contribution of terpene compounds to the muscat aroma of muscat grapes and wines [21]. In general, there are indications that many terpenes, not just linalool and geraniol, contribute to muscat and related aromas [21]. Furthermore, it was found that terpenes interact to such an extent that one component can increase the aroma intensity of another compound, and that a mixture could become more aromatic than the most aromatic single component which belongs to that mixture [21].
The monoterpene content of Pinot gris, Riesling and Muscat wines has been investigated [21,22,23,24], including how monoterpenes influence aroma perception [17,25]. However, there is much less information available focusing on Gewürztraminer wines. Gewürztraminer is one of the world’s oldest vine varieties found in Europe, America, and Australia [26]. Their aroma is characterized as having a “Traminer” smell or aroma quality reminiscent of the tropical fruit lychee [27]. Other terms used to describe this on Gewürztraminer wine are: spicy, floral (rose petals), fruity (citrus, grapefruit, peach), lychee, cold cream, honey, and jasmine tea [28]. The compounds that are responsible for the overall flavor of Gewürztraminer wines [26,29], and their monoterpene concentration has been investigated [22]. Yeast strain used during fermentation and time of grape harvest has been found to influence the aromatic profile [20,30]. Cis-rose oxide has been found to have a significant influence in odor profiles [29].
Cis-rose oxide has been identified as the most characteristic odor compound in Gewurztraminer [27]. Additionally, linalool, geraniol, nerol, citronellol, and α-terpineol are known to be significant compounds, where linalool is considered important in both free and bound form [31]. In spite of this, cis-rose oxide is the main impact odorant related to sweet and fruity [11], and it is thought to produce the aroma of lychee in Gewürztraminer wine [32].
Additionally, (−)-rose oxide has shown an important influence in wine aroma when monoterpenes were added in different mixtures in white wine, where the wines that were perceived as different contained (−)-rose oxide [19]. Furthermore, Gewurztraminer wines have reported a range of enantiomeric ratio of cis-rose oxide, always in favor of the (−)-enantiomer, going from 58 to 76% [22,29,33], and when combined with trans-rose oxide, the percentage has been found from 70 to 85% in favor of the (−)-enantiomer [22]. Additionally, it has been observed that the concentration of monoterpenes changed when using different yeast, and when grapes were harvested later [20,30]. Its enantiomers are found in many mixtures of monoterpenes in wine, but two aspects are unclear. (1) Do the two different ratios of enantiomers produce different aroma qualities in wine? and (2) how does rose oxide alter aroma quality when in mixtures of other monoterpenes? Does it dominate the perceived aroma, or are the differences more subtle? The aim of this work was to evaluate the sensory perception of the different ratios of rose oxide in mixtures with other monoterpenes and assess aroma interactions with other monoterpenes in wine.
2. Materials and Methods
2.1. Wine Base
Wine aroma compounds were removed in the same way as described by Song et al. [17]. LiChrolut EN resin was added to wine at a rate to 1.5 g L−1. Wines with resin were stirred for 24 h before filtering out the resin and storing in Stainless Ball Lock Kegs (AMCYL, Wyoming, MN, USA) with nitrogen at 4 °C for later use. A week prior to sensory analysis, the aroma base (Supplementary Table S1) was added to the dearomatized wine. This model wine was then bottled in 750 mL glass wine bottles with screw caps ((Stelvin Amcor, Zurich, Switzerland) and stored at 4 °C until the sensory panel.
2.2. Chemicals
The following chemical standards were used in the Aroma Base and were obtained from Sigma-Aldrich Co. (St. Louis, MO, USA): Acetaldehyde (≥99%), hexanol (98%), ethyl octanoate (≥98%), isoamyl acetate (≥99%), 2-phenyl acetate (≥99%), ethyl butanoate (≥98%), dyacetyl (97%), methionol (≥98%), isobutyl acetate (≥97%), ethyl 3-methylbutanoate (≥98%), ethyl 2-methylbutanoate (≥98%), isobutanol (≥99%), ethyl acetate (≥99%), phenethyl alcohol (≥99%), butanoic acid (≥99%), ethyl decanoate (≥99%), ethyl hexanoate (≥99%), hexanoic acid (99%), octanoic acid (≥99%) and decanoic acid (≥98%). The terpenes compounds added to the model wine for the treatments were: (−)-rose oxide (Analytical Standard), (−)-rose oxide (Analytical Standard), Linalool (≥97%) and α-terpineol, which were purchased from Sigma-Aldrich Co. (St. Louis, MO, USA). Solvents. Mili-Q water.
2.3. Standards and Wine Treatments
Stock standard solutions of all chemicals used in the aroma base and wine models were prepared in 14% aqueous ethanol. The stock solutions were stored at −20 °C. Composite standards were created from the stock standards so that fewer additions were made when aroma base or treatments were added. Prior to additions, the working standards were defrosted one day before in a fridge (4.9 °C). Aroma base compounds were added to the model wine 4 days prior to the first sensory analysis (Supplementary Table S1). Treatment standards were added to the model wine 1 h prior to each day sensory analysis. Concentrations of the terpenes in each treatment were chosen according to literature concentrations [20,22,30]. The final concentrations chosen can be found in Table 1.
2.4. Sensory Analysis
This study was approved by the Oregon State University Internal Review Board (#8606). All panelists were non-smokers, not pregnant at the time of the study, free of taste deficit disorders, free of oral lesions or sores, and had no piercings on the lips, cheeks, or tongue. Panelists were regular white wine consumers (at least one serving of white wine a week). All panels occurred at Oregon State University in the Arbuthnot Dairy Lab (Corvallis, OR, USA). The room was kept at a constant of 21 °C, with a mix of natural and artificial light. Each panelist had their own individual booth (61 cm × 71 cm center, 61 cm × 65 cm sides) and two air purifiers (Winix, Vernon Hills, IL, USA) were used for air quality maintenance. Results were collected using Compusense Cloud Software® (Version 21.0.773.192939).
2.5. Triangle Test Procedure
A total of 65 participants (49 Women and 16 men, all above 21 years old) were recruited from Oregon State University and the surrounding area, for the triangle tests. The triangle test evaluated models 1 to 4 (Table 1), as the main goal was to determine if the ratio of rose oxide enantiomers elucidated different sensory responses. Testing occurred between 19 April and 23 April 2021; each panelist attended a single session. Each panelist was presented with six triangle tests to cover the comparison between the 4 ratios in all possible combinations.
For each wine, 20 mL of sample was served in black INAO wine glasses (Lehmann glass, Kiyasa Group, New York, NY, USA) with three-digit random codes and covered with plastic lids (Clark Associates, Inc. Lancaster, PA, USA). The treatments were kept at 4 °C until serving and were poured 30 min before each sensory test. Panelists were instructed to smell the samples in the order indicated, from left to right, and choose the sample that was most different. A 1 min break between each test was required to avoid any carryover effects and fatigue.
2.6. CATA
The treatments that were found to be significantly different in triangle tests and the additional terpene combinations were used in CATA (treatments 2, 3, 5, 6, 7, 8, 9, 10, 11 and 12). The CATA included 23 sensory descriptors with two “other” options so that panelists could write in any descriptors that they thought were important, but were not in the terms provided. CATA analysis occurred in the same room as triangle test at OSU on 29 April 2021. Twenty-five wine consumers (20 women and four men, one—chose not to specify, age 21 to 60) participate in one session (1-h sessions). Panelists were instructed to smell the sample and select all the descriptors that were perceived in the sample. A 30 sec break between each test was required to avoid any carryover effects and fatigue.
2.7. Descriptive Analysis for Aroma Intensity
From the CATA results, 13 aroma descriptors were selected for further descriptive analysis. Attributes with their training standards and images used in training can be found in Table 2. Nineteen wine consumers (11 women and 8 men, all over 21 years old) were trained on recognizing 13 different aroma standards (Table 2). Participants were trained through multiple choice odor and image recognition training [17]. During the second training, panelists also evaluated two random aromatic wines using a 100 mm line scale with anchors at 30 mm and 70 mm labeled none and extreme respectively, to help them become familiar with the test.
2.8. Statistical Analysis
Binomial Statistical model was used to determine differences in the triangle test between the models 1 and 4. As part of the binomial model, a Z-test was used to determine if there is a significant difference between the models (α = 0.05). For CATA analysis, a Cochran’s Q test and correspondence analysis were performed to determine the aroma descriptors to be used in further descriptive analysis, utilizing line scales. For the line intensity scales, the data were analyzed using principal component analysis (PCA) and agglomerative hierarchical clustering (AHC). All statistical analyses were performed using XLstat (2020.1.3).
3. Results
3.1. Triangle Test
3.2. CATA
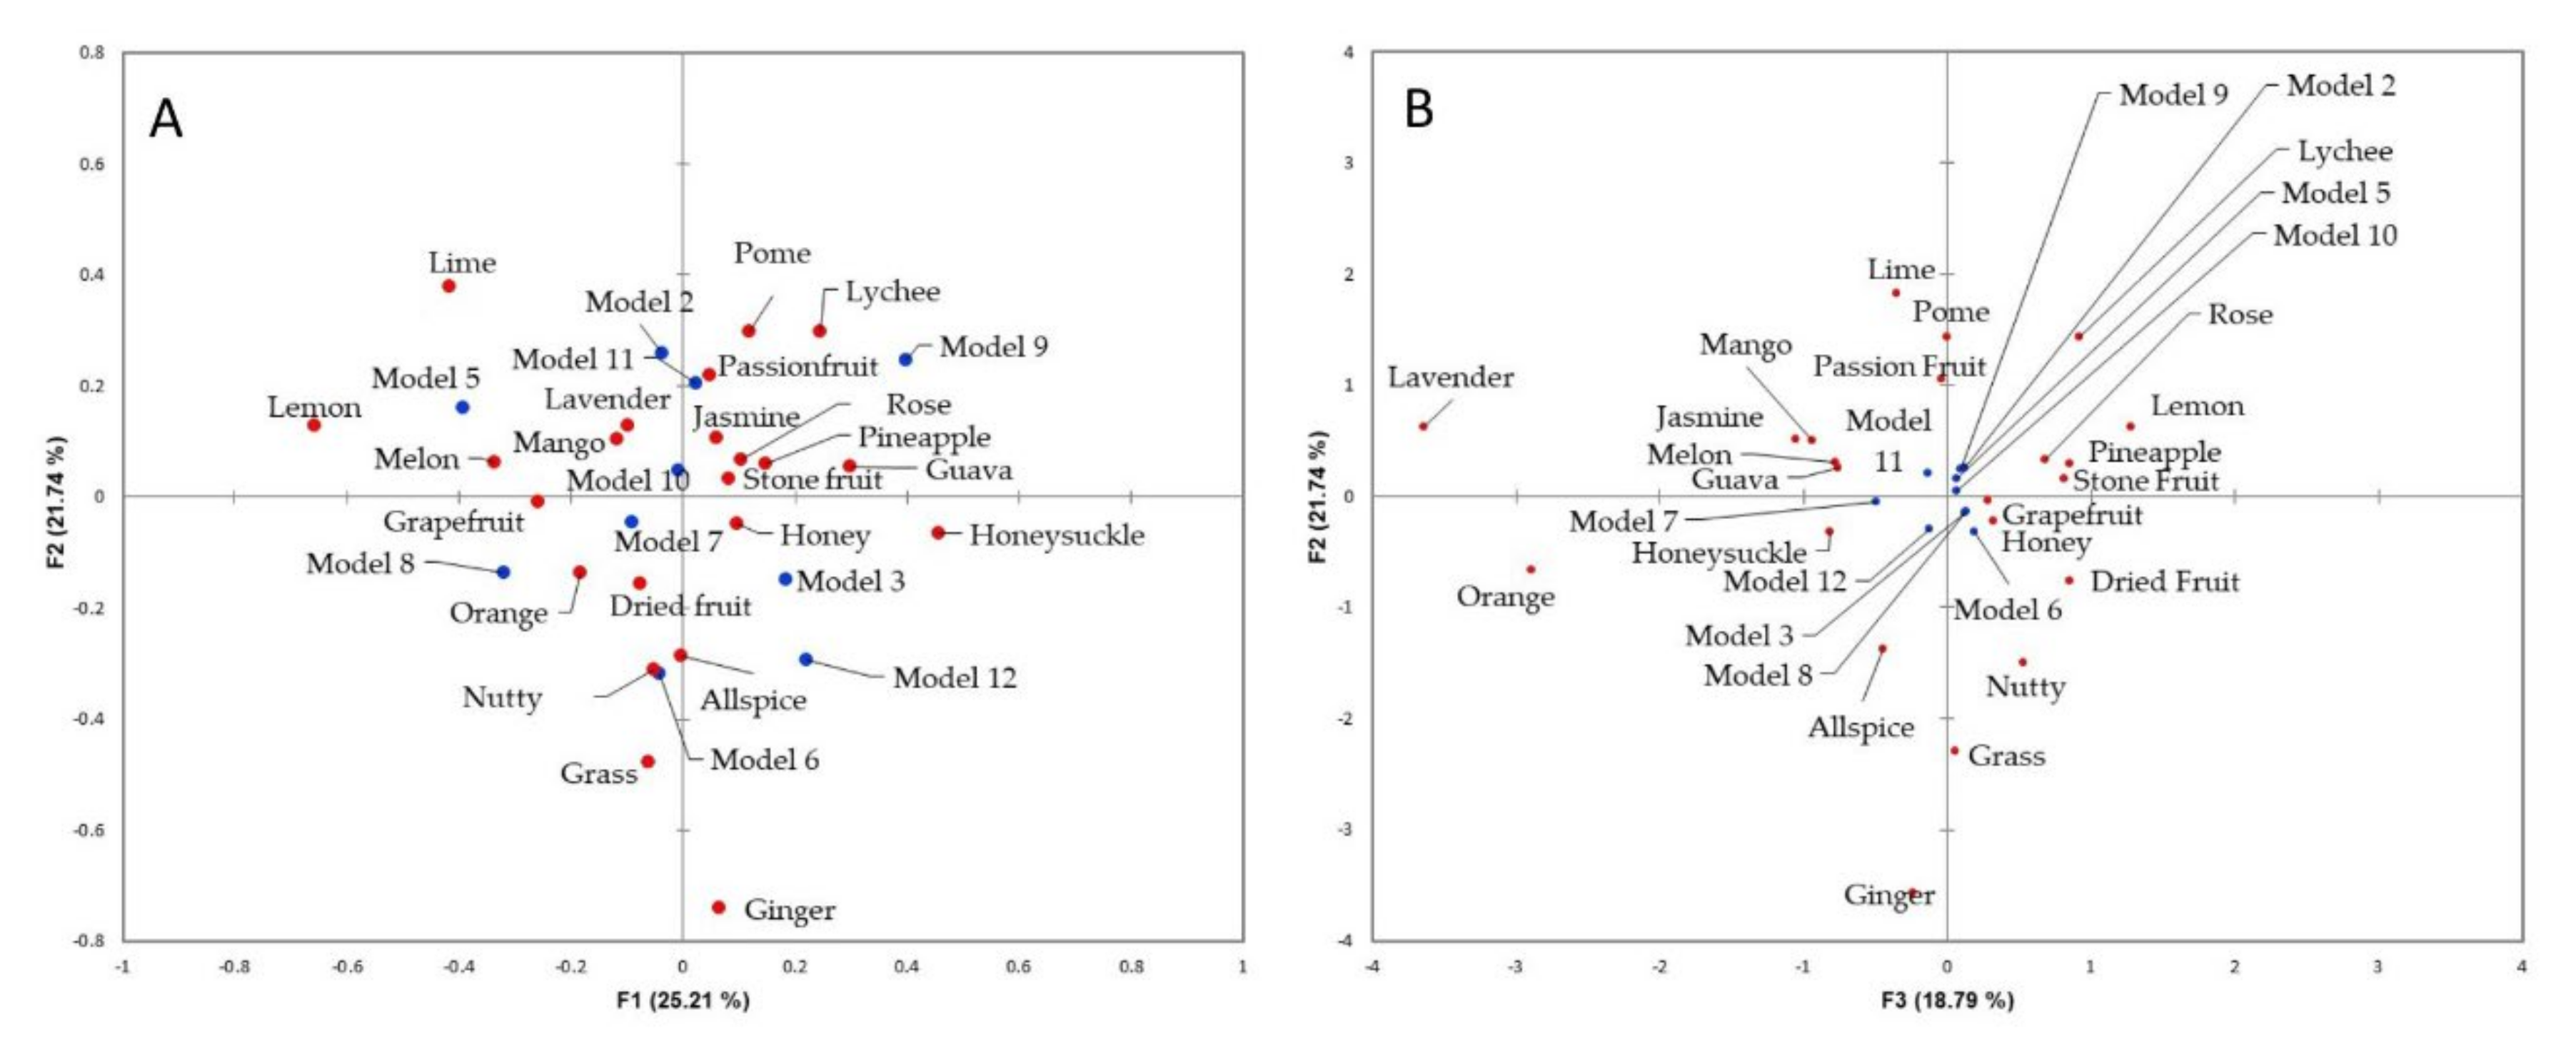
There were 22 attributes used more than 15% for CATA and included in the statistical analysis (Table 2). The first three variates of correspondence analysis explained 65.74% of the total variance (Figure 1). The terms could be separated into four groups using multiple pairwise comparisons (Sheskin critical difference) (Supplementary Table S2). Pome fruit, honey, stone fruit, and dried fruit had the greatest citation frequencies.
3.3. Descriptive Analysis Results
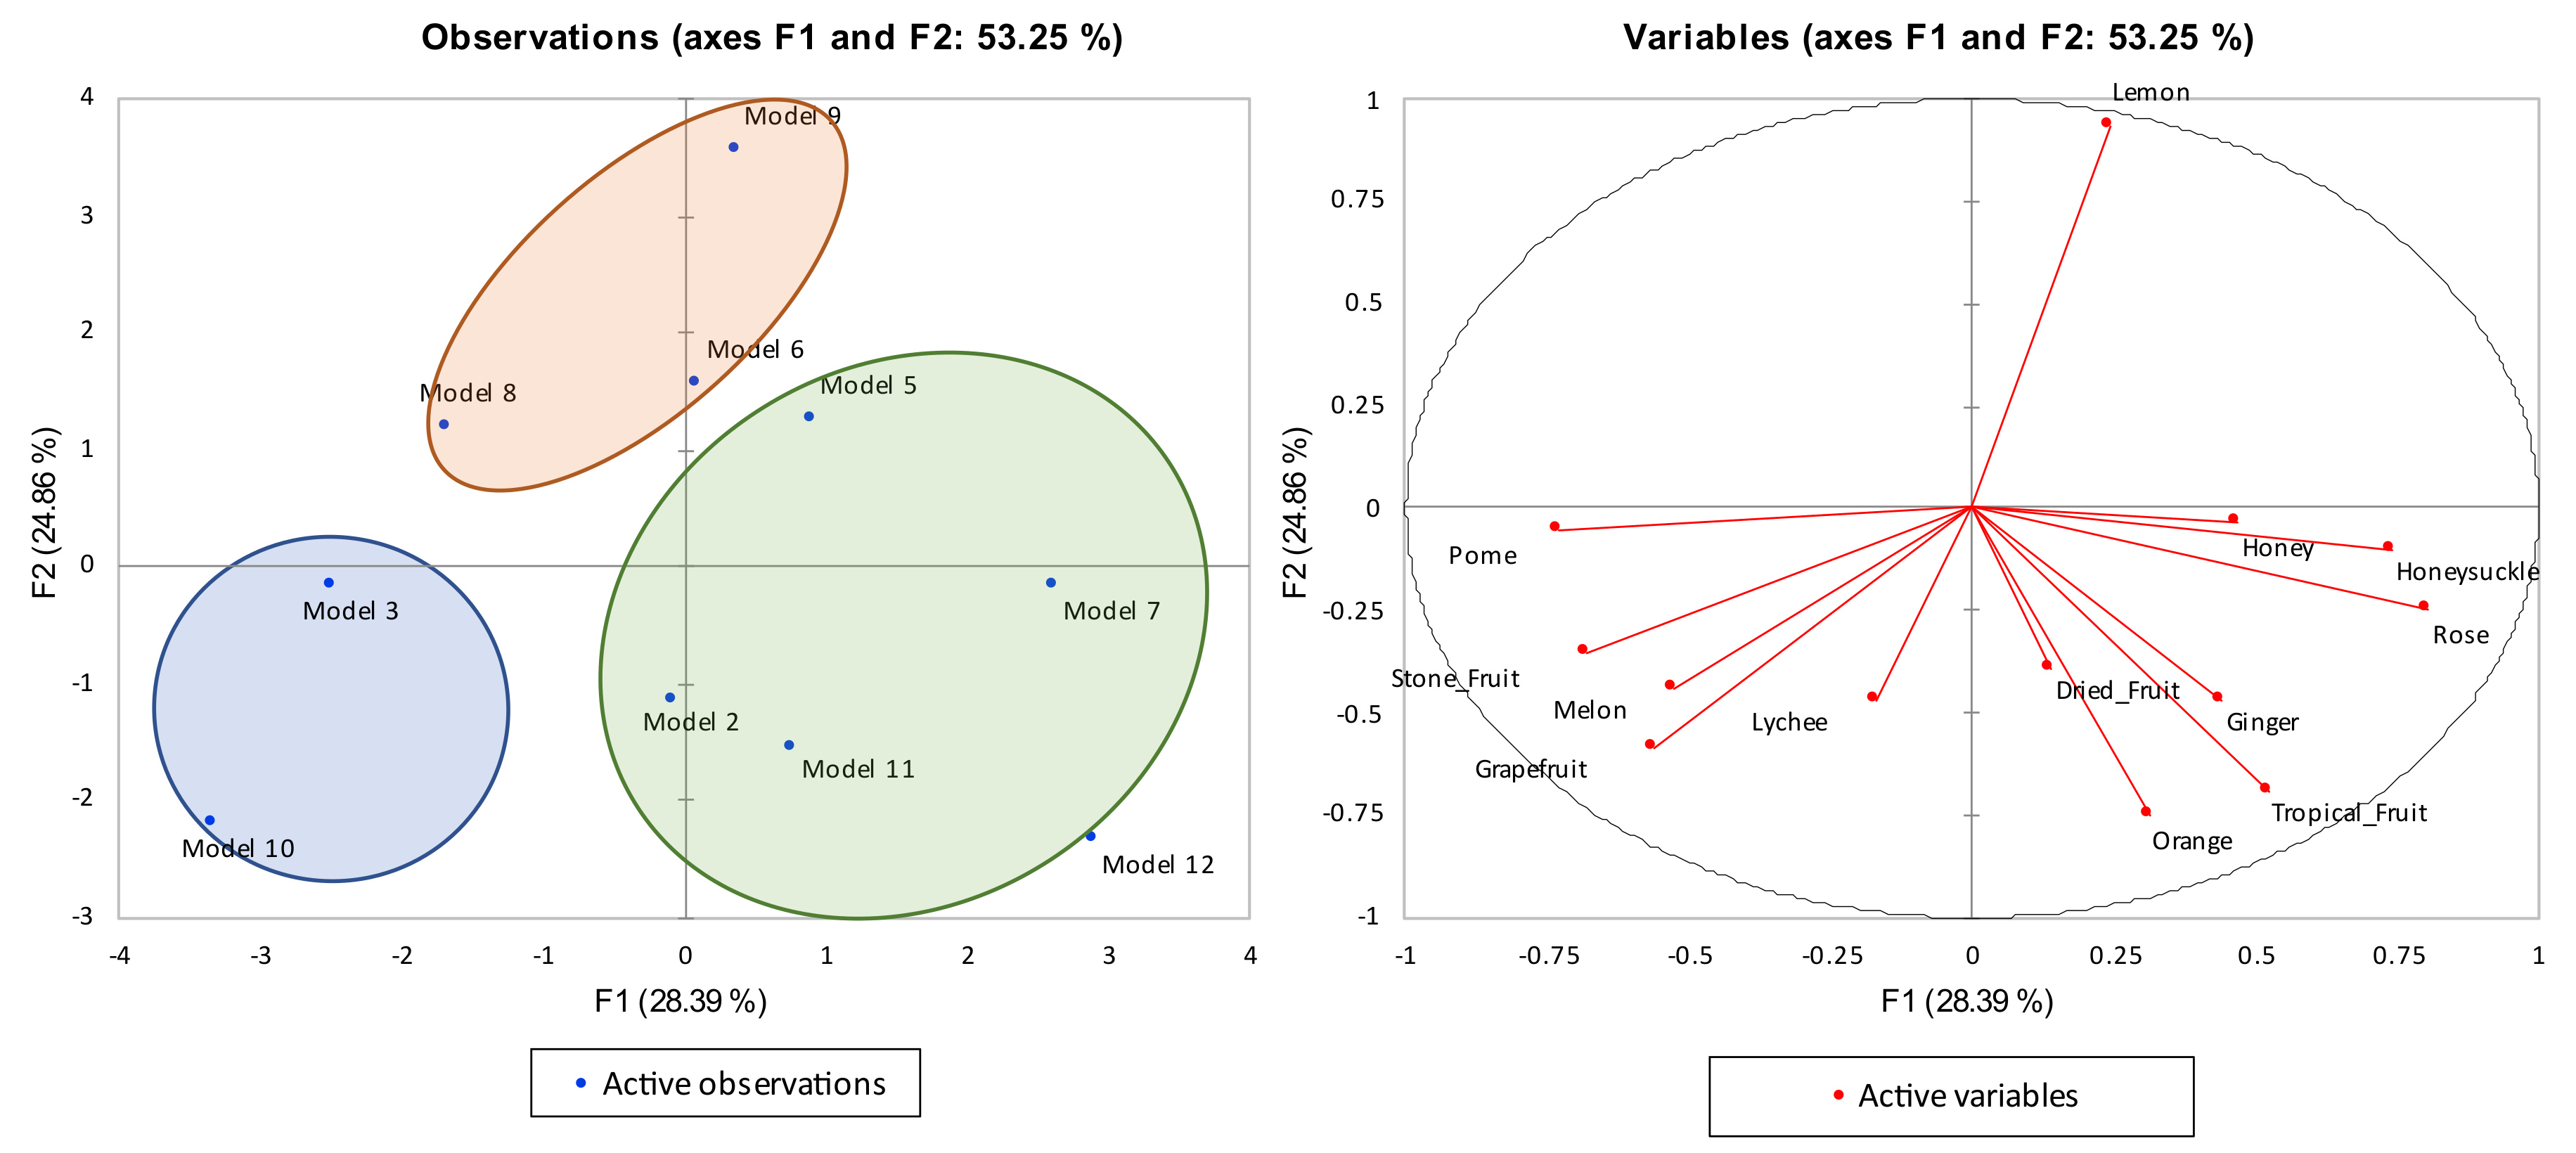
Differences were found in the model wines with the first two variates explained 53.25% of the total variance (Figure 2). A third dimension was not included, since it did not greatly increase the amount of total variance (only explained 15.42% more) and did not elucidate any additional groupings/separation of models. The wine models were classified into 3 clusters using agglomerative hierarchical clustering (AHC) (Supplementary Figure S1. Cluster 1 included models 3 and 10, and was characterized by pome, stone fruit, melon, and grapefruit descriptors. The second cluster included models 6, 8 and 9, and was characterized by lemon aroma. The third cluster included models 2, 5, 7, 11 and 12, and was characterized by lychee, honey, honeysuckle, rose, dried fruit, ginger, orange, and tropical fruit aromas.
4. Discussion
4.1. Triangle Test
Gewurztraminer wines are known to have different enantiomers of cis-rose oxide, with the ratio of enantiomers primarily altered during yeast fermentation [33]. In wine, the (−) enantiomer is dominant [17,33]. The dominant form is important as the enantiomers have different perception thresholds and aroma qualities [34]. Triangle tests (Table 3) show evidence that the ratio of rose oxide (RO) enantiomers altered aroma perception, specifically when comparing the ratio of 65:35 (Model 3) with the ratio of 70:30 (Model 2). This difference is interesting since those are the treatments closer in concentration and unexpectedly, model 2 was not considered to be different from model 4, which had a greater concentration difference in the enantiomer ratio. Unfortunately, model 1 and model 4 were not included in the descriptive analysis, so it is unclear exactly how aroma was altered. However, by looking at where model 2 and model 3 were located in the PCA results (Figure 2), there is the possibility that model 1 and model 4 may be located between these two points in the PCA, and therefore not different enough to show significant differences in the triangle test, something to be investigated in a future study.
4.2. Descriptive Analysis
Rose oxide is not present by itself in wine, and therefore, to understand the impact it has on quality, it is important to appreciate how this compound interacts with other compounds to alter aroma perception. Rose oxide is a monoterpene, and previous work has shown that when one monoterpene is altered, many others are also, as they all share the same biosynthesis pathway, starting with geranyl diphosphate (GPP) [35,36,37]. This work focused on the interaction between rose oxide, linalool and α-terpineol, based on concentrations determined in previous work [17]. Of the 10 model wines tested, three different clusters were found for descriptive analysis, as shown in Figure 2. How the wines grouped, and which aroma descriptors are related to those wines, clearly show interactions that result in aromatic perception changes.
Clusters are as follows; (1) model 3 and model 10, (2) models 6, 8 and 9, and (3) models 2, 5, 7, 11 and 12. Within these clusters, the rose oxide ratio is clearly a driver of aroma, especially when the other monoterpenes are at low concentrations. Something quite interesting is noted based on the ratios tested. When a ratio of 65:35 of rose oxide is present, this appears to be the main driver of aroma when linalool and α-terpineol are at low concentrations, as models 3 and 10 are in the same cluster (Figure 2). As the concentrations of linalool and α-terpineol increase, the interactions start to alter and change, being dominated by the other two compounds. However, the same does not occur when the rose oxide ratio is 70:30 and wines contain low concentrations of linalool and α-terpineol, as model wines 2 and 9 are not in the same group. This is most likely due to the different thresholds of the two enantiomers (Table 4).
Of the other monoterpenes being investigated, linalool appears to be greatly altering the aroma of wine, although this is dependent on concentration. As stated previously, linalool by itself is associated with floral aromas [43]. When no linalool is present, or when linalool is at low concentrations, there are no floral aromas associated with the wines (models 2, 3, 9 and 10). As the concentration of linalool increases the aroma of model 7, shifts to honeysuckle and honey, adding a floral characteristic to the wine. The other wines with medium amounts of linalool, model 5 and 8, are primarily associated with lemon and pome. Although model 5 is grouped with model 7, but it is clearly associated with the lemon eigenvector, as model 8 is with pome eigenvector. When linalool is at high concentrations, models 11 and 12, where a more consistent aroma profile is seen, with both wines described as tropical fruit, ginger, etc. The increased concentrations of α-terpineol in models 11 and 12 are altering the aroma of model 7 from floral to more tropical fruit, ginger aromas. A similar trend to linalool can be seen with increasing α-terpineol concentrations. A more systematic study would need to be determined if the main driver of aroma at high concentrations is primarily linalool or α-terpineol and not rose oxide.
It is known that (+)-cis rose oxide has floral-green and rose aromas, while (−)-trans has floral-green, herbal (minty) and fruity aromas [34]. Model 3 has a lower (−) enantiomer ratio (65:35) with pome as its main aroma descriptor, and as the (−) enantiomer increases (ratio 70:30, model 2), the aromas that characterized the wine are lychee and dried fruit. This suggests that a slight change in enantiomers is enough to bring out the traditional lychee aroma associated with Gewürztraminer wines [32]. Our results suggest that you need the 70:30 ratio to achieve lychee aroma. The known thresholds of (−)-cis-rose oxide, (+)-trans rose oxide and (−)-trans rose oxide are above the concentration used in our wines (Table 4), although these thresholds were not done in wine, and it is known that monoterpene thresholds decrease when in mixtures [44]. This could mean that the threshold for (−)-rose oxide in wine is lower than these values (Table 4).
A surprising result from the descriptive analysis was the tropical fruit, orange and ginger aromas associated with model 12. Linalool has been found to be an important compound for fresh ginger aroma [45]. Tropical fruit aromas in wine are traditionally associated with esters and volatile thiols, and not with monoterpenes [46]. Although linalool and α-terpineol are important components of passionfruit [47,48]. This combination of high concentrations of the two compounds may be another possible compound combination for tropical fruit aromas, which has been largely overlooked in wine.
The strong association of lemon aroma with model 9 was also unexpected, as lemon aroma is associated with limonene [49]. Limonene was not used in this study. Linalool is known to be a major component of lemon and orange juices [50], but is not considered to be a main driver of these aromas. Additionally, α-terpineol is considered to draw from flavors to aged lemon and citrus products; it is a degradation product of linalool [51]. Based on this information from lemon and orange products, it was a surprise to see such a strong lemon aroma association with combinations of the used terpenes. Although lemon was also noted in models 6 and 8, all three models have different rose oxide enantiomer ratios and concentrations of linalool and α-terpineol. No clear trend or explanation can be seen, and this association should be studied further.
When the ratio of rose oxide changed and the other terpene concentrations remained the same (model 9 versus model 10), the main descriptors changed from lemon to stone fruit, grapefruit and melon. Grapefruit aroma is traditionally associated with volatile thiols, 3-mercaptoheptan-1-ol and 3-mercaptohexanol [15] and not with rose oxide. However, of the other terpenes investigated, linalool is important to grapefruit aroma, when in combination with other monoterpenes [52]. Linalool and α-terpineol have previously been associated with stone fruit aroma in Viognier wines, at similar concentrations to those used in our study (58 and 18.5 µg/L, and 91 and 28 µg/L means, respectively) [53]. Our work supports this aroma association, although only when linalool and α-terpineol are at low concentrations.
5. Conclusions
These results not only suggest that monoterpene interactions impact aroma perception, but that also, the ratios of the enantiomers are crucial on aroma perception when low and medium concentrations of other monoterpenes are present. The low and medium concentrations are the most common concentrations found in wine. These aroma qualities help to anticipate variations in wines when modifying or altering grape and wine practices, with a focus on altering monoterpene content. Further research should be done to tease out the nuances found, and to determine which compound is more influential on aroma perception when higher concentrations are found.
Supplementary Materials
The following are available online at https://www.mdpi.com/article/10.3390/fermentation8010030/s1, Table S1: Final concentration of aroma compounds found in the wine base, Table S2: Multiple pairwise comparisons using the Critical difference (Sheskin) procedure. Figure S1: Differentiation of the wine models in dendrogram of AHC.
Author Contributions
Conceptualization, M.M.C.-H. and E.T.; methodology, A.D., E.T.; software, A.D., E.T.; validation, M.M.C.-H. and E.T.; formal analysis, M.M.C.-H., A.D., and E.T.; investigation, M.M.C.-H. and A.D.; resources, E.T.; data curation, A.D. and E.T.; writing—original draft preparation, M.M.C.-H.; writing—review and editing, E.T., A.D.; visualization, M.M.C.-H. and E.T.; supervision, E.T.; project administration, E.T.; funding acquisition, E.T. All authors have read and agreed to the published version of the manuscript.
Funding
This research received no external funding.
Institutional Review Board Statement
The study was conducted according to the guidelines of the Declaration of Helsinki, and approved by the Institutional Review Board (or Ethics Committee) of Oregon State University (Corvallis, OR, USA), protocol code IRB-2018-8606 and Date of approval: 27 June 2018.
Informed Consent Statement
Informed consent was obtained from all subjects involved in the study.
Data Availability Statement
Not applicable.
Conflicts of Interest
The authors declare no conflict of interest.
References
- Rocha, S.M.; Coutinho, P.; Coelho, E.; Barros, A.S.; Delgadillo, I.; Coimbra, M.A. Relationships between the Varietal Volatile Composition of the Musts and White Wine Aroma Quality. A Four Year Feasibility Study. LWT-Food Sci. Technol. 2010, 43, 1508–1516. [Google Scholar] [CrossRef]
- Peynaud, E.; Blouin, J. The Taste of smell. In The Taste of Wine, 2nd ed.; John Wiley & Sons: New York, NY, USA, 1996; Volume 1, pp. 50–78. [Google Scholar] [CrossRef]
- Ruiz, J.; Kiene, F.; Belda, I.; Fracassetti, D.; Marquina, D.; Navascués, E.; Calderón, F.; Benito, A.; Rauhut, D.; Santos, A.; et al. Effects on Varietal Aromas during Wine Making: A Review of the Impact of Varietal Aromas on the Flavor of Wine. Appl. Microbiol. Biotechnol. 2019, 103, 7425–7450. [Google Scholar] [CrossRef] [PubMed]
- Francis, I.L.; Newton, J.L. Determining Wine Aroma from Compositional Data. Aust. J. Grape Wine Res. 2005, 11, 114–126. [Google Scholar] [CrossRef]
- Styger, G.; Prior, B.; Bauer, F.F. Wine Flavor and Aroma. J. Ind. Microbiol. Biotechnol. 2011, 38, 1145–1159. [Google Scholar] [CrossRef]
- Zalazain, A.; Marín, J.; Alonso, G.L.; Salinas, M.R. Analysis of wine primary aroma compounds by stir bar sorptive extraction. Talanta 2007, 71, 1610–1615. [Google Scholar] [CrossRef] [PubMed]
- Jackson, R. Wine Tasting A Professional Handbook, 2nd ed.; Academic Press: Berkeley, CA, USA, 2009; Volume 1, pp. 1–22. [Google Scholar]
- Grainger, K.; Tattersall, H. Chapter 3 Nose. In Wine Quality: Tasting and Selection; John Wiley & Sons, Ltd.: Ames, IA, USA, 2009; pp. 35–39. Available online: https://ebookcentral.proquest.com/lib/osu/detail.action?docID=416557 (accessed on 25 October 2021).
- Mori, K. Unique Characteristics of the olfactory system. In The Olfactory System; Springer: Tokyo, Japan, 2014; pp. 1–18. [Google Scholar] [CrossRef]
- Lozano, J.; Santos, J.; Horrillo, M. Classification of White Wine Aromas with an Electronic Nose. Talanta 2005, 67, 610–616. [Google Scholar] [CrossRef] [PubMed]
- Terashini, R.; Buttery, G.; Shahidi, F. Enantioselectivity in Odor Perception. In Flavor Chemistry Trends and Development, 3rd ed.; ACS Symposium Series; American Chemical Society: Washington DC, USA, 1989; pp. 155–157. [Google Scholar]
- Bentley, R. The Nose as a Stereochemistry. Enantiomers Odor. Chem. Rev. 2006, 106, 4099–4112. [Google Scholar] [CrossRef]
- Buettner, A. Influence of mastication on the concentrations of aroma volatiles—Some aspects of flavour release and flavour perception. Food Chem. 2000, 71, 347–354. [Google Scholar] [CrossRef]
- Ager, D. Terpenes: The expansion of the Chiral Pool. In Handbook of Chiral Chemicals; CRC Press: New York, NY, USA, 2005; pp. 59–74. [Google Scholar]
- Buettner, A. Wine. In Springer Handbook of Odor; Springer: New York, NY, USA, 2017; pp. 143–162. [Google Scholar]
- Ganjitabar, H.; Hadidi, R.; Garcia, G.A.; Nahon, L.; Powis, I. Vibrationally-Resolved Photoelectron Spectroscopy and Photoelectron Circular Dichroism of Bicyclic Monoterpene Enantiomers. J. Mol. Spectrosc. 2018, 353, 11–19. [Google Scholar] [CrossRef]
- Tomasino, E.; Song, M.; Fuentes, C. Odor Perception Interactions between Free Monoterpene Isomers and Wine Composition of Pinot Gris Wines. J. Agric. Food Chem. 2020, 68, 3220–3227. [Google Scholar] [CrossRef]
- Laska, M. Olfactory Discrimination Ability of Human Subjects for Ten Pairs of Enantiomers. Chem. Senses 1999, 24, 161–170. [Google Scholar] [CrossRef] [Green Version]
- Song, M.; Xia, Y.; Tomasino, E. Investigation of a Quantitative Method for the Analysis of Chiral Monoterpenes in White Wine by HS-SPME-MDGC-MS of Different Wine Matrices. Molecules 2015, 20, 7359–7378. [Google Scholar] [CrossRef] [PubMed] [Green Version]
- Katarína, F.; Katarína, M.; Katarína, Ď.; Ivan, Š.; Fedor, M. Influence of Yeast Strain on Aromatic Profile of Gewürztraminer Wine. LWT-Food Sci. Technol. 2014, 59, 256–262. [Google Scholar] [CrossRef]
- Marais, J. Terpenes in the Aroma of Grapes and Wines: A Review. S. Afr. J. Enol. Vitic. 2017, 4, 49–58. [Google Scholar] [CrossRef]
- Song, M.; Fuentes, C.; Loos, A.; Tomasino, E. Free Monoterpene Isomer Profiles of Vitis Vinifera, L. Cv. White Wines. Foods 2018, 7, 27. [Google Scholar] [CrossRef] [Green Version]
- Mateo, J.J.; Jiménez, M. Monoterpenes in Grape Juice and Wines. J. Chromatogr. A 2000, 881, 557–567. [Google Scholar] [CrossRef]
- Dziadas, M.; Jeleń, H.H. Analysis of Terpenes in White Wines Using SPE–SPME–GC/MS Approach. Anal. Chim. Acta 2010, 677, 43–49. [Google Scholar] [CrossRef]
- Rapp, A. Volatile Flavour of Wine: Correlation between Instrumental Analysis and Sensory Perception. Food/Nahrung 1998, 42, 351–363. [Google Scholar] [CrossRef]
- Katarína, F.; Bajnociová, L.; Feder, M.; Spanik, I. Investigation of volatile profile of varietal of gewürztraminer wines using two-dimensional gas chromatography. J. Agric. Nutr. Res. 2017, 56, 73–85. [Google Scholar]
- Ong, P.K.C.; Acree, T.E. Similarities in the Aroma Chemistry of Gewürztraminer Variety Wines and Lychee (Litchi chinesis Sonn.) Fruit. J. Agric. Food Chem. 1999, 47, 665–670. [Google Scholar] [CrossRef]
- Wiest, R. Apendix A A Quick Reference Guide to Varietal Wines. In A Guide to the Elite Estates of the Mosel-Saar-Ruwer Wine Region; Board and Bench Publishing: San Francisco, CA, USA, 1983. [Google Scholar]
- Guth, H. Identification of Character Impact Odorants of Different White Wine Varieties. J. Agric. Food Chem. 1997, 45, 3022–3026. [Google Scholar] [CrossRef]
- Lukić, I.; Radeka, S.; Grozaj, N.; Staver, M.; Peršurić, Đ. Changes in physico-chemical and volatile aroma compound composition of Gewürztraminer wine as a result of late and ice harvest. Food Chem. 2016, 196, 1048–1057. [Google Scholar] [CrossRef]
- Vilanova, M.; Genisheva, Z.; Graña, M.; Oliveira, J.M. Determination of Odorants in Varietal Wines from International Grape Cultivars (Vitis vinífera) Grown in NW Spain. S. Afr. J. Enol. Vitic. 2016, 34, 212–222. [Google Scholar] [CrossRef] [Green Version]
- Ruiz-García, L.; Hellín, P.; Flores, P.; Fenoll, J. Prediction of Muscat Aroma in Table Grape by Analysis of Rose Oxide. Food Chem. 2014, 154, 151–157. [Google Scholar] [CrossRef]
- Koslitz, S.; Renaud, L.; Kohler, M.; Wüst, M. Stereoselective Formation of the Varietal Aroma Compound Rose Oxide during Alcoholic Fermentation. J. Agric. Food Chem. 2008, 56, 1371–1375. [Google Scholar] [CrossRef]
- Yamamoto, T.; Matsuda, H.; Utsumi, Y.; Hagiwara, T.; Kanisawa, T. Synthesis and odor of optically active rose oxide. Tetrahedron Lett. 2002, 43, 9077–9080. [Google Scholar] [CrossRef]
- Buettner, A. Biosynthesis of Plant-Derived Odorants. In Springer Handbook of Odor; Springer: New York, NY, USA, 2017; pp. 13–33. [Google Scholar]
- Dunlevy, J.D.; Kalua, C.M.; Keyzers, R.A.; Boss, P.K. The production of flavour and aroma compounds in grape berries. In Grapevine Molecular Physiology & Biotechnology, 2nd ed.; Springer: New York, NY, USA, 2009; pp. 293–340. [Google Scholar]
- Chen, Q.; Fan, D.; Wang, G. Heteromeric geranyl(geranyl) diphosphate synthase is involved in monoterpene biosynthesis in Arabidopsis flowers. Mol. Plant 2015, 8, 1434–1437. [Google Scholar] [CrossRef] [Green Version]
- Padrayuttawat, A.; Yoshizawa, T.; Tamura, H.; Tokunaga, T. Optical isomers and odor thresholds of volatile constituents in Citrus sudachi. Food Sci. Technol. Int. Tokyo 1997, 3, 402–408. [Google Scholar] [CrossRef] [Green Version]
- Hanke, S.; Herrmann, M.; Rückerl, J.; Schönberger, C.; Back, W. Hop volatile compounds (Part II): Transfer rates of hop compounds from hop pellets to wort and beer. Brew. Sci. 2008, 61, 140–147. [Google Scholar]
- Niu, Y.; Sun, X.; Xiao, Z.; Wang, P.; Wang, R. Olfactory impact of terpene alcohol on terpenes aroma expression in Chrysanthemum essential oils. Molecules 2018, 23, 2803. [Google Scholar] [CrossRef] [Green Version]
- Takoi, K.; Koichiro, K.; Itoga, Y.; Katayama, Y.; Shimase, M.; Nakayama, Y.; Watari, J. Biotransformation of Hop-Derived Monoterpene Alcohols by Lager Yeast and Their Contribution to the Flavor of Hopped Beer. J. Agric. Food Chem. 2010, 58, 5050–5058. [Google Scholar] [CrossRef] [PubMed]
- Burdock, G.A.; Fenaroli, G. Fenaroli’s Handbook of Flavor Ingredients; Taylor & Francis Group: Milton Park, UK, 2009. [Google Scholar]
- Buettner, A. Coffee. In Springer Handbook of Odor; Springer: New York, NY, USA, 2017; pp. 107–128. [Google Scholar]
- Moreno, J.; Peinado, R. Must Aromas. In Enological Chemistry; Elsevier Science: Amsterdam, The Netherlands; New York, NY, USA, 2012; pp. 23–40. [Google Scholar]
- Sekiwa, Y.; Mizuno, Y.; Yamamoto, Y.; Kubota, K.; Kobayashi, A.; Koshino, H. Isolation of some glucosides as aroma precursors from ginger. Biosci. Biotechnol. Biochem. 1999, 63, 384–389. [Google Scholar] [CrossRef] [PubMed] [Green Version]
- Capone, D.; Barker, A.; Williamson, P.; Francis, I. The role of potent thiols in Chardonnay wine aroma. Aust. J. Grape Wine Res. 2018, 24, 38–50. [Google Scholar] [CrossRef]
- Jordán, M.J.; Goodner, K.L.; Shaw, P.E. Volatile components in tropical fruit essences: Yellow passion fruit (Passiflora edulis Sims, F. flavicarpa Degner) and banana (Musa sapientum L.). Fla. State Hortic. Soc. 2000, 113, 284–286. [Google Scholar]
- Maróstica, M.R.; Pastore, G.M. Tropical fruit flavour. In Flavours and Fragrances; Springer: Berlin/Heidelberg, Germany, 2007; pp. 189–201. [Google Scholar]
- Vieira, A.J.; Beserra, F.P.; Souza, M.C.; Totti, B.M.; Rozza, A.L. Limonene: Aroma of innovation in health and disease. Chem.-Biol. Interact. 2018, 283, 97–106. [Google Scholar] [CrossRef] [Green Version]
- Buettner, A. Fruits. In Springer Handbook of Odor; Springer: New York, NY, USA, 2017; pp. 171–190. [Google Scholar]
- Nisperos-Carriedo, M.O.; Shaw, P.E. Comparison of volatile flavor components in fresh and processed orange juices. J. Agric. Food Chem. 1990, 38, 1048–1052. [Google Scholar] [CrossRef]
- Zheng, H.; Zhang, Q.; Quan, J.; Zheng, Q.; Xi, W. Determination of sugars, organic acids, aroma components, and carotenoids in grapefruit pulps. Food Chem. 2016, 205, 112–121. [Google Scholar] [CrossRef]
- Siebert, T.E.; Barter, S.R.; de Barros Lopes, M.A.; Herderich, M.J.; Francis, I.L. Investigation of ‘stone fruit’aroma in Chardonnay, Viognier and botrytis Semillon wines. Food Chem. 2018, 256, 286–296. [Google Scholar] [CrossRef]
Figure 1.
First three dimensions of results from corresponding analysis for CATA data, (A) F1 and F2, (B) F2 and F3.
Figure 1.
First three dimensions of results from corresponding analysis for CATA data, (A) F1 and F2, (B) F2 and F3.

Figure 2.
Separation of wines models by monoterpene profile using PCA; circles represented the clusters obtained from dendrogram.
Figure 2.
Separation of wines models by monoterpene profile using PCA; circles represented the clusters obtained from dendrogram.


Table 1.
Concentrations (µg/L) of Terpenes in each treatment.
| Wines | (−) Rose Oxide | (+) Rose Oxide | Linalool | α-Terpineol |
|---|---|---|---|---|
| Model 1 a | 15 | 5 | ||
| Model 2 b | 14 | 6 | ||
| Model 3 c | 13 | 7 | ||
| Model 4 d | 12 | 8 | ||
| Model 5 e | 50 | |||
| Model 6 f | 50 | |||
| Model 7 b,g | 14 | 6 | 50 | 50 |
| Model 8 c,g | 13 | 7 | 50 | 50 |
| Model 9 b,h | 14 | 6 | 20 | 15 |
| Model 10 c,h | 13 | 7 | 20 | 15 |
| Model 11 b,i | 14 | 6 | 100 | 100 |
| Model 12 c,i | 13 | 7 | 100 | 100 |
The wine models that had rose oxide had 4 ratios: a 75:25, b 70:30, c 65:35 and d 60:40. e Just linalool, f Just α-terpineol, g Medium concentration of linalool and α-terpineol, h low concentration of linalool and α-terpineol, i high concentration of linalool and α-terpineol.
Table 2.
Standards and Images used for Descriptive Panel Training.
| Attribute | Amount per Glass | Components | Image |
|---|---|---|---|
| Honey | 1 tsp * | Clover Honey a |  |
| Honeysuckle | 1 drop | Honey suckle essential oil b |  |
| Rose | 4 drops | Rosewater concentrate c |  |
| Dried Fruit d | 1 tsp | Golden raisins mix with DI water |  |
| Stone Fruit | 1 tsp pf each | White peach e and apricot puree e |  |
| Pome | 1 tsp of each | Green apple e and Pear puree e |  |
| Melon | 1 tsp and 1 drop of each | Honeydew puree made f and melon essential oil g |  |
| Orange | 1 tsp | Orange pure made h |  |
| Grapefruit | 1 tsp | Grapefruit pure made h |  |
| Lemon | 1 tsp | Lemon pure made h |  |
| Lychee | 1 tsp | Lychee pure i |  |
| Tropical fruit | 1 tsp of each | Mango e and passion fruit puree i |  |
| Ginger | tsp | Ground ginger j |  |
tsp * = teaspoon, The components were sourced from: Hanna’s Honey (Salem, OR, USA) a, Rainbow Abby 2013 (Guangzhou, China) b, Nielsen-Massey c (Waukegan, IL, USA), the perfect purée of Napa Valley (Napa, CA, USA) e, Silver Cloud Flavors g (Belcamp, MD), Funkin pro (Arlington Rd, LDN, UK) i and Private selection j (Cincinnati, OH, USA). Purees were kept frozen at −23 °C d Dried fruit was pureed with the addition of distilled water one day before each sensory session and kept at refrigeration temperatures until analysis. f Puree was made two weeks prior sensory and kept frozen at −23 °C; the seeds and rid were removed to make the puree. h Purees were made using the whole fruit two weeks prior sensory and kept frozen at −23 °C. All purees were defrosted one day before the first training and kept in refrigeration at 4 °C between sessions.
Table 3.
Triangle Test results for the models with different Rose oxide ratios, performed by z-test (n = 65, for all tests) a.
Table 3.
Triangle Test results for the models with different Rose oxide ratios, performed by z-test (n = 65, for all tests) a.
| Comparison | Number of Participants | Number of Correct Responses | p-Value |
|---|---|---|---|
| Model 1 vs. Model 2 | 65 | 24 | 0.3156 |
| Model 1 vs. Model 3 | 65 | 25 | 0.296 |
| Model 1 vs. Model 4 | 65 | 17 | >0.5 |
| Model 2 vs. Model 3 | 65 | 37 | <0.001 *** |
| Model 2 vs. Model 4 | 65 | 21 | >0.5 |
| Model 3 vs. Model 4 | 65 | 17 | >0.5 |
a Significant difference Level: *** p < 0.001.
Table 4.
Thresholds of Rose oxide enantiomers, Linalool and α-Terpineol in different conditions.
| Components | Detection | Double DI Water [38] | Water | Beer [39] | Carbonated Water/Ethanol (5%) | Water/Ethanol (10%) |
|---|---|---|---|---|---|---|
| (−)-cis-Rose oxide | 50 [34] | - | - | - | - | - |
| (+)-cis-Rose oxide | 50 [34] | - | - | - | - | - |
| cis-Rose oxide | - | - | 0.1 [27] | - | - | 0.2 [29] |
| (−)-trans-Rose oxide | 160 [34] | - | - | - | - | - |
| (+)-trans-Rose oxide | 80 [34] | - | - | - | - | - |
| Linalool | - | (−) 0.8 (+) 0.7 | 1 [40] | 5 | 3 [41] | 15 [29] |
| α-Terpineol | 280–350 [42] | (−) 9180 (+) 6800 | 460 [37] | 2000 | 450 [41] | - |
Publisher’s Note: MDPI stays neutral with regard to jurisdictional claims in published maps and institutional affiliations. |
© 2022 by the authors. Licensee MDPI, Basel, Switzerland. This article is an open access article distributed under the terms and conditions of the Creative Commons Attribution (CC BY) license (https://creativecommons.org/licenses/by/4.0/).
Share and Cite
MDPI and ACS Style
Chigo-Hernandez, M.M.; DuBois, A.; Tomasino, E. Aroma Perception of Rose Oxide, Linalool and α-Terpineol Combinations in Gewürztraminer Wine. Fermentation 2022, 8, 30. https://doi.org/10.3390/fermentation8010030
AMA Style
Chigo-Hernandez MM, DuBois A, Tomasino E. Aroma Perception of Rose Oxide, Linalool and α-Terpineol Combinations in Gewürztraminer Wine. Fermentation. 2022; 8(1):30. https://doi.org/10.3390/fermentation8010030
Chicago/Turabian StyleChigo-Hernandez, Mildred Melina, Aubrey DuBois, and Elizabeth Tomasino. 2022. "Aroma Perception of Rose Oxide, Linalool and α-Terpineol Combinations in Gewürztraminer Wine" Fermentation 8, no. 1: 30. https://doi.org/10.3390/fermentation8010030
Note that from the first issue of 2016, this journal uses article numbers instead of page numbers. See further details here.