Next Article in Journal
Effects of Stand Structure, Browsing, and Biophysical Conditions on Regeneration Following Mountain Pine Beetle in Mixed Lodgepole Pine and Aspen Forests of the Southern Rockies
Next Article in Special Issue
Drought Influence on Forest Plantations in Zululand, South Africa, Using MODIS Time Series and Climate Data
Previous Article in Journal
Landscape Planning—Paving the Way for Effective Conservation of Forest Biodiversity and a Diverse Forestry?
Previous Article in Special Issue
Recent Drought-Induced Vitality Decline of Black Pine (Pinus nigra Arn.) in South-West Hungary—Is This Drought-Resistant Species under Threat by Climate Change?
 
 
forests-logo
Article Menu
Article

Drought Sensitiveness on Forest Growth in Peninsular Spain and the Balearic Islands

by
Marina Peña-Gallardo
1,*,
Sergio M. Vicente-Serrano
1,
J. Julio Camarero
1,
Antonio Gazol
1,
Raúl Sánchez-Salguero
2,
Fernando Domínguez-Castro
1,
Ahmed El Kenawy
1,3,
Santiago Beguería-Portugés
4,
Emilia Gutiérrez
5,
Martin De Luis
6,
Gabriel Sangüesa-Barreda
1,
Klemen Novak
6,7,
Vicente Rozas
8,
Pedro A. Tíscar
9,
Juan C. Linares
2,
Edurne Martínez del Castillo
6,
Montserrat Ribas Matamoros
5,
Ignacio García-González
10,
Fernando Silla
11,
Álvaro Camisón
12,
Mar Génova
13,
José M. Olano
8,
Luis A. Longares
6,
Andrea Hevia
14 and
J. Diego Galván
15
add Show full author list remove Hide full author list
1
Instituto Pirenaico de Ecología (IPE-CSIC), 50192 Zaragoza, Spain
2
Departamento de Sistemas Físicos, Químicos y Naturales, Universidad de Pablo de Olavide, 41013 Sevilla, Spain
3
Department of Geography, Mansoura University, 35516 Mansoura, Egypt
4
Estación Experimental Aula Dei, Consejo Superior de Investigaciones Científicas (EEAD-CSIC), 50192 Zaragoza, Spain
5
Department of Evolutionary Biology, Ecology and Environmental Sciences, Barcelona University, 08028 Barcelona, Spain
6
Departamento de Geografía y Ordenación del Territorio—IUCA, Universidad de Zaragoza, 50009 Zaragoza, Spain
7
Departamento de Ecología, Universidad de Alicante, Carretera San Vicente del Raspeig s/n, 03080 Alicante, Spain
8
Departamento de Ciencias Agroforestales, EU de Ingenierias Agrarias, iuFOR—Universidad de Valladolid, 42004 Soria, Spain
9
Centro de Capacitación y Experimentación Forestal. C/. Vadillo-Castril, 23470 Cazorla, Spain
10
Departamento de Botánica, Escola Politécnica Superior de Enxeñaría Campus Terra, Universidade de Santiago de Compostela, 27002 Lugo, Spain
11
Departamento de Biología Animal, Parasitología, Ecología, Edafología y Química Agrícola, Universidad de Salamanca, 37071 Salamanca, Spain
12
Ingeniería Forestal y del Medio Natural, Universidad de Extremadura, 10600 Plasencia, Spain
13
Departamento de Sistemas y Recursos Naturales, Universidad de Politécnica de Madrid, 28040 Madrid, Spain
14
Forest and Wood Technology Research Centre (CETEMAS), 33936 Asturias, Spain
15
Ionplus AG. Lerzenstrasse 12, 8953 Dietikon, Switzerland
*
Author to whom correspondence should be addressed.
Forests 2018, 9(9), 524; https://doi.org/10.3390/f9090524
Submission received: 23 July 2018 / Revised: 22 August 2018 / Accepted: 27 August 2018 / Published: 30 August 2018
(This article belongs to the Special Issue Remotely Sensing of Drought-Induced Forest Change and Recovery)

Abstract

:
Drought is one of the key natural hazards impacting net primary production and tree growth in forest ecosystems. Nonetheless, tree species show different responses to drought events, which make it difficult to adopt fixed tools for monitoring drought impacts under contrasting environmental and climatic conditions. In this study, we assess the response of forest growth and a satellite proxy of the net primary production (NPP) to drought in peninsular Spain and the Balearic Islands, a region characterized by complex climatological, topographical, and environmental characteristics. Herein, we employed three different indicators based on in situ measurements and satellite image-derived vegetation information (i.e., tree-ring width, maximum annual greenness, and an indicator of NPP). We used seven different climate drought indices to assess drought impacts on the tree variables analyzed. The selected drought indices include four versions of the Palmer Drought Severity Index (PDSI, Palmer Hydrological Drought Index (PHDI), Z-index, and Palmer Modified Drought Index (PMDI)) and three multi-scalar indices (Standardized Precipitation Evapotranspiration Index (SPEI), Standardized Precipitation Index (SPI), and Standardized Precipitation Drought Index (SPDI)). Our results suggest that—irrespective of drought index and tree species—tree-ring width shows a stronger response to interannual variability of drought, compared to the greenness and the NPP. In comparison to other drought indices (e.g., PDSI), and our results demonstrate that multi-scalar drought indices (e.g., SPI, SPEI) are more advantageous in monitoring drought impacts on tree-ring growth, maximum greenness, and NPP. This finding suggests that multi-scalar indices are more appropriate for monitoring and modelling forest drought in peninsular Spain and the Balearic Islands.

1. Introduction

Drought is a major hydroclimatic hazard that is difficult to quantify, analyze, monitor and, thus, mitigate [1]. This is because drought has a complex nature, given that it is the result of the synergy among a wide range of variables (e.g., precipitation, temperature, land use, human activities, etc.). Additionally, assessing the impacts of drought on natural and human environments can vary among regions and systems depending on their response and vulnerability. Furthermore, it is difficult to prevent droughts, due to their slow and less evident onset compared to other natural hazards (e.g., floods, landslides, volcanic eruptions), on one hand, and their serious and adverse socioeconomic and environmental impacts, on the other hand [2,3].
Droughts may trigger forest decay and mortality episodes [4,5], which have increased over the last decades in many regions worldwide [6,7]. The Mediterranean region has witnessed frequent and severe drought episodes, inducing important impacts to forests [8,9] given that both primary and secondary growth are constrained by water availability [10]. Some tree species and phenotypes are more sensitive to drought-triggered growth decline and damage [11,12]. Local environmental and climatic conditions can complicate further the response of forests to drought [13,14]. However, assessing forest response to drought is a challenging task, as species [15], and even individuals [16], differ in their sensitivity to this phenomenon. Moreover, spatial variability in climatic and topographic conditions adds a finer grain to drought pattern predictions.
The Iberian Peninsula (IP) is characterized by a great heterogeneity of climate types, ranging from a humid Atlantic climate in the northwest and north to semi-arid Mediterranean conditions in the east and southeast [17]. As such, the response of forests to drought incidence vary markedly over space. In this context, changing climatic conditions (e.g., abnormal low precipitation, temperature rise), mostly during the previous winter of the growing season, cause a reduction in Net Primary Production (NPP), growth decline, as well as forest die-off in some extreme cases [5,18,19,20]. In Mediterranean forests, radial growth sensitivity to drought intensity varies depending on soil moisture and precipitation, both factors being highly variable in space and time in the region. In particular, while tree growth responses at short time scales are more associated with consecutive periods of dryness and moisture conditions, responses at longer time scales are linked to less frequent, but more intense, drought events [10]. Some Mediterranean species experience a higher recovery to pre-drought growth level at short-term than at long-term timescale, either for declining or non-declining individuals [18]. Nonetheless, a general increase of crown defoliation trend has been observed in the IP over the last decades, especially in drier areas, where tree mortality is also related to dynamic changes at the trophic level as a consequence of drought impacts related to climate warming [21].
Forests are an important component of the terrestrial ecosystems dynamics, given its capital role in the hydrological and carbon cycles [22,23]. Furthermore, forests are sources for minerals, agricultural products, recreation and other benefits to mankind [4]. In this respect, Zhao et al. [24] found that drought is the leading cause of global NPP depletion. The eco-physiological impacts drought causes in vegetation are diverse [25], with some plant responses to drought stress related to stomata regulation, osmotic adjustment, and anti-oxidative defense [26]. However, reduction of photosynthesis is the ultimate impact of drought. Dramatic changes in primary metabolism lead to a decline in leaf net carbon uptake as a consequence of a decrease in water availability [27]. A prolonged reduced photosynthetic activity may lead to the decrease of molecular oxygen and the increase of reactive oxygen species inducing important damage to the photosynthetic apparatus [28]. Accordingly, the response of forests to drought has been a matter of interest in the scientific community [29,30,31]. In this context, a comprehensive assessment of the links between drought, NPP, and secondary growth among different forest ecosystems is still lacking.
Dendrochronological techniques have quantified secondary growth over time in a wealth of tree species [10,11,32,33]. Tree-rings provide short- to long-term information about annual radial growth, a proxy of carbon uptake and NPP [34]. Tree-ring width data have been used to identify the effects of drought on forest growth and vitality [20,35]. However, few dendrochronological studies have related tree-ring width data with surrogates of primary growth and NPP at consistent temporal (long) and spatial (broad coverage) scales [36]. Vegetation indices derived from satellite remote-sensing data, have proven valuable to monitor forests from local [37,38,39] to global scales [40]. The Normalized Difference Vegetation Index (NDVI) is commonly used to quantify the photosynthetic activity, which is closely related to the total biomass production and the vegetation NPP [41,42]. In the same context, a wide range of drought indices have been developed over the last decades [43,44]. These indices are well-recognized as useful tools for assessing drought under different hydrological and agricultural conditions [3,45,46,47].
The aims of this work are two-fold. First, it aims at comparing and assessing the performance of a range of drought indices for monitoring the response of vegetation activity, as summarized by tree-ring width, maximum annual greenness, and a surrogate of the NPP, to drought impacts. Second, it assesses and contrasts the response of tree-ring width and NDVI to drought conditions for different species. To accomplish this task, we linked seven widely used drought indices: Standardized Precipitation Evapotranspiration Index (SPEI), Standardized Precipitation Index (SPI), Standardized Palmer Drought Severity Index (SPDSI), and four Palmer-related drought indices (Palmer Drought Severity Index (PDSI), Palmer Hydrological Drought Index (PHDI), Palmer Z-Index (Z), and Palmer Modified Drought Index (PMDI)) with climatic, NDVI, and dendrochronological data for the IP and the Balearic Islands for the period 1981–2015. As a result we should be able to assess the validity of these drought indices to assessing and monitor the impacts of drought on forest growth and vitality [48,49,50].

2. Data and Methods

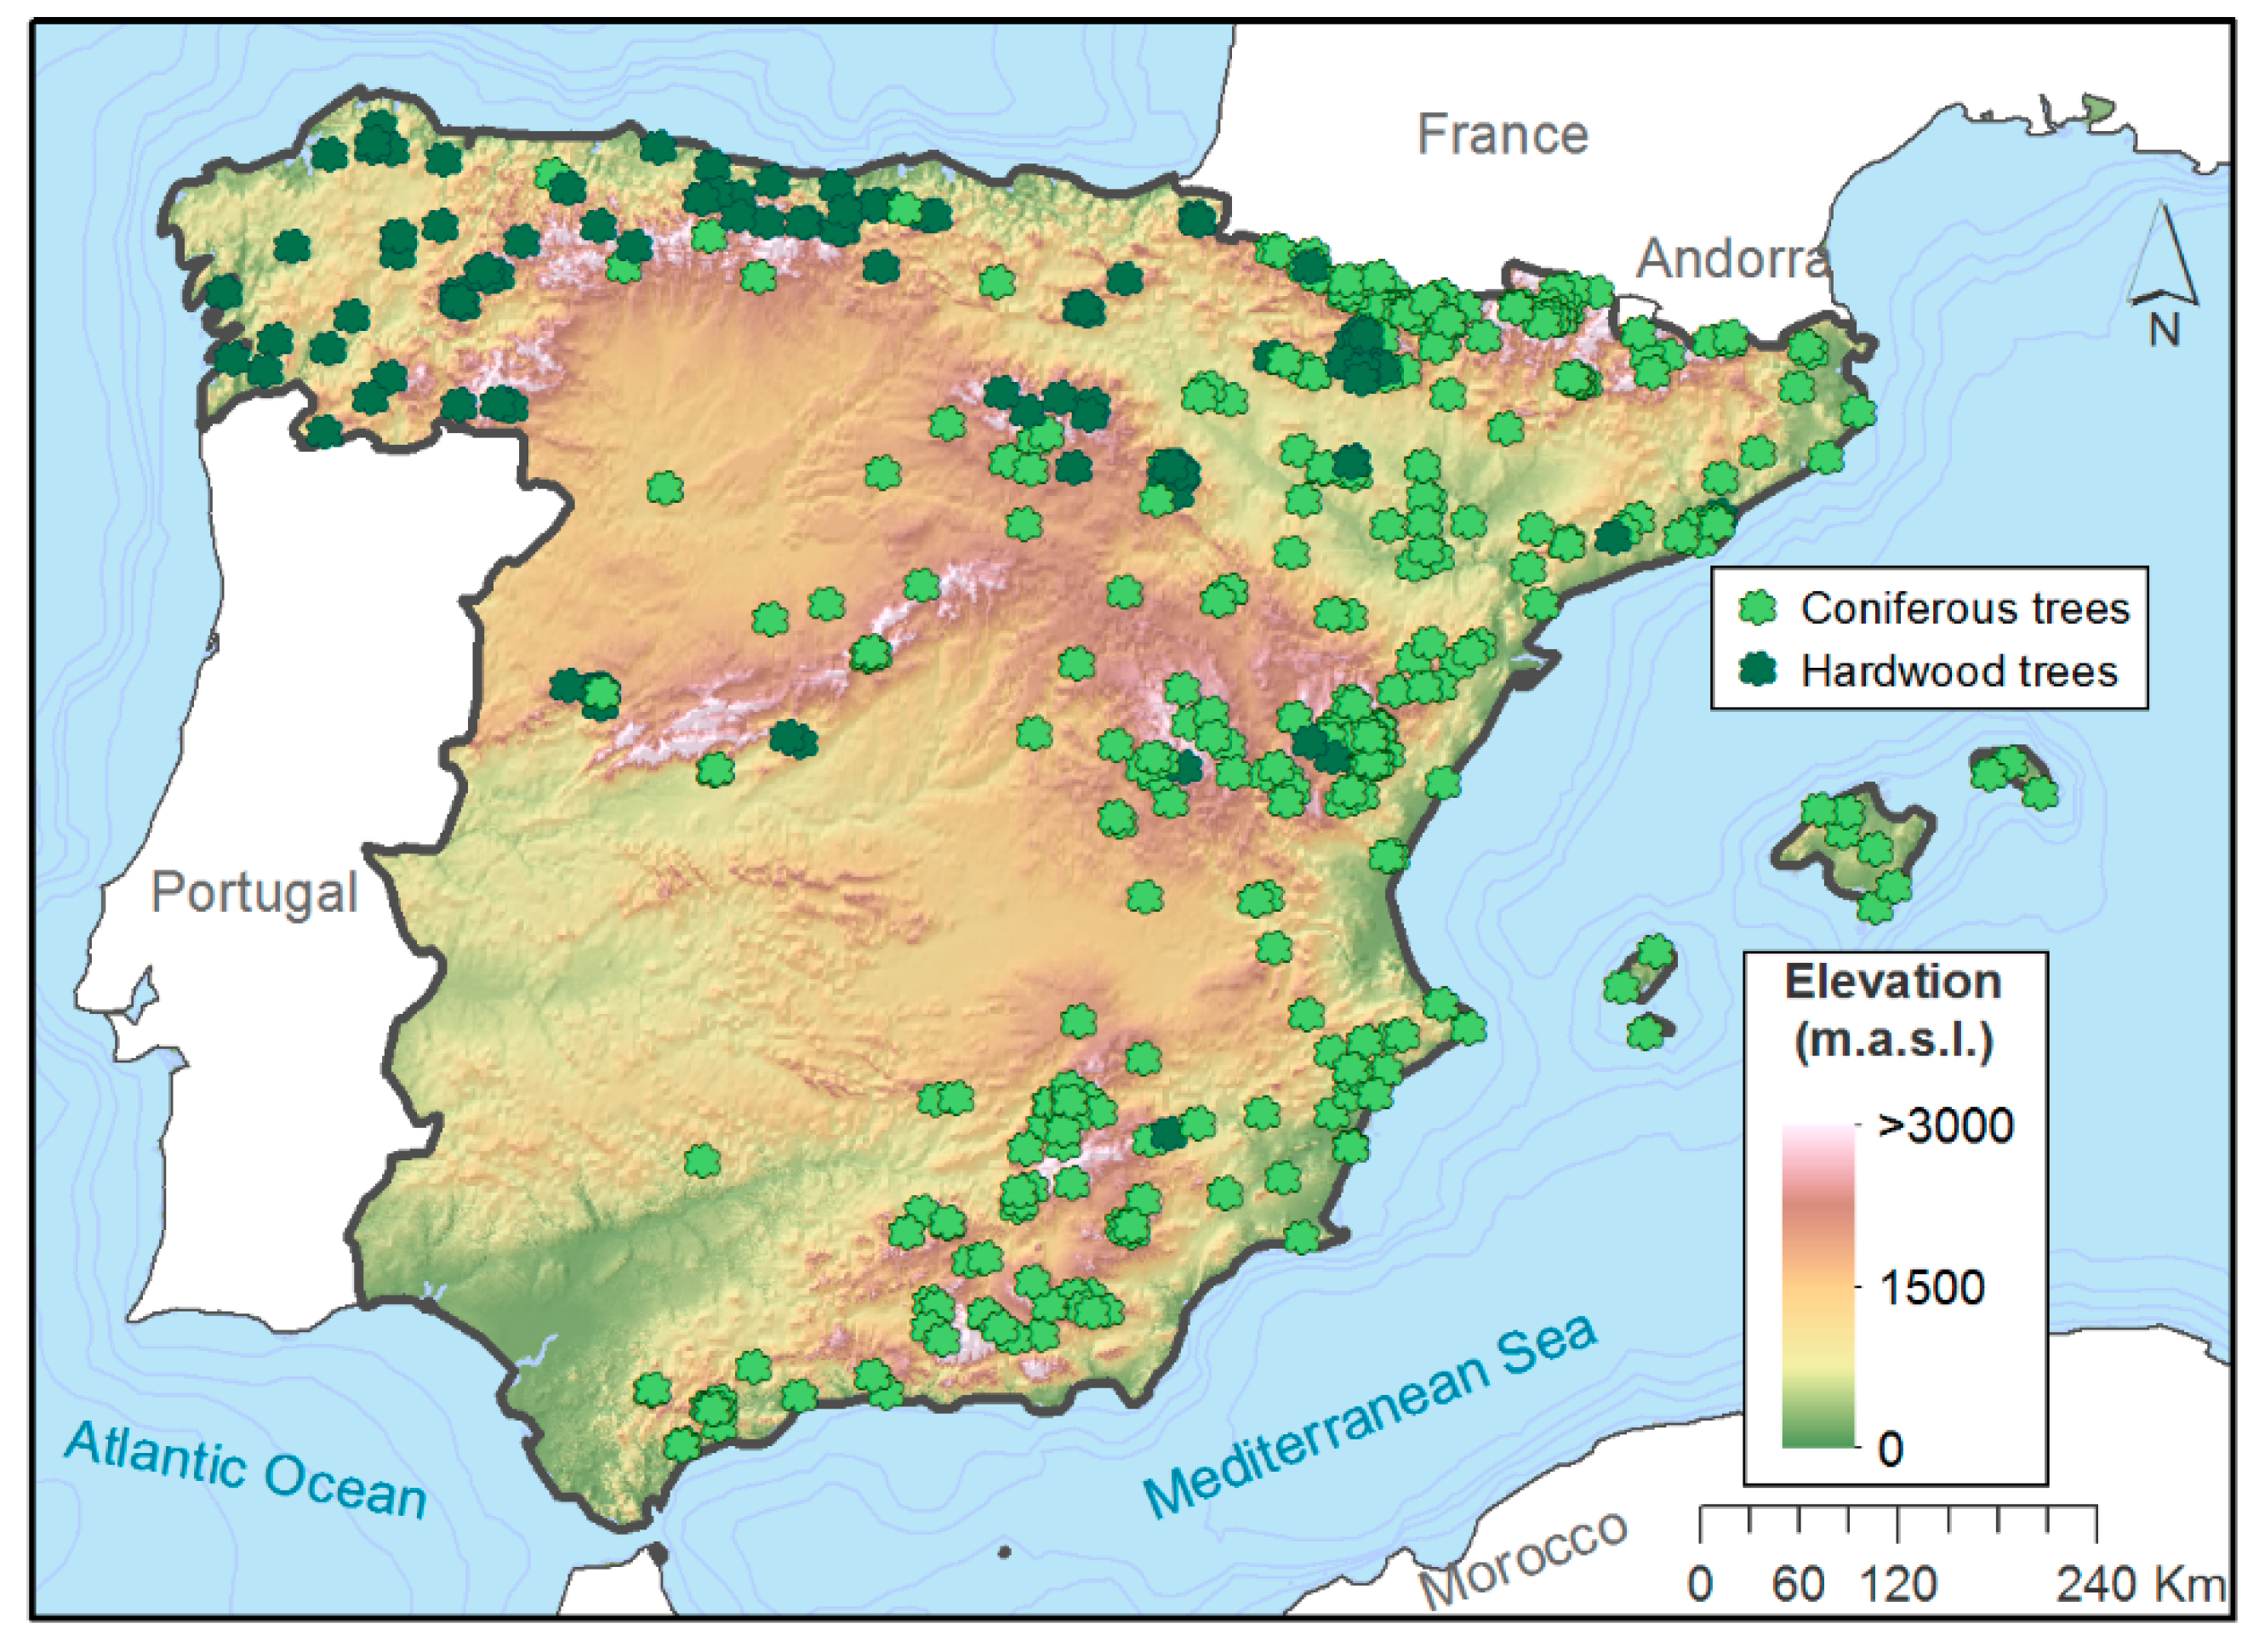
2.1. Datasets Description

We employed a daily dataset of meteorological variables (precipitation, maximum and minimum air temperatures, wind speed, sunshine duration and relative humidity) provided by the Spanish National Meteorological Agency (AEMET). The original dataset was subjected to a rigorous procedure to ensure data quality and homogeneity. Daily records were aggregated to weekly data and gridded at a 1.1 km resolution. Further details about data development are outlined in Vicente-Serrano et al. [51]. Based on the available input variables, we also calculated reference evapotranspiration (ETo) using the Penman-Monteith equation recommended by the FAO [52]. For this analysis, we aggregated the weekly gridded data at monthly scale for the period 1981–2015.

2.2. NDVI Data

The Normalized Difference Vegetation Index (NDVI) is widely-used to assess vegetation activity, with a good agreement with the photosynthetically-active radiation absorbed by vegetation [41,53]. Here, we employed NDVI data at 1.1 km resolution for the period 1981 to 2015 at a monthly time scale aggregation [54]. The original data were obtained from the National Oceanic and Atmospheric Administration (NOAA) polar orbiting satellites that used the Advanced Very High Resolution Radiometer (AVHRR) sensors to provide daily satellite images. Our selection allowed to characterize vegetation activity with more detailed spatial coverage and finer temporal resolution than other publicly available data sets such as the Global Inventory Monitoring and Mapping Studies (GIMMS) and the Moderate-Resolution Imaging Spectroradiometer (MODIS) [41,51,52]. In order to obtain the final NDVI product, the original data were subjected to a series of data processing, including radiometric calibration [55,56], geometric and topographic corrections [57,58], cloud cover removal [59] to obtain semi-monthly composite images by maximum NDVI value (two images per month) [60]. A comprehensive explanation of this procedure is found in Vicente-Serrano et al. [54].

2.3. Tree-Ring Width Data

We compiled annual tree-ring width chronologies of 568 forest stands covering the majority of forest areas across the IP and the Balearic Islands from 1981 to 2015 (Figure 1). Chronologies were obtained using the basic dendrochronological protocol [34]. At least 10 dominant or codominant trees located in undisturbed stands were selected and cored at 1.3 m using increment borers to obtain 2–3 cores per tree in each forest. The selected study sites represent a wide sample of conifers and hardwood species subjected to different climatic and edaphic conditions along the Spanish territory. Latitude, longitude, and mean elevation were recorded at each sample. Wood samples were air-dried and sanded until rings were clearly visible and then visually cross-dated. Tree-ring width was measured to at least the nearest 0.01 mm using binocular microscopes and measuring device systems (Lintab, RinnTech, Heidelberg, Germany; Velmex Inc., Bloomfirld, NY, USA). In order to check the accuracy of visual cross-dating and measurements, we used the COFECHA program, based on moving correlations between each individual tree-ring series and the mean site series [61]. Additionally, to remove the trends in tree-ring width due to tree aging and the enlargement of the stem, we used traditional dendrochronological protocols [34]. Specifically, we detrended each individual tree-ring width series by fitting negative exponential curves and then obtained the residuals through dividing the observed values by the fitted ones. Then, we averaged the detrended series of tree-ring width indices (hereafter TRWi) for each forest by computing bi-weight robust means. The mean site-level chronology represents the average growth series of a variable number of trees of the same species growing at the same forest stand. Since no autoregressive modelling was performed, we removed the low- to mid-frequency variability, while keeping the high-frequency variability and the first-order autocorrelation. The procedure of chronology building was implemented using the ‘dplR’ package within the R platform [62]. Table 1 summarizes the main characteristics of the tree species used in this study.

2.4. Drought Indices

We computed the seven drought indices based on the monthly climate data for each location to each sampled forest stand as the time of response to drought indices is not known beforehand, described as follows.

2.4.1. Palmer Drought Severity Indices (PDSIs)

The Palmer Drought Severity Index (PDSI) is a well-known meteorological drought index proposed by Palmer [63] along with the Palmer Hydrological Drought Index (PHDI), the Palmer Moisture Anomaly Index (Z-index), and the Palmer Modified Drought Index (PMDI). While Palmer indices account for supply-demand relationship of soil moisture using precipitation and air temperature data, our preference was to use a modification of the original methodology to limit the possible impact of lack of comparability between differentiated regions [64,65,66]. This issue was solved by Wells et al. [62] who employed the self-calibrated Palmer indices algorithm, which automatically determines the appropriate and spatially-comparable regional coefficients. Hereafter, we will use the original acronyms to refer to the self-calibrated versions of Palmer drought indices. As opposed to multiscalar drought indices (e.g., SPI, SPEI, SPDI), PDSIs are uni-scalar.

2.4.2. Standardized Precipitation Index (SPI)

The Standardized Precipitation Index (SPI) was developed by McKee et al. [67]. The SPI introduced for the very first time a new functional definition of drought based on the standardized precipitation and time scales to quantify precipitation shortages along time. The index is based on the conversion of the precipitation series using an incomplete Gamma distribution to a standard normal variable with the mean equal to zero and variance equal to one. The SPI is the universal reference meteorological index according to the World Meteorological Organization [68].

2.4.3. Standardized Precipitation Evapotranspiration Index (SPEI)

The Standardized Precipitation Evapotranspiration Index (SPEI) was proposed by Vicente-Serrano et al. [69], accounting for the possible impact of reference evapotranspiration on drought. In particular, the SPEI is based on the computation of monthly climate water balances (precipitation minus reference evapotranspiration) accumulated at different timescales. The resulting values are later transformed to a normal standardized variable using a three-parameter log-logistic distribution, allowing for direct comparison over space. The SPEI has been widely used in multiple drought-related studies, with a main focus on evaluation of drought impacts, recurrence, variability, or reconstruction.

2.4.4. Standardized Precipitation Drought Index (SPDI)

The Standardized Precipitation Drought Index (SPDI) was introduced by Ma et al. [70]. It is defined as a combination of the PDSI and SPI. It also implements the timescale concept and the statistical nature of the SPI and SPEI [71] as well as the water balance concept defined by Palmer [64]. For its calculation, the SPDI-accumulated values are transformed to a standard normal variable using a generalized extreme value distribution.
Herein, the multi-scalar indices (i.e., SPEI, SPI and SPDI) were calculated at 1- to 12-, 18-, and 24-timescale. It is noteworthy emphasizing that the monthly drought indices, for each sampled tree, were detrended by fitting a linear regression with the time series. This procedure removes any possible trend that can disturb the comparison among drought and tree-ring growth, given that tree-ring series were already detrended. Finally, the residual of each series was obtained from linear models, and summed to the average of the period to obtain the detrended drought indices.

2.5. Statistical Methods

We assessed the response of vegetation activity to the interannual variations of drought for the common period of time 1981–2015. To achieve the mentioned purpose, three indicators were considered: TRWi, maximum annual NDVI value (NDVI max) and annual integrated NDVI. The NDVI max was obtained from the biweekly series of the NDVI, providing information on the maximum potential vegetation activity in each sampled forest stand. As such, it is considered a reliable indicator of the annual vegetation growth [72]. In this work, the annual cumulative NDVI (NDVI annual) is used as a surrogate of NPP. This is simply because the NPP, defined as the net carbon accumulated by plants per unit and time [73], is closely related to the amount of photosynthetically active radiation (PAR) captured by green foliage. Thus, the NPP depends on the fraction of photosynthetically active radiation (FPAR) absorbed by the canopy [74].
We computed the Pearson correlation coefficient between the TRWi, NDVI max, and NDVI annual and each drought index for the common period 1981–2015. To keep consistency among all variables, we also detrended the NDVI variables. Since the response of vegetation to drought is expected to vary at different time scales [40], and the month when the vegetation is most susceptible to drought is not known a priori, we correlated the 12 monthly series of each drought index with the annual series of TRWi, NDVI max, and NDVI annual and kept the maximum correlation value for analyzing spatial and temporal responses of tree variables to drought and the relationship between vegetation variables and drought by species. We calculated the indices at 1- to 12-, 18-, and 24-month time-scales for the multi-scalar indices (SPEI, SPI, and SPDI). This procedure resulted in 168 correlation values (12 correlations for each time-scale) for the multi-scalar indices and 12 correlations for the uni-scalar indices. We also calculated the climatic water balance as the difference between precipitation and evapotranspiration (P—ETo) at each sampled forest stand.

3. Results

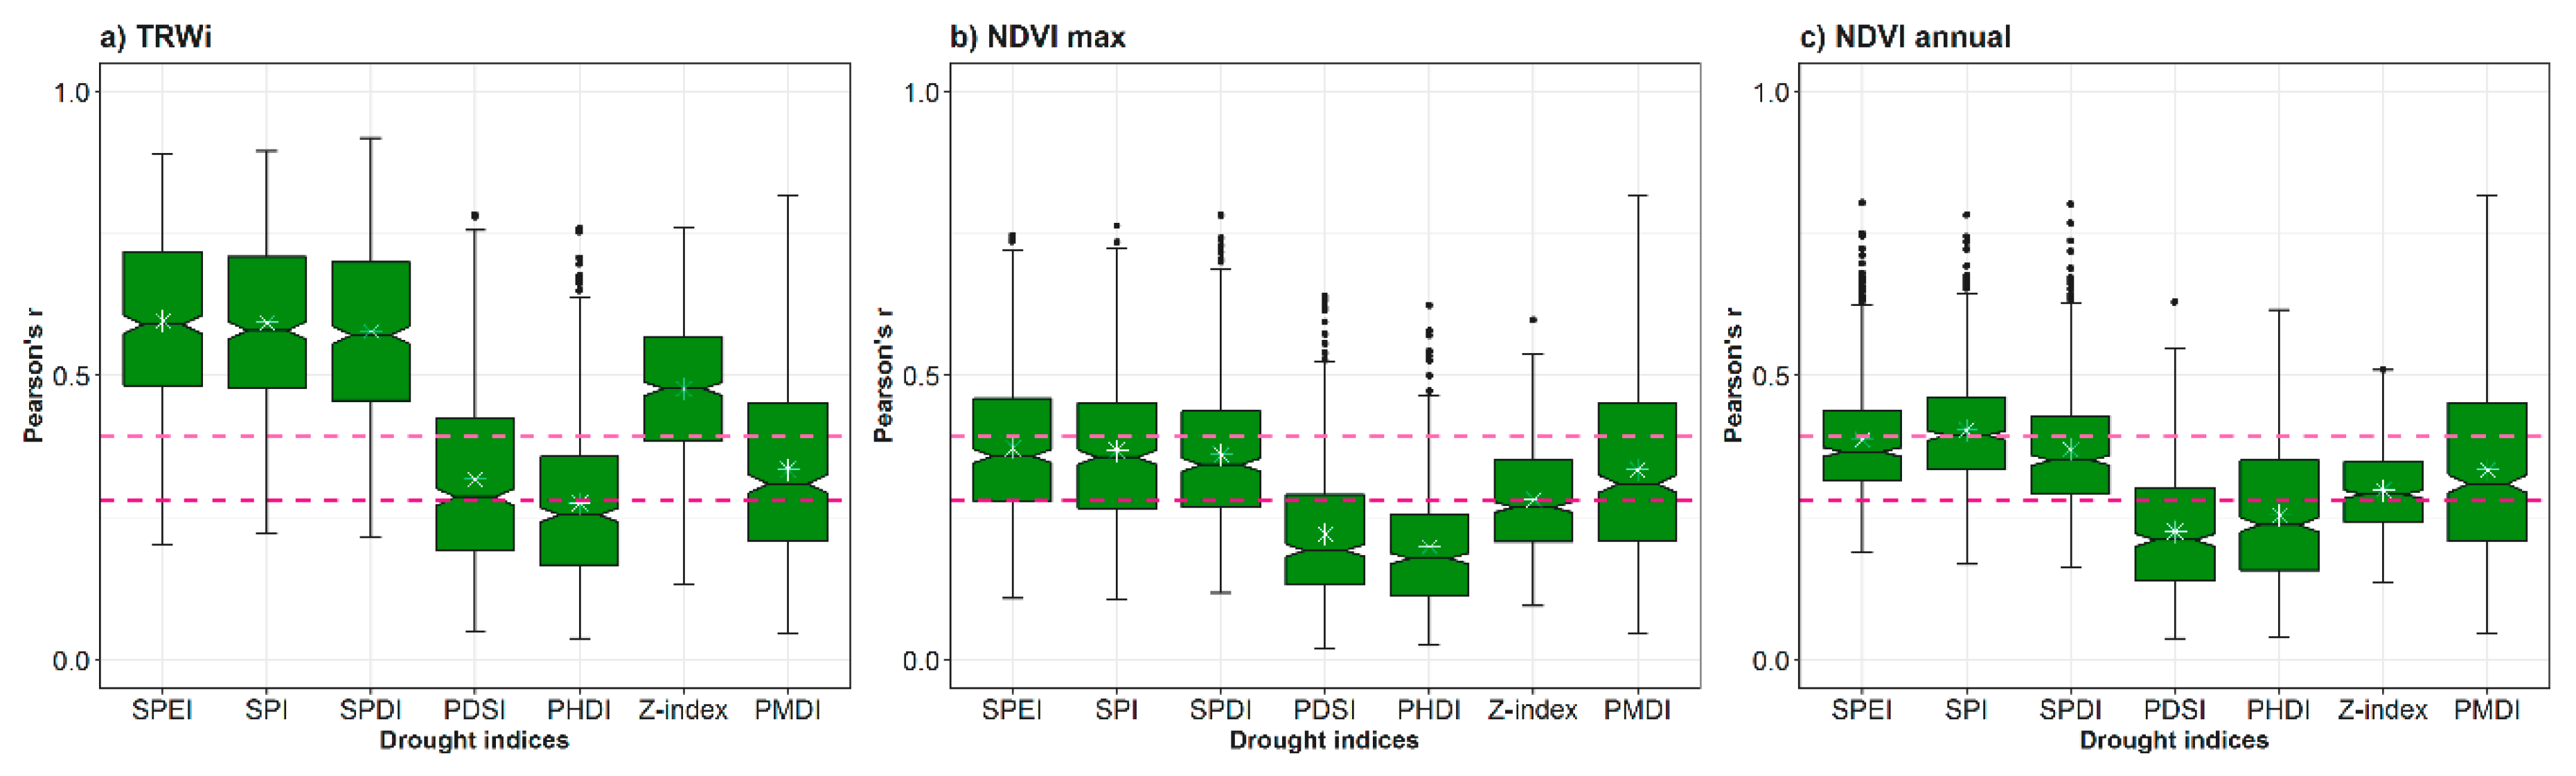
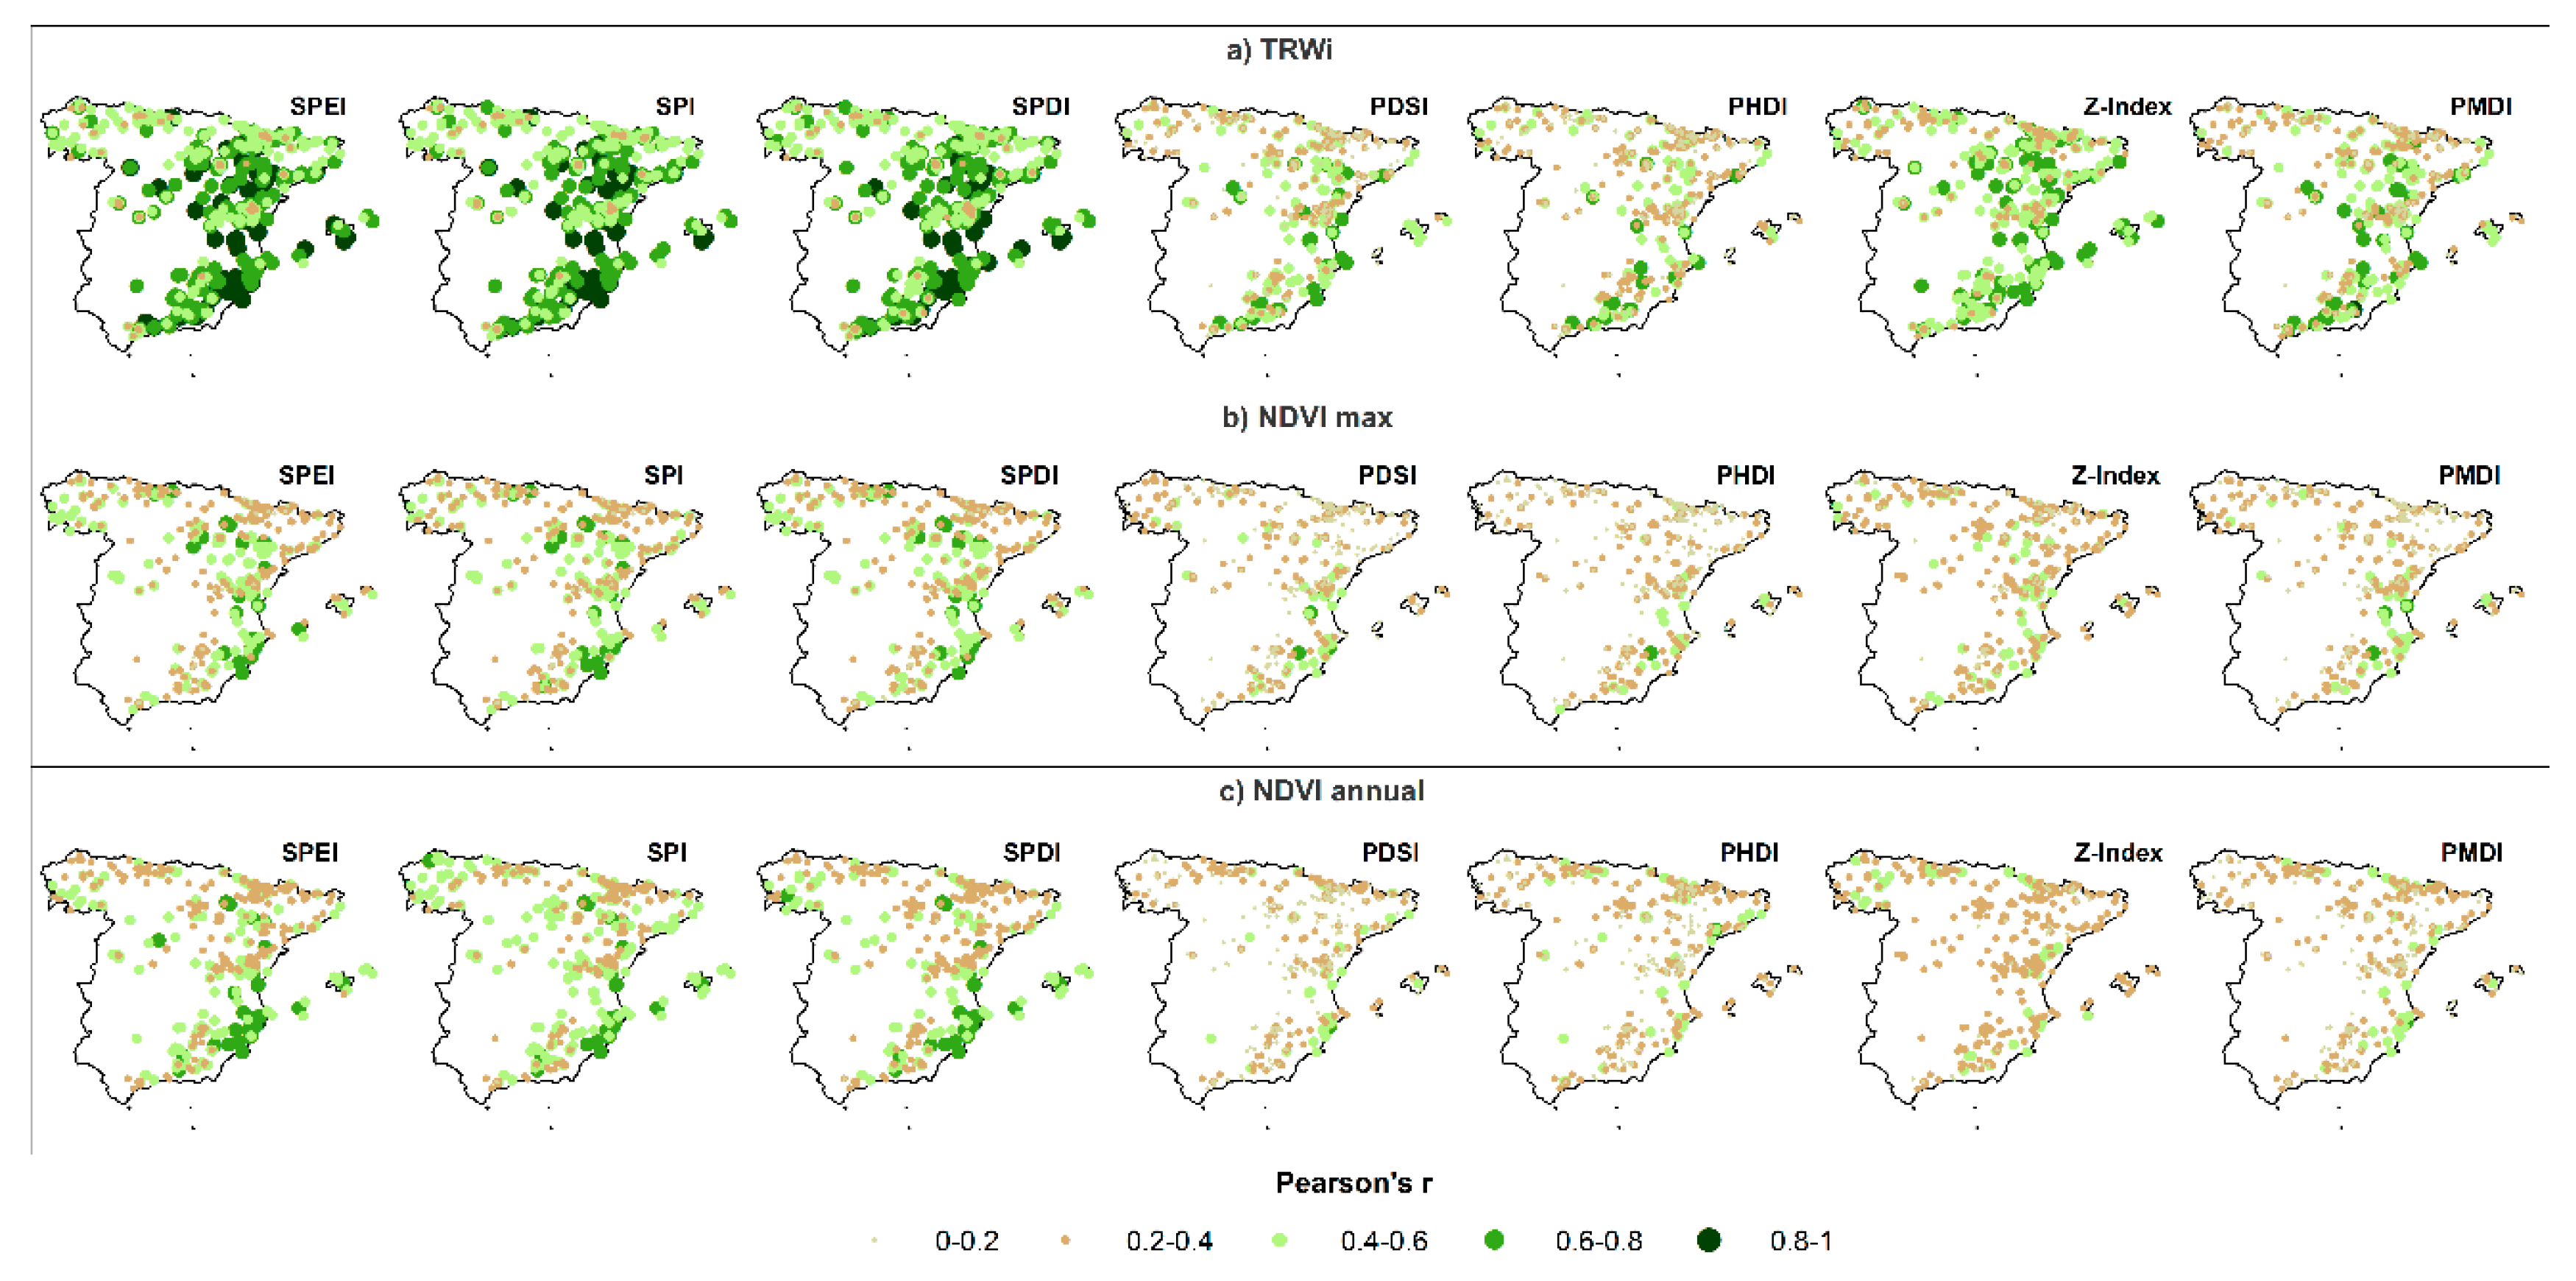
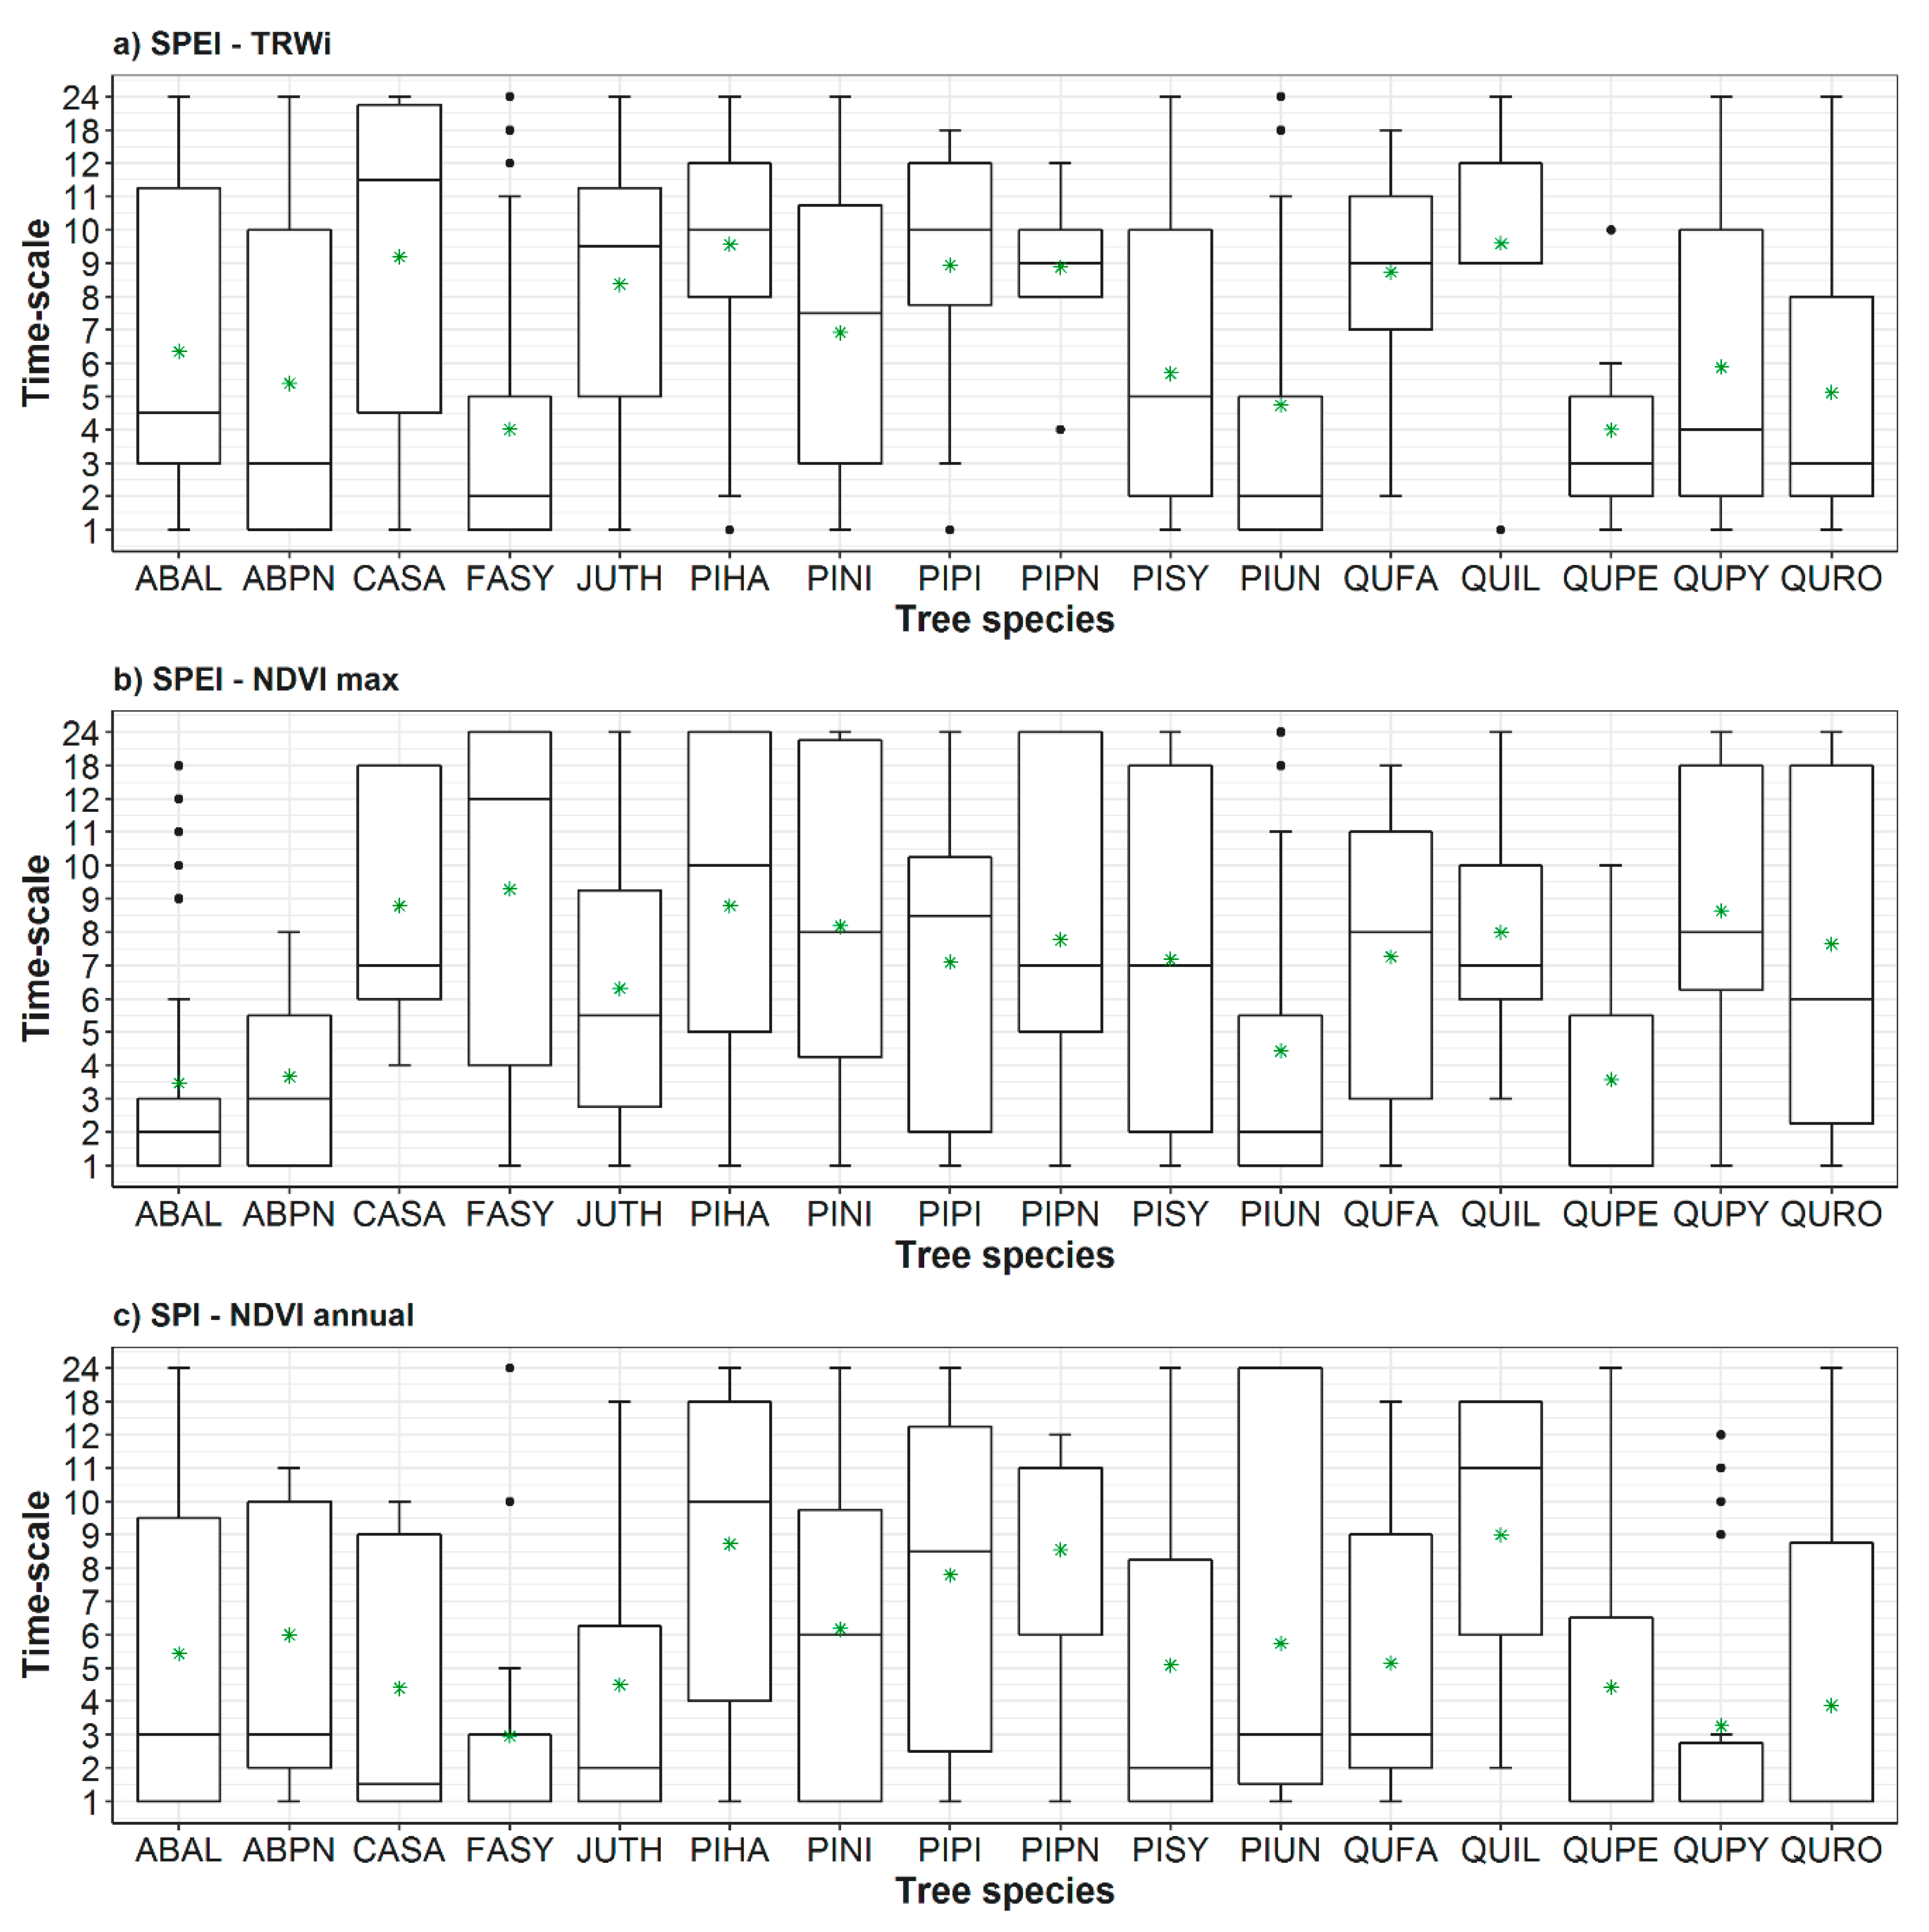
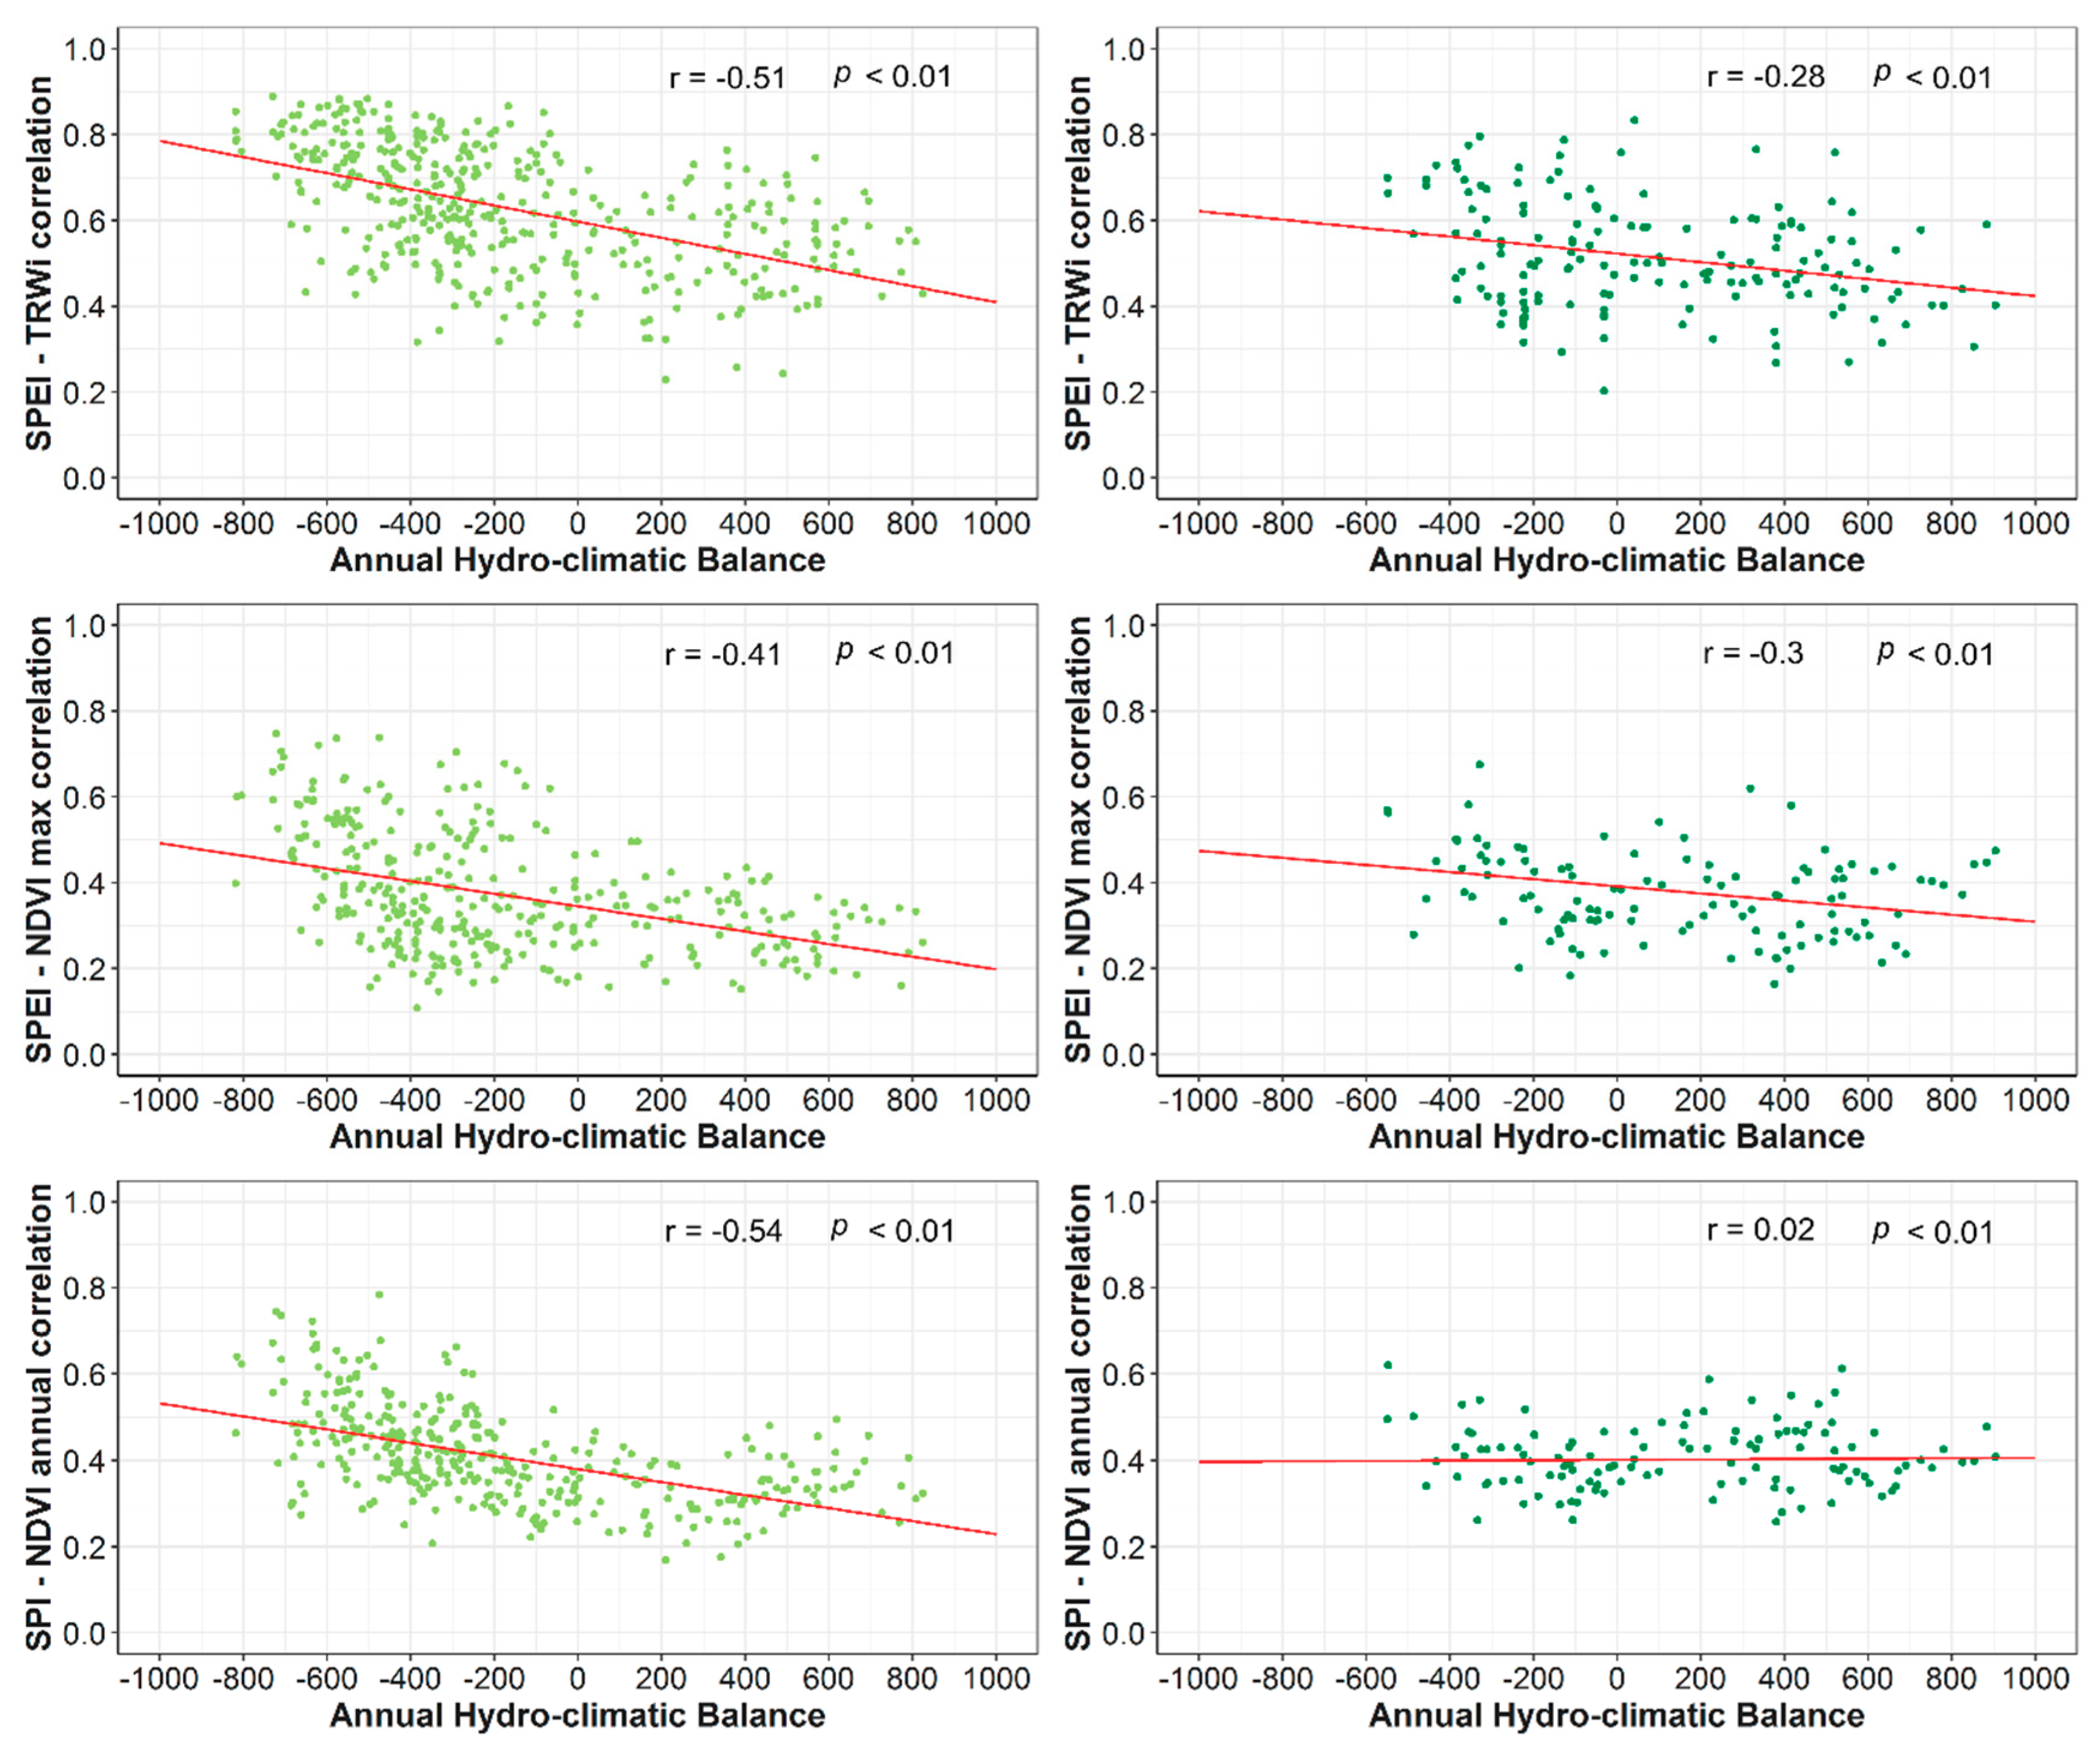
3.1. Spatial and Temporal Responses of Tree Variables to Drought

The magnitude of maximum Pearson correlations found between each of the selected drought indices and the three tree variables (TRWi, NDVI max, and NDVI annual) varied considerably between the two main groups of drought indices: multi-scalar vs. uni-scalar (Figure 2). In general, multi-scalar indices had higher correlations than for uni-scalar indices. Remarkably, TRWi had higher correlations with drought indices than NDVI max and NDVI annual. This pattern was evident for all drought indices (Figure 2). Correlation values averaged 0.60 for TRWi, and 0.45 and 0.40 for NDVI annual and NDVI max, respectively. Among the uni-scalar drought indices, the Z-index showed the highest correlations, particularly with TRWi, although a high percentage of correlations for the four Palmer indices was statistically non-significant. Among multiscalar indices, SPEI showed the highest correlations with TRWi and NDVI max, while the SPI correlated better with the NDVI annual (Table 2).
The spatial distribution of maximum Pearson correlations between the seven drought indices and vegetation variables in each sampled forest stand is shown in Figure 3. The three multi-scalar drought indices showed similar spatial patterns, with higher values (r = 0.6–1.0) in forests located mostly in dry areas of Eastern Spain and the Balearic Islands (Figure 3). In contrast, correlations were lower in Northern Spain, where wet conditions prevail and hardwood forests dominate. The highest correlation values for the Palmer drought indices showed spatial patterns similar to those of the multi-scalar indices, albeit with lower magnitudes of correlation. Among the uni-scalar indices, Z-index and TRWi showed the highest correlations followed by PMDI and TRWi, with values ranging between 0.4 and 0.6. In contrast, PDSI and PHDI had the lowest correlations. The differences between PMDI–Z-index and PDSI–PHDI results were less evident for other variables (i.e., NDVI max and NDVI annual), with low (r = 0.2–0.4) and spatially homogeneous correlations. Similar results are found for the magnitude and the distribution of the maximum correlations for the NDVI max and NDVI annual. Regarding the SPI, higher correlations (r = 0.4–0.6) are found in Northwestern Spain for NDVI annual. The correlations between the SPEI/SPDI and NDVI annual tend to be higher in Southeast Spain than for NDVI max. Additionally, we noted that there are no clear spatial differences in the correlations found between the Palmer drought indices and NDVI max and NDVI annual.
In general, it is evident that TRWi shows a higher response to the interannual variability of drought than the NDVI max and NDVI annual. Figure 4 shows the relationship between the maximum correlations obtained relating TRWi and drought indices and those obtained for the NDVI annual and NDVI max. It can be noted that maximum correlations are much higher considering TRWi than NDVI metrics. Moreover, there are no clear relationships between the spatial patterns of the correlations. In particular, the highest correlations between drought indices and TRWi did not imply the highest correlations with NDVi metrics. The highest percentages of maximum correlations between TRWi and multi-scalar drought indices were in July (43.08%) and August (40.69%) (Table S1). SPEI correlated better with TRWi in July (17.09%), while the SPI and SPDI showed better association with TRWi in August (15.9% and 12.65%, respectively). In contrast, NDVI max showed highest percentage of maximum correlations in April (63.16%) and May (32.99%); the three drought indices also correlated most in April, with very similar percentages (SPEI: 21.28%, SPI: 21.11% and SPDI: 20.77%). For NDVI annual, the majority of forests showed their best correlations in May (90.94%), particularly for the SPEI (37.61%), the SPI (32.48%), and the SPDI (20.85%). Thus, two distinct temporal patterns could be observed depending on the analyzed parameter, whereas secondary growth response to drought severity reached a maximum in July and August, annual vegetation growth (NDVI max) and NPP (NDVI annual) showed a much earlier response to drought in springtime (April and May).

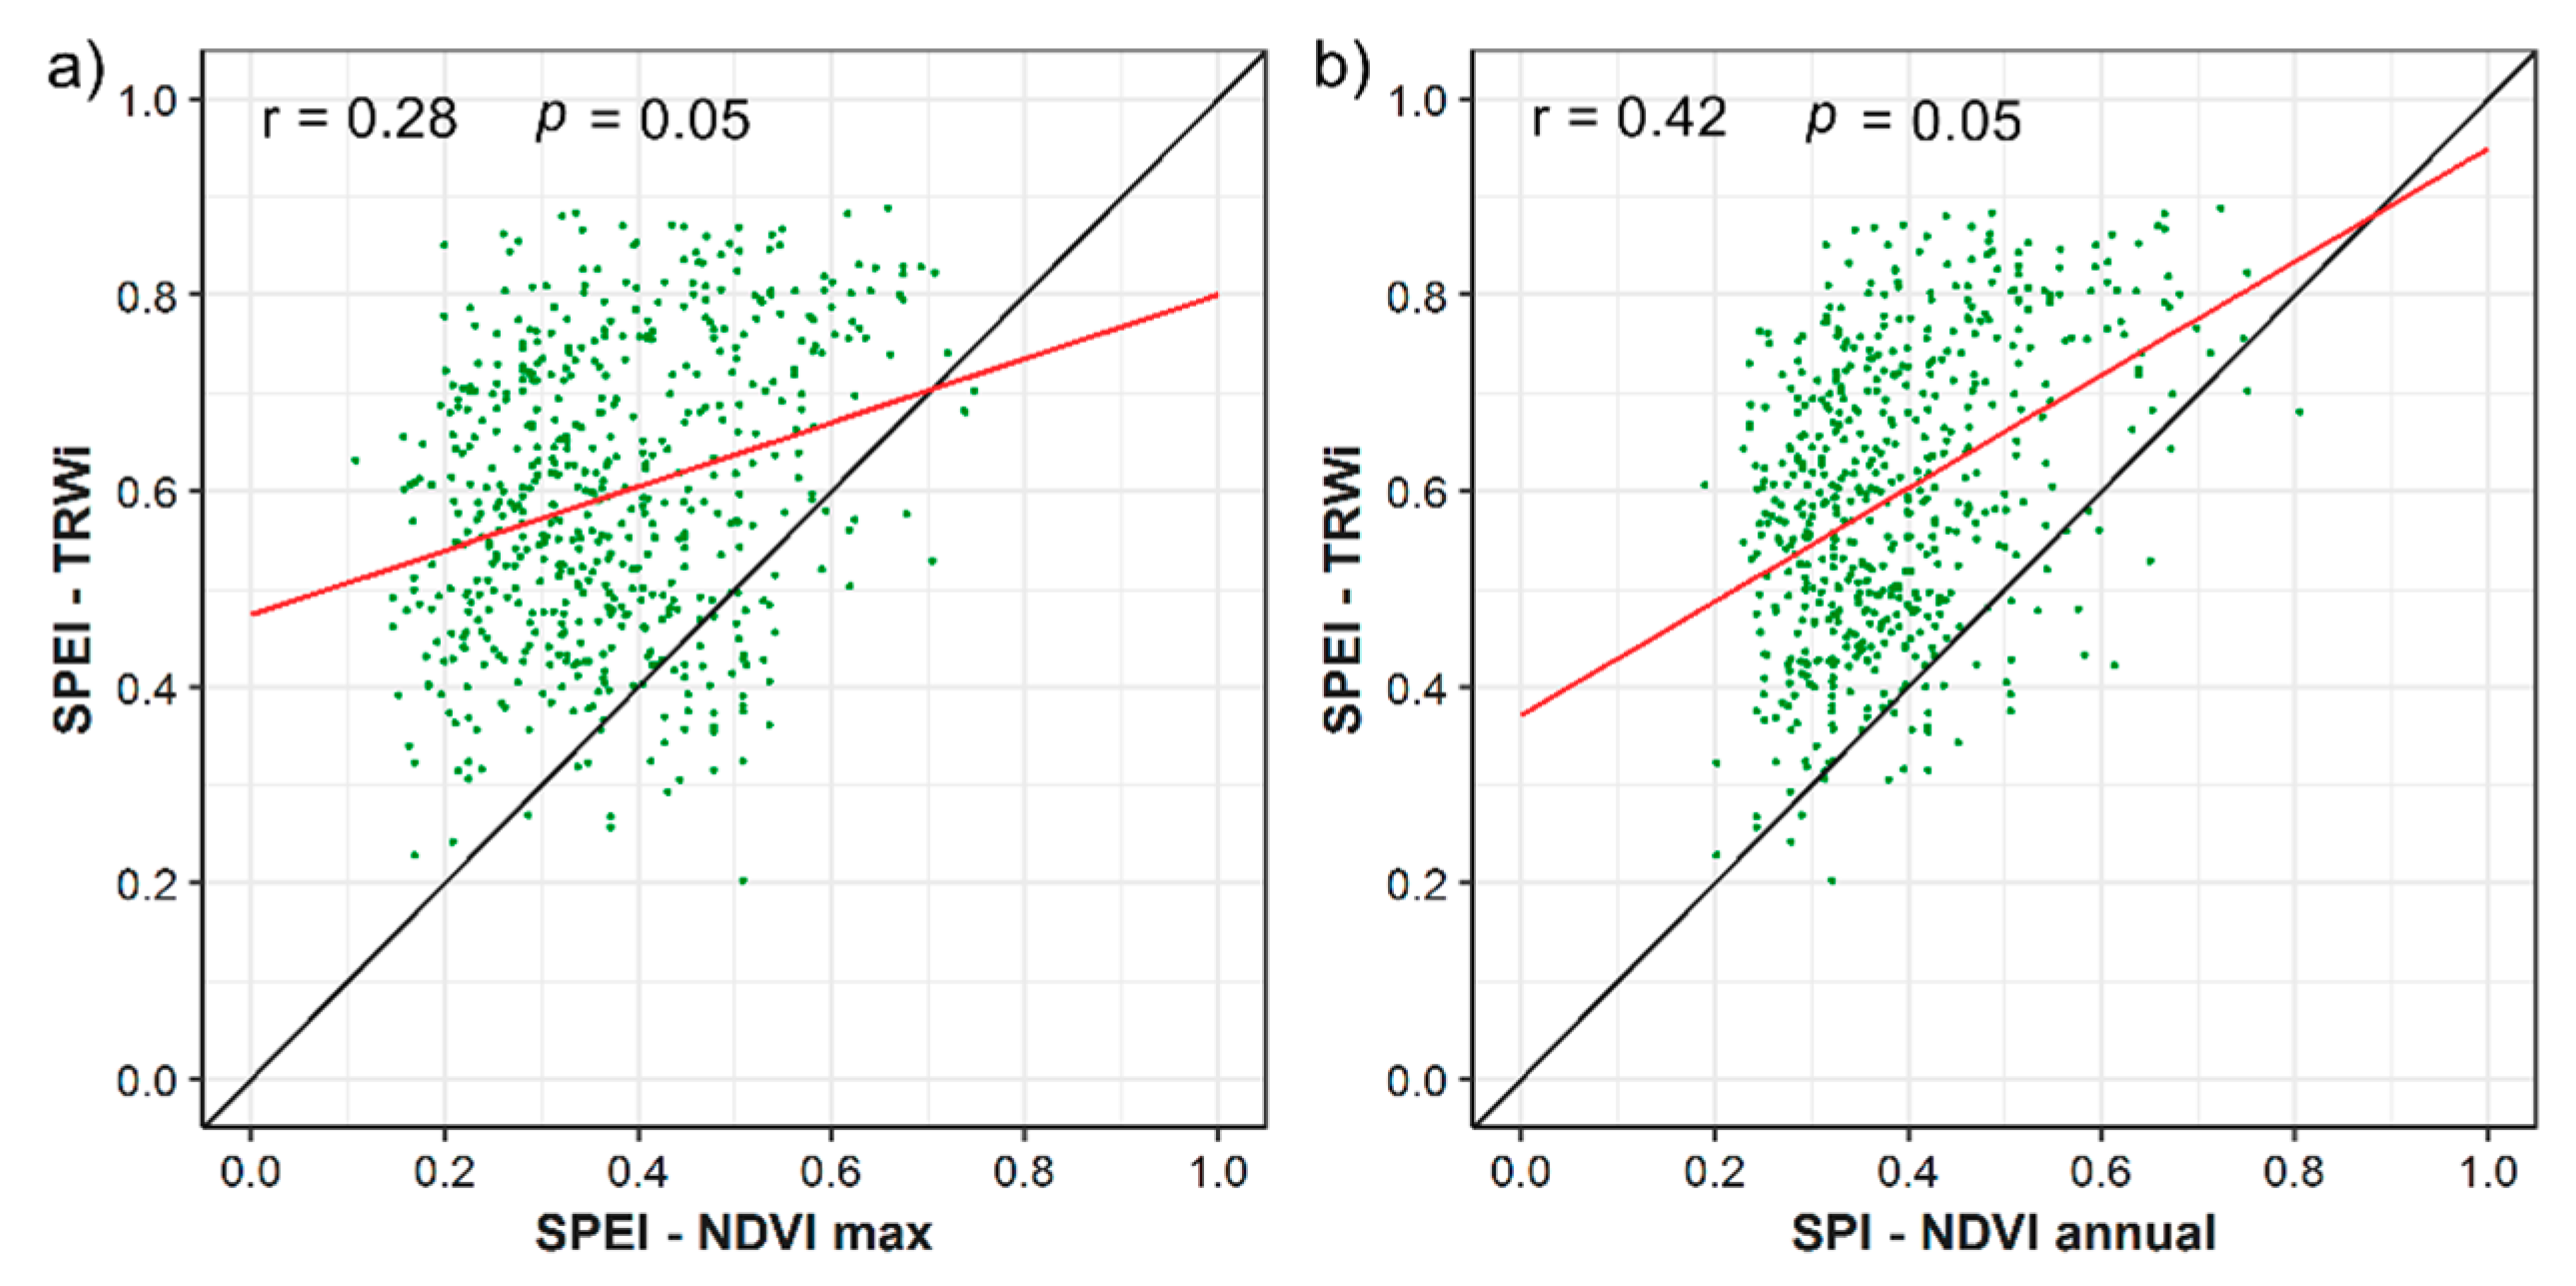
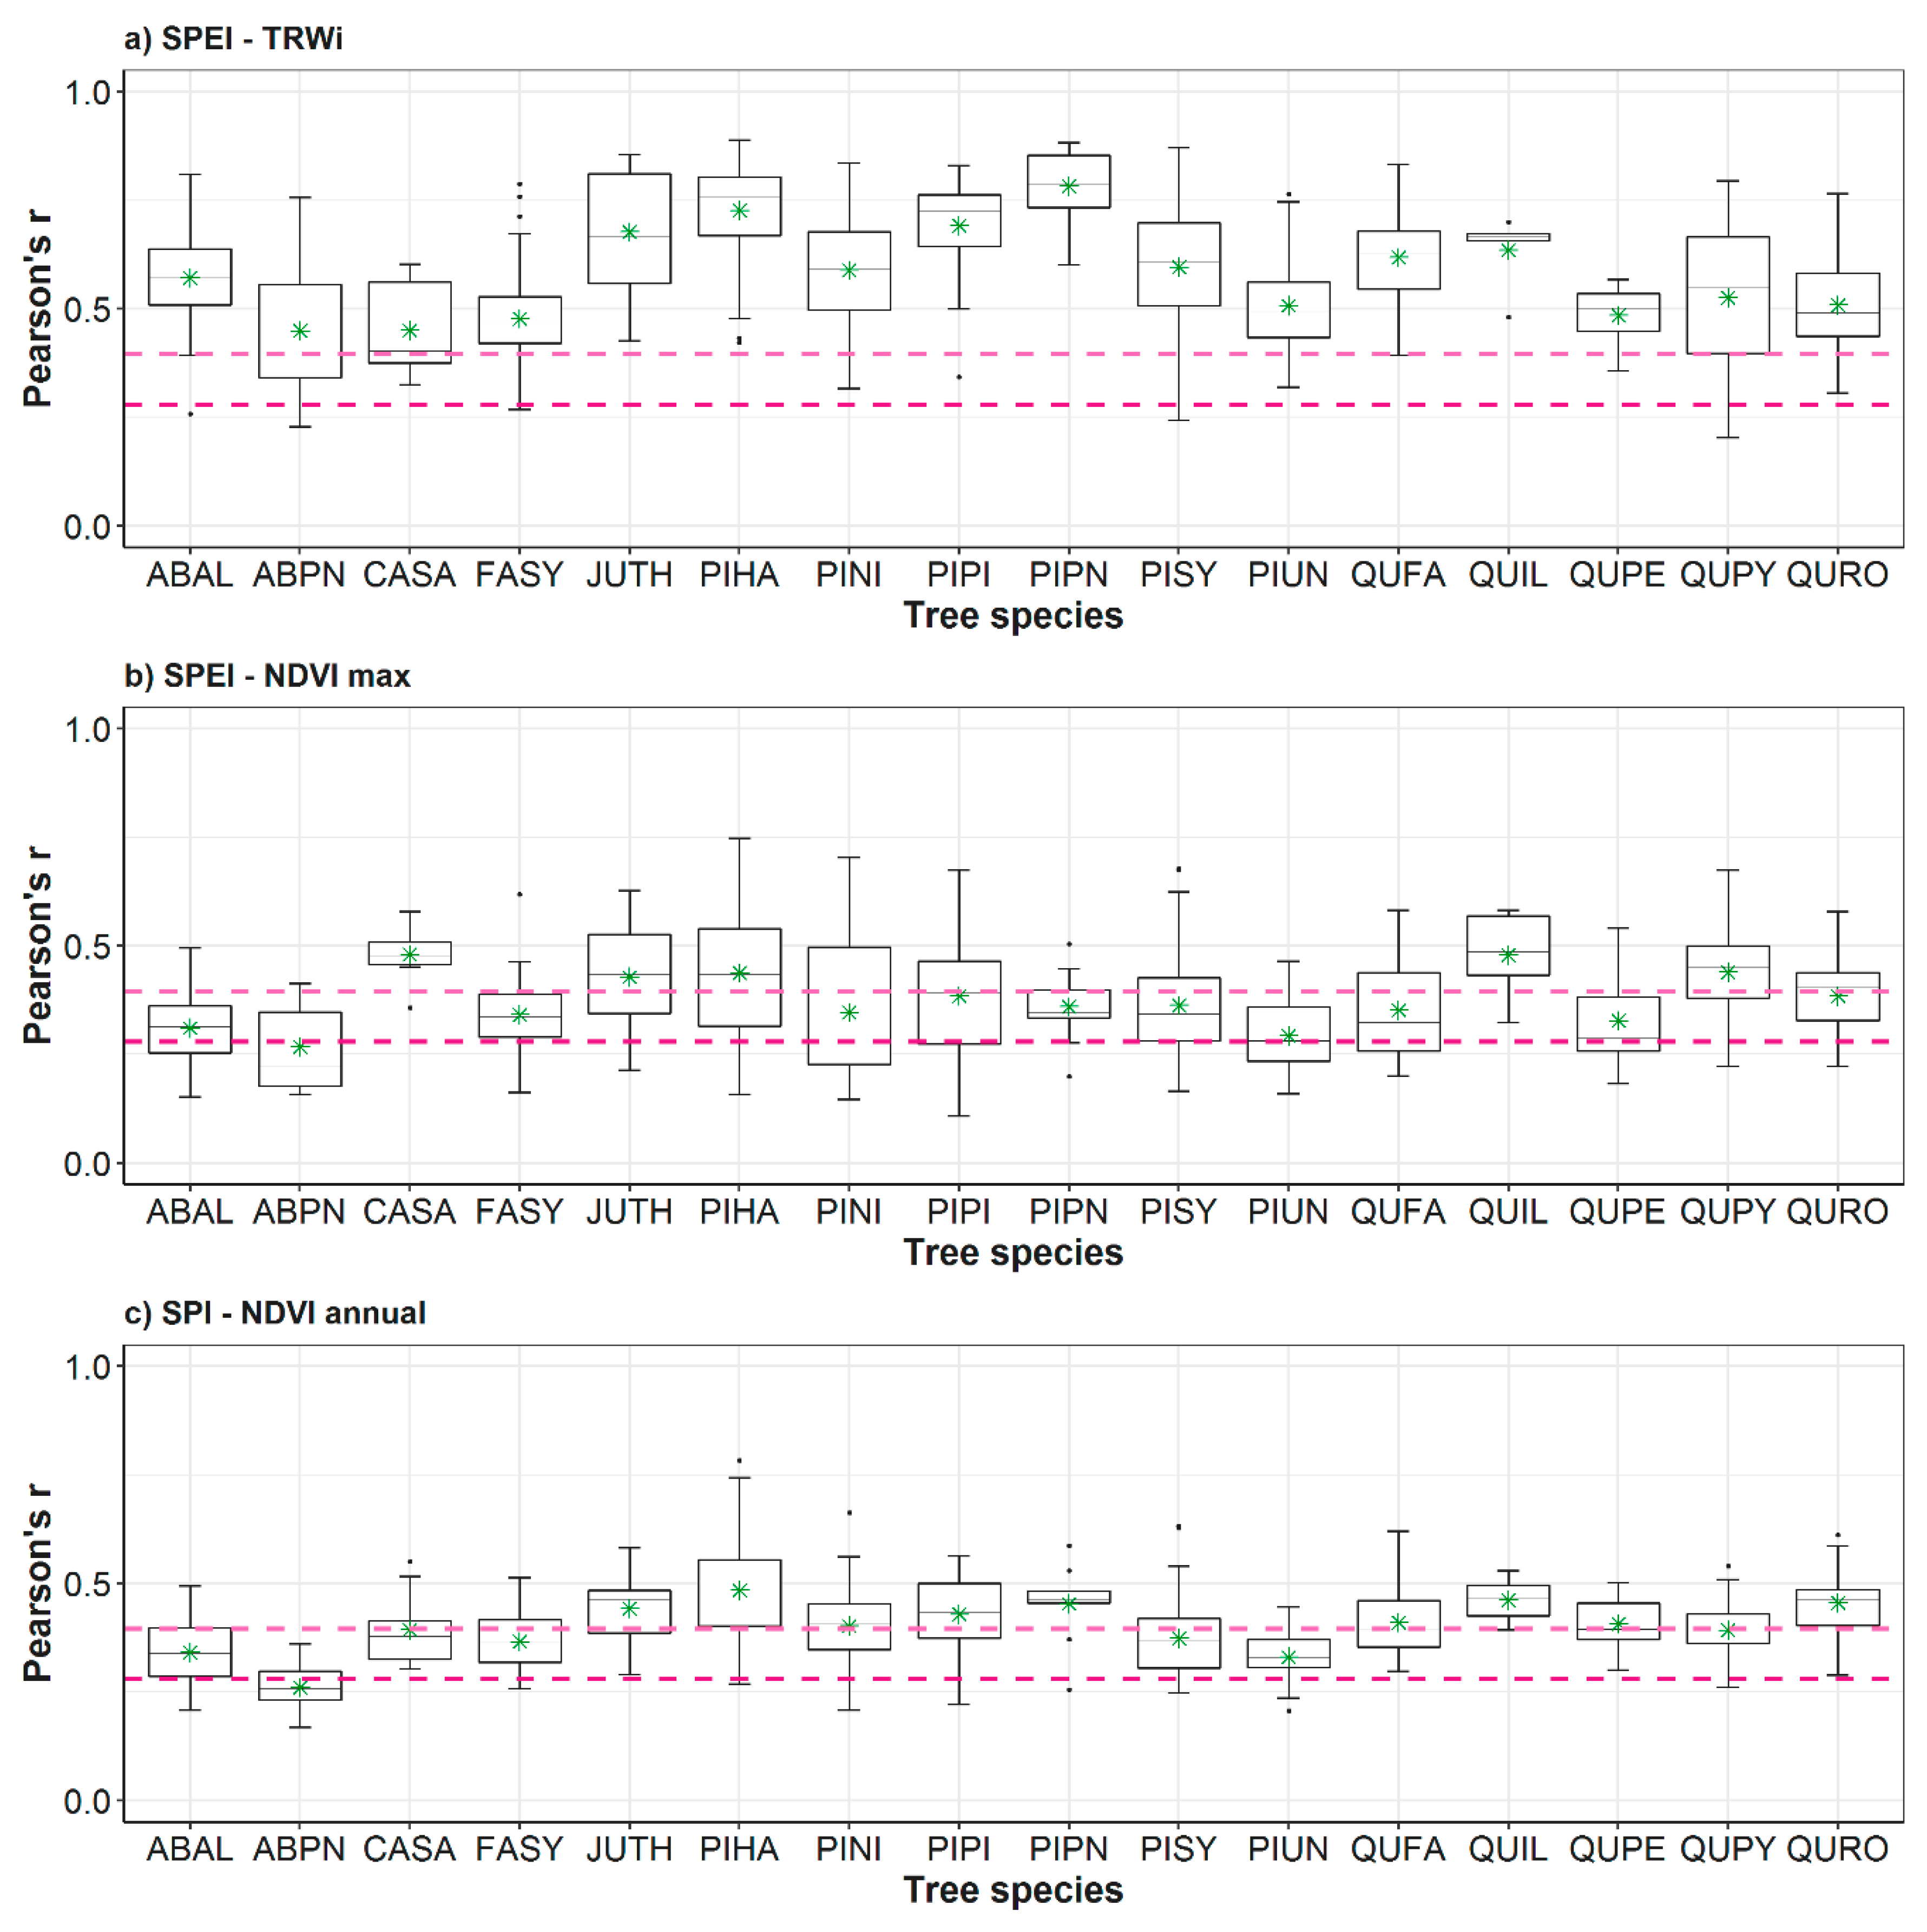
3.2. Relationship between Vegetation Variables and Drought by Species

Among tree species, there are no clear differences in the correlations between the multi-scalar drought indices and NDVI annual and NDVI max (Figure 5). In contrast, the correlations with TRWi show higher variability amongst tree species. Generally, the NDVI metrics suggest that species characteristics of moist and cold regions (e.g., Abies alba and Pinus uncinata) tend to show lower correlations than species of semi-arid climates (e.g., Pinus halepensis).
Conifers from dry regions (Pinus halepensis, Pinus pinaster, and Juniperus thurifera) recorded the highest correlation coefficients in the case of TRWi (r = 0.70); on the contrary, conifers (Abies pinsapo) and hardwood species (Castanea sativa and Fagus sylvatica) from wet and temperate regions recorded lower correlations (r = 0.45). The response of the species to NDVI max—SPEI relationship was more evident for two species dominant in dry areas: Pinus halepensis and Quercus ilex (r = 0.5). In Figures S1 and S2 are displayed the maximum correlations (S1) and Pearson’s partial correlations (S2) for the rest of the indices and variables considered in the analysis for each tree species respectively.
According to Figure 6, the response to medium (4–6 months) to long (>6 months) drought time-scales are frequently observed. Several tree species (e.g., Quercus ilex, Quercus faginea, Pinus pinaster, Pinus pinea, Pinus halepensis, and Castanea sativa) exhibited similar long time-scale responses in the three forest variables. It seems that the response of the interannual variability of tree metrics to drought was not only driven by the differences among species, but also by the general hydro-climatic conditions. Figure S3 illustrates the most correlated time-scale found for the rest of the multi-scalar drought indices and variables considered in the analysis for each tree species respectively.
Figure 7 illustrates the relationship between the average annual hydro-climatic balance for hardwoods and coniferous species and the correlation found between the most correlated drought index and each of the three variables. As depicted, most conifer forests were characterized by negative annual hydro-climatic balances, while half of hardwood forests, mainly those located in humid and mountainous regions, showed a positive hydro-climatic balance. Figures S6–S8 summarize this relationship for each species and variable.

4. Discussion

This study addressed the sensitivity of several drought indices to record responses of NDVI metrics and tree growth to water shortage. In general, we found that multi-scalar drought indices (e.g., SPI, SPEI) outperform uni-scalar drought indices (PDSIs) in terms of capturing the impacts of water shortage on forest growth and NDVI metrics. Likewise, this study assesses the performance of different drought indices to adequately monitor the impact of drought on forests under different climatic and geographical conditions, and taxonomic origins. Our analysis is based on two promising datasets covering the IP and the Balearic Islands. The first comprises tree-ring width data from a dense network of 568 forests for 16 tree species [75]. The second includes a 1.1 km spatial resolution NDVI dataset that allows for detecting the growth and NDVI signal in each forest stand, reducing the interferences associated with the non-related vegetation cover [54]. Changes in vegetation due to adverse environmental conditions have been addressed in the scientific literature from different methodological perspectives. Tardieu et al. [76] proposed a probabilistic approach based on the genetic variability to study the adaptive mechanisms of vegetation to uncertain climatic conditions as drought to contribute to the tolerance of major crops to deal with them. For its part, Almeida et al. [77] developed a systematic methodology to study the spectral differences of vegetation, discriminate between vegetation assemblages, and assess the phenology of plants applying a principal component analysis to band ratios. They found significant differences in comparison to most traditional approaches such as the NDVI. Previous studies also examined the links between vegetation activity and drought events assessing the response of NDVI to drought using drought indices for finding links between vegetation activity and drought events [78]. Some studies also quantified the impacts of drought on forest growth using dendrochronological methods and multi-scalar drought indices [10], while others assessed the relationship between NDVI and tree-ring width data [32,38,79].
However, very few studies have assessed the varying response of vegetation to various drought indices [48,80,81], considering NDVI and tree-ring width data for different tree species, taxonomic groups and biogeographical regions.
This study demonstrates that TRWi and NDVI metrics show different responses to multi-scalar drought indices (Figures S4 and S5), highlighting the different relationship between wood production and canopy greenness or activity (NPP) with drought. TRWi was more responsive to drought severity than the NDVI metrics. Similar results have been observed by Gazol et al. [75] for Spain, as they noted that tree growth is more sensitive to extreme climate events than the above-ground photosynthetic biomass. They attributed this pattern to: (1) the dependence of leaf and wood formation processes on water availability, (2) the distortion of NDVI signal as a consequence of the spatial resolution, and (3) the effect of nearby vegetation. A similar finding was also observed by Aaltonen et al. [82] who indicated that drought led to a decline in the growth of Scots pine seedlings due to stress. In contrast, the photosynthetic rates did not decrease due to drought, confirming the physiological adaptations (e.g., larger root network) to deal with water scarcity. Similarly, McDowell et al. [83] described different mechanisms to explain mortality caused by drought and water stress. These mechanisms include biotic stressors, hydraulic failure, and carbon starvation. Additonally, numerous studies confirmed that—under soil moisture deficit scenarios—forests can maintain their photosynthetic capacity [84], while dehydration associated with long periods of xylem conductivity loss inevitably can induce tree dieback [85,86]. Thus, it is acceptable that sensitivity of secondary growth to drought is greater than that of the photosynthetic activity. It is also important to consider that, albeit with the high dependence of spectral measurements on the amount of leafy biomass and primary production [41], remotely-sensed vegetation indices (e.g., NDVI) are limited, given that saturation problems can occur, especially in regions with high biomass and strong chlorophyll absorption in the red and near-infrared bands [87,88]. This feature may add further uncertainty to the obtained results, particularly at regional scales.
Our findings on the performance of the different drought indices stress the superiority of multi-scalar indices over the uni-scalar indices. This is clearly evident for the three vegetation indicators considered in this study. In this context, Bhuyan et al. [80] employed a range of drought indices to evaluate the connection between drought and tree growth of nine tree species across Europe. In their comparison of multi-scalar drought indices (i.e., SPI and SPEI) and the self-calibrated PDSI, they found a good agreement for F. sylvatica forests between the correlation values found for the Palmer index and the SPEI-SPI at long time scales (>12 months). On the other hand, the SPEI and SPI captured drought signals in the growth series of all tree species, especially in temperate and cold forests. Our results suggest that the Z-Index and the PMDI show more significant and higher correlations with TRWi compared with the PDSI. In this regard, Karl [89] stated that, for some agricultural and forest fires applications, the Z-Index outperforms PDSI given its competence to respond to short-term moisture variances. In our case, the highest correlations of the Z-Index were found for TRWi. In their global assessment, Vicente-Serrano et al. [48] indicated that growth-drought correlations were stronger for the SPI and SPEI indices than for the PDSI and the Z-Index. They also found that a higher percentage of forests from different biomes across the world correlated better with the SPEI than with the SPI. For its part, Bachmair et al. [50] assessed the relationship between meteorological indicators and forests in Europe, suggesting slight differences between the SPEI and SPI. Nonetheless, they noted that—at shorter time scales—the SPEI shows a stronger response in the forests of southern Europe, a result that is in agreement with the findings of our study.
Our findings also demonstrate that the strength of correlations and timing response to drought vary spatially depending on the species and climatic conditions. Specifically, hardwood species under moist climate in Northern Spain are less correlated with drought indices than the remaining species. The deciduous species (e.g., Fagus sylvatica, Quercus petraea, Quercus pyrenaica, and Quercus robur) were, however, more sensitive to drought at short (1–3 months) and medium time scales than most of evergreen coniferous trees, particularly in the dry eastern IP under Mediterranean climate that responded to longer time scales (e.g., Pinus halepensis). This entails the resilience capacity of the species to endure with droughts. Gazol et al. [75] found that the same pine species inhabiting southern and eastern dry regions in the IP showed a low resistance to drought and a high post-drought recovery capacity. In semiarid areas, soil water availability is the main constraint for forest growth [72]. This dependence on moisture deficit at medium to longer temporal scales was also found by Rimkus et al. [78] for the Baltic region and Quiring and Ganesh [90] for Texas (USA).
Overall, species growing under humid climate conditions present a weaker correlation with drought indices. Nonetheless, these species are most sensitive to extreme or prolonged drought events, due to the absence of resilience mechanisms to reduce the damage caused by severe water shortage [91], although they can show high resistance to drought in terms of growth loss [75]. In these humid regions, precipitation seems to be the main limiting factor, given the stronger response of SPI to NDVI cumulative annual series (NDVI annual), compared to drought indices that account for precipitation as well as atmospheric evaporative demand (i.e., SPEI) [40]. Furthermore, vegetation from humid regions may respond in a different manner to mild droughts, as suggest by Zhang et al. [92]. This behavior can be interpreted within a context where temperature rise and low cloudiness could increase the incoming photosynthetically-active radiation simultaneously with increased evapotranspiration.
Interestingly, the response of species to drought differs among species belonging of the same genus, and also between sites in the same species, indicating the relevance of local site climatic and soil conditions. Thus, some species dominating in cold and continental mountainous areas (e.g., Pinus sylvestris and Pinus uncinata) tend to respond to shorter temporal scales because of their higher dependence on water availability [93]. In contrast, Pinus halepensis and Pinus nigra, which are dominant in dry regions, are less sensitive to moisture deficit, especially during prolonged droughts [94].
In addition, the response of forests to drought indices shows a strong seasonality. For tree-ring growth, moisture conditions during summer, especially in July and August, are determinant of wood formation. On the other hand, for the NDVI (max and annual), late spring months (April and May) are more relevant. The higher sensitivity of wood formation to summer water availability is probably related to phenological patterns of each species [95]. A similar pattern was observed over arid and semi-arid regions of Mongolia and China [92]. Even if spring droughts may lead to severe impacts, these impacts may be lagged to subsequent months, leading to photosynthesis reduction as well as accelerated respiration rates in summer. All these factors together reduced the annual net carbon uptake and, thus, wood formation [96].

5. Conclusions

To sum up, our study reflects some key findings:
  • The multi-scalar drought indices (e.g., SPEI, SPI, and SPDI) perform better than uni-scalar indices (e.g., PDSI) to identify drought impacts on forests for different species.
  • Among the multi-scalar indices, SPEI and SPI correlate better with TRWi and NDVI than the SPDI for most species.
  • Albeit with the few differences in the magnitude of correlations between the SPEI and SPI, our results suggest a major role of the atmospheric evaporative demand in drought severity across forests located in dry Mediterranean areas.
  • Droughts are more prone to impact forest secondary growth (TRWi) during summertime, and annual production and greenness (NDVI) during springtime.
  • The response of the forests to drought is mainly driven by short time scales (1–3 months) in humid-temperate hardwood forests, compared to long to medium (>4 months) time scales in warm-dry conifer forests.
  • Tree-ring growth seems a more reliable indicator of the response of forests to drought, due to its higher association with drought indices.

Supplementary Materials

The following are available online at https://www.mdpi.com/1999-4907/9/9/524/s1, Figure S1. Box plots showing the maximum Pearson correlation coefficients computed between NDVI annual (a,f), ring-width indices (TRWi (b,d), and NDVImax (c,e), and the multi-scalar drought indices (SPEI, SPI, and SPDI), Figure S2. Box plots showing the maximum partial Pearson correlation coefficients found between TRWi (b,d), NDVI max (c,e), NDVI annual (a,f), and the multi-scalar drought indices. Figure S3. Box plots showing the most correlated time-scale found for TRWi (b,d), NDVI max (c,e), NDVI annual (a,f), and the multi-scalar drought indices. Figure S4. Scatterplots showing the maximum Pearson correlation coefficients found for SPEI-TRWi and SPI-NDVI annual by species. Figure S5. Scatterplots showing the maximum Pearson correlation coefficients found for SPEI-TRWi and SPEI-NDVI max by species. Figure S6. Scatterplots showing the maximum Pearson correlation coefficients found for SPEI-TRWi and the average annual hydro-climatic balance by species. Figure S7. Same as Figure S6, but for SPEI-NDVI max. Figure S8. Same as Figure S6, but for SPEI-NDVI annual. Table S1. Percentage of sampled forests per drought index and time-scale (number of months) in which the maximum correlation value was found with ring-width indices (TRWi, a), NDVI max (b), and NDVI annual (c).

Author Contributions

Conceptualization, S.M.V.-S.; Data curation, S.M.V.-S., J.J.C., A.G., R.S.-S., E.G., M.d.L., G.S.-B., K.N., V.R., P.A.T., J.C.L., E.M.d.C., M.R.M., I.G.-G., F.S., A.C., M.G., J.M.O., L.A.L., A.H. and J.D.G.; Formal analysis, M.P.-G.; Methodology, M.P.-G. and S.M.V.-S.; Supervision, S.M.V.-S., J.J.C.; Visualization, M.P.-G.; Writing—original draft, M.P.-G.; Writing—review & editing, S.M.V.-S., J.J.C., F.D.-C., A.E.K., S.B.-P., G.S.-B., J.M.O. and A.H.

Funding

This study was financially supported by the Spanish Ministry of Economy projects: CGL2015-69186-C2-1-R (Fundiver), CGL2015-69985-R (CLIMED), CGL2013-48843-C2-1-R (CoMo-ReAdapt), AGL2014-53822-C2-1-R (SATIVA), XIRONO (BFU2010-21451), CGL2014-52135-C03-01, PCIN-2015-220, and CGL2016-81706-REDT (Ecometas Network), 1560/2015 (ECOHIPRO). The study was also funded by IMDROFLOOD (Water Works 2014, EC) and INDECIS (European Research Areas for Climate Services) projects. This work also benefited from funding from Xunta de Galicia (PGIDIT06PXIB502262PR, GRC GI-1809, ROCLIGAL-10MDS291009PR), INIA (RTA200600117), and Interreg V-A POCTEFA (CANOPEE, 2014-2020-FEDER funds) projects. Marina Peña-Gallardo was granted by the Spanish Ministry of Economy and Competitiveness. Raúl Sánchez-Salguero and Antonio Gazol were supported by postdoctoral grants (IJCI-2015-25845 and MINECO-FPDI 2013-16600; FEDER funds).

Conflicts of Interest

The authors declare no conflict of interest.

References

  1. Wilhite, D.A.; Pulwarty, R.S. Drought and Water Crises: Integrating Science, Management, and Policy; CRC Press: Boca Raton, FL, USA, 2017; ISBN 9781138035645. [Google Scholar]
  2. Bachmair, S.; Kohn, I.; Stahl, K. Exploring the link between drought indicators and impacts. Nat. Hazards Earth Syst. Sci. 2015, 15, 1381–1397. [Google Scholar] [CrossRef] [Green Version]
  3. Wilhite, D.A.; Svoboda, M.D.; Hayes, M.J. Understanding the complex impacts of drought: A key to enhancing drought mitigation and preparedness. Water Resour. Manag. 2007, 21, 763–774. [Google Scholar] [CrossRef] [Green Version]
  4. Allen, C.D.; Macalady, A.K.; Chenchouni, H.; Bachelet, D.; McDowell, N.; Vennetier, M.; Kitzberger, T.; Rigling, A.; Breshears, D.D.; Hogg, E.H.; et al. A global overview of drought and heat-induced tree mortality reveals emerging climate change risks for forests. For. Ecol. Manag. 2010, 259, 660–684. [Google Scholar] [CrossRef]
  5. Zhang, Q.; Shao, M.; Jia, X.; Wei, X. Relationship of Climatic and Forest Factors to Drought- and Heat-Induced Tree Mortality. PLoS ONE 2017, 12, e0169770. [Google Scholar] [CrossRef] [PubMed]
  6. Young, D.J.N.; Stevens, J.T.; Earles, J.M.; Moore, J.; Ellis, A.; Jirka, A.L.; Latimer, A.M. Long-term climate and competition explain forest mortality patterns under extreme drought. Ecol. Lett. 2017, 20, 78–86. [Google Scholar] [CrossRef] [PubMed]
  7. Greenwood, S.; Ruiz-Benito, P.; Martínez-Vilalta, J.; Lloret, F.; Kitzberger, T.; Allen, C.D.; Fensham, R.; Laughlin, D.C.; Kattge, J.; Bönisch, G.; et al. Tree mortality across biomes is promoted by drought intensity, lower wood density and higher specific leaf area. Ecol. Lett. 2017, 20, 539–553. [Google Scholar] [CrossRef] [PubMed] [Green Version]
  8. Vicente-Serrano, S.M.; Lopez-Moreno, J.-I.; Beguería, S.; Lorenzo-Lacruz, J.; Sanchez-Lorenzo, A.; García-Ruiz, J.M.; Azorin-Molina, C.; Morán-Tejeda, E.; Revuelto, J.; Trigo, R.; et al. Evidence of increasing drought severity caused by temperature rise in southern Europe. Environ. Res. Lett. 2014, 9, 44001–44009. [Google Scholar] [CrossRef]
  9. Dai, A. Increasing drought under global warming in observations and models. Nat. Clim. Chang. 2013, 3, 52–58. [Google Scholar] [CrossRef]
  10. Pasho, E.; Camarero, J.J.; de Luis, M.; Vicente-Serrano, S.M. Impacts of drought at different time scales on forest growth across a wide climatic gradient in north-eastern Spain. Agric. For. Meteorol. 2011, 151, 1800–1811. [Google Scholar] [CrossRef]
  11. Gazol, A.; Camarero, J.J.; Anderegg, W.R.L.; Vicente-Serrano, S.M. Impacts of droughts on the growth resilience of Northern Hemisphere forests. Glob. Ecol. Biogeogr. 2017, 26, 166–176. [Google Scholar] [CrossRef]
  12. Sánchez-Salguero, R.; Navarro-Cerrillo, R.M.; Camarero, J.J.; Fernández-Cancio, Á. Selective drought-induced decline of pine species in southeastern Spain. Clim. Chang. 2012, 113, 767–785. [Google Scholar] [CrossRef]
  13. Arzac, A.; Rozas, V.; Rozenberg, P.; Olano, J.M. Water availability controls Pinus pinaster xylem growth and density: A multi-proxy approach along its environmental range. Agric. For. Meteorol. 2018, 250–251, 171–180. [Google Scholar] [CrossRef]
  14. Arzac, A.; García-Cervigón, A.I.; Vicente-Serrano, S.M.; Loidi, J.; Olano, J.M. Phenological shifts in climatic response of secondary growth allow Juniperus sabina L. to cope with altitudinal and temporal climate variability. Agric. For. Meteorol. 2016, 217, 35–45. [Google Scholar] [CrossRef]
  15. Forner, A.; Valladares, F.; Bonal, D.; Granier, A.; Grossiord, C.; Aranda, I. Extreme droughts affecting Mediterranean tree species’ growth and water-use efficiency: The importance of timing. Tree Physiol. 2018. [Google Scholar] [CrossRef] [PubMed]
  16. Peguero-Pina, J.J.; Sancho-Knapik, D.; Cochard, H.; Barredo, G.; Villarroya, D.; Gil-Pelegrin, E. Hydraulic traits are associated with the distribution range of two closely related Mediterranean firs, Abies alba Mill. and Abies pinsapo Boiss. Tree Physiol. 2011, 31, 1067–1075. [Google Scholar] [CrossRef] [PubMed]
  17. Martín Vide, J.; Olcina Cantos, J. Climas y Tiempos de España; Alianza Editorial: Madrid, Spain, 2001; ISBN 8420657778. [Google Scholar]
  18. Camarero, J.J.; Gazol, A.; Sangüesa-Barreda, G.; Cantero, A.; Sánchez-Salguero, R.; Sánchez-Miranda, A.; Granda, E.; Serra-Maluquer, X.; Ibáñez, R. Forest Growth Responses to Drought at Short- and Long-Term Scales in Spain: Squeezing the Stress Memory from Tree Rings. Front. Ecol. Evol. 2018, 6, 9. [Google Scholar] [CrossRef]
  19. Neumann, M.; Mues, V.; Moreno, A.; Hasenauer, H.; Seidl, R. Climate variability drives recent tree mortality in Europe. Glob. Chang. Biol. 2017, 23, 4788–4797. [Google Scholar] [CrossRef] [PubMed]
  20. Camarero, J.J.; Gazol, A.; Sangüesa-Barreda, G.; Oliva, J.; Vicente-Serrano, S.M. To die or not to die: Early warnings of tree dieback in response to a severe drought. J. Ecol. 2015, 103, 44–57. [Google Scholar] [CrossRef]
  21. Carnicer, J.; Coll, M.; Ninyerola, M.; Pons, X.; Sánchez, G.; Peñuelas, J. Widespread crown condition decline, food web disruption, and amplified tree mortality with increased climate change-type drought. Proc. Natl. Acad. Sci. USA 2011, 108, 1474–1478. [Google Scholar] [CrossRef] [PubMed] [Green Version]
  22. Bonan, G.B. Forests and climate change: Forcings, feedbacks, and the climate benefits of forests. Science 2008, 320, 1444–1449. [Google Scholar] [CrossRef] [PubMed]
  23. Frank, D.C.; Poulter, B.; Saurer, M.; Esper, J.; Huntingford, C.; Helle, G.; Treydte, K.; Zimmermann, N.E.; Schleser, G.H.; Ahlström, A.; et al. Water-use efficiency and transpiration across European forests during the Anthropocene. Nat. Clim. Chang. 2015, 5, 579–583. [Google Scholar] [CrossRef]
  24. Zhao, M.; Running, S.W. Drought-Induced Reduction in Global Terrestrial Net Primary Production from 2000 Through 2009. Science 2010, 329, 940–943. [Google Scholar] [CrossRef] [PubMed]
  25. Gursoy, M.; Balkan, A.; Ulukan, H. Ecophysiological Responses to Stresses in Plants: A General Approach. Pak. J. Biol. Sci. 2012, 15, 506–516. [Google Scholar] [CrossRef] [PubMed]
  26. Li, J.; Cang, Z.; Jiao, F.; Bai, X.; Zhang, D.; Zhai, R. Influence of drought stress on photosynthetic characteristics and protective enzymes of potato at seedling stage. J. Saudi Soc. Agric. Sci. 2017, 16, 82–88. [Google Scholar] [CrossRef]
  27. Pinheiro, C.; Chaves, M.M. Photosynthesis and drought: can we make metabolic connections from available data? J. Exp. Bot. 2011, 62, 869–882. [Google Scholar] [CrossRef] [PubMed]
  28. Basu, S.; Ramegowda, V.; Kumar, A.; Pereira, A. Plant adaptation to drought stress. F1000Research 2016, 5. [Google Scholar] [CrossRef] [PubMed]
  29. Granda, E.; Escudero, A.; Valladares, F. More than just drought: Complexity of recruitment patterns in Mediterranean forests. Oecologia 2014, 176, 997–1007. [Google Scholar] [CrossRef] [PubMed]
  30. Lloret, F.; Escudero, A.; Iriondo, J.M.; Martínez-Vilalta, J.; Valladares, F. Extreme climatic events and vegetation: The role of stabilizing processes. Glob. Chang. Biol. 2012, 18, 797–805. [Google Scholar] [CrossRef]
  31. Vidal-Macua, J.J.; Ninyerola, M.; Zabala, A.; Domingo-Marimon, C.; Pons, X. Factors affecting forest dynamics in the Iberian Peninsula from 1987 to 2012. The role of topography and drought. For. Ecol. Manag. 2017, 406, 290–306. [Google Scholar] [CrossRef]
  32. Vicente-Serrano, S.M.; Camarero, J.J.; Olano, J.M.; Martín-Hernández, N.; Peña-Gallardo, M.; Tomás-Burguera, M.; Gazol, A.; Azorin-Molina, C.; Bhuyan, U.; El Kenawy, A. Diverse relationships between forest growth and the Normalized Difference Vegetation Index at a global scale. Remote Sens. Environ. 2016, 187, 14–29. [Google Scholar] [CrossRef] [Green Version]
  33. Babst, F.; Poulter, B.; Trouet, V.; Tan, K.; Neuwirth, B.; Wilson, R.; Carrer, M.; Grabner, M.; Tegel, W.; Levanic, T.; et al. Site- and species-specific responses of forest growth to climate across the European continent. Glob. Ecol. Biogeogr. 2013, 22, 706–717. [Google Scholar] [CrossRef]
  34. Fritts, H.C. Tree Rings and Climate; Academic Press: Cambridge, MA, USA, 1976; ISBN 9780122684500. [Google Scholar]
  35. Gazol, A.; Sangüesa-Barreda, G.; Granda, E.; Camarero, J.J. Tracking the impact of drought on functionally different woody plants in a Mediterranean scrubland ecosystem. Plant Ecol. 2017, 218, 1009–1020. [Google Scholar] [CrossRef] [Green Version]
  36. Vicente-Serrano, S.M.; Martín-Hernández, N.; Camarero, J.J.; Gazol, A.; Sánchez-Salguero, R.; Peña-Gallardo, M.; El Kenawy, A.; Domínguez-Castro, F.; Tomas-Burguera, M.; Gutiérrez, E.; et al. Spatial, temporal and climatic determinants of the responses of tree-ring growth to satellite-derived primary growth in multiple forest biomes. Sci. Total Environ. 2018. under review. [Google Scholar]
  37. Poulter, B.; Pederson, N.; Liu, H.; Zhu, Z.; D’Arrigo, R.; Ciais, P.; Davi, N.; Frank, D.; Leland, C.; Myneni, R.; Piao, S.; Wang, T. Recent trends in Inner Asian forest dynamics to temperature and precipitation indicate high sensitivity to climate change. Agric. For. Meteorol. 2013, 178–179, 31–45. [Google Scholar] [CrossRef]
  38. Wang, J.; Rich, P.M.; Price, K.P.; Kettle, W.D. Relations between NDVI and tree productivity in the central Great Plains. Int. J. Remote Sens. 2004, 25, 3127–3138. [Google Scholar] [CrossRef] [Green Version]
  39. Bochenek, Z.; Ziolkowski, D.; Bartold, M.; Orlowska, K.; Ochtyra, A. Monitoring forest biodiversity and the impact of climate on forest environment using high-resolution satellite images. Eur. J. Remote Sens. 2018, 51, 166–181. [Google Scholar] [CrossRef]
  40. Vicente-Serrano, S.M.; Gouveia, C.; Camarero, J.J.; Beguería, S.; Trigo, R.; López-Moreno, J.I.; Azorín-Molina, C.; Pasho, E.; Lorenzo-Lacruz, J.; Revuelto, J.; et al. Response of vegetation to drought time-scales across global land biomes. Proc. Natl. Acad. Sci. USA 2013, 110, 52–57. [Google Scholar] [CrossRef] [PubMed] [Green Version]
  41. Tucker, C.J. Red and photographic infrared linear combinations for monitoring vegetation. Remote Sens. Environ. 1979, 8, 127–150. [Google Scholar] [CrossRef] [Green Version]
  42. Tucker, C.J.; Sellers, P.J. Satellite remote sensing of primary production. Int. J. Remote Sens. 1986, 7, 1395–1416. [Google Scholar] [CrossRef] [Green Version]
  43. Keyantash, J.; Dracup, J.A.; Keyantash, J.; Dracup, J.A. The Quantification of Drought: An Evaluation of Drought Indices. Bull. Am. Meteorol. Soc. 2002, 83, 1167–1180. [Google Scholar] [CrossRef]
  44. Zargar, A.; Sadiq, R.; Naser, B.; Khan, F.I. A review of drought indices. Environ. Rev. 2011, 19, 333–349. [Google Scholar] [CrossRef]
  45. Shukla, S.; Steinemann, A.C.; Lettenmaier, D.P.; Shukla, S.; Steinemann, A.C.; Lettenmaier, D.P. Drought Monitoring for Washington State: Indicators and Applications. J. Hydrometeorol. 2011, 12, 66–83. [Google Scholar] [CrossRef]
  46. Lorenzo-Lacruz, J.; Vicente-Serrano, S.M.; López-Moreno, J.I.; Beguería, S.; García-Ruiz, J.M.; Cuadrat, J.M. The impact of droughts and water management on various hydrological systems in the headwaters of the Tagus River (central Spain). J. Hydrol. 2010, 386, 13–26. [Google Scholar] [CrossRef] [Green Version]
  47. Peña-Gallardo, M.; Vicente-Serrano, S.M.; Domínguez-Castro, F.; Quiring, S.M.; Svoboda, M.D.; Beguería-Portugués, S.; Hannaford, J. Effectiveness of drought indices in identifying impacts on major crops over the USA. Clim. Res. 2018, in press. [Google Scholar] [CrossRef]
  48. Vicente-Serrano, S.M.; Beguería, S.; Lorenzo-Lacruz, J.; Camarero, J.J.; López-Moreno, J.I.; Azorin-Molina, C.; Revuelto, J.; Morán-Tejeda, E.; Sanchez-Lorenzo, A.; Vicente-Serrano, S.M.; et al. Performance of Drought Indices for Ecological, Agricultural, and Hydrological Applications. Earth Int. 2012. [Google Scholar] [CrossRef]
  49. Kempes, C.P.; Myers, O.B.; Breshears, D.D.; Ebersole, J.J. Comparing response of Pinus edulis tree-ring growth to five alternate moisture indices using historic meteorological data. J. Arid Environ. 2008, 72, 350–357. [Google Scholar] [CrossRef]
  50. Bachmair, S.; Tanguy, M.; Hannaford, J.; Stahl, K. How well do meteorological indicators represent agricultural and forest drought across Europe? Environ. Res. Lett. 2018, 13, 034042. [Google Scholar] [CrossRef] [Green Version]
  51. Vicente-Serrano, S.M.; Tomas-Burguera, M.; Beguería, S.; Reig, F.; Latorre, B.; Peña-Gallardo, M.; Luna, M.Y.; Morata, A.; González-Hidalgo, J.C. A High Resolution Dataset of Drought Indices for Spain. Data 2017, 2, 22. [Google Scholar] [CrossRef]
  52. Allen, R.G.; Rick, G. Food and Agriculture Organization of the United Nations. In Crop Evapotranspiration: Guidelines for Computing Crop Water Requirements; Allen, R.G., Pereira, L.S., Raes, D., smith, M., Eds.; Food and Agriculture Organization of the United Nations: Rome, Italy, 1998; ISBN 9251042195. [Google Scholar]
  53. Pettorelli, N.; Vik, J.O.; Mysterud, A.; Gaillard, J.-M.; Tucker, C.J.; Stenseth, N.C. Using the satellite-derived NDVI to assess ecological responses to environmental change. Trends Ecol. Evol. 2005, 20, 503–510. [Google Scholar] [CrossRef] [PubMed]
  54. Vicente-Serrano, M.; Martín-Hernández, N.; Camarero, J.J.; Gazol, A.; Sánchez-Salguero, R.; Peña-Gallardo, M.; El Kenawy, A.; Domínguez-Castro, F.; Tomás-Burquera, M.; Gutiérrez, E.; et al. Linking tree-ring growth and satellite-derived gross primary growth in multiple forest biomes. Temporal-scale matters. Sci. Total Environ. 2018. under review. [Google Scholar]
  55. Nagaraja Rao, C.R.; Zhang, N.; Sullivan, J.T. Inter-calibration of meteorological satellite sensors in the visible and near-infrared. Adv. Space Res. 2001, 28, 3–10. [Google Scholar] [CrossRef]
  56. Robel, J. NOAA KLM User’s Guide—Satellite and Data Description of NOAA’s Polar-Orbiting Satellites from NOAA-15 and Later. 2009. Available online: https://www1.ncdc.noaa.gov/pub/data/satellite/publications/podguides/N-15%20thru%20N-19/pdf/0.0%20NOAA%20KLM%20Users%20Guide.pdf (accessed on 28 August 2018).
  57. Riano, D.; Chuvieco, E.; Salas, J.; Aguado, I. Assessment of different topographic corrections in landsat-TM data for mapping vegetation types (2003). IEEE Trans. Geosci. Remote Sens. 2003, 41, 1056–1061. [Google Scholar] [CrossRef]
  58. Baena-Calatrava, R. Georreferenciación Automática de Imágenes NOAA-AVHRR; University of Jaén: Jaen, Spain, 2002. [Google Scholar]
  59. Azorin-Molina, C.; Baena-Calatrava, R.; Echave-Calvo, I.; Connell, B.H.; Vicente-Serrano, S.M.; López-Moreno, J.I. A daytime over land algorithm for computing AVHRR convective cloud climatologies for the Iberian Peninsula and the Balearic Islands. Int. J. Climatol. 2013, 33, 2113–2128. [Google Scholar] [CrossRef]
  60. Holben, B.N. Characteristics of maximum-value composite images from temporal AVHRR data. Int. J. Remote Sens. 1986, 7, 1417–1434. [Google Scholar] [CrossRef] [Green Version]
  61. Holmes, R.L. Computer-assisted quality control in tree-ring dating and measurements. Tree-Ring Bull. 1983, 43, 69–78. [Google Scholar]
  62. Bunn, A.G. A dendrochronology program library in R (dplR). Dendrochronologia 2008, 26, 115–124. [Google Scholar] [CrossRef]
  63. Palmer, W.C. Meteorological Drought; U.S. Department of Commerce: Washington, DC, USA, 1965.
  64. Alley, W.M. The Palmer Drought Severity Index: Limitations and Assumptions. J. Clim. Appl. Meteorol. 1984, 23, 1100–1109. [Google Scholar] [CrossRef] [Green Version]
  65. Doesken, N.J.; Garen, D. Drought monitoring in the Western United States using a surface water supply index. In Proceedings of the 7th Conference on Applied Climatology, Salt Lake City, UT, USA, 10–13 September 1991; Doesken, N.J., Mckee, T.B., Kleist, J., Eds.; Colorado State University: Fort Collins, CO, USA, 1991. [Google Scholar]
  66. Heim, R.R. A Review of Twentieth-Century Drought Indices Used in the United States. Bull. Am. Meteorol. Soc. 2002, 83, 1149–1165. [Google Scholar] [CrossRef]
  67. Mckee, T.B.; Doesken, N.J.; Kleist, J. The Relationship of Drought Frequency and Duration to Time Scales. In Proceedings of the 8th Conference on Applied Climatology, Anaheim, CA, USA, 17–22 January 1993. [Google Scholar]
  68. Svoboda, M.; Hayes, M.; Wood, D. Standardized Precipitation Index User Guide; World Meteorological Organization: Geneva, Swizerland, 2012. [Google Scholar]
  69. Vicente-Serrano, S.M.; Beguería, S.; López-Moreno, J.I.; Vicente-Serrano, S.M.; Beguería, S.; López-Moreno, J.I. A Multiscalar Drought Index Sensitive to Global Warming: The Standardized Precipitation Evapotranspiration Index. J. Clim. 2010, 23, 1696–1718. [Google Scholar] [CrossRef] [Green Version]
  70. Ma, M.; Ren, L.; Yuan, F.; Jiang, S.; Liu, Y.; Kong, H.; Gong, L. A new standardized Palmer drought index for hydro-meteorological use. Hydrol. Process. 2014, 28, 5645–5661. [Google Scholar] [CrossRef]
  71. Vicente-Serrano, S.M.; Van der Schrier, G.; Beguería, S.; Azorin-Molina, C.; Lopez-Moreno, J.-I. Contribution of precipitation and reference evapotranspiration to drought indices under different climates. J. Hydrol. 2015, 526, 42–54. [Google Scholar] [CrossRef] [Green Version]
  72. Vicente-Serrano, S.; Cabello, D.; Tomás-Burguera, M.; Martín-Hernández, N.; Beguería, S.; Azorin-Molina, C.; Kenawy, A. Drought Variability and Land Degradation in Semiarid Regions: Assessment Using Remote Sensing Data and Drought Indices (1982–2011). Remote Sens. 2015, 7, 4391–4423. [Google Scholar] [CrossRef] [Green Version]
  73. Bian, J.; Li, A.; Deng, W. Estimation and analysis of net primary Productivity of Ruoergai wetland in China for the recent 10 years based on remote sensing. Procedia Environ. Sci. 2010, 2, 288–301. [Google Scholar] [CrossRef]
  74. Kuenzer, C.; Dech, S.W.; Wagner, W. Remote Sensing Time Series: Revealing Land Surface Dynamics; Springer: Berlin, Germany, 2015; ISBN 9783319159676. [Google Scholar]
  75. Gazol, A.; Camarero, J.J.; Vicente-Serrano, S.M.; Sánchez-Salguero, R.; Gutiérrez, E.; de Luis, M.; Sangüesa-Barreda, G.; Novak, K.; Rozas, V.; Tíscar, P.A.; Linares, J.C.; et al. Forest resilience to drought varies across biomes. Glob. Chang. Biol. 2018, 24, 2143–2158. [Google Scholar] [CrossRef] [PubMed] [Green Version]
  76. Tardieu, F.; Simonneau, T.; Muller, B. The Physiological Basis of Drought Tolerance in Crop Plants: A Scenario-Dependent Probabilistic Approach. Annu. Rev. Plant Biol. 2018, 69, 733–759. [Google Scholar] [CrossRef] [PubMed]
  77. Almeida, T.I.R.; Filho, D.S. Principal component analysis applied to feature-oriented band ratios of hyperspectral data: A tool for vegetation studies. Int. J. Remote Sens. 2004, 25, 5005–5023. [Google Scholar] [CrossRef]
  78. Rimkus, E.; Stonevicius, E.; Kilpys, J.; Maciulyte, V.; Valiukas, D. Drought identification in the eastern Baltic region using NDVI. Earth Syst. Dyn. 2017, 85194, 627–637. [Google Scholar] [CrossRef]
  79. He, J.; Shao, X. Relationships between tree-ring width index and NDVI of grassland in Delingha. Chin. Sci. Bull. 2006, 51, 1106–1114. [Google Scholar] [CrossRef]
  80. Bhuyan, U.; Zang, C.; Menzel, A. Different responses of multispecies tree ring growth to various drought indices across Europe. Dendrochronologia 2017, 44, 1–8. [Google Scholar] [CrossRef]
  81. Vilhar, U. Comparison of drought stress indices in beech forests: A modelling study. iForest 2016, 9, 635. [Google Scholar] [CrossRef]
  82. Aaltonen, H.; Lindén, A.; Heinonsalo, J.; Biasi, C.; Pumpanen, J. Effects of prolonged drought stress on Scots pine seedling carbon allocation. Tree Physiol. 2016, 37, 418–427. [Google Scholar] [CrossRef] [PubMed]
  83. McDowell, N.; Allen, C.D.; Anderson-Teixeira, K.; Brando, P.; Brienen, R.; Chambers, J.; Christoffersen, B.; Davies, S.; Doughty, C.; Duque, A.; et al. Drivers and mechanisms of tree mortality in moist tropical forests. New Phytol. 2018. [Google Scholar] [CrossRef] [PubMed]
  84. Rowland, L.; Lobo-do-Vale, R.L.; Christoffersen, B.O.; Melém, E.A.; Kruijt, B.; Vasconcelos, S.S.; Domingues, T.; Binks, O.J.; Oliveira, A.A.R.; Metcalfe, D.; et al. After more than a decade of soil moisture deficit, tropical rainforest trees maintain photosynthetic capacity, despite increased leaf respiration. Glob. Chang. Biol. 2015, 21, 4662–4672. [Google Scholar] [CrossRef] [PubMed] [Green Version]
  85. McDowell, N.G.; Fisher, R.A.; Xu, C.; Domec, J.C.; Hölttä, T.; Mackay, D.S.; Sperry, J.S.; Boutz, A.; Dickman, L.; Gehres, N.; et al. Evaluating theories of drought-induced vegetation mortality using a multimodel-experiment framework. New Phytol. 2013, 200, 304–321. [Google Scholar] [CrossRef] [PubMed] [Green Version]
  86. Rowland, L.; da Costa, A.C.L.; Galbraith, D.R.; Oliveira, R.S.; Binks, O.J.; Oliveira, A.A.R.; Pullen, A.M.; Doughty, C.E.; Metcalfe, D.B.; Vasconcelos, S.S.; et al. Death from drought in tropical forests is triggered by hydraulics not carbon starvation. Nature 2015, 528, 119. [Google Scholar] [CrossRef] [PubMed]
  87. Wang, Q.; Adiku, S.; Tenhunen, J.; Granier, A. On the relationship of NDVI with leaf area index in a deciduous forest site. Remote Sens. Environ. 2005, 94, 244–255. [Google Scholar] [CrossRef]
  88. Mutanga, O.; Skidmore, A.K. Narrow band vegetation indices overcome the saturation problem in biomass estimation. Int. J. Remote Sens. 2004, 25, 3999–4014. [Google Scholar] [CrossRef]
  89. Karl, T.R. The Sensitivity of the Palmer Drought Severity Index and Palmer’s Z-Index to their Calibration Coefficients Including Potential Evapotranspiration. J. Clim. Appl. Meteorol. 1986, 25, 77–86. [Google Scholar] [CrossRef]
  90. Quiring, S.M.; Ganesh, S. Evaluating the utility of the Vegetation Condition Index (VCI) for monitoring meteorological drought in Texas. Agric. For. Meteorol. 2010, 150, 330–339. [Google Scholar] [CrossRef]
  91. Jump, A.S.; Ruiz-Benito, P.; Greenwood, S.; Allen, C.D.; Kitzberger, T.; Fensham, R.; Martínez-Vilalta, J.; Lloret, F. Structural overshoot of tree growth with climate variability and the global spectrum of drought-induced forest dieback. Glob. Chang. Biol. 2017, 23, 3742–3757. [Google Scholar] [CrossRef] [PubMed] [Green Version]
  92. Zhang, L.; Xiao, J.; Zhou, Y.; Zheng, Y.; Li, J.; Xiao, H. Drought events and their effects on vegetation productivity in China. Ecosphere 2016, 7, e01591. [Google Scholar] [CrossRef] [Green Version]
  93. Irvine, J.; Perks, M.P.; Magnani, F.; Grace, J. The response of Pinus sylvestris to drought: stomatal control of transpiration and hydraulic conductance. Tree Physiol. 1998, 18, 393–402. [Google Scholar] [CrossRef] [PubMed] [Green Version]
  94. Klein, T.; Cohen, S.; Yakir, D. Hydraulic adjustments underlying drought resistance of Pinus halepensis. Tree Physiol. 2011, 31, 637–648. [Google Scholar] [CrossRef] [PubMed] [Green Version]
  95. Camarero, J.J.; Olano, J.M.; Parras, A. Plastic bimodal xylogenesis in conifers from continental Mediterranean climates. New Phytol. 2010, 185, 471–480. [Google Scholar] [CrossRef] [PubMed]
  96. Noormets, A.; McNulty, S.G.; DeForest, J.L.; Sun, G.; Li, Q.; Chen, J. Drought during canopy development has lasting effect on annual carbon balance in a deciduous temperate forest. New Phytol. 2008, 179, 818–828. [Google Scholar] [CrossRef] [PubMed] [Green Version]
Figure 1. Location of the sampled forest stands in the study domain. Note that the conifer forests (n = 408 sites) dominate in the driest regions (Mediterranean climate) of Eastern and Southeastern Spain, and also in mountainous terrain, while hardwood forests prevail in the wettest and temperate regions (Atlantic climate) in Northwestern and Northern Spain (n = 160 sites).
Forests 09 00524 g001
Figure 2. Box plots showing the Pearson correlation coefficients computed between the seven drought indices and ring-width indices, including (a) TRWi, (b) NDVI max, and (c) NDVI annual. The solid black line corresponds to the median, the white asterisks denote the mean and dashed lines show the significant level at p < 0.05 (light pink) and p < 0.01 (dark pink).
Forests 09 00524 g002
Figure 3. Spatial distribution of the maximum Pearson correlation coefficients computed between the seven drought indices and ring-width indices TRWi (a), NDVI max (b), and integrated annual NDVI (c).
Forests 09 00524 g003
Figure 4. Scatterplots showing maximum Pearson correlation coefficients found for SPEI-TRWi and SPI-NDVIannual (a) and SPEI-TRWi and SPEI-NDVImax (b). The solid red line corresponds to the fitted linear regression model and black line, 1:1.
Forests 09 00524 g004
Figure 5. Box plots showing maximum Pearson correlation coefficients computed between ring-width indices (TRWi, (a)), NDVI max (b), NDVI annual (c), and the most correlated drought index for each tree species. The solid black line corresponds to the median, green asterisks mark the mean and dashed lines show the significance level at p < 0.05 (light pink) and p < 0.01 (dark pink). Species’ codes correspond to those listed in Table 1.
Forests 09 00524 g005
Figure 6. Box plots showing the most correlated timescale found for ring-width indices (TRWi, (a)), NDVI max (b), NDVI annual (c), and the most correlated drought index. The solid black line corresponds to the median, green asterisks mark the means. Species’ codes correspond to those listed in Table 1.
Forests 09 00524 g006
Figure 7. Scatter plots showing the relationship between maximum Pearson correlations found for SPEI-TRWi, SPEI-NDVImax, SPI-NDVIannual, and the average annual water balance of hardwood species (right, dark green) and conifers (left, light green). Solid red line corresponds to the fitted lines of regression models.
Forests 09 00524 g007
Table 1. List of tree species, abbreviations, and number of the sampled forests stands; including the average mean annual temperature and precipitation of each tree species location.
GymnospermsAngiosperms
Tree SpeciesAbbreviationNumber of Sampled Forests StandsMean Annual Temperature (°C)Annual Precipitation (mm)Tree SpeciesAbbreviationNumber of Sampled Forests StandsMean Annual Temperature (°C)Annual Precipitation (mm)
Abies albaABAL4813.101439.98Fagus sylvaticaFASY5114.361212.98
Abies pinsapoABPN1517.531467.33Quercus pyrenaicaQUPY3416.20878.27
Pinus halepensisPIHA11919.93599.87Quercus roburQURO3416.191484.53
Pinus sylvestrisPISY7614.80958.32Quercus fagineaQUFA1916.89975.97
Pinus nigraPINI6617.05754.00Quercus ilexQUIL517.32786.00
Pinus uncinataPIUN3910.111442.68Quercus petraeaQUPE715.581062.13
Pinus pinasterPIPI2018.52705.30Castanea sativaCASA1017.50928.00
Pinus pineaPIPN919.98550.89
Juniperus thuriferaJUTH1617.22690.59
Table 2. Percentage of the sampled forest stands, with the maximum Pearson correlation coefficients found for each forest variable and with each drought index.
TRWiNDVI MaxNDVI Annual
SPEI38.9743.2533.50
SPI35.7332.4853.16
SPDI25.3024.2713.33

