Species Richness of the Family Ericaceae along an Elevational Gradient in Yunnan, China


1
Flower Research Institute of Yunnan Academy of Agricultural Sciences, Kunming 650051, China
2
National Engineering Research Center for Ornamental Horticulture, Kunming 650051, China
3
Institute of South Asia & Southeast Asia Radiation Center, Yunnan Minzu University, Kunming 650504, China
4
Key Laboratory for Economic Plants and Biotechnology, Kunming Institute of Botany, Chinese Academy of Sciences, Kunming 650201, China
*
Author to whom correspondence should be addressed.
Forests 2018, 9(9), 511; https://doi.org/10.3390/f9090511
Submission received: 2 July 2018
/
Revised: 21 August 2018
/
Accepted: 22 August 2018
/
Published: 24 August 2018
(This article belongs to the Special Issue Causes and Consequences of Species Diversity in Forest Ecosystems)
Abstract
:Knowledge about how species richness varies along spatial and environmental gradients is important for the conservation and use of biodiversity. The Ericaceae is a major component of alpine and subalpine vegetation globally. However, little is known about the spatial pattern of species richness and the factors that drive that richness in Ericaceae. We investigated variation in species richness of Ericaceae along an elevational gradient in Yunnan, China, and used a variation partitioning analysis based on redundancy analysis ordination to examine how those changes might be influenced by the mid-domain effect, the species-area relationship, and climatic variables. Species richness varied significantly with elevation, peaking in the upper third of the elevational gradient. Of the factors examined, climate explained a larger proportion of the variance in species richness along the elevational gradient than either land area or geometric constraints. Species richness showed a unimodal relationship with mean annual temperature and mean annual precipitation. The elevational pattern of species richness for Ericaceae was shaped by the combined effects of climate and competition. Our findings contribute to a better understanding of the potential effects of climate change on species richness for Ericaceae.
1. Introduction
Variation in species richness along geographical and environmental gradients is a central topic in the fields of ecology and biogeography because species diversity can influence community stability and ecosystem functioning [1,2,3]. Such research is essential for the conservation and sustainable utilization of biodiversity, especially under the circumstances of global climate change [4]. Species richness in relation to elevation has received extensive attention [4,5] because short geographical distances can produce large climatic gradients as the elevation changes [6]. Thus, elevational gradients provide unique opportunities to test ecological theories and explore the effects of climate change on species richness, and may help us interpret deviations from latitude-related patterns [5].
Several elevational patterns for species richness have been described, such as monotonically decreasing patterns with elevation, monotonically increasing patterns, and unimodal/hump-shaped patterns [3,5,7]; unimodal patterns are more prevalent. In contrast, a study of 118 taxa recorded from mountain-temperate forests to a woody shrub community and alpine meadows in Slovakia, no significant elevational trends were found in species richness [8]. Thus, the elevational patterns of species richness may vary because of differences in sampling method and taxonomic group [3,5,9].
Multiple drivers, including environmental variables, mountain topography, and evolutionary history, may interact to affect the elevational pattern of species richness [1,3,10,11,12]. The mid-domain effect (MDE) and the species-area relationship (SAR) are two hypotheses related to mountain characteristics that have been employed to explain elevational patterns [3,13,14]. The MDE hypothesis states that species richness will peak in the mid-elevation zone because geometric constraints may lead to a greater overlap of species ranges near the midpoint of a mountain [15]. Although the validity of the MDE has been confirmed by many studies [11,13], it has failed to predict plant species richness along a Himalayan elevational gradient [16]. The SAR hypothesis proposes that maximum richness occurs in elevational zones that cover the largest area because more species can be supported there [17]. Its efficacy in explaining the elevational pattern of species richness has been confirmed by an example from the palms of New Guinea [17], but the SAR has little effect on frog species richness in the Hengduan Mountains [13]. This discrepancy among studies may be related to topography because changes in land areas associated with elevation are not uniform among mountain ecosystems [18].
Environmental variables always change with the position and topography of a mountain, and some variables, such as temperature and air pressure, tend to vary predictably along elevational gradients [6]. Because plants species exhibit different degrees of physiological tolerances to environmental stresses, elevational patterns of species richness may be correlated with environmental gradients [4,9,19]. This environment-based hypothesis predicts that species richness will peak at the elevation where the combination of growing conditions is optimal [9,12]. Water and temperature seem to be the main variables that explain elevational gradients of richness [4,19]. Low temperature tolerance may limit the distribution of many plant species [20,21]. For example, a previous study has found that the mean temperature of the coldest quarter of the year is the strongest predictor of species richness for woody plants in China [22]. Higher humidity may contribute to a greater richness of plant species at mid-elevations [4,23]. Species richness at low altitude can be limited by precipitation while at high altitudes it is limited by heat, thus resulting in a high richness at middle altitude [3,24]. However, fern richness shows a unimodal response along a temperature gradient but a linear response to a moisture gradient in the central Himalayas [25]. These differences may be related to the physiological tolerances of species to environmental stresses.
In addition to temperature and water availability, light is important for plant growth and survival. Because light capture by understory species is affected by canopy tree species, competition may be an important factor limiting the number of understory species by affecting seedling recruitment, growth, and survival [26,27,28]. Although a previous study has suggested that the species richness at large scales is dependent largely upon climatic variables [29], several studies have also confirmed that competition plays an important role in regulating regional species pools and species diversity [3,28]. The outcome of competitive exclusion is also correlated with the environment. Competition between species at low altitudes or in favorable growing conditions may be more intense, and its intensity may decrease with increasing elevation [26,27]. At low elevations in humid areas, the formation of hump-shaped pattern of species richness is due to the shaded canopy, which reduces the richness of understory species [3,24]. The degree to which species extend their ranges downwards is much influenced by competition, while the upper limits are determined by temperature-related factors [30]. Thus, the geographical pattern of species richness may be a result of the combined effects of the environment and competition [12,27].
Species richness in relation to elevational gradients may vary among life forms [5,12,24]. For example, Guo et al. suggested that the elevational peaks of herbaceous species richness are higher than those for trees [5]. Whereas the richness of woody plants decreases monotonically with elevation at high elevations in the Qinling Mountains, herbaceous plants present no significant patterns [31]. However, Wang et al. found that species richness for trees, shrubs, and herbs peak within the same elevational range [32]. These patterns of species richness are probably related to the ecological properties of different life forms. For example, maximum tree height may affect competition for light capture in a vertical gradient [33] and tree hydraulic characteristics [34].
Here, we focus on the species richness of Ericaceae. This family is widely distributed in temperate and subarctic regions, and at high elevations in tropical regions, and has a high rate of speciation and species richness in the Eastern Himalayas and southwestern China [35,36]. Rhododendron, the largest genus in Ericaceae, is a major component of alpine and subalpine communities [35]. Yunnan Province in China is recognized as a center of diversification and differentiation for species within Ericaceae, and it harbors more than 50% of all species in this family in China [36,37]. Because spatial patterns of species richness differ among taxonomic groups [38], understanding how the richness of plants in Ericaceae vary with elevation and identifying which factors determine its high species richness in Yunnan would be useful for biogeographical research and biodiversity conservation. However, richness in this family has received little attention so far.
In the current study, we investigated the variation in species richness of Ericaceae along a large elevational gradient in Yunnan Province. We focused on the following questions: (1) How does this richness vary with elevation? And (2) What are the main factors that explain this elevational pattern? We hypothesized that: (1) species richness peaks at the mid-elevation zone due to a combined effect of climatic conditions and mountain geometry, and (2) climatic factors play a more important role in shaping the elevation-related patterns of species richness for Ericaceae than geometric constraints.
2. Materials and Methods
2.1. Study Area
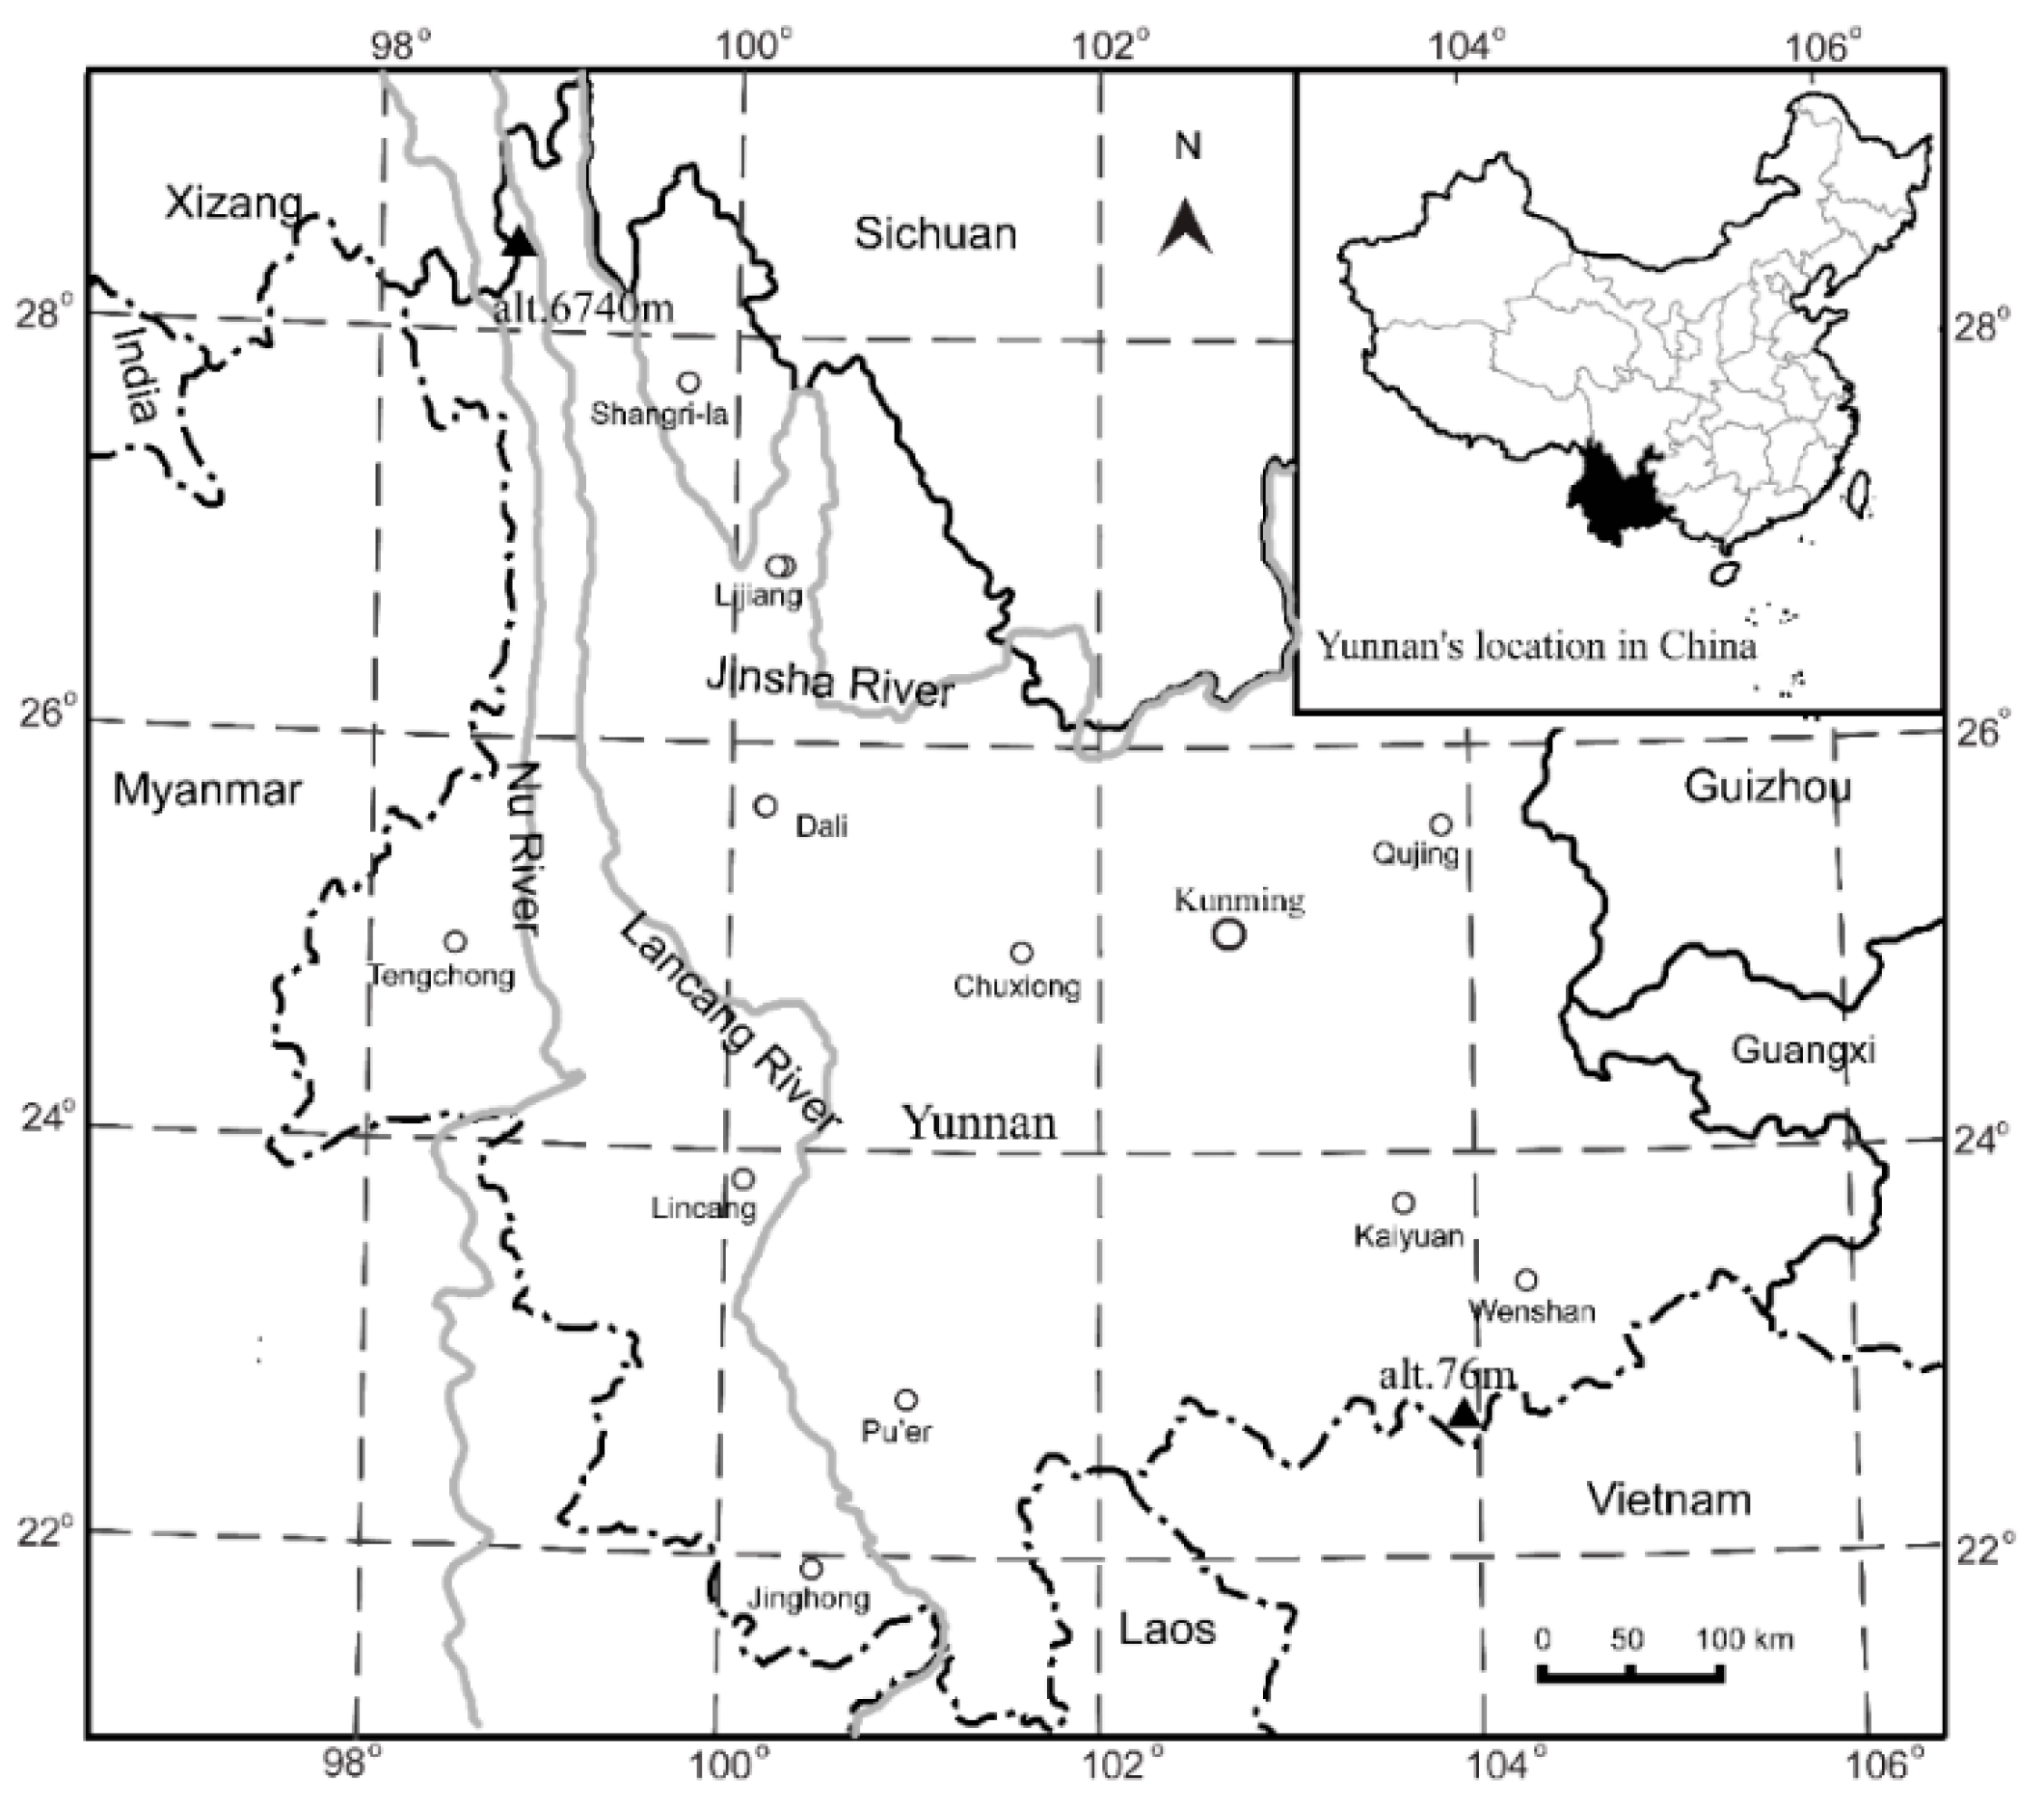
We investigated the species richness of plants within the family Ericaceae over the entire province of Yunnan, China (97°32′–106°15′ E, 21°9′–29°15′ N). Yunnan province in the southwestern part of the country covers approximately 394,000 km2 at the southeastern edge of the Tibetan Plateau. The elevational gradient ranges from 76.4 m above sea level in the southeast to 6740.0 m in the northwest (Figure 1). More than 60% of this area lies in a zone from 1500 m to 3000 m (Figure S1). Much of the province has mild to warm winters and temperate summers, with obvious wet and dry seasons. Over 80% of the total annual precipitation occurs between May and October. Mean annual temperature (MAT) ranges from 5.3 °C to 23.8 °C at 119 meteorological stations, with an elevational lapse rate of 5.1 °C/1000 m. Mean annual precipitation (MAP) ranges from 573.9 mm to 2305.2 mm. It does not significantly change below 1600 m, but gradually decreases above 1600 m (Figure S2). As an important biodiversity hotspot in the world, more than 18,000 species of higher plants grow there [39]. This province hosts a continuous succession from tropical rain forests, subtropical evergreen broadleaved forests, subalpine conifer forests, temperate deciduous broadleaved forests, mossy evergreen dwarf forest, alpine bushes, and meadows (Table S1) [40]. A combination of high species richness and large elevational gradients over relatively short distances makes this locale an ideal place to evaluate elevational effects on species richness.
2.2. Data Sources
All data for species distribution were compiled from two volumes (Tomus 4–5) of the Flora Yunnanica [37,41]. These sources report the lower and upper elevational limits, maximum plant height, and life form for native species, subspecies, and varieties within Ericaceae. Here, we treated “variety” or “subspecies” as individual taxa when diversity is estimated [42]. In all, 425 species belonging to 12 genera were used (Table S2). To explore elevational richness patterns for different life forms, we divided these species into two groups: trees were defined as plants ≥5 m tall while shrubs were defined as plants <5 m high [32]. Thus, species richness was estimated for three species groups: trees, shrubs, and all species. The upper and lower distribution limits were used later for deciding the presence/absence of a species in the elevational band.
The species in our database were distributed from 510 m to 4900 m, and the elevational gradient was divided into 22 elevational bands, at 200-m intervals. Briefly, we firstly decided whether a species was present or not in an elevational band based on its upper and lower limits, and obtained a presence/absence list for each species for each elevational band. Then, we counted the total number of species present in each elevational band. This sum of the species present in each band was considered as the observed species richness [1]. For example, if the elevational range of a species is from 720 m to 1250 m, this species is present at the elevational bands of 701–900 m, 901–1100 m and 1101–1300 m. Then, we summed the number of species present at the elevational band of 901–1100 m to obtain the observed species richness for this elevational band.
We extracted the map of the study area containing elevation information from the global GTOPO 30 map (https://lta.cr.usgs.gov/GTOPO30). This map was then converted into a Lambert-Azimuthal equal area projection map and rasterized on 1 × 1 km grid cells. After counting the number of cells within each elevational band, we calculated the land area from the total number of cells [13] according to a global digital elevation model, with a horizontal grid-spacing of 30 arc-seconds in Envi 4.7 (ITT Exelis, McLean, VA, USA) and ArcGIS 9.3 (ESRI, Redlands, CA, USA).
Climatic data were obtained from the China Meteorological Data Sharing Service System (http://cdc.cma.gov.cn). The database includes mean annual temperature (MAT), mean temperature of the coldest month (MTCM), mean temperature of the warmest month (MTWM), mean annual precipitation (MAP), precipitation of the driest month (PDM), and precipitation of the wettest month (PWM). Because each meteorological station has an exact location (longitude, latitude, and elevation) and the latitudinal gradient is relatively small (approximately 8°) in the study area, we were able to derive the values for these climatic variables within each elevational band by fitting regression models from the climate data of 119 meteorological stations from 137 m to 3468 m above sea level recorded between 1961 and 2004 [13] (Figure S2). Temperature seasonality was defined as the difference between MTWM and MTCM, while precipitation seasonality was calculated as 12 × (PWM-PDM)/MAP [43]. Potential evapotranspiration (PET) was calculated following the FAO Penman-Monteith approach [44]. Although these climate variables were significantly correlated (Table S3), they characterize the availability of environmental resources from different perspectives.
2.3. Data Analysis
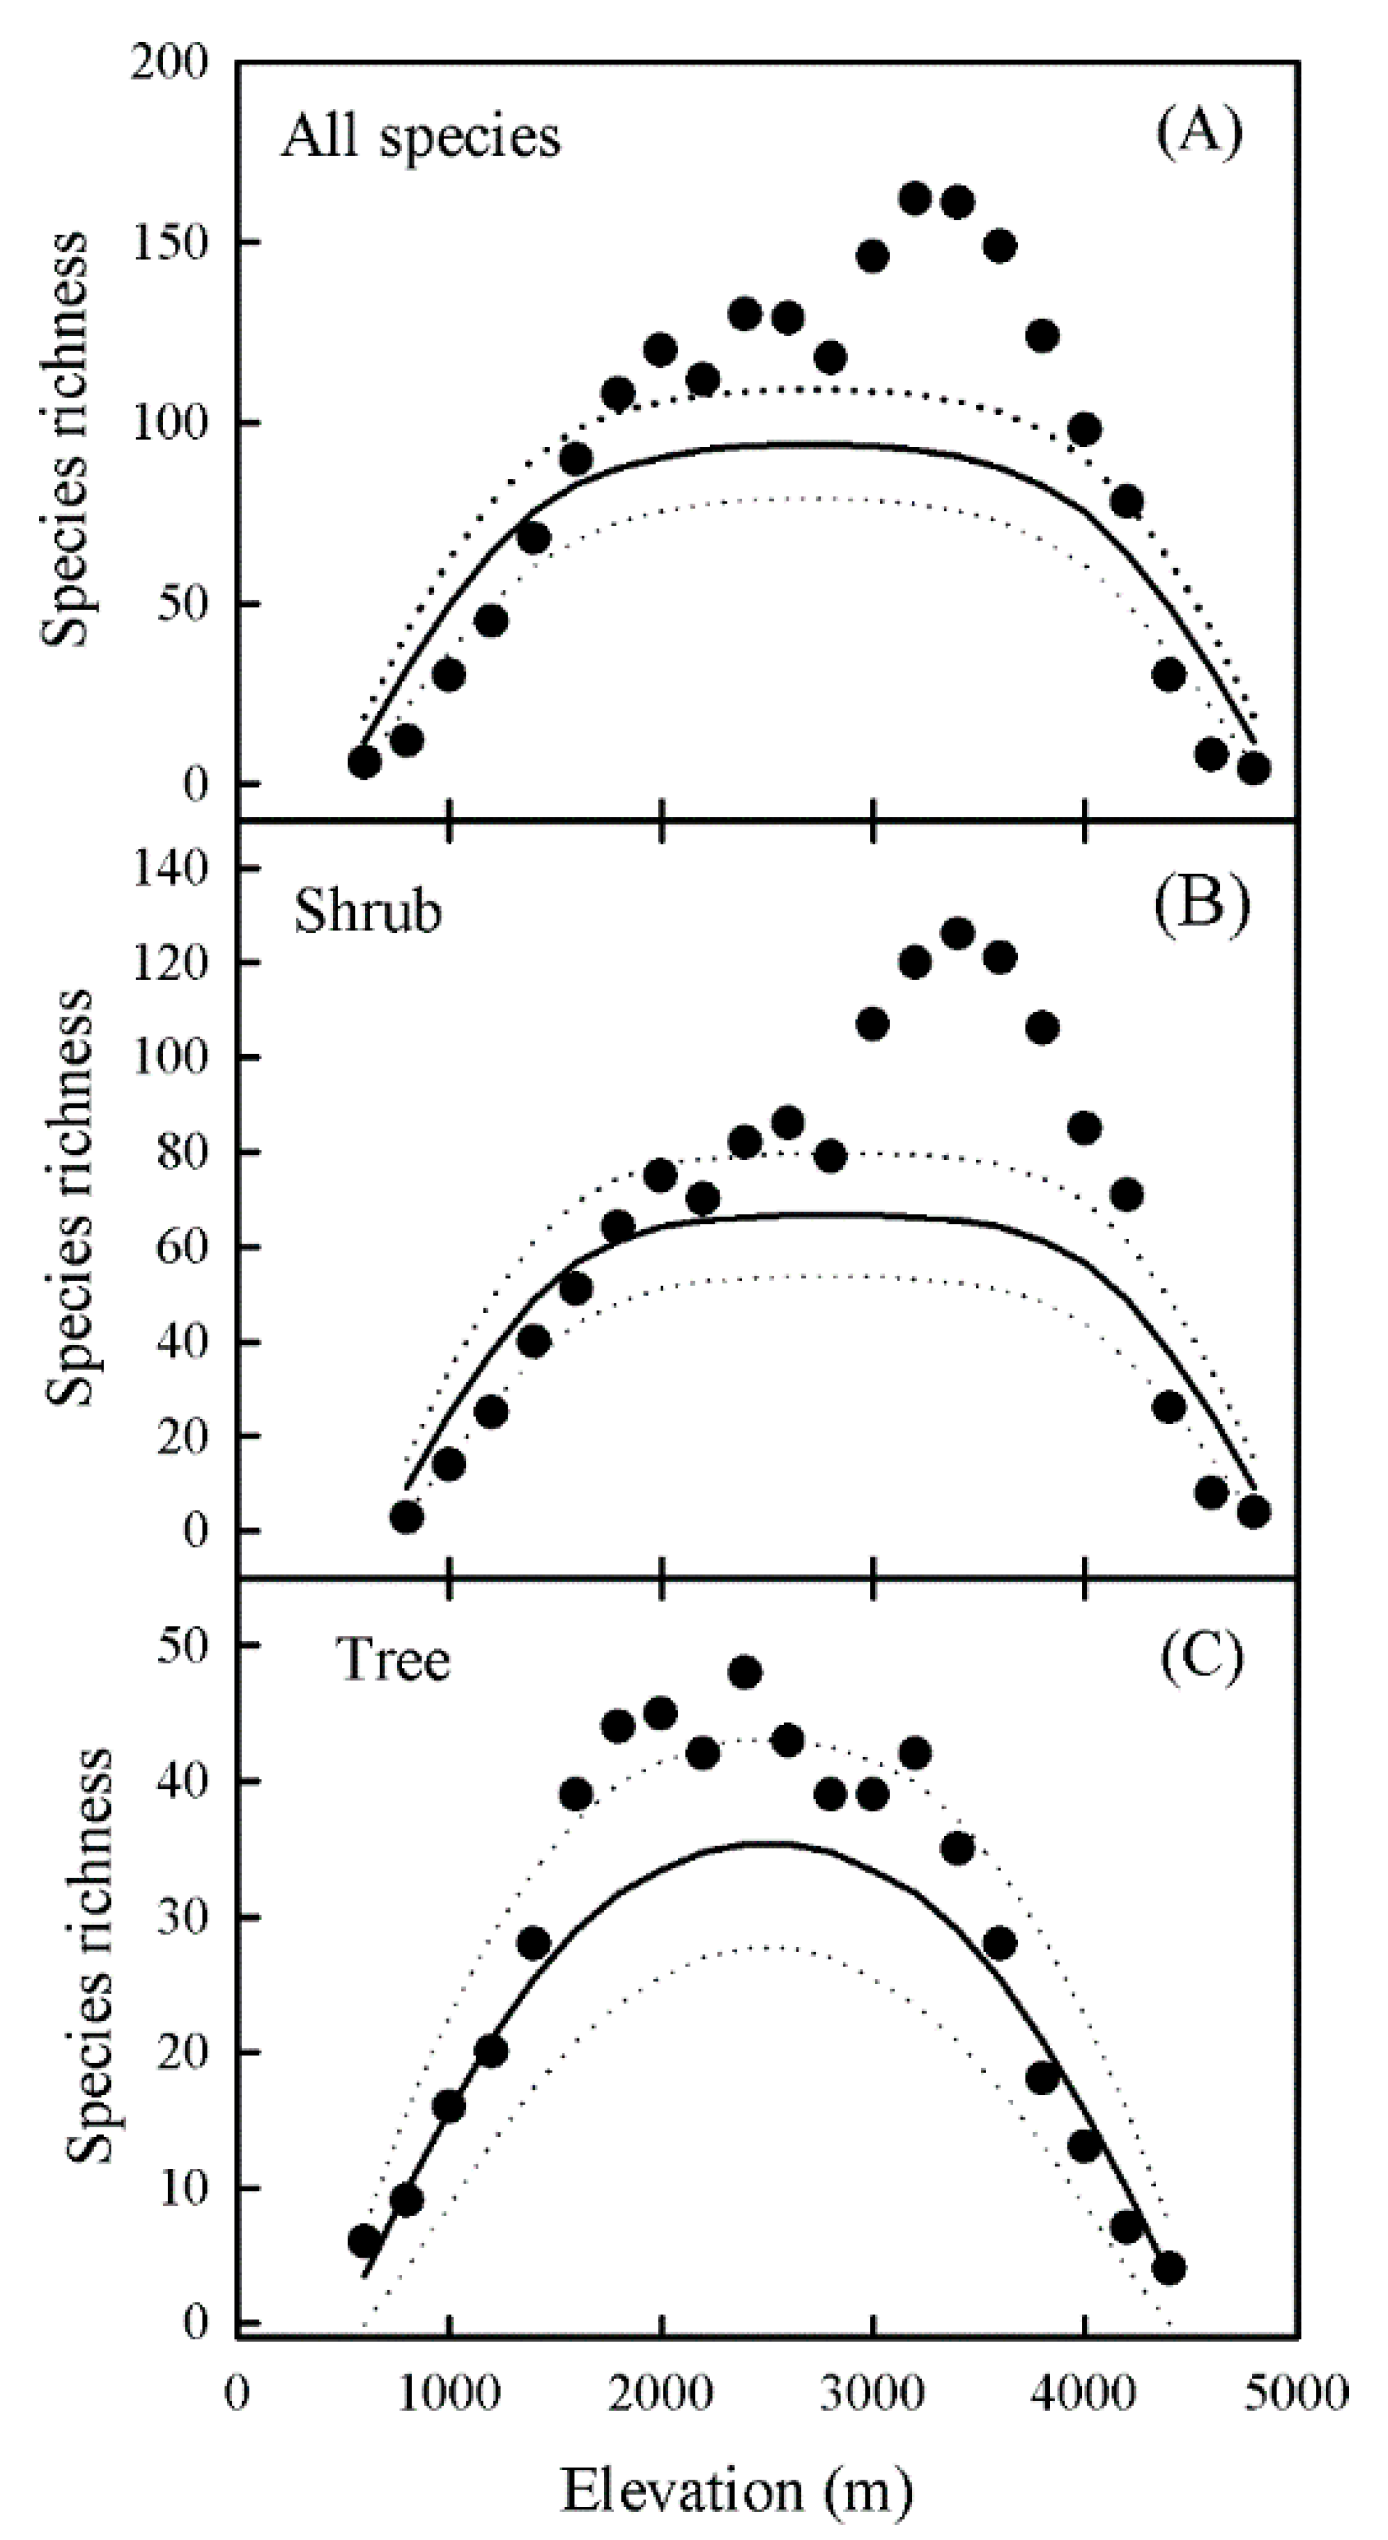
The mid-domain effect was tested by RangeModel [45], which can generate the mean predicted pattern of richness under “pure” geometric constraints. The richness predicted by RangeModel is affected by the number of elevational bands, total number of species, range size frequency distributions (RSFDs), and frequency distribution of a species midpoint. Using the empirical RSFD Model implemented in RangeModel, we ran 10,000 Monte Carlo simulations to generate the mean predicted pattern of species richness and the 95% confidence interval within each band for all species, trees, and shrubs [10] (Figure 2). The predicted richness was then used as an explanatory variable in variation partitioning analyses to explore the influence of the MDE [17].
The species-area relationship was fitted by an Arrhenius’s power function. This function used the logarithm of both sides of the equation to obtain the following linear equation: log(S) = log(c) + z × log(A), where S and A were the number of species and the area covered by each elevational band, respectively. Both c and z were constants.
A variation partitioning analysis, based on redundancy analysis (RDA) ordination, allowed us to determine the independent and shared influences of multiple complementary sets of variables on species richness [46]. We used the “varpart” function of the library “vegan” [47] in the R package 3.4.0 for Windows [48] to determine the contributions of the SAR, the MDE and climate to explain elevational patterns of richness. That function uses an adjusted R2 to assess the partitions explained by the variables and their combinations. The response variable was the presence/absence of species in 22 elevational bands [1]. The explanatory matrices were species richness predicted by the SAR and the MDE, and the environmental matrix containing seven variables (MAT, MAP, PET, PDM, PWM, MTCM, and MTWM). Prior to the analysis, the presence/absence values of species were Hellinger-transformed because such a species matrix contains many zeros [49]. Meanwhile, we also applied the variation partitioning method to explore the relative importance of temperature (including MAT, MTCM, and MTWM) and water availability (MAP, PET, and PDM) toward species richness. Shared variation can be negative due to either suppressor variables or two closely correlated predictors that have strong influences on response variables with opposite signs [50].
To investigate how species richness might vary along elevational and climatic gradients, we ran generalized linear models (the “glm” function in R) to determine the relationships between richness and elevation, and climatic variables. Species richness was used as the response variable while the elevation and climatic variables were the explanatory variables. Before the “glm” function was used, we tested the data distribution of the response variable by using the “ks.test” function and found that these response variables followed a Normal distribution. The elevational peaks of richness for all species, shrubs, and trees were fitted by generalized linear models. We estimated adjusted R2 value for each model. A Wilcoxon test was used to determine the elevational difference between shrubs and trees. All statistical analysis were conducted with the R package 3.4.0 for Windows [48].
3. Results
3.1. Elevational Patterns of Species Richness
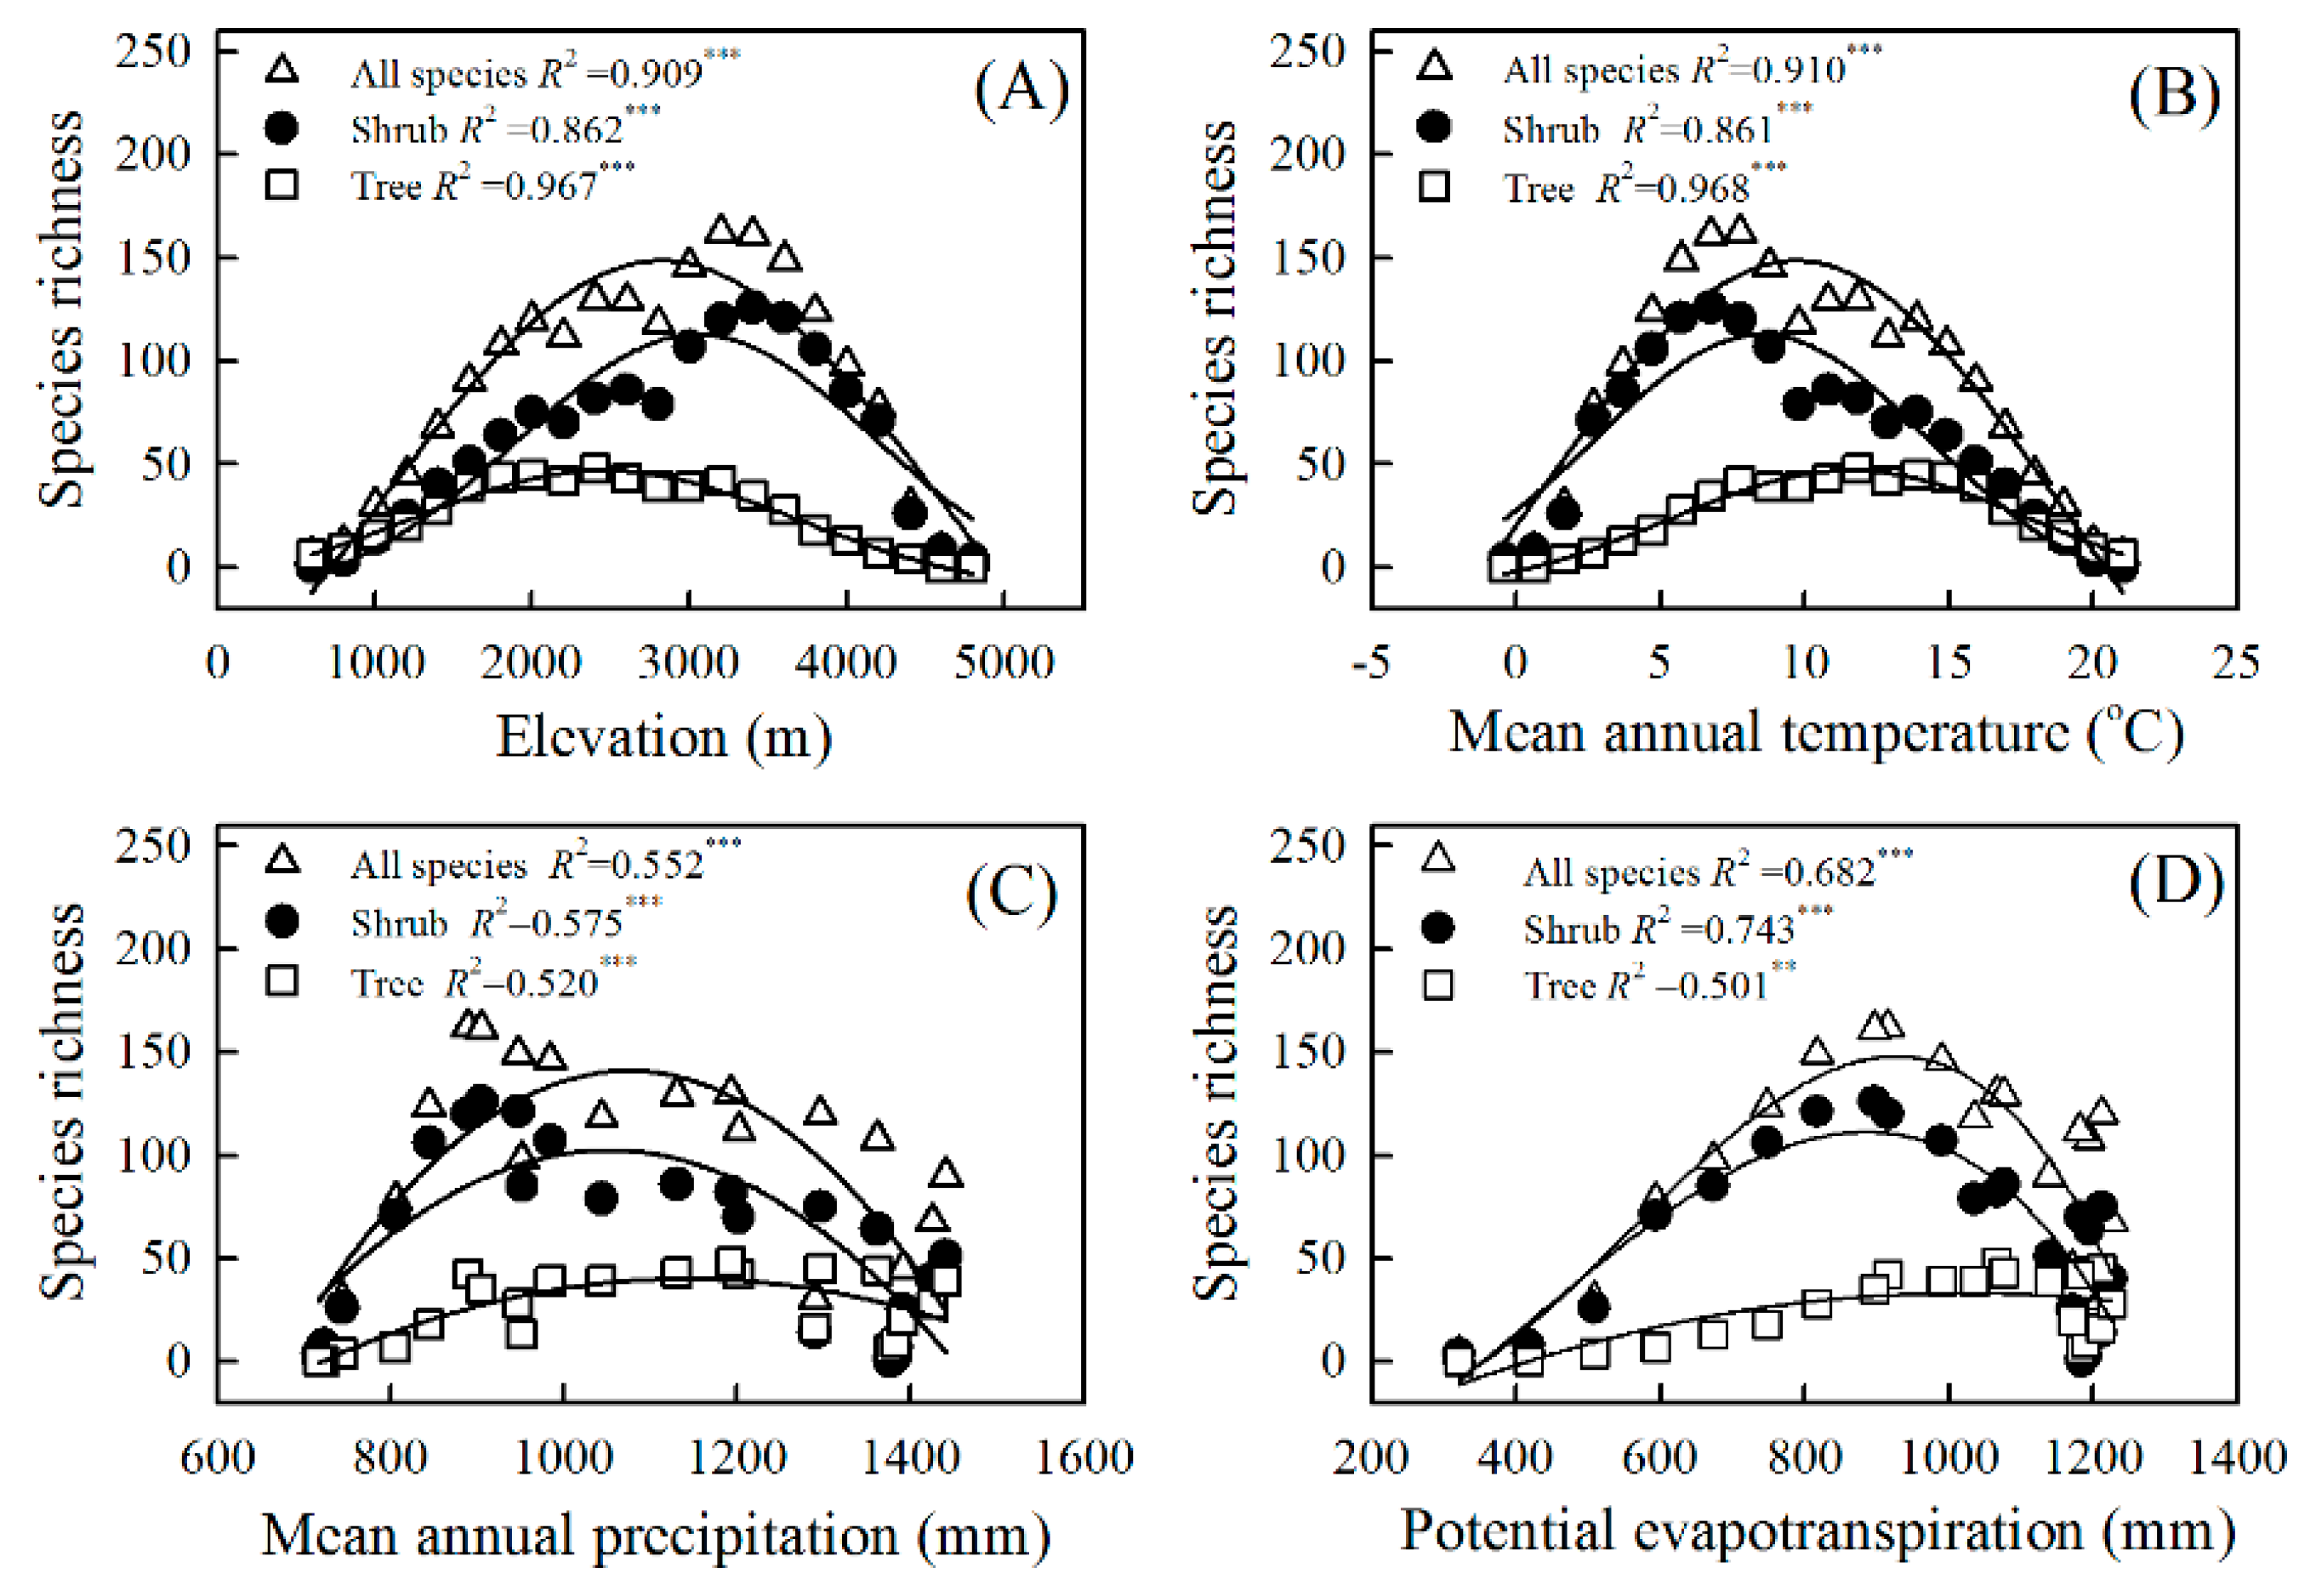
The elevational patterns of richness were decidedly hump-shaped, and the elevational peaks estimated by polynomial models for all species, shrubs, and trees were 2815 m, 3045 m, and 2454 m, respectively (Figure 3). The mean elevation was significantly lower for trees than for shrubs (Figure S3). Multivariate modeling showed that both elevation and life form had significant impacts on species richness, and it revealed an interaction between these two factors (Table 1). Among these models, the model of MAT combined with PET had the lowest AIC value and the highest R2 value, and best explained the species richness of Ericaceae.
3.2. Explanatory Powers of the MDE, the SAR, and Climate for Elevational Patterns of Richness
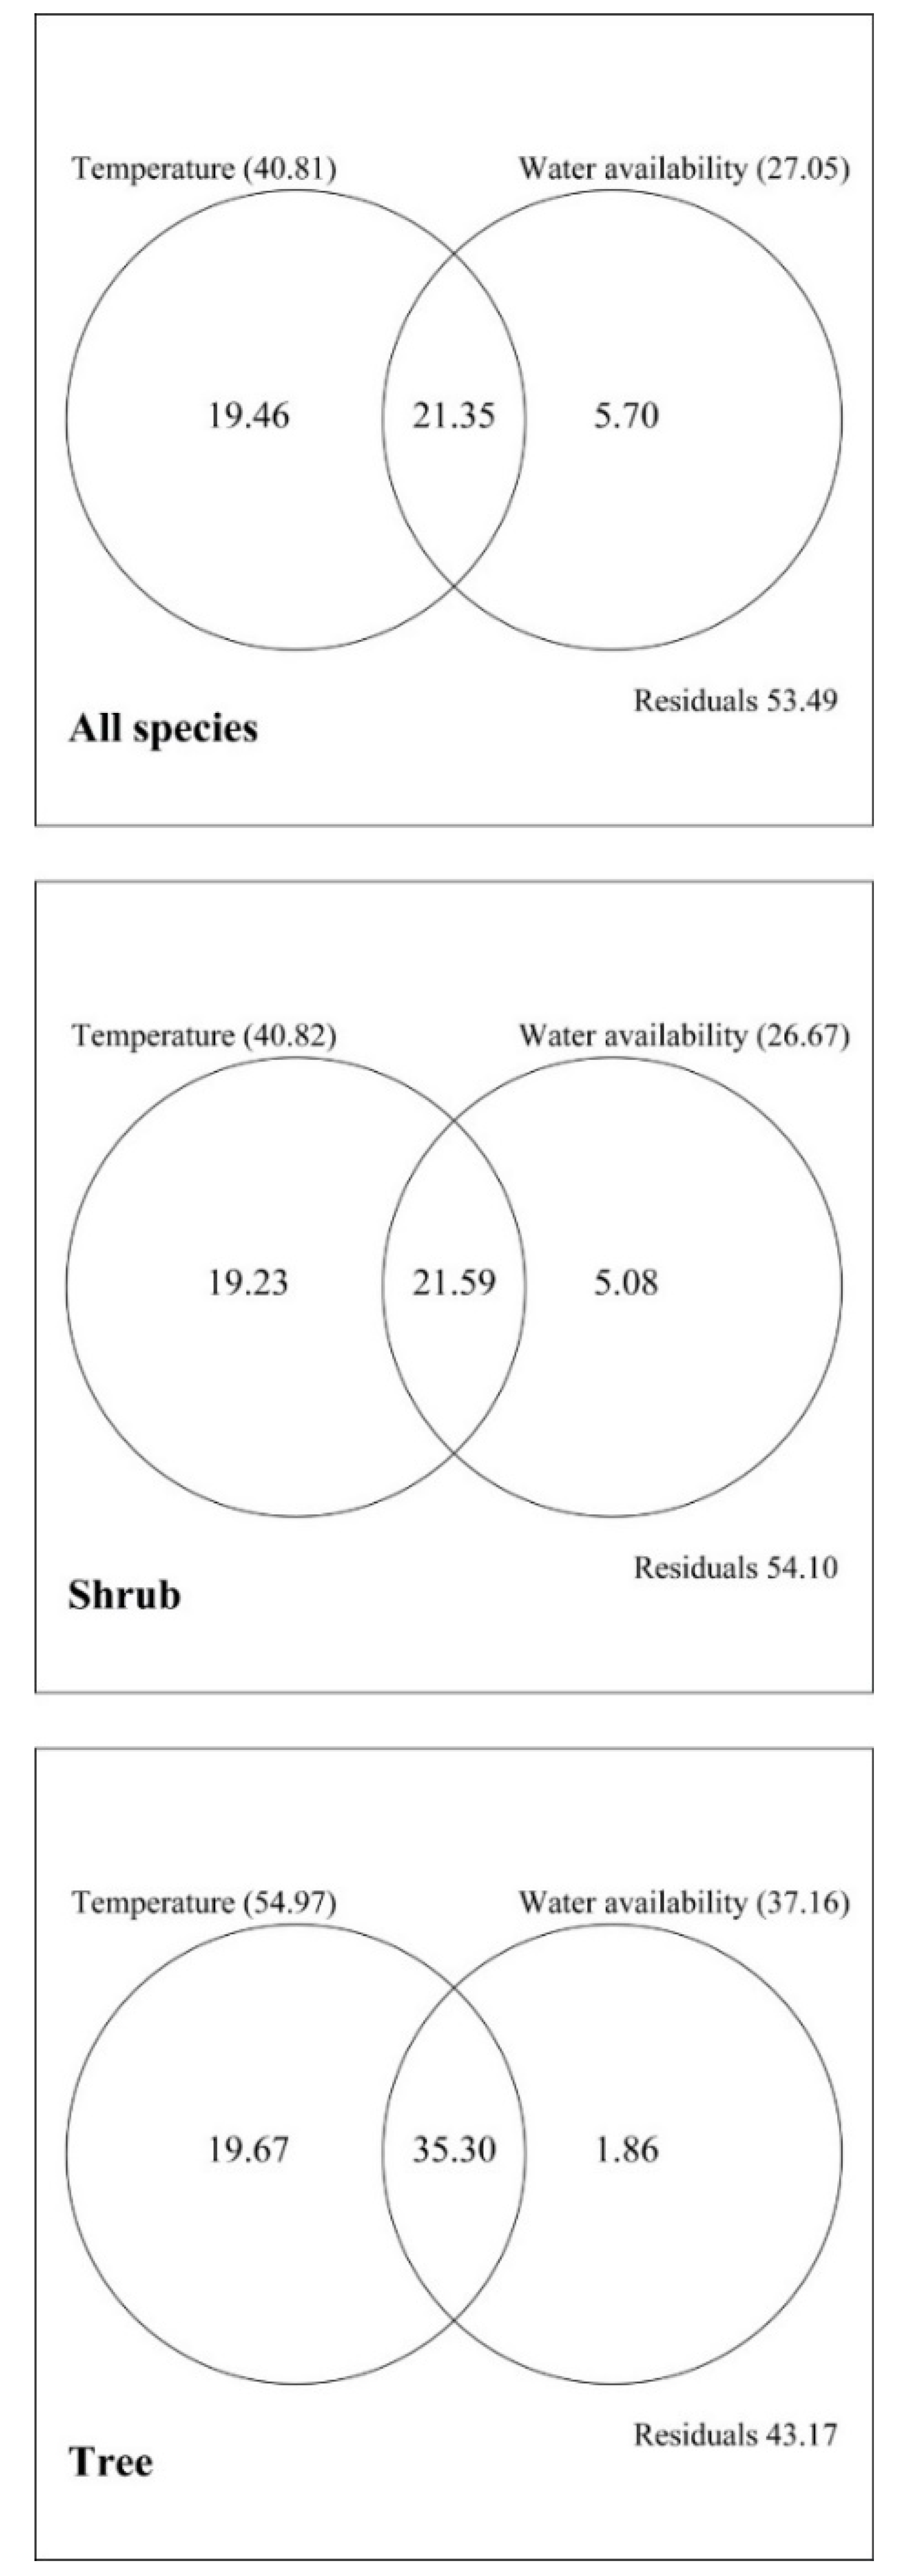
Temperature (MAT, MTCM, and MTWM) and water availability (MAP, PDM, and PWM) had significant effects on species richness (Figure 3, Table 1 and Table 2), with the explanatory power being higher for the former than for the latter when all species, shrubs, and trees were considered (Figure 3 and Figure 4). In addition, richness was significantly influenced by temperature seasonality but not by precipitation seasonality (Table 2). Although species richness presented unimodal patterns along temperature gradients, it peaked at a higher MAT level for trees than for shrubs (Figure 3).
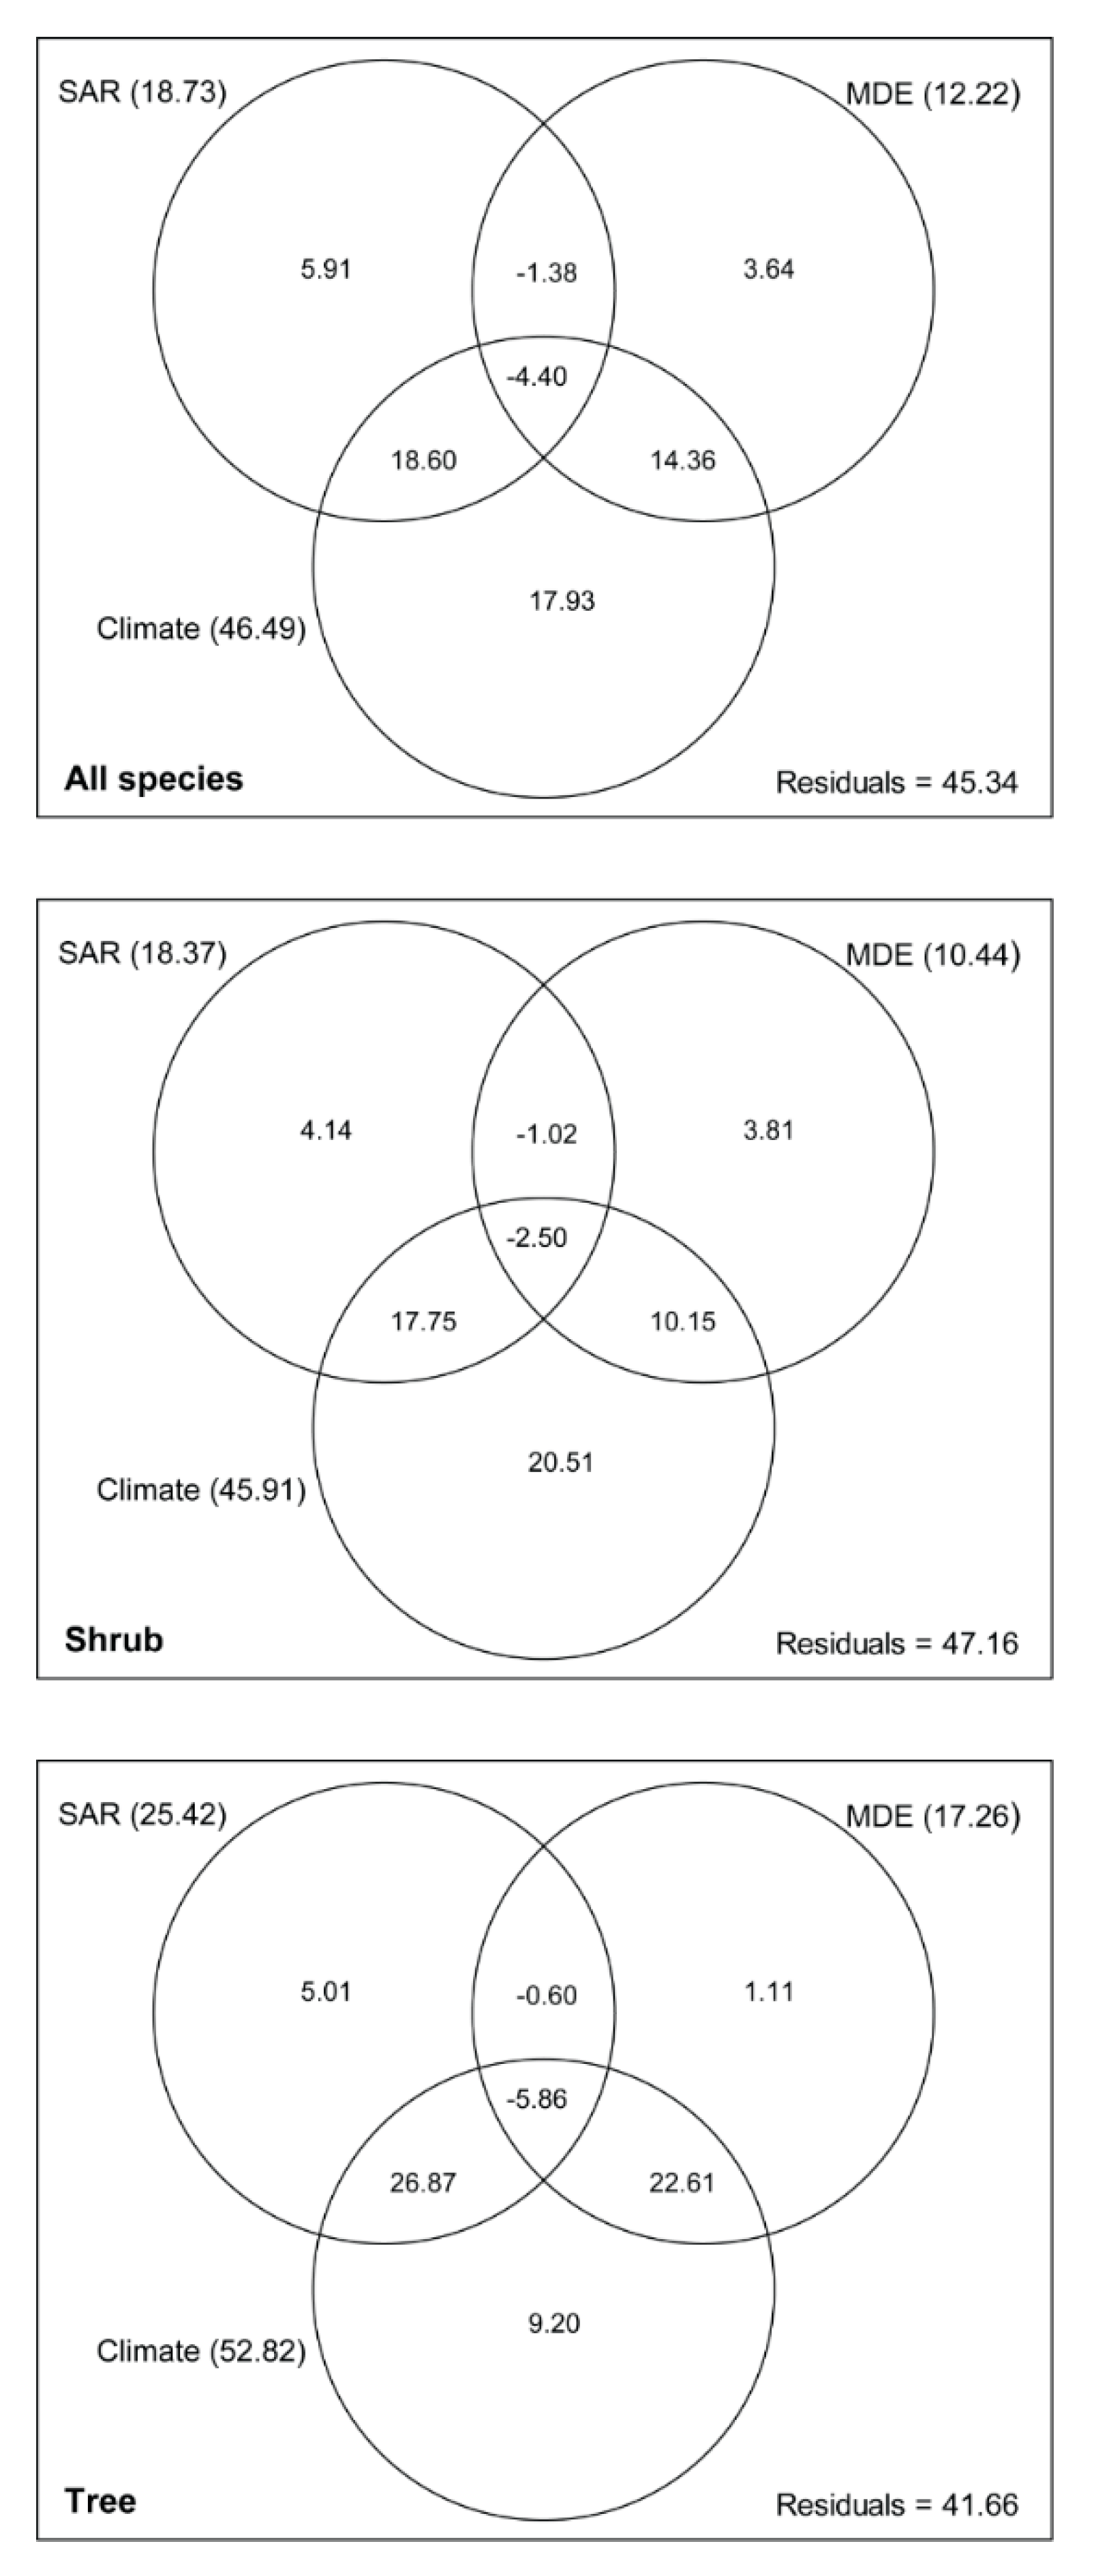
The partitioning analysis showed that the MDE, the SAR, and climate together explained 54.66%, 52.84%, and 58.44% of the variance for all species, shrubs, and trees, respectively, with climate accounting for the largest proportion (Figure 5). When all species were considered, the individual contributions of the SAR, the MDE, and climate were 5.91%, 3.64%, and 17.93%, respectively. By comparison, the total contributions (including independent and shared effects) of the SAR, the MDE, and climate were 18.73%, 12.22%, and 46.49%, respectively. Finally, the explanatory powers of the SAR, the MDE, and climate were higher for trees than for shrubs.
4. Discussion
We characterized the elevational patterns of species richness in Ericaceae within Yunnan Province for the first time, and found that richness showed a hump-shaped relationship with elevation, producing the maximum value at 2815 m. Such elevational pattern of species richness is also observed on other woody plants in this area [32,51,52]. The hump-shaped pattern along an elevational gradient has been identified for many other habitats and plant taxa worldwide [5,25], and may result from a variety of factors, such as the combination of suitable temperature with higher humidity at mid-elevations, and the greater overlap of species ranges near the middle of the elevational gradients [7,9,10,38]. However, the main factors that drive these patterns can differ across taxonomical groups or mountains [3,38].
We found that the elevational patterns of species richness in Ericaceae was influenced by climate, the species-area relationship, and the mid-domain effect. However, for trees, shrubs, and all species combined, both the independent contribution and total contribution of climate to species richness were obviously higher than those of the MDE and the SAR. Other researchers have confirmed that climate contributes more than geometric constraints to the hump-shaped pattern of richness along geographic gradients [13,19]. The skew in maximum richness toward higher elevations may indicate the strong influence of climate [10]. Climate potentially affects the metabolism and survival of an organism and, therefore, its geographical distribution [53]. The explanatory power of climate on species richness was higher for trees than for shrubs. This was in line with other data about woody plants in China [22] and reflected functional and physiological differences between trees and shrubs [34,54]. Tree and shrub distributions are associated with environmental gradients [55]. For example, the spatiotemporal variation in soil water availability and species drought resistance may have roles in determining species distribution [56]. Thus, our study indicated that climate might be an important driver for elevational patterns of species richness in Ericaceae, and the distributions of trees were more sensitive to environments than shrubs.
The important roles of temperature and water availability in explaining elevational gradients of species richness have been validated previously [4,42]. Here, we found that the explanatory powers of MAT, MTCM, and MTWM were higher than those of MAP, PDM, and PWM. Previous studies have suggested that the interrelationship between water and energy controls the physiological activities and biomass accumulation of plants, which determines the geographical pattern of species diversity. Species richness of plants can increase with precipitation, but water becomes ice under too low temperature conditions and is easily evaporated under high temperature conditions, which affects the normal physiological processes of plants. Thus, species diversity and energy have a hump-shaped pattern [3,57]. These indicated that the effects of temperature and precipitation on species richness in Ericaceae were coupled.
The freezing-tolerance hypothesis has been validated in a study of species richness for woody plants [22]. We noted that, when compared with temperature seasonality, MTCM and MTWM had relatively larger explanatory powers on species richness. Although many Rhododendron species are very tolerant of low temperatures [58], cold climates at high altitudes may slow soil formation, the physiological activities and growth of plants [51]. Embolisms that are induced by freezing conditions can reduce the hydraulic conductivity of species in Rhododendron, possibly blocking water transport from the roots to the leaves [58]. Extremely cold temperatures can represent a boundary for the survival of Rhododendron species [20]. Here, we found that species richness of plants within Ericaceae peaked at a lower temperature for shrubs than for trees. Wang et al. reported a negative correlation between elevation and plant height in their study of 42 rhododendrons on the Tibetan Plateau [59]. Shorter plants may help compensate for the difficulty in supplying water to leaves [34] and enhance the adaptability of plants to lower temperatures at higher elevations. In addition, the energy-diversity hypothesis states that each population needs a certain amount of energy to maintain its survival and reproduction, and species richness can be affected by the energy per unit area [3,53,57]. In the case of unrestricted water, there is a globally consistent relationship between species richness and temperature for angiosperms [60]. Here, we found a close relationship between MAT and species richness, and the combination of MAT and PET could better explain the elevational patterns of species richness in Ericaceae. These indicated that the energy change along the elevational gradient and temperature filtering may be the main factors affecting species distribution and richness for Ericaceae in Yunnan.
Water availability is another major correlate for the elevational patterns of species richness [3,25], and can regulate the relationship between species diversity and temperature [60]. Under the condition of adequate moisture, the species richness of trees and shrubs are closely related to MAT, while under the condition of insufficient water, the richness of woody plants is positively correlated with precipitation [3]. A previous study has noted that the highest richness for most organisms in the American Southwest is found at mid-elevations due to the lack of water at lower elevations [23]. Here, we found that species richness for Ericaceae was significantly correlated with MAP, PDM, and PWM, although the relative importance of water availability in explaining the elevational pattern of richness was smaller than temperature. Rhododendron ferrugineum L. is thought to be particularly affected by short periods of scarce rainfall, which negatively affects leaf gas exchange [61]. Snow cover during winter provides protection for the plants at high elevation. A reduction in snow cover may increase the frequency and intensity of the freeze-thaw process [62]. Thus, water availability contributed to the humped-pattern of richness for the Ericaceae along an elevational gradient.
A larger land area may contribute to higher species diversity because increased space can accommodate more species and support greater habitat heterogeneity [9,14]. Although some previous studies have found that area effects can account for a substantial portion of the variability in elevational diversity patterns [13,14,17], it is a poor predictor of elevational fern diversity in Costa Rica [11]. This may be because the impact of area on species richness can be counteracted by some environmental factors associated with elevation [6]. Our data showed that over 18% of the variation in species richness for Ericaceae along the elevational gradient was explained by the SAR, but this was shared by climatic factors. Thus, land area had some influence on the elevational pattern of species richness for Ericaceae, even though it contributed more to species richness for trees than for shrubs. Our finding demonstrated that the extent to which SAR explained elevational species richness depended upon the life form of the studied taxa.
The geometric characteristic of mountains has a critical role in shaping elevational patterns [11,17]. The influence of the MDE on species richness has previously been demonstrated [11,15,17]. A previous study has suggested that MDE is an important factor explaining the elevational pattern of species richness for Ericaceae in Gaoligong mountains [52]. However, we found that the explanatory power of the MDE was smaller than that of climate, or of the SAR. Meanwhile, a large portion of the MDE was shared with climate. Similarly, the MDE has not proven to be a main mechanism determining the richness of vascular plants in Crete [14]. In fact, the extent to which the MDE can effectively explain spatial patterns of richness differ among various studies due to the interaction of mountain mass effects with climatic factors [10,11,19]. Thus, for the family Ericaceae in Yunnan, the MDE was not a key mechanism that explained the elevational pattern of species richness.
Last, competition may serve as a filter preventing species from colonizing a site, therefore affecting local species diversity [3,28,63,64]. The environment determines community composition not only via survival, but also by influencing competition. Patterns of species richness across gradients depend on the interaction between individual species’ range of tolerance and competition [64]. Here, although we found that climate was the most important driver of elevational pattern of species richness in Ericaceae, the role of competition could not be ignored. Below 1600 m, there was no significant change in precipitation along the elevational gradient, but species richness increased with elevation. This indicated that below 1600 m, precipitation was not responsible for the variation in species richness. Previous studies have confirmed that at lower altitudes, water and heat resources are sufficient and productivity is high, but competition for light resource is intense [26,27,28], and a dense canopy may buffer climate effects [65]. In fact, the maximum canopy height of main vegetation types below 1600 m in Yunnan are almost above 20 m (Table S1), but only <10 species in Ericaceae have a maximum height of more than 15 m [37,41]. Maximum tree height in part reflects the ability of plants to compete for light resource [33]. Because of their low statures, the growth and diversity of most species in Ericaceae are depressed by competition from tall trees at low elevations, and only a few species (in the genus Agapetes) grow as epiphytes in tropical rainforest, tropical monsoon forest, and montane rainforest. With increasing elevation, competition from other tree species is gradually weakened, and many species, such as Cassiope and Rhododendron, are species-rich, and may dominate mossy evergreen dwarf forests and alpine shrub lands [52]. At higher elevations (>3000 m), the growth and distribution of plants in Ericaceae is limited by lower temperatures. Our study supported the idea that observed elevational gradients in species richness results from a combination of ecological and evolutionary processes, rather than from the independent effect of one overriding force [9,11,12]. Species diversity within Ericaceae was regulated by the competition from other tree species at lower elevations, by the reduced competition and suitable climates at middle elevations, and by the decreased temperature and energy at higher elevations.
5. Conclusions
The species richness within Ericaceae of Yunnan Province in China varied significantly along an elevational gradient, presenting a humped pattern showing that species richness peaked in the upper third of the elevational gradient. We confirmed that the species richness for Ericaceae along the elevational gradient was influenced by multiple interacting factors. Climate explained a larger proportion of the variance in observed richness, but the elevational pattern of species richness for Ericaceae reflected the combined effects of the environment and competition.
We have found that climate had an important role in explaining the elevational pattern of species richness. However, the effects of environmental factors on physiology and productivity in Ericaceae are still unclear, and a deep understanding is lacking about the relationship between richness and climate. Therefore, it will be interesting to conduct field research that explores synthetically the variations in plant physiology, productivity and species richness along elevational gradients.
Supplementary Materials
The following are available online at https://www.mdpi.com/1999-4907/9/9/511/s1, Figure S1: Land area associated with each elevational band, Figure S2: Variations in mean annual temperature and mean annual precipitation with elevation (A,C), and monthly temperature and precipitation at different elevations (B,D) based on the records of 119 meteorological stations between 1961 and 2004 in Yunnan. The value in parenthesis shows the elevations at each meteorological station, Figure S3: Mean elevation of trees and shrubs with Ericaceae in Yunnan. The elevational difference between trees and shrubs was tested by a Wilcoxon test, Table S1: Elevations, dominant species and canopy heights of main vegetations in Yunnan, Table S2: Number of species and life form in each genus of the family Ericaceae in Yunnan, Table S3: Bivariate relationships (r) among explanatory variables.
Author Contributions
J.-H.W. and S.-B.Z. conceived and designed the experiments; Y.-F.C., L.Z. and C.-K.X. collected and analyzed the data; J.-H.W. and S.-B.Z. wrote the manuscript.
Funding
This research was funded by the National Natural Science Foundation of China [grant number 31460217, 31670342], and by the Scientific and Technological Leading Talent Project of Yunnan Province [grant number 2016HA005].
Acknowledgments
We would like to thank Ying-Feng Bi for calculating the land area at each elevational band. We are also very grateful to the editors and two anonymous reviewers for their valuable suggestions and comments to improve the quality of our paper.
Conflicts of Interest
The authors declare no conflict of interest.
References
- Grytnes, J.A.; Vetaas, O.R. Species richness and altitude: A comparison between null models and interpolated plant species richness along the Himalayan altitudinal gradient, Nepal. Am. Nat. 2002, 159, 294–304. [Google Scholar] [CrossRef] [PubMed]
- Song, C.Y.; Cao, M.C. Relationships between plant species richness and terrain in middle sub-tropical eastern China. Forests 2017, 8, 344. [Google Scholar] [CrossRef]
- Tang, Z.Y.; Fang, J.Y. A review on the elevational patterns of plant species diversity. Biodivers. Sci. 2004, 12, 20–28. [Google Scholar]
- Zhang, S.-B.; Chen, W.-Y.; Huang, J.-L.; Bi, Y.-F.; Yang, X.-F. Orchid species richness along elevational and environmental gradients in Yunnan, China. PLoS ONE 2015, 10, e0142621. [Google Scholar] [CrossRef] [PubMed]
- Guo, Q.F.; Kelt, D.A.; Sun, Z.Y.; Liu, H.X.; Hu, L.J.; Ren, H.; Wen, J. Global variation in elevational diversity patterns. Sci. Rep. 2013, 3, 3007. [Google Scholar] [CrossRef] [PubMed]
- Körner, C. The use of ‘altitude’ in ecological research. Trends Ecol. Evol. 2007, 22, 569–574. [Google Scholar] [CrossRef] [PubMed]
- Rahbek, C. The elevational gradient of species richness: A uniform pattern? Ecography 1995, 18, 200–205. [Google Scholar] [CrossRef]
- Doležal, J.; Šrůtek, M. Altitudinal changes in composition and structure of mountain-temperate vegetation: A case study from the Western Carpathians. Plant Ecol. 2002, 158, 201–221. [Google Scholar] [CrossRef]
- Lomolino, M.V. Elevation gradients of species-density: Historical and prospective views. Glob. Ecol. Biogeogr. 2001, 10, 3–13. [Google Scholar] [CrossRef]
- McCain, C.M. Elevational gradients in diversity of small mammals. Ecology 2005, 86, 366–372. [Google Scholar] [CrossRef]
- Kluge, J.; Kessler, M.; Robert, R.; Dunn, R.R. What drives elevational patterns of diversity? A test of geometric constraints, climate and species pool effects for pteridophytes on an elevational gradient in Costa Rica. Glob. Ecol. Biogeogr. 2006, 15, 358–371. [Google Scholar] [CrossRef]
- Rai, H.; Khare, R.; Baniya, C.B.; Upreti, D.K.; Gupta, R.K. Elevational gradients of terricolous lichen species richness in the Western Himalaya. Biodivers. Conserv. 2015, 24, 1155–1174. [Google Scholar] [CrossRef]
- Fu, C.Z.; Hua, X.; Li, J.; Chang, Z.; Pu, Z.C.; Chen, J.K. Elevational patterns of frog species richness and endemic richness in the Hengduan Mountains, China: Geometric constraints, area and climate effects. Ecography 2006, 29, 919–927. [Google Scholar] [CrossRef]
- Trigas, P.; Panitsa, M.; Tsiftsis, S. Elevational gradient of vascular plant species richness and endemism in Crete—The effect of post-isolation mountain uplift on a continental island system. PLoS ONE 2013, 8, e59425. [Google Scholar] [CrossRef] [PubMed]
- Colwell, R.K.; Rahbek, C.; Gotelli, N.J. The mid-domain effect and species richness patterns: What have we learned so far? Am. Nat. 2004, 163, E1–E23. [Google Scholar] [CrossRef] [PubMed]
- Carpenter, C. The environmental control of plant species density on a Himalayan elevation gradient. J. Biogeogr. 2005, 32, 999–1018. [Google Scholar] [CrossRef]
- Bachman, S.; Baker, W.J.; Brummitt, N.; Dransfield, J.; Moat, J. Elevational gradients, area and tropical island diversity: An example from the palms of New Guinea. Ecography 2004, 27, 299–310. [Google Scholar] [CrossRef]
- Elsen, P.R.; Tingley, M.W. Global mountain topography and the fate of montane species under climate change. Nat. Clim. Chang. 2015, 5, 772–776. [Google Scholar] [CrossRef]
- Currie, D.J.; Kerr, J.T. Tests of the mid-domain hypothesis: A review of the evidence. Ecol. Monogr. 2008, 78, 3–18. [Google Scholar] [CrossRef]
- Vetaas, O.R. Realized and potential climate niches: A comparison of four Rhododendron tree species. J. Biogeogr. 2002, 29, 545–554. [Google Scholar] [CrossRef]
- Körner, C. Alpine Plant Life: Functional Plant Ecology of High Mountain Ecosystem, 2nd ed.; Springer: Berlin/Heidelberg, Germany, 2003. [Google Scholar]
- Wang, Z.H.; Fang, J.Y.; Tang, Z.Y.; Lin, X. Patterns, determinants and models of woody plant diversity in China. Proc. R. Soc. B. Biol. Sci. 2010. [Google Scholar] [CrossRef] [PubMed]
- Brown, J.H.; Lomolino, M.V. Biogeography, 2nd ed.; Sinauer Associates: Sunderland, MA, USA, 1998. [Google Scholar]
- Wang, G.H.; Zhou, G.S.; Yang, L.M.; Li, Z.Q. Distribution, species diversity and life-form spectra of plant communities along an altitudinal gradient in the northern slopes of Qilianshan Mountains, Gansu, China. Plant Ecol. 2003, 165, 169–181. [Google Scholar] [CrossRef]
- Bhattarai, K.R.; Vetaas, O.R.; Grytnes, J.A. Fern species richness along a central Himalayan elevational gradient, Nepal. J. Biogeogr. 2004, 31, 389–400. [Google Scholar] [CrossRef]
- Grime, J.P. Plant Strategies and Vegetation Processes; John Wiley & Sons, Ltd.: Chichester, UK, 1979. [Google Scholar]
- Kubota, Y.; Murata, H.; Kikuzawa, K. Effects of topographic heterogeneity on tree species richness and stand dynamics in a subtropical forest in Okinawa Island, southern Japan. J. Ecol. 2004, 92, 230–240. [Google Scholar] [Green Version]
- Michalet, R.; Maalouf, J.-P.; Choler, P.; Clément, B.; Rosebery, D.; Royer, J.-M.; Schöb, C.; Lortie, C.J. Competition, facilitation and environmental severity shape the relationship between local and regional species richness in plant communities. Ecography 2015, 38, 335–345. [Google Scholar] [CrossRef] [Green Version]
- Whittaker, R.J.; Katherine, J.W. Scale and species richness: Towards a general, hierarchical theory of species diversity. J. Biogeogr. 2001, 28, 453–470. [Google Scholar] [CrossRef]
- Ergeton, J.J.G.; Wilson, S.D. Plant competition over winter in alpine shrubland and grassland, Snowy Mountains, Australia. Arct. Alp. Res. 1993, 25, 124–129. [Google Scholar]
- Tang, Z.-Y.; Ke, J.-H. Altitudinal patterns of plant species diversity in Mt. Niubeiliang, Qinling Mountains. Biodivers. Sci. 2004, 12, 108–114. [Google Scholar]
- Wang, Z.; Tang, Z.; Fang, J. Altitudinal patterns of seed plant richness in the Gaoligong Mountains, south-east Tibet, China. Divers. Distrib. 2007, 13, 845–854. [Google Scholar] [CrossRef]
- Aiba, S.; Kohyama, T. Tree species stratification in relation to allometry and demography in a warm-temperate rain forest. J. Ecol. 1996, 84, 207–218. [Google Scholar] [CrossRef]
- Ryan, M.G.; Yoder, B.J. Hydraulic limits to tree height and tree growth. Bioscience 1997, 47, 235–242. [Google Scholar] [CrossRef]
- Singh, K.K.; Kumar, S.; Rai, L.K.; Krishn, A.P. Rhododendrons conservation in the Sikkim Himalaya. Curr. Sci. 2003, 85, 602–606. [Google Scholar]
- Fang, M.; Fang, R.; He, M.; Hu, L.; Yang, H.; Qin, H.; Min, T.; Chamberlain, D.F.; Stevens, P.F.; Wallace, G.D.; et al. Flora of China; Science Press: Beijing, China; Missouri Botanical Garden Press: St. Louis, MO, USA, 2005; Volume 14, pp. 242–517. [Google Scholar]
- Wu, Z.Y. Flora Yunnanica (Tomus 4); Science Press: Beijing, China, 1986. [Google Scholar]
- Kessler, M. Elevational gradients in species richness and endemism of selected plant groups in the central Bolivian Andes. Plant Ecol. 2000, 149, 181–193. [Google Scholar] [CrossRef]
- Yang, Y.M.; Tian, K.; Hao, J.M.; Pei, S.J.; Yang, Y.X. Biodiversity and biodiversity conservation in Yunnan, China. Biodivers. Conserv. 2004, 13, 813–826. [Google Scholar] [CrossRef]
- Wu, Z.Y.; Zhu, Y.C. Vegetation of Yunnan; Science Press: Beijing, China, 1987. [Google Scholar]
- Wu, Z.Y. Flora Yunnanica (Tomus 5); Science Press: Beijing, China, 1991. [Google Scholar]
- Wolf, J.H.D.; Flamenco-Sandoval, A. Patterns in species richness and distribution of vascular epiphytes in Chiapas, Mexico. J. Biogeogr. 2003, 30, 1689–1707. [Google Scholar] [CrossRef]
- Qian, H.; Ricklefs, R.E. Global concordance in diversity patterns of vascular plants and terrestrial vertebrates. Ecol. Lett. 2008, 11, 547–553. [Google Scholar] [CrossRef] [PubMed]
- Allen, R.G.; Pereira, L.S.; Raes, D.; Smith, M. Crop Evapotranspiration-Guidelines for Computing Crop Water Requirements-FAO Irrigation and Drainage Paper 56; FAO-Food and Agriculture Organization of the United Nations: Rome, Italy, 1998; Volume 156, p. 178. [Google Scholar]
- Colwell, R.K. RangeModel: Tools for exploring and assessing geometric constraints on species richness (the mid-domain effect) along transects. Ecography 2008, 31, 4–7. [Google Scholar] [CrossRef]
- Borcard, D.; Legendre, P.; Drapeau, P. Partialling out the spatial component of ecological variation. Ecology 1992, 73, 1045–1055. [Google Scholar] [CrossRef]
- Oksanen, J.; Blanchet, F.G.; Kindt, R.; Legendre, P.; O’Hara, R.B.; Simpson, GL.; Solymos, P.; Stevens, M.H.; Wagner, H. Vegan: Community Ecology Package, R Package Version 2.4-3. 2010. Available online: https://cran.r-project.org/web/packages/vegan/index.html (accessed on 16 May 2017).
- R Core Team. R: A Language and Environment for Statistical Computing; R Foundation for Statistical Computing: Vienna, Austria, 2017; Available online: http://www.R-project.org/ (accessed on 12 May 2017).
- Legendre, P.; Gallagher, E.D. Ecologically meaningful transformations for ordination of species data. Oecologia 2001, 129, 271–280. [Google Scholar] [CrossRef] [PubMed] [Green Version]
- Peres-Neto, P.; Legendre, P.; Dray, S.; Borcard, D. Variation partitioning of species data matrices: Estimation and comparison of fractions. Ecology 2006, 87, 2614–2625. [Google Scholar] [CrossRef]
- Tao, J.; Zang, R.G.; Yu, C.Y. Altitudinal patterns of plant communities and species diversity in the Habaxueshan Mountains, Yunnan, China. Sci. Silvae Sin. 2011, 47, 1–6. [Google Scholar]
- Li, X.-H.; Wang, D.-D.; Li, H. Feature of Ericaceae flora in Gaoligong Mountains. J. West China For. Sci. 2017, 46 (Suppl. II), 112–118. Available online: http://159.226.100.28/ZK/detail.aspx?id=674277914 (accessed on 26 July 2018). (In Chinese).
- O’Brien, E.M.; Field, R.; Whittaker, R.J. Climatic gradients in woody plant (tree and shrub) diversity: Water-energy dynamics, residual variation, and topography. Oikos 2000, 89, 588–600. [Google Scholar] [CrossRef]
- Smith, D.D.; Sperry, J.S. Coordination between water transport capacity, biomass growth, metabolic scaling and species stature in co-occurring shrub and tree species. Plant Cell Environ. 2014, 37, 2679–2690. [Google Scholar] [CrossRef] [PubMed]
- Harms, K.H.; Condit, R.; Hubbell, S.P.; Foster, R.B. Habitat associations of trees and shrubs in a 50-ha neotropical forest plot. J. Ecol. 2001, 89, 947–959. [Google Scholar] [CrossRef] [Green Version]
- Brodribb, T.J.; Field, T.S. Stem hydraulic supply is linked to leaf photosynthetic capacity: Evidence from New Caledonian and Tasmanian rainforests. Plant Cell Environ. 2000, 23, 1381–1388. [Google Scholar] [CrossRef]
- O’Brien, E.M. Water-energy dynamics, climate, and prediction of woody plant species richness: An interim general model. J. Biogeogr. 1998, 25, 379–398. [Google Scholar] [CrossRef]
- Cordero, R.A.; Nilsen, R.T. Effects of summer drought and winter freezing on stem hydraulic conductivity of Rhododendron species from contrasting climates. Tree Physiol. 2002, 22, 919–928. [Google Scholar] [CrossRef] [PubMed]
- Wang, Y.J.; Wang, J.J.; Lai, L.M.; Jiang, L.H.; Zhuang, P.; Zhang, L.H.; Zheng, Y.R.; Baskin, J.M.; Baskin, C.C. Geographic variation in seed traits within and among forty-two species of Rhododendron (Ericaceae) on the Tibetan plateau: Relationships with altitude, habitat, plant height, and phylogeny. Ecol. Evol. 2014, 4, 1913–1923. [Google Scholar] [CrossRef] [PubMed]
- Francis, A.P.; Currie, D.J. A globally consistent richness-climate relationship for angiosperms. Am. Nat. 2003, 161, 523–536. [Google Scholar] [CrossRef] [PubMed]
- Fernàndez-Martínez, J.; Fransi, M.A.; Fleck, I. Ecophysiological responses of Betula pendula, Pinus uncinata and Rhododendron ferrugineum in the Catalan Pyrenees to low summer rainfall. Tree Physiol. 2016, 36, 1520–1535. [Google Scholar] [CrossRef] [PubMed]
- Caroline, M.W.; Hugh, A.L.H.; Brent, J.S. Cold truths: How winter drives responses of terrestrial organisms to climate change. Biol. Rev. 2015, 90, 214–235. [Google Scholar]
- Rajaniemi, T.K. Why does fertilization reduce plant species diversity? Testing three competition-based hypotheses. J. Ecol. 2002, 90, 316–324. [Google Scholar] [CrossRef] [Green Version]
- Brown, R.L.; Jacobs, L.A.; Peet, R.K. Species richness: Small scale. In Encyclopedia of Life Sciences; John Wiley & Sons Ltd.: Hoboken, NJ, USA, 2007. [Google Scholar]
- Dobrowski, S.Z.; Swanson, A.K.; Abatzoglou, J.T.; Holden, Z.A.; Safford, H.D.; Schwartz, M.K.; Gavin, D.G. Forest structure and species traits mediate projected recruitment declines in western US tree species. Glob. Ecol. Biogeogr. 2015, 24, 917–927. [Google Scholar] [CrossRef]
Figure 1.
Map of the study area. Insert in top-right corner shows location of Yunnan Province within China. The triangles (▲) show the lowest and highest altitudes (alt.) in the area, respectively.
Figure 1.
Map of the study area. Insert in top-right corner shows location of Yunnan Province within China. The triangles (▲) show the lowest and highest altitudes (alt.) in the area, respectively.

Figure 2.
Elevational patterns of richness for all Ericaceae species (A), shrubs (B), and trees (C) in Yunnan, China. Solid dots and solid lines represent observed and predicted species richness, respectively. Dashed lines show 95% confidence intervals predicted by the mid-domain effect (MDE) randomization model.

Figure 3.
Variations in species richness within Ericaceae for all species, trees, and shrubs as function of elevation (A), mean annual temperature (B), mean annual precipitation (C), and potential evapotranspiration (D) in Yunnan Province, China. The explanatory powers (R2) were evaluated by polynomial models. ** p < 0.01; *** p < 0.001.

Figure 4.
Partitioning of species richness into temperature (including mean annual temperature, temperature of the coldest month, temperature of the warmest month) and water availability (including mean annual precipitation, precipitation of the driest month and precipitation of the wettest month) for all species, and for shrubs and trees in Yunnan. Values represent adjusted R2 coefficients of independent or shared effects by each variable. Total effect (including independent and shared effects) of each explanatory variable is shown in parentheses.

Figure 5.
Partitioning of species richness into the species-area relationship (SAR), the mid-domain effect (MDE), and climate components for all species, and for shrubs and trees. Values represent adjusted R2 coefficients of independent or shared effects by 3 predictors. Total effect (including independent and shared effects) of each explanatory component was shown in parentheses.


Table 1.
Regression coefficients of the multivariate models for the main variables explaining species richness. P-values for all models were less than 0.001. MAT, mean annual temperature; MAP, mean annual precipitation; PET, potential evapotranspiration; AIC, Akaike information criterion.
Table 1.
Regression coefficients of the multivariate models for the main variables explaining species richness. P-values for all models were less than 0.001. MAT, mean annual temperature; MAP, mean annual precipitation; PET, potential evapotranspiration; AIC, Akaike information criterion.
| Intercept | Lifeform | Elevation | MAT | MAP | PET | Interaction | Adjusted R2 (%) | AIC |
|---|---|---|---|---|---|---|---|---|
| −132.83 | 150.42 | 0.20 | - | - | - | −0.20 | 77.82 | 210.5 |
| 816.91 | −811.15 | - | −39.44 | - | - | 39.93 | 77.91 | 210.1 |
| 1199.63 | −1347.50 | - | - | −0.89 | - | 1.11 | 72.02 | 215.3 |
| 914.41 | −1002.73 | - | - | - | −0.79 | 1.02 | 77.05 | 210.9 |
| −93.16 | −51.62 | - | −21.53 | −0.02 | 0.49 | - | 83.64 | 204.2 |
| −116.35 | - | - | −18.22 | −0.05 | 0.47 | - | 83.94 | 203.1 |
| −316.60 | - | - | 40.18 | 0.46 | - | −0.04 | 84.24 | 202.7 |
| −142.50 | - | - | 10.72 | - | 0.39 | −0.02 | 93.01 | 184.8 |
| −547.20 | - | - | - | 0.61 | 0.83 | −0.0007 | 68.37 | 218.0 |
Table 2.
Explanatory powers (R2) of climatic variables with species richness for all species, and for trees and shrubs in Ericaceae evaluated by polynomial models. ** p < 0.01; *** p < 0.001.
Table 2.
Explanatory powers (R2) of climatic variables with species richness for all species, and for trees and shrubs in Ericaceae evaluated by polynomial models. ** p < 0.01; *** p < 0.001.
| Environmental Variable | All Species | Shrubs | Trees |
|---|---|---|---|
| Temperature of the coldest month | 0.840 *** | 0.781 *** | 0.838 *** |
| Temperature of the warmest month | 0.905 *** | 0.826 *** | 0.911 *** |
| Temperature seasonality | 0.662 *** | 0.632 *** | 0.667 *** |
| Precipitation of the driest month | 0.497 ** | 0.478 ** | 0.604 *** |
| Precipitation of the wettest month | 0.758 *** | 0.734 *** | 0.691 *** |
| Precipitation seasonality | 0.036 | 0.026 | 0.065 |
© 2018 by the authors. Licensee MDPI, Basel, Switzerland. This article is an open access article distributed under the terms and conditions of the Creative Commons Attribution (CC BY) license (http://creativecommons.org/licenses/by/4.0/).
Share and Cite
MDPI and ACS Style
Wang, J.-H.; Cai, Y.-F.; Zhang, L.; Xu, C.-K.; Zhang, S.-B. Species Richness of the Family Ericaceae along an Elevational Gradient in Yunnan, China. Forests 2018, 9, 511. https://doi.org/10.3390/f9090511
AMA Style
Wang J-H, Cai Y-F, Zhang L, Xu C-K, Zhang S-B. Species Richness of the Family Ericaceae along an Elevational Gradient in Yunnan, China. Forests. 2018; 9(9):511. https://doi.org/10.3390/f9090511
Chicago/Turabian StyleWang, Ji-Hua, Yan-Fei Cai, Lu Zhang, Chuan-Kun Xu, and Shi-Bao Zhang. 2018. "Species Richness of the Family Ericaceae along an Elevational Gradient in Yunnan, China" Forests 9, no. 9: 511. https://doi.org/10.3390/f9090511
Note that from the first issue of 2016, this journal uses article numbers instead of page numbers. See further details here.