Monetary Valuation of Natural Forest Habitats in Protected Areas
by
 , , ,
, , ,
Vilem Pechanec
1 ,
,
Ivo Machar
2,*,
Lenka Sterbova
3,
Marcela Prokopova
3,
Helena Kilianova
1,
Karel Chobot
4 and
Pavel Cudlin
3 1
Department of Geoinformatics, Faculty of Science, Palacky University Olomouc, 771 47 Olomouc, Czech Republic
2
Department of Developments and Environmental Studies, Faculty of Science, Palacky University Olomouc, 771 47 Olomouc, Czech Republic
3
Academy of Science, Global Change Research Institute, 603 00 Brno, Czech Republic
4
Nature Conservation Agency, 148 00 Prague, Czech Republic
*
Author to whom correspondence should be addressed.
Forests 2017, 8(11), 427; https://doi.org/10.3390/f8110427
Submission received: 18 July 2017
/
Revised: 29 September 2017
/
Accepted: 7 November 2017
/
Published: 10 November 2017
(This article belongs to the Special Issue Biodiversity and Conservation—Selected Papers from FowiTa German Forest Sciences Conference (Sessions 6–9))
Abstract
:The progressive development of economic valuations of biodiversity in recent decade enables the application of the concept of payments for ecosystem services (PES) in order to conservation of forest biodiversity in protected areas. In this article, the PES concept principles are applied for the monetary valuation of natural forest habitats, which were mapped in the Czech Republic in order to create the Natura 2000 European network. The method is based on expert evaluation of every type of mapped habitat by a point value (ranging from 1 to 6 points) for specific ecological evaluating criteria. The monetary value of every point of specific natural forest habitats was defined from the economic analysis of financial expenses of realised ecological restoration projects in the Czech Republic. This method is therefore based on a rather exceptional application of the PES concept, which is still rare in literature because it is based on actual invested financial means, not only on the potential willingness to spend these financial means. The presented results of the monetary valuation of the natural forest habitats in the Czech Republic indicate that the method used for the monetization of forest biodiversity in protected areas can represent a promising decision support tool in countries where habitat mapping results are available.
1. Introduction
Economic growth can lead to a degradation of ecosystems and loss of biodiversity [1]. Biodiversity loss presents significant economic challenges. Econometric techniques for biodiversity evaluation can help with its sustainable use [2]. This is why methods of monetary valuation have been developing. Econometric methods for the valuation of biodiversity are usually divided in literature into three fundamental groups: (i) revealed preference methods (for example, methods of analysis of transportation expenses, hedonic methods), (ii) stated preference methods (for example, contingent valuations), and (iii) production function methods (for example, valuation of crop production, etc.). The method of monetary valuation of natural forest habitats presented in this article cannot be decidedly placed in any of these groups—this method is based on actual expenses, not only on the hypothetical willingness to pay. Additionally, we must not forget about numerous warnings: (a) too strong an emphasis on the economic valuation of ecosystems can lead to a commodification with potential environmental and social impacts [3], (b) uncertainty in economic valuations are not sufficiently quantified [4], and (c) the econometric techniques for cultural forest services are weak [5]. The same finding on the weakness of econometrics for the evaluation of cultural forest services has also been provided by our study of the recreational ecosystem forest function in the Czech Republic based on an analysis of actual payments of users of this forest function [6].
One of the possible solutions to the above stated weak points of the econometric methods in monetisation of biodiversity can be integrated valuation, which has already been made by the EU Open NESS project, based on accounting for a variety of different ecosystem (or biodiversity) values under three categories: ecological, cultural and monetary [7,8]. This point is especially distinct in the case of European forests for which a historical human influence on the current state of natural forest habitats has always been significant [9].
A key tool for policymakers has also become the mapping of ecosystems and their services because it allows us to apply econometric methods in order to support a monetary valuation of biodiversity [10,11]. The economic valuation of biodiversity can help to raise awareness of the benefits provided by ecosystems in order to make decisions [12], even though we have not been able to economically evaluate all the biodiversity components [13]. The progressive development of economic evaluations of biodiversity in the last decade [14] has allowed for the application of the concept of payments for ecosystem services (PES) as a motivation for biodiversity conservation outside protected areas and as a mean for its conservation inside protected areas [15].
The PES concept is considered a direct strategy, creating important motivation for biodiversity conservation within protected areas [16]. PES have been claimed to be more efficient [17] than indirect strategies for conservation of biodiversity in protected areas such as integrated conservation and development projects [18]. The PES concept has been successfully applied in the economic valuation of forest ecosystem services [19,20], in valuing changes in forest biodiversity [21], and in the assessment of the monetary value of forest biodiversity in protected areas [22]. PES can support the forest sustainable management as well as economic incentives for conservation, in the case of the low value of forest products [23]. PES could also spare the cost of conservation for forest dwellers [24]. Most studies focused on PES application into the monetary valuation of forest biodiversity have traditionally concentrated on the tropics [25,26,27]. Works aimed on the economic evaluation of non-market forest benefits [28,29,30] prevail. These are usually based on the contingent evaluation of the hypothetical willingness to pay for certain environmental forest services.
PES occurs when a beneficiary or user of an ecosystem service makes a direct or indirect payment to the provider of that service. PES are the mechanisms that govern these payments. In other words, PES involve a series of payments to land or other natural resource owners in return for a guaranteed flow of ecosystem services or certain actions likely to enhance their provision over-and-above what would otherwise be provided in the absence of payment. PES can thus support the conservation and expansion of ecosystems when the latter generate services that can be valued in economic and financial terms. PES can be labelled according to their geographical scale (local, regional and global), the structure of compensation (direct and indirect/public and private), the type of ecosystem they protect (forests, wetlands, etc.), or the four types of services the payment covers (see above). These general principles of PES follow the “beneficiary pays principle“, compensating individuals or communities whose land use (or other decisions) influence the provision of ecosystem services. The underlying assumption is that the individual has the right to pollute and “society” must provide compensation to avoid pollution costs and induce non-polluting resource management decisions. The minimum compensation is set to counterbalance an income loss (e.g., not farming a certain area) or the costs of undertaking a certain activity. Maximum compensation (not recommended) is equal to the value of ecosystem services provided to society due to the management regime, but not captured by the land use managers. Because most ecosystem services are not traded in markets (e.g., biodiversity), the intervention of a regulatory agency may be needed to create those markets. The underlying economic values can be determined directly or indirectly.
In this article, the general principles of the PES concept are applied in the monetary valuation of the central European natural forest habitats, which were mapped in the Czech Republic between 2001 and 2004 for the purpose of creating the Natura 2000 European network [31]. Contrary to most previously published similar studies, the method of monetization of forest biodiversity in this article is based on a preceding detailed analysis of real expenses spent on environmental services provided by the evaluated natural habitats.
This article focuses on approximately half (57%) of the total Czech national forest areas, which consists of mapped natural forest habitats (15,203.45 km2). The results of mapping the natural forest habitats served as a basis for creating the national network of protected areas of European importance (called special areas of conservation: SAC), providing permanent sustainability of forest biodiversity in the Czech Republic in compliance with the principles of the European Natura 2000 system. The main aim of this article is, therefore, to test the hypothesis that the monetary valuation of natural forest habitats can serve as an important decision support tool for the conservation of forest biodiversity in protected areas. Partial aims of this article are also (a) to present the original Czech method of forest habitats monetary valuation within the European context, and (b) to use habitat monetary valuation for evaluating the importance of the scientific approach towards mapping and conservation of natural forest habitats in order to protect European forest biodiversity. The presented method of monetary valuation of forest habitats on the basis of actual spent expenses (not only on the potential willingness to pay) might serve as an inspiration in the context of conservation of European forest biodiversity.
2. Materials and Methods
2.1. Study Area and Selection of Natural Forest Habitats
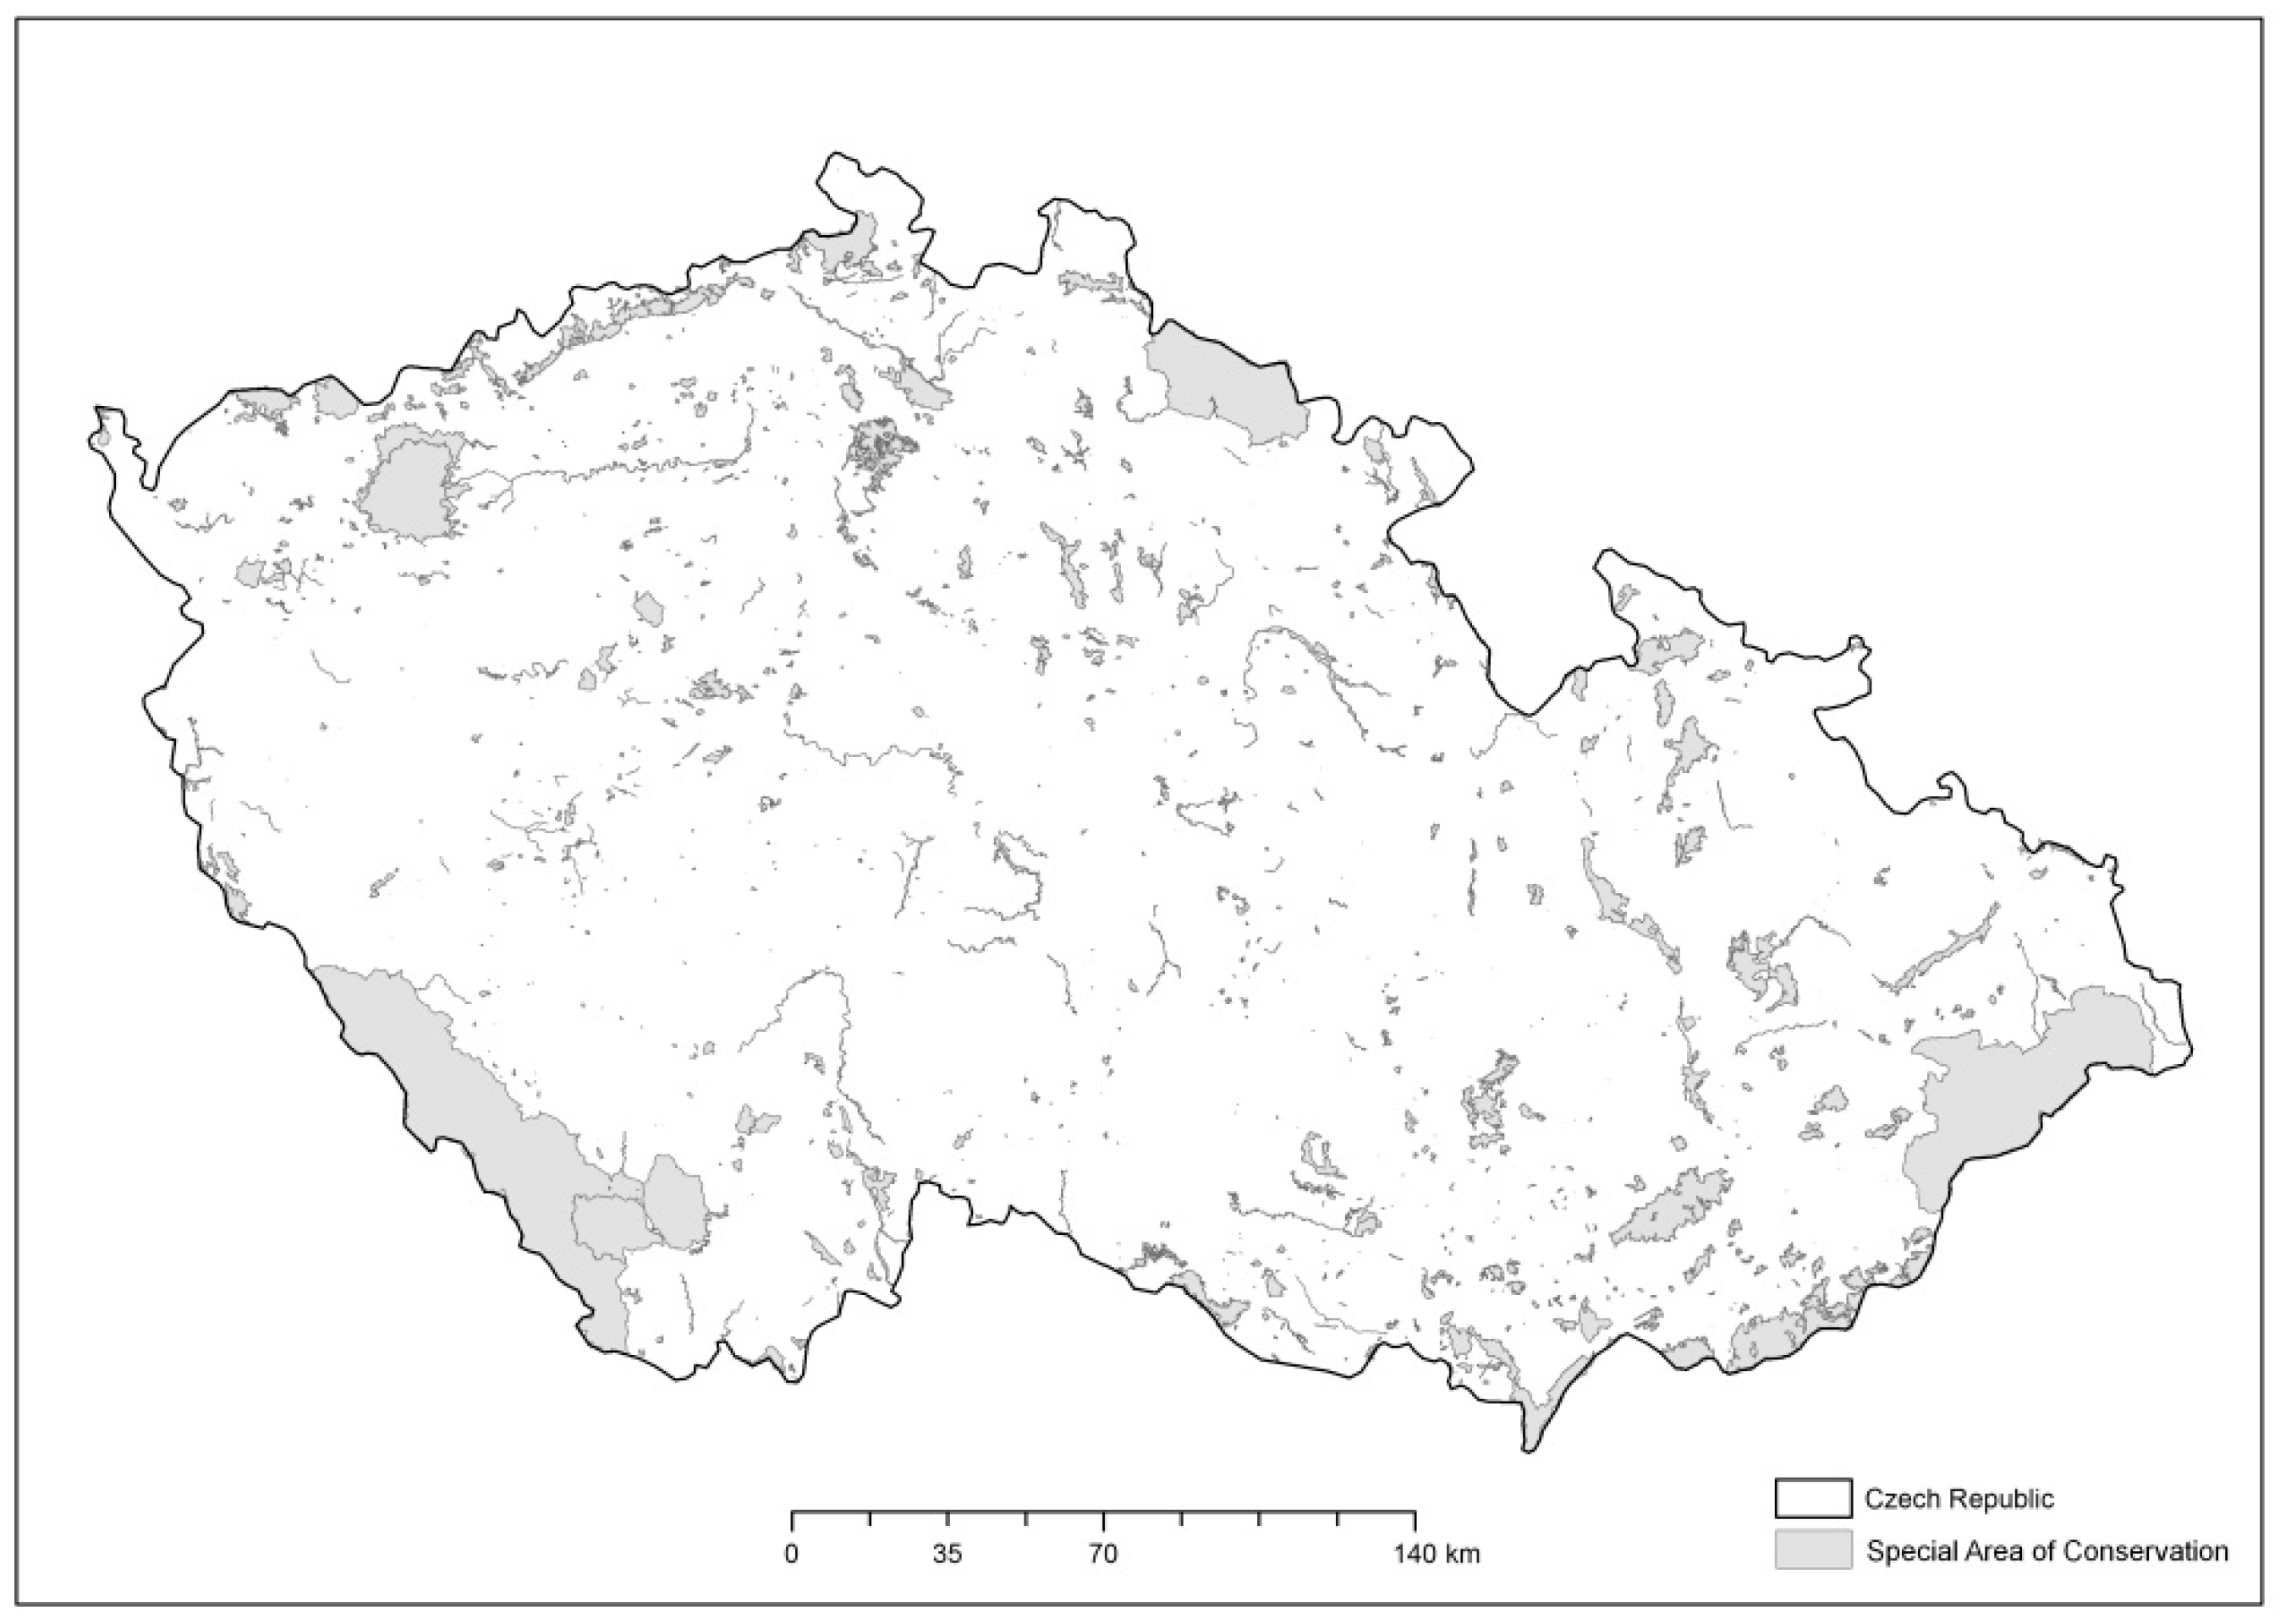
The hypothesis was tested within the national scale of the Czech Republic, where, between 2001 and 2004, detailed field mapping was made of the distribution of natural habitats [32] in order to create a network of the areas of European importance within the conservation aims of the so-called Habitat Directive (Council Directive 92/43EEC on the conservation of natural habitats and of wild fauna and flora). From the terrain mapping results, the Habitat Catalogue of the Czech Republic was created [33] (hereinafter referred to as the “Catalogue”) including 43 forest types of natural forest habitats (Table 1). The forests of the Czech Republic covered 26.6 thousand km2 in total in 2015. The percentage of forest cover in the Czech Republic (that is the portion of forest areas of the total country area) reaches 33.8%, which is slightly below average for European Union countries (and which amounts to 37.6%). Most forests in the Czech Republic are created by cultural forests strongly influenced by humans. In the article, we do not concentrate on the cultural forest habitats mapped in the Czech Republic as habitats strongly influenced or created by humans and which can be found in the Catalogue in the following habitat type sections: “Forest cultures with non-indigenous wood plants” and “Forest glades and clearings” (both of them with code “X”). The terrain mapping of habitats in the Czech Republic has additionally brought thorough data on the diversity of the arboreal, shrubby and herbaceous level of the specifically mapped habitat segments, and also elementary data on the ecological quality of the particular habitats. The results of the field mapping were completely digitalised and the created data layer was applied for the definition of areas suitable for conservation as protected areas of European importance (SAC, see Figure 1) on the basis of the criteria stated in the Habitat Directive [34].
2.2. Methodology of the Monetary Valuation of Natural Forest Habitats
The elementary principle of the method is an innovative application of the idea on which the method of ecological harm on habitats in Hessen (Germany) was based [35]. Hessen method is a method of economic evaluation of non-market environmental resources and their life-long functions. The method is based on a combination of environmental benefits and costs for the revitalisation of the relevant habitat types. It is a method of expert arrangement of habitats according to their point values depending on their abilities as an environment for plant and animal species. This method also expresses the value of a point in monetary units according to the size of the average national cost necessary to achieve the increment of one point of nature and landscape quality. The method is based on interdisciplinary expert assessments of all types of habitats that occur in a particular area. The Hessen method has been recommended for use on the EU White Paper on Environmental Liability [31] and is used in Hessen for environmental damage estimates caused by natural and landscape interventions. Currently, this habitat assessment method can be used to implement Habitat Directive [31] 2004/35/EC of 21 April 2004 on environmental liability in relation to the prevention and remedying of environmental damage.
Our method is based on a created national list of habitat types and their expert evaluation. Each habitat type has been valued using points according to eight ecological characteristics, each of them with a potential point value ranging from one to six points. The first four characteristics are the expression of the ecological quality of the habitat (matureness, naturalness, diversity of plant species, and diversity of animal species), while the other four characteristics express the degree of rarity or threat to the habitat (rareness of biotope, rareness of species, vulnerability, threat to existence; more information in Appendix A). The sum of the points for the first four characteristics is multiplied by the sum of the points for the second group of four characteristics (Equation (1)).
[((M + N + Dps + Das) × (Rb + Rs + V + Te))/576] × 100 = point value
The evaluation process is related to one square meter of each habitat, the final point value is valid for every one square meter of the habitat. Habitat point values are derived from the relative ecological significance of the respective biotope (for the studied forests 33–72 points) and are transferred into monetary terms by average national costs (ANC) of restoration measures, necessary for a one point increase, i.e., for maintaining and improving the habitats as environments for healthy ecosystems. The monetary value of a mapped habitat is given by the relation (Equation (2)).
Point value × ANC × real area of mapped habitat in one square meter
The maximum total sum of points for a particular habitat type (TSPPHT) is 576. For a specific type of habitat, the result of the point evaluation (related to 1 m2 of the habitat area) represents the relative ecological value of a specific habitat type in comparison with other habitat types. In the Czech Republic, the list of point values of habitat types was prepared according to the results of the habitat mapping shown in the Catalogue [36].
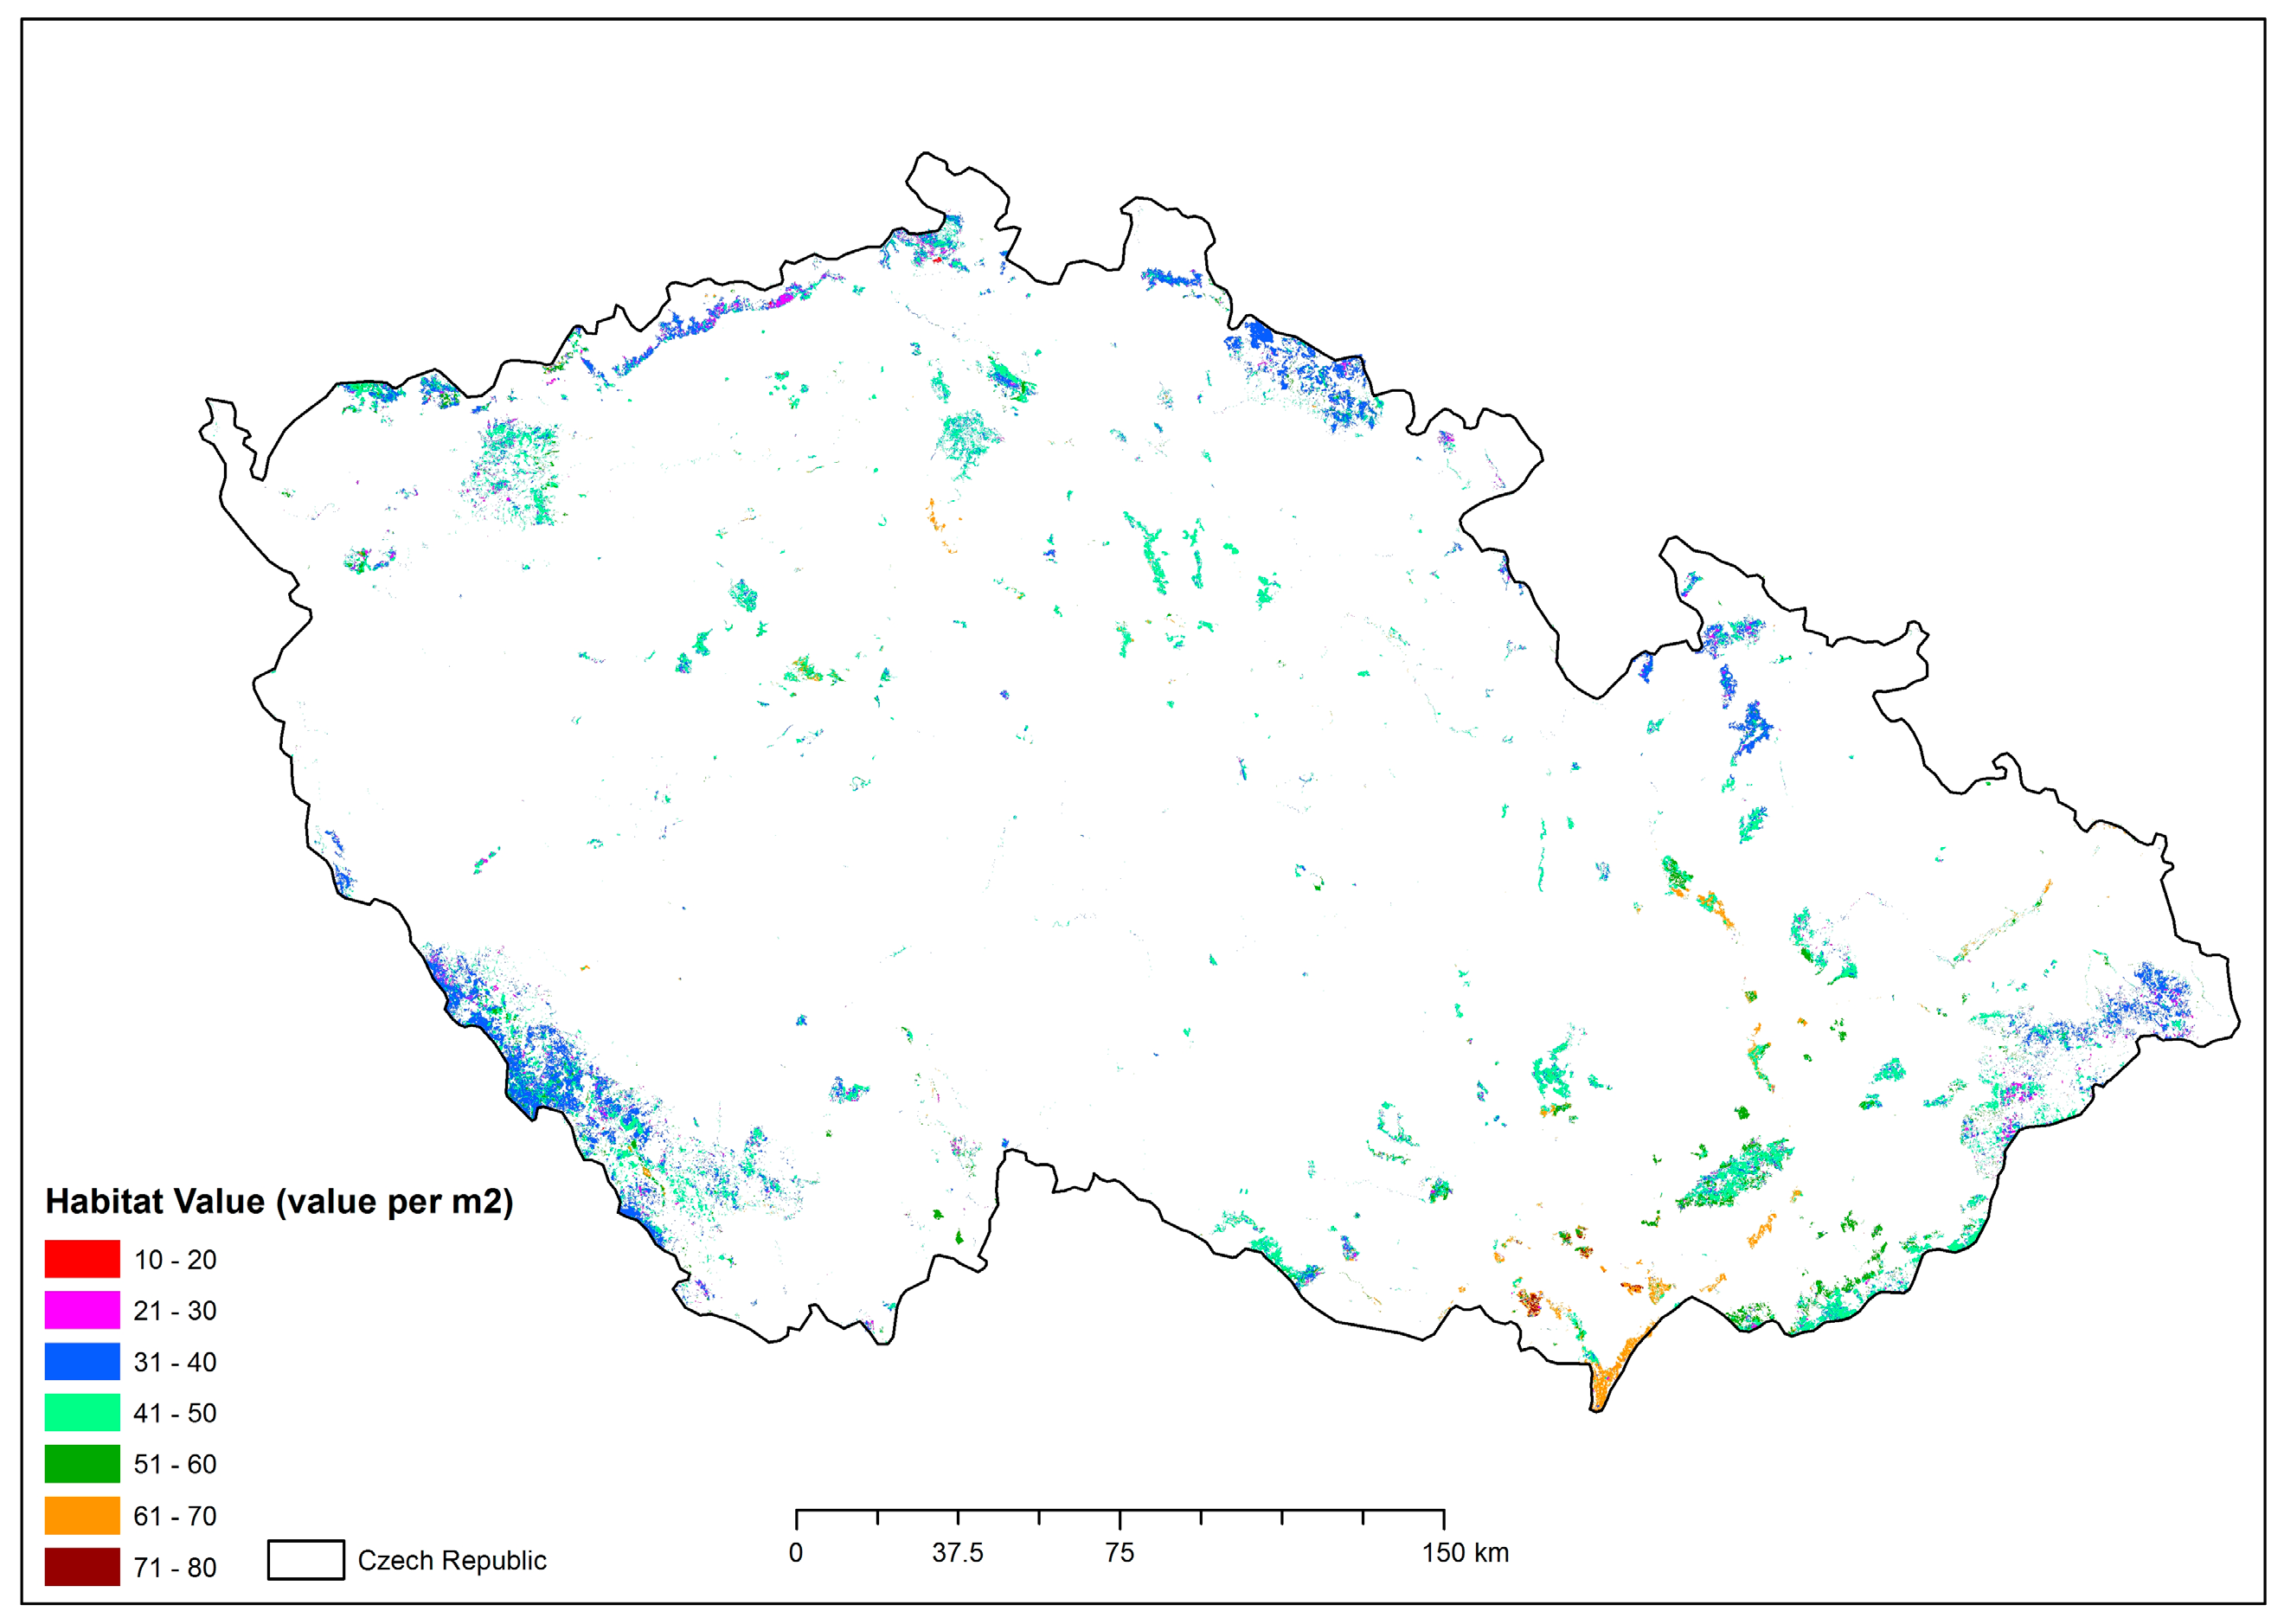
For the purpose of monetization of the point evaluation of habitats, economic analysis was made for the 136 realised projects within the Program for the Restoration of River Systems [37] in the Czech Republic. This state program is aimed to financially support habitat restoration in the cultural landscape in order to improve the retention capacity of the landscape. These projects are realised by an ecosystem approach in the frame of catchment river basins and, thus, the title of the program includes the term “river systems”. Within the restoration projects, forest habitats were restored according to the principles of ecological restoration [38]. Target tree structure and tree diversity of restored forest habitats were made strictly by relevant definitions of natural forest habitats in the Catalogue. Because we know the budgets of these restoration projects in detail, we could derive precisely initial costs for establishment natural forest habitats in diverse ecological conditions. During the economic analysis of these restoration projects, an increased rate of ecological value of particular habitats was researched by means of the eight above-stated criteria (see Appendix A) and, concurrently, a long-term effect of the point increase rate at a zero discount rate was taken into account. The value of the increase of an individual point was calculated as a ratio of the total expenses on the project and the total long-term expected point increase. The final monetary value of an individual point for the Czech Republic amounted to EUR 0.592 in 2015 and is based on actual spent budget investments, which were spent by Czech society on specific projects of ecological restoration [39]. Figure 2 shows the calculated point value for each habitat in the study area. Methodologically, the point value is always related to an area of about 1 m2. The conversion to financial value is given by Equation (2).
3. Results
The point evaluation of the particular types of natural forest habitats in the Czech Republic (Figure 2) ranges from the lowest value of 33 points for an L2.2B habitat up to the highest value of 72 points for an L6.2 habitat (Table 1). The habitats of the L2.2B national code represent types of a bottomland forest degraded by influences of eutrophication caused by nitrogenous nutrient runoff from agricultural lands into forest habitats. The eutrophication in the forest habitats manifests itself by spreading herbaceous species of Carex brizoides, Phalaris arundinacea and Urtica dioica, and in the shrubby layer, Sambucus nigra is gradually gaining in dominance. This manifests itself in the point evaluation of the habitats in the low values of “Matureness” and “Naturalness”. This habitat is quite vast in the Czech Republic as a vegetative accompaniment of medium watercourses and in watercourses of streams, so the value of the “Rareness of habitat” is also low in the point evaluation (Table 1). On the contrary, the L6.2 habitat scored the highest in all eight characteristics of the point evaluation (Table 1) because it is regarded as a rare habitat type in the climatically warmest regions of the Czech Republic in the Pannonian biogeographic province (high value of “Rareness of habitat”). This habitat has a naturally high species diversity in the arboreal, shrubby and herbaceous layers, which is reflected in the high values of “Naturalness” and “Diversity of plant species”. With respect to the limited number of localities, the habitat is strongly threatened by some locally influencing factors, such as the absence of historically defunct coppicing management (high value of “Threat to existence”). The “Vulnerability” of this habitat is lower than in the L2.2B habitat because most of the area of the mapped L6.2 habitat in the Czech Republic (84.3%) is included in the protected areas.
The monetary value of the natural forest habitats in the SAC network (Figure 1) is presented in Table 2. Understandably, the habitats with the highest surface area ratio in the SAC (for example the L3.1, L5.1, L5.4 and L9.1 habitats) reached the highest monetary values in Table 2. The lowest monetary values are, on the contrary, expressed for habitats that are generally rather rare in the Czech Republic and have a low surface area ratio in the SAC (the L4.B, L7.4, L8.3 and L10.3 habitats). The monetary valuation of specific habitats in the SAC cannot, therefore, directly reflect the priorities of the forest biodiversity conservation—the rareness of a specific habitat will not manifest itself in its higher monetary value.
In the SAC network of protected areas, a total of 2922.89 km2 of natural forest habitat is being conserved, which is 38.5% of the total area of all the mapped natural forest habitats in the Czech Republic (Table 2). The total monetary value of natural forest habitats in the SAC network in the Czech Republic for 2015 reached EUR 76 billion (Table 2) and 1985 billion in the Czech Republic. This monetary value is, in the authors’ opinion, a sufficiently strong argument for the protection of the SAC network concentrating on forest biodiversity sustainability. Simultaneously, this ascertained monetary value indicates that the SAC network of the Czech Republic (focusing on the conservation and sustainability of habitats in the sense of the conservation targets of the Natura 2000 network) is mostly considered an effective tool for forest biodiversity conservation.
4. Discussion
Economic valuation of nature [40] is considered an important approach to support the conservation of biodiversity on a landscape level [41] thanks to the progress of ecosystem ecology [42]. The results of the research presented in this article generally comply with the demands on the data applicability for protected areas.
Monetary evaluation of natural forest habitats applies the main PES scheme, which involves:
- 1
- Identification of the ecosystem services and its geographical boundaries;
- 2
- Identification of the sellers/providers and buyers/beneficiaries;
- 3
- Definition of the market and price;
- 4
- Determination of the governance, institutional and legal arrangements;
- 5
- Collection of the biophysical data baseline data for the monitoring system.
Our study, presented in this article, is integrated into all these steps (e.g., identification of the services and boundaries includes an interpretation of field habitat mapping; definition of the price is the evaluation of a point value, etc.). A monitoring system of forest habitat monetary evaluation is provided by the monitoring of natural habitats in the frame of the Habitat Directive. Our method shows the minimal “cost” level of the habitats and is very easily implementable as an instrument for macroeconomic environmental accounting, while at a microeconomic level they are mainly targeted at the valuation of environmental damages caused by legal and illegal anthropogenic activities that intervene in nature, including damages covered by the EU Directive on environmental liability (2004/35/EC). The calculated values are specific environments for specific living species and at the same time, they are environments for providing specific ecosystem functions.
There is a lack of studies aimed at monetary valuation of forest biodiversity [43]. The first study aimed to link forest land use and driven extinction of four vertebrate taxa and loss of forest ecosystem services [44] show that globally a total of 485 vertebrate species are projected to become extinct due to current forest land use. This finding is a good reason for the monetary valuation of forest habitats which can support the forest biodiversity conservation effort on a global scale. Awareness of the monetary value of forest biodiversity is expected to provide a valuable contribution to natural conservation policy by providing a scientific basis for both forest policy decision makers and forest managers [45]. The only analyses of the value forest biodiversity embodied in the timber trade are restricted to tropical countries [46,47]. Moreover, there is still large uncertainty and variability in the monetary assessment of forest biodiversity [48]. The wide variation in monetary values of forest biodiversity on a global level can be partially explained by the methodological heterogeneity of the studies. Thus, future research requires a strengthened and more standardised methodological approach [49]. The results of the presented article indicate that, for the standardisation of methods of monetary valuation of forest biodiversity on the European scale, there is a good opportunity to make use of the results of habitat mapping within the preparation of national systems for the Natura 2000 network. However, a weak point for such standardisation so far is the considerable difference in the levels of national mapping of natural habitats in particular member states and regions of the European Union [50,51,52].
The weakness of our method is in the determination of the point value (TSPPHT) based on the criteria responsible for the score itself. The financial value set for one point can be the same in two different habitat types. Point value is recalculated every five years. We think it is sufficient on the national level. When we work on a local scale, our method allows us to take into account other aspects that modify the resulting score. This, in particular, is the current state of the habitat in terms of its representativeness to the given type of habitat (whether there is any degree of degradation in it); this measure is classified into four representative groups, which are shown as a weighting factor in the calculation of the point. Another important aspect is whether the habitat occurs as a homogeneous habitat or whether it is a part of the habitat mosaic (heterogeneous habitat). Percentage representation of members of the mosaic is again reflected in the form of a weighting factor.
The studies aimed at the integration of biodiversity in forest optimisation under forest management planning have rarely identified the most desirable forest management plan based on a recommendable level of biodiversity [53]. Monetisation of the biodiversity value represents the basic needs for incorporating biodiversity into forest management modelling [54] and forest sustainability management [55]. The standard approach is based on the consideration of biodiversity as a constraint within an optimisation process to calculate its opportunity cost—it can be consider as an indirect approach [56]. A new alternative approach (in a direct way) to the monetary assessment of forest biodiversity is suggested by [57] using a utility function based on an adapted Shannon index application of the forest growth model. This approach is based on identifying the upper and lower boundaries of the regional utility-loss function for biodiversity (as a public good) and, consequently, evaluation of biodiversity for the multi-purpose modelling of a particular forest. Although using the forest growth model (which included the necessary juvenile module) is a very promising approach to forest management assessment [58,59], this method for monetary valuation of forest biodiversity represents constraints only to the structural diversity of forest tree stands based on forest inventory data. Even though forest trees are an ecological indicator of a forest ecosystem, it is not considered a holistic approach towards ecosystems. The method used in this article tries to express the biodiversity of a whole forest habitat in the form of the eight-point evaluation of habitat characteristics, and not therefore only its tree segments.
Sustainable forest management has to maintain the ecological quality of forest habitats [60]. The presented method in this article is directly devised for the evaluation of the ecological quality of forest habitats. In the context of the predicated influence of climatic changes on forest ecosystems [61], the emphasis of forest management practices is currently put on the conversion of pure coniferous stands into mixed-species forests [62] as an important adaptation strategy to climate change for European forests [63]. Nevertheless, in the presented article, we do not concentrate on forest monocultures because their inclusion in the protected areas of the Czech Republic is quite sporadic and spatially insignificant [64].
Methods for total economic value calculations (such as production function approaches and contingent valuation) refer to the value of the ecosystem with respect to human requirements. This is why in the last decade a level of criticism has increased in the sense that the total economic value bases the monetary value of ecosystems purely on the flow of human benefits from services based on the sustainable use of natural capital per se [65]. Loss of species and resilience of ecosystems can occur indiscernibly while the ecosystem function itself remains largely unchanged [66,67]. Thus, the absence of a theory about ecosystem resilience in economic models is problematic [68]. This fact is a recognised weakness of economic valuation methods aimed at biodiversity monetization [69]. The resilience of forest ecosystems criterion is usually defined as the ability of an ecosystem to return to its original state after the end of a disturbing influence, or as the ability of an ecosystem to adapt to the impact of stress factors such as the time in which an ecosystem will restore itself by activation of auto-regulative ecological mechanisms [70]. The method of monetary valuation of habitats presented in this article includes the evaluation of resilience in the characteristics of habitat type nos. 1 to 4 and no. 7 (Appendix A). Particularly, characteristic no. 7 “Vulnerability” expresses the rate of resilience. Within these characteristics, the types of habitats that have a low rate of resilience in time have a higher point evaluation (for example, gravel river sediments), and habitats with higher resilience have a lower point evaluation (for example, scrub woods).
The economic evaluation concentrated exclusively on the monetary value of biodiversity could therefore seem confusing if it omitted the intrinsic ecological value of habitats, which has a non-market character [71]. The presented method of the monetary valuation includes the intrinsic value of habitats in all their evaluated characteristics (Appendix A).
There is also an increasing awareness that ethical and economic values of biodiversity are conflated [72]. The monetary value of forest biodiversity does not fully represent the complete value and significance of non-timber forest products [73,74]. Biodiversity undoubtedly has its intrinsic value; nevertheless, economic valuations (including cost-benefit analysis) represent a very important tool for the design of biodiversity policy [75].
The interpretation of economic valuation of biodiversity is complicated by the fact that most wild organism species are not subject to the market, and that is why it is difficult to find answers to the question: “How much money is a species worth?” The monetary valuation of habitats, however, brings a certain realistic closer look at the answer, since habitats consist of functional groups of species and the methods for monetary valuation of habitats are available. Further development of these monetary methods is, therefore, crucially needed for biodiversity conservation.
Biodiversity of forest ecosystems is widely affected by forestry and forest industry operations. Research on corporate reporting [76] suggested that biodiversity is currently considered a very important issue for forest companies, but no clear relevant disclosure strategies have been developed yet. Integrating measurable forest ecosystem services could help fill the gap between rhetoric and action [77]. Also, some relevant social indicators are—to a large extent—still lacking, probably because of a knowledge gap of social distribution of provisioning forest services related to biodiversity [78].
Biodiversity is a multilevel complex and difficult to measure precisely [79]. The economic evaluation of biodiversity is, therefore, also difficult—in the opinion of some authors, biodiversity is a particularly intractable economic problem [80]. Economic valuations of biodiversity have been developing in two fundamental directions: (i) a bottom-up approach, applying traditional econometrics, and (ii) a top-down approach, where systematic analyses aim towards an aggregate valuation [81]. In this article, the presented monetary valuation of biodiversity falls within the ranks of methods based on the top-down approach.
5. Conclusions
Biodiversity creates multiple externalities and public goods. We need to fully incorporate biodiversity into economic calculations and vice versa: we need the integration of economic analysis into biodiversity policy. Monetary valuation of natural habitats is one of the promising possibilities of biodiversity and economic integration. The method of monetizing biodiversity values within the PES concept, based on actual financial expenses spent on the creation and restoration of natural habitats in a specific region, offers a closer move towards an objective monetization of habitats on the assumption that it is possible to make use of the results of scientifically realised terrain mapping.
In this article, the monetisation of biodiversity is demonstrated on the natural forest habitats of the Czech Republic, which in its complexity represents a typical example of biodiversity of forests in a central European temperate zone. The results of the article indicate that the monetary valuation of natural forest habitats within the PES application can become an important decision support tool for the awareness of forest biodiversity conservation important on a national as well as international scale.
Acknowledgments
This study was funded by the “Cultural landscape of the Archdiocese of Olomouc—research, presentation and management” grant as a part of the NAKI II program of the Ministry of Culture of the Czech Republic. Authors thank the Nature Conservation Agency in Prague for providing data from the mapping of habitats in the Czech Republic. Authors also thank the anonymous reviewers for their comments and recommendations.
Author Contributions
V.P., I.M., K.C. and P.C. designed the study. V.P., L.S., M.P. and H.K. conducted the GIS analyses of input data, K.C. is responsible for habitat related data analyses, V.P., I.M. and P.C. worked in order to asses of monetary value of habitats, H.K. is responsible for the review of resources for discussion, I.M. wrote the manuscript, and P.C. supervised the research.
Conflicts of Interest
The authors declare no conflict of interest. The founding sponsor had no role in the design of the study, in the collection, analyses or interpretation of data and in the writing of the manuscript.
Appendix A. Evaluation Criteria for Defining the Expert Point Value of Habitats
The value of a specific habitat can be specified by coefficients based on its current state. Otherwise, it would be necessary to consider every successive stage of a biotope type as an individual habitat type.
The weight of criteria nos. 1 to 4 expresses the “intrinsic” value of habitats and the weight of criteria nos. 5 to 8 expresses the “extrinsic” ecological value of habitats.
Appendix A.1. Maturity
For point evaluation of the criterion of maturity, the phylogenetic age of an ecosystem and the phylogenetic age of its defining species were chosen as a guide.
- Anthropogenic habitats with a predominance of neophytes and invasive species (for example, built-up areas, vegetation-free hoppers, heathland with one- and two-year ruderals and segetals).
- Anthropogenic habitats with a large proportion of neophytes, archeophytes and apophytes (for example, wastelands, fallow lands, intensely farmed meadows and pastures, some cultural forests).
- Anthropogenic habitats with a small proportion of neophytes and late archeophytes (for example, extensively managed meadows and pastures, bottoms of summer-drained ponds and gravel sediments, alternate communities of climax and azonal communities, mixed cultural forests).
- Natural habitats (for example, heaths, climax forests—oak and hornbeam forests, beech forests, spruce forests, floodplain forests, acidic oak forests, acidic beech forests).
- Natural habitats with late post-glacial relics (for example, spring sources, calcareous fens, transitional peat bogs, rock communities, dry lawns, extra zonal forests—thermophilous oak woods and relict pine groves).
- Natural habitats with glacial to early postglacial relics (for example, salt marches, bogs, alpine and subalpine grasslands, dwarf mountain pines, peat and boreal pine groves, part of rock biotopes.
Appendix A.2. Naturalness
With this criterion we mean the rate of an anthropic influence of existential conditions of the creation and functioning of a habitat.
- Artificial: Artificial structures, surfaces of secondary deprived vegetation, water without life organisms.
- Alien to nature: Life form of plants is not decisive, geographically and structurally alien communities (ruderal and segetal communities, fields, rubble sites, water reservoirs with algae).
- Conditionally alien to nature: vegetation of one-year to persisting plants, replacement altered biotopes, stands with a significant proportion of apophytes or allochtonous species (fertilised summer-drained ponds, intensely farmed meadows, ruderalised fallow lands, segetal communities with archeophytes, monocultures of native forest species in another vegetation stage).
- Conditionally close to nature: replacement habitats, altered in species composition and structure, occurrence of allochtonous species, (extensively used summer-drained ponds, degraded stumps, extensively managed meadows and pastures, quarries, monocultures of indigenous forest trees).
- Close to nature: Replacement habitats, species composition preserved, but modified structure (oak stumps, ponds with a litoral zone, alpine meadows and dry grasslands).
- Natural: Natural species contents and structure, climax communities (natural forests, lakes, uninfluenced litoral communities, rocks and crumble-rocks of natural origin, stream sources, fens, peat bogs).
Appendix A.3. Diversity of Structures
The diversity of structures expresses the presence of vegetation layers according to life forms and is, from the perspective of the intrinsic characteristics of a habitat type, characterised by a maximum number of layers and a horizontal differentiation (surface coverage). The diversity of vegetation is evaluated according to its layers or according to the occurrence of some types of vegetation such as:
- Unusually low (there is no layer developed in the area): The habitat is neither vertically nor horizontally differentiated (synusia), areas without vegetation, fragments of vegetation (asphalt roads, vegetation on an artificial base, vegetation tiles and walls with slotted vegetation).
- Very low (one layer): This type of habitat has very little differentiation (1 to 2 life forms, one-species water vegetation, gravel pits, communities of rocks and crumble-rocks, Sesleria grasslands).
- Low (two layers): This type of habitat is only a little more significantly developed, the presence of only a few life forms (vegetation of macrophytes, reeds, vegetation of summer-drained ponds, stream sources, peat bogs, salt marshes, alpine lawns and communities of tall sedges, grazing pastures, one-year wastelands).
- Medium high (three layers): This habitat is significantly vertically or horizontally developed, more life forms present (tiny or linear groups of scattered verdure, indented gardens, abandoned wineyards, subalpine tall-culm plant meadows).
- High (four layers): Habitats with developed horizontal or vertical structures or with more life forms (acidophilous oak forests, acidophilous and flowering beech forests, pine groves, spruce forests).
- Very high: Habitats with rich horizontal and vertical diversity and with many life forms (forests with developed layers, natural forest margins, surface and linear groves, horn beam and thermophilous oak forests, hard floodplain forests, natural spruce forests with rich natural regeneration).
Appendix A.4. Diversity of Species
This criterion also compares habitats with the internal habitat value and it expresses the number of species in a habitat and is characterised by numerous ranges of all species:
- Extremely poor (caves, roofs, asphalt surfaces, vegetation tiles).
- Poor (monoculture).
- Slightly rich (eutrophic ponds, brash, fallow lands, pastures, trampled habitats).
- Medium rich (mesotrophic ponds, spring sources, peat bogs, salt marshes, willow bottomland forests, bushes, acidified forests).
- Rich (rocks, secondary grasslands, dry herb edges, thermophilous oak forests, dry pine groves, flowering beech forests, groves, fallow lands).
- Very rich (wet meadows, dry grasslands, subalpine high-culm meadows, pubescent-oak forests—forest-steppes).
Appendix A.5. Rareness of Habitat
Point assessment is a combination of habitat type and frequency of occurrence in the Czech Republic with regards to its surface area and frequency of occurrence within Europe:
- Abundant, widespread large-scale habitats: arable land, farmland forests, built-up areas.
- Scattered large-scale biotopes: degraded and ruderalised grasslands, cultural meadows, almost natural forests.
- Abundant, generally widespread small-scale habitats: groves and shrubs, mesophilic meadows, river reeds, fallow forests, embankment and dike vegetation.
- Rare large-scale habitats: mountain beech forests, Polish type oak-hornbeam forests.
- Scattered small-scale habitats: steppe grasslands and dry forest margins, river and stream margins, shrub fallow land, ruins.
- Rare small-scale habitats: peat bogs, dwarf pine trees, lakes, flood meadows, relic communities, alpine tundra.
Appendix A.6. Rareness of Species in Specific Habitat Type
The point value of the criterion was derived from the number of characteristic natural varieties of vascular plants that are kept on “red” lists of endangered (that is, also rare) species in the Czech Republic and in the countries of the European Union.
- No endangered species in a habitat.
- Very few endangered species in a habitat—up to 5 endangered species.
- Few endangered species in a habitat—up to 10 endangered species.
- Average number of endangered species in a habitat—up to 15 endangered species.
- Many endangered species in a habitat—up to 20 endangered species.
- Very many endangered species in a habitat—over 20 endangered species.
Appendix A.7. Vulnerability of Specific Habitat Type
This criterion expresses the degree of natural and anthropogenic influence on existential conditions of a habitat, or their synergic effect. Habitats with a lower score are those which are largely unaffected by sudden natural or man-made changes in habitat conditions, by invasion of non-native species, or by attack on some natural species of an ecosystem (for example, L4 brash forests). Therefore, habitats with a higher score are those which can easily be affected by the changes described above (for example, M4 gravel river sediments):
- Habitats highly resistant to anthropogenic influences (rocks).
- Medium-resistant habitats (hard bottomland forests, shrubs, cultural grasslands, gardens).
- Resistant habitats (almost natural grasslands, alpine tundra, soft bottomland forests, beech forests).
- Slightly vulnerable habitats (mixed forests).
- Moderately vulnerable habitats (forest monoculture, spring sources).
- Vulnerable habitats (peat bogs, salt marshes).
Appendix A.8. Endangered Habitat Types
Habitats with a high score are those which are dependent on declining economic activities in the countryside (for example, T1.3 grazing pastures threatened by the extinction of pasturage), habitats exposed to long-term effects of industrial civilisation (for example, L9.1 Mountain Calamagrostis spruce forests, endangered by acid rain deposits and a change in soil chemistry):
- The area ratio of the habitat type in the landscape is increasing steeply (regulated watercourses, ruderalised cultural forests).
- The area ratio of the habitat type in the landscape is increasing slightly (built-up and urbanised areas).
- The area ratio of the habitat type does not change (reeds, rocks and crumble-rocks, cultural meadows, intensive fields).
- The area ratio of the habitat type is decreasing slowly (periodic and temporary water areas, gravel river terraces, spring sources, peat bogs, alpine lawns, dry grasslands, mesophilic meadows, willow bottomland forests, natural forests).
- The area ratio of the habitat type is decreasing sharply (oligotrophic standing water areas, dry pastures rich in species, moist mesophilic meadows, extensive grassland subsets).
- Vanishing habitat type (salt marshes and fens).
Note: In Hessen methodology, the “Maturity” criterion refers to the current average state of a habitat type, since this methodology treats the habitat more as a geodetic unit than as a type of ecosystem, and is based on the average quality of all the specific habitats of the type in Hessen. Where extreme deviations from the average are too high, the Hessen methodology introduces separate units. For example, in ecosystems such as beech forests, the Hessen methodology has established separate habitat units for the ontogenetic maturity of the ecosystem (Beech Forest on Acid Soil, Mesophyte Beech Forest and Beech Forest on Calcium Soil, Beech Afforestation Before Crowns, natural forests, a common unit of Glades, natural regeneration, and succession in the forest). In the Czech process, based on the Catalogue of Czech habitats for Natura 2000 needs—that is from ecosystem units—an ecosystem is always considered. However, even in some biotopes with fully anthropogenic ecosystems that retain the features of geodetic units in our ecosystem process approach—such as XT5 Herbaceous growths on transport structures and earth dams, X6.1 Parks and gardens with predominance of non-native species, X6.2 Cemeteries with predominance of non-native species, etc.—the ontogenetically understood maturity criterion has no comparable qualitative value. Since the presented article focuses on natural forest habitats, this issue is irrelevant.
Appendix A.9. Specification of Point Evaluation to Forest Habitats
Appendix A.9.1. Maturity
The maturity of all forest habitat types ranges between 4 and 5 points. In the first case, these are the boreal types (for example, oak forests and climax spruce forests, or forest-steppes), in the second case, these are habitats that formed in late postglacial periods (beech forests, hornbeam forests and hard riparian forests). The only exception is represented by peat bog pine groves, which are older in their development and gained 6 points in the evaluation.
Appendix A.9.2. Naturalness
Forests represent climax vegetation in the geographical-climatic conditions of the Czech Republic, and that is why, without any exception, they are evaluated as natural, i.e., with 6 points. A lower score of points was given only to forest covers not close to nature, i.e., visibly altered—see XL3 and XL4.
Appendix A.9.3. Diversity of Structures
Forest habitats generally have four or more layers (number of points awarded: 5 to 6); an exception might be created by acidophilous beech forests poor in shrubby layer.
Appendix A.9.4. Diversity of Species
In this criterion, the forest habitats are more heterogeneous. Bottomland forests, thermophilous oak forests and brash forests have the highest species diversity (6 points), then hornbeam and oak forests, calcareous beech forests and relict flowering pine forests (5 points), and other beech forests (4 points). The lowest score was gained by acidophilous beech forests, acidophilous oak forests, spruce forests and peat bog pine groves with 3 points.
Appendix A.9.5. Rareness of Specific Habitat Type
With regards to only a third of the territory of the Czech Republic covered by forests, and to a significant minority of natural forests from the total forest area, there is no abundant type of large forest habitat. On the contrary, many habitat types are rated as rare. Some types absolutely: hard and soft lowland riparian forests, some types of thermophilous oak forests and pine groves, peat bog birch forests, and pine groves are rated as rare small-scale biotopes (6 points). Only a few rare forest habitat types occur in certain regions in larger areas (5 points), for example, sycamore maple and calcareous beech forests, partly Polish and Carpathian type oak-hornbeam forests. As scattered small-area habitat types (4 points), the following can be assessed: acidophilous, thermophilous and humid oak forests, acidophilous and boreo-continental pine groves, and lady-fern spruce forests. The Hercynian system oak-hornbeam forests, the acidophilous and flowering beech forests, acidophilous and acidophilous oak forests, and montane spruce forests can be considered scattered habitats (3 points). The most widespread though small-scale forest habitat types have been assessed as lowland riparian forests (2 points).
Appendix A.9.6. Rareness of Species
Most forest habitat types with a predominance of European elements have a smaller or an average number of rare species and are therefore evaluated with three points. Many of these species are also facultative and additionally occur in non-forest habitat types (Campanula rapunculoides, Fragaria viridis, Lilium martagon, Lychnis viscaria, Lysimachia vulgaris, Silene nutans, Thalictrum aquilegiifolium, Urtica dioica, Veronica chamaedrys, etc.). Especially for pine groves and partly for some types of thermophilous oak forests that do not create a forest climate, most types of herbaceous layers are “non-forest”. Among other things, for this reason, these forest habitat types are the richest (4 points). On the contrary, the poorest forest habitats in rare species are acidophilous oak forests, continental pine groves and montane spruce forests (2 points).
Appendix A.9.7. Vulnerability
From the point of view of sensitivity, these are generally resistant habitats (evaluated with three points). They are, of course, more or less sensitive to air pollution. Those more sensitive, mainly to water drainage, are only peat bogs, birch forests and wetland alder forests (4 points).
Appendix A.9.8. Threat Level
Due to reasons of still on-going intensive farm management, the area of natural forests is slowly decreasing; the threat level of most types of forest habitats is, therefore, evaluated with four points. From this point of view, the most endangered are thermophilous oak forests and some beech forest types; hard and soft riparian forests are, on the other hand, endangered by changes in water levels (5 points). Conversely, the least endangered from these points of view are brash forests and mountain spruce forests (3 points).
References
- Dasgupta, P. Nature in Economics. Environ. Resour. Econ. 2008, 39, 1–7. [Google Scholar] [CrossRef]
- Polasky, S.; Johnson, K.; Keeler, B.; Kovacs, K.; Nelson, E.; Pennington, D.; Plantiga, A.J.; Withey, J. Are Investments to Promote Biodiversity Conservation and Ecosystem Services Aligned? Oxf. Rev. Econ. Policy 2012, 28, 139–163. [Google Scholar] [CrossRef]
- Gómez-Baggethun, E.; Ruiz-Perez, M. Economic valuation and the commodification of ecosystem services. Prog. Phys. Geogr. 2011, 35, 613–628. [Google Scholar] [CrossRef]
- Parks, S.; Gowdy, J. What have economists learned about valuing nature? A review essay. Ecosyst. Serv. 2013, 3, 1–10. [Google Scholar] [CrossRef]
- Chan, K.M.A.; Guerry, A.D.; Balvanere, P.; Klain, S.; Satterfield, T.; Basurto, X.; Bostrom, A.; Chuenpagdee, R.; Gould, R.; Halpern, B.S.; et al. Where are Cultural and Social in Ecosystem Services? A Framework for Constructive Engagements. BioScience 2012, 62, 744–756. [Google Scholar] [CrossRef]
- Machar, I.; Pechanec, V.; Opršal, Z.; Brus, J. Ecosystem recreational services of a cultural forest Case study from the Velký Kosíř Nature Park, Czech Republic. In Public Recreation and Landscape Protection—With Man Hand in Hand, 1st ed.; Fialová, J., Pernicová, D., Eds.; Mendelova univerzita v Brně: Brno, Czech Republic, 2015; pp. 35–39. ISBN 978-80-7509-251-9. [Google Scholar]
- Gómez-Baggethun, E.; Martín-López, B.; Barton, D.; Braat, L.; Saarikoski, H.; Kelemen, M.; García-Lorente, E.; van den Bergh, J.; Arias, P.; Berry, P.I.; et al. State-of-the-Art Report on Integrated Valuation of Ecosystem Services. European Commission FP7: 1–33. Available online: http://www.openness-project.eu/sites/default/files/Deliverable%204%201_Integrated-Valuation-Of-Ecosystem-Services.pdf (accessed on 13 June 2017).
- Ecosystem Services and Biodiversity. Science for Environment Policy, European Commission. In-Depth Report, Issue 11. 2015. Available online: http://ec.europa.eu/environment/integration/research/newsalert/pdf/ecosystem_services_biodiversity_IR11_en.pdf (accessed on 26 June 2017).
- Gimmi, U.; McInerney, D.; Naudts, K.; Otto, J.; Pasztor, F.; Ryder, J.; Schelhaas, M.J.; Valade, A. Reconstructing European forest management from 1600 to 2010. Biogeosciences 2015, 12, 4291–4316. [Google Scholar] [CrossRef] [Green Version]
- Wunder, S. When payments for environmental services will work for conservation. Conserv. Lett. 2013, 6, 230–237. [Google Scholar] [CrossRef]
- Malinga, R.; Gordon, L.J.; Jewitt, G.; Lindborg, R. Mapping ecosystem services across scales and continents—A review. Ecosyst. Serv. 2015, 13, 57–63. [Google Scholar] [CrossRef]
- Maes, J.; Egoh, B.; Willemen, L.; Liquete, C.; Vihervaara, P.; Schägner, J.P.; Grizetti, B.; Drakou, E.G.; La Notte, A.; Zulian, G.; et al. Mapping ecosystem services for policy support and decision making in the European Union. Ecosyst. Serv. 2012, 1, 31–39. [Google Scholar] [CrossRef]
- Reyers, B.; Polasky, S.; Tallis, H.; Mooney, H.A.; Larigauderie, A. Finding Common Ground for Biodiversity and Ecosystem Services. BioScience 2012, 62, 503–507. [Google Scholar] [CrossRef]
- Atkinson, G.; Bateman, I.; Mourato, S. Recent advances in the valuation of ecosystem services and biodiversity. Oxf. Rev. Econ. Policy 2012, 28, 22–47. [Google Scholar] [CrossRef]
- Ferraro, P.J. The Future of Payments for Ecosystem Services. Conserv. Biol. 2011, 25, 1134–1138. [Google Scholar] [CrossRef] [PubMed]
- García-Amado, L.R.; Pérez, M.R.; García, S.B. Motivation for conservation: Assessing integrated conservation and development projects and payments for environmental services in La Sepultura Biosphere Reserve, Chiapas, Mexico. Ecol. Econ. 2013, 89, 92–100. [Google Scholar] [CrossRef]
- Ferraro, P.J.; Simpson, R.D. The cost-effectiveness of conservation payments. Land Econ. 2002, 78, 339–353. [Google Scholar] [CrossRef]
- Garnett, S.T.; Sayer, J.; Toit, J. Improving the effectiveness of interventions to balance conservation and development: A conceptual framework. Ecol. Soc. 2007, 12, 2–21. [Google Scholar] [CrossRef]
- Farley, J.; Costanza, R. Payments for ecosystem services: From local to global. Ecol. Econ. 2010, 69, 2060–2068. [Google Scholar] [CrossRef]
- Ojea, E.; Martin-Ortega, J.; Chiabai, A. Defining and classifying ecosystem services for economic valuation: The case of forest water services. Environ. Sci. Policy 2012, 19–20, 1–15. [Google Scholar] [CrossRef]
- Czajkowski, M.; Buszko-Briggs, M.; Hanley, N. Valuing changes in forest biodiversity. Ecol. Econ. 2009, 68, 2910–2917. [Google Scholar] [CrossRef]
- Bernard, F.; de Groot, R.S.; Campos, J.J. Valuation of tropical forest services and mechanisms to finance their conservation and sustainable use: A case study of Tapantí National Park, Costa Rica. For. Policy Econ. 2009, 11, 174–183. [Google Scholar] [CrossRef]
- Loučanová, E.; Paluš, H.; Dzian, M. A course of Innovations in wood Processing Industry within the Forestry-Wood Chain in Slovakia: A Q methodology Study to Identify Future Orientation in the Sector. Forests 2017, 8, 210. [Google Scholar] [CrossRef]
- Kremen, C.; Niles, J.O.; Dalton, M.G.; Daily, G.C.; Ehrlich, P.R.; Fay, J.P.; Grewal, D.; Guilery, R.P. Economic Incentives for Rain Forest Conservation Across Scales. Science 2000, 288, 1828–1832. [Google Scholar] [CrossRef] [PubMed]
- Redford, K.H.; Adams, W.M. Payment for Ecosystem Services and the Challenge of Saving Nature. Conserv. Biol. 2009, 23, 785–787. [Google Scholar] [CrossRef] [PubMed]
- Sunderland, T.C.H.; Ehringhaus, C.; Campbell, B.M. Conservation and development in tropical forest landscapes: A time to face the trade-offs? Environ. Conserv. 2007, 34, 276–279. [Google Scholar] [CrossRef]
- Wunder, S. The efficiency of payments for environmental services in tropical conservation. Conserv. Biol. 2007, 21, 48–58. [Google Scholar] [CrossRef] [PubMed]
- Bergseng, E.; Vatn, A. Why protection of biodiversity creates conflict—Some evidence from the Nordic countries. J. For. Econ. 2009, 15, 147–165. [Google Scholar] [CrossRef]
- Elsasser, P. Economic valuation of non-market forest benefits in Germany. In Towards the Sustainable Use of Europe´s Forests—Forest Ecosystem and Landscape Research: Scientific Challenges and Opportunities; Andersson, F., Birot, Y., Paivinen, R., Eds.; European Forest Institute: Joensuu, Finland, 2004; EFI Proceedings No. 49; pp. 25–134. ISBN 952-5453-00-6. [Google Scholar]
- Negi, V.S.; Maikhuri, R.K.; Rawat, L.S. Non-timber products (NTFPs): A viable option for biodiversity conservation and livelihood enhancement in central Himalaya. Biodivers. Conserv. 2011, 20, 545–559. [Google Scholar] [CrossRef]
- Miko, L. Nature and landscape protection in the European context. In Ochrana Přírody a Krajiny v České Republice, 1st ed.; Machar, I., Drobilová, L., Eds.; Palacky University Olomouc: Olomouc, Czech Republic, 2012; pp. 43–49. ISBN 978-80-244-3041-6. [Google Scholar]
- Divisek, J.; Chytry, M.; Grulich, V.; Polakova, L. Landscape classification of the Czech Republic based on the distribution of natural habitats. Preslia 2014, 86, 209–231. [Google Scholar]
- Chytry, M.; Kucera, T.; Koci, M.; Grulich, V.; Lustyk, P. (Eds.) Katalog Biotopů České republiky (Habitat Catalogue of the Czech Republic), 2nd ed.; Agency of Nature Conservation and Landscape Protection: Prague, Czech Republic, 2010; p. 445, ISBN 978-80-87457-02-3. [Google Scholar]
- Loncakova, J. Vrstva mapování biotopů jako podklad pro vymezení evropsky významných lokalit. In Mapování Biotopů v České Republice. Východiska, Výsledky, Perspektivy, 1st ed.; Handrij, H., Loncakova, J., Hosek, M., Eds.; Agency of Nature Conservation and Landscape Protection: Prague, Czech Republic, 2009; pp. 59–65. ISBN 978-80-87051-36-8. [Google Scholar]
- Pechanec, V.; Brus, J.; Kilianová, H.; Machar, I. Decision support tool for the evaluation of landscapes. Ecol. Inform. 2015. [Google Scholar] [CrossRef]
- Cudlin, P.; Prokopova, M.; Francirkova, T.; Buresova, R.; Smrz, T.; Boucnikova, T. System NATURA 2000 utilization for purposes of biotope valuation. Ekológia 2005, 24, 52–68. [Google Scholar]
- Kilianova, H.; Pechanec, V.; Svobodova, J.; Machar, I. Analysis of the evolution of the floodplain forests in the alluvium of the Morava River. In Proceedings of the 12th International Multidisciplinary Scientific GeoConference SGEM, Sofia, Bulgaria, 17–23 June 2012; STEF92 Technology Ltd.: Sofia, Bulgaria, 2012; Volume IV, pp. 1–8. [Google Scholar] [CrossRef] [Green Version]
- Prach, K. Ecological Restoration: Principles, Values, and Structure of an Emerging Profession. Restor. Ecol. 2008, 16. [Google Scholar] [CrossRef]
- Oprsal, Z.; Kladivo, P.; Machar, I. The role of selected biophysical factors in long-term land-use change of cultural landscape. Appl. Ecol. Environ. Res. 2016, 14, 23–40. [Google Scholar] [CrossRef]
- Gatto, M.; De Leo, G.A. Pricing Biodiversity and Ecosystem Services: The Never-Ending Story. Bioscience 2000, 50, 347–355. [Google Scholar] [CrossRef]
- Pimentel, D.; Wilson, C.; Mc Cullum, C.; Huang, R.; Dwen, P.; Flack, J.; Tran, Q.; Saltman, T.; Cliff, B. Economic and Environmental Benefits of Biodiversity. Bioscience 1997, 47, 747–757. [Google Scholar] [CrossRef]
- Plesnik, J. Ecosystem Ecology Contribution for Conservation Biology. In Ochrana Přírody a Krajiny v České Republice, 1st ed.; Machar, I., Drobilová, L., Eds.; Palacky University Olomouc: Olomouc, Czech Republic, 2012; Volume I and II, pp. 13–21. ISBN 978-80-244-3041-6. [Google Scholar]
- Povazan, R.; Getzner, M.; Svajda, J. On the evaluation of ecosystem services in Muránska Planina National Park (Slovakia). J. Prot. Mt. Areas Res. 2015, 7, 61–69. [Google Scholar] [CrossRef]
- Rambonilaza, T.; Brahic, E. Non-market values of forest biodiversity and the impact of informing the general public: Insights from generalized multinominal logit estimations. Environ. Sci. Policy 2016, 64, 93–100. [Google Scholar] [CrossRef]
- De Groot, R.; Brander, L.; van der Ploeg, S.; Constanza, R.; Bernard, F.; Braat, L.; Christie, M.; Crossman, N.; Ghermandi, A.; Hein, L. Global estimates of the value of ecosystems and their services in monetary units. Ecosyst. Serv. 2012, 1, 50–61. [Google Scholar] [CrossRef]
- Chang, J.; Symes, W.S.; Lim, F.; Carrasco, L.R. International trade causes large net economic losses in tropical countries via the destruction of ecosystem services. Ambio 2016, 45, 387–397. [Google Scholar] [CrossRef] [PubMed]
- Ninan, K.N.; Inoue, M. Valuing forest ecosystem services: What we know and what we don’t. Ecol. Econ. 2013, 93, 137–149. [Google Scholar] [CrossRef]
- D’Amato, D.; Rekola, M.; Li, N.; Toppinen, A. Monetary valuation of forest ecosystem services in China: A literature review and identification of future research needs. Ecol. Econ. 2016, 121, 75–84. [Google Scholar] [CrossRef]
- Apostolopoulou, E.; Pantis, J.D. Conceptual gaps in the national strategy for the implementation of the European Natura 2000 conservation policy in Greece. Biol. Conserv. 2009, 142, 221–237. [Google Scholar] [CrossRef]
- Ferranti, F.; Beunen, R.; Speranza, M. Natura 2000 Network: A Comparison of the Italian and Dutch Implementation Experiences. J. Environ. Policy Plan. 2010, 12, 293–314. [Google Scholar] [CrossRef]
- Hily, E.; Garcia, S.; Stenger, A.; Gengyang, T. Assessing cost-effectiveness of a biodiversity conservation policy: A bio-econometric analysis of Natura 2000 contracts in forests. Ecol. Econ. 2015, 119, 197–208. [Google Scholar] [CrossRef]
- Kurtilla, M.; Pykäläinen, J.; Leskinen, P. Defining the forest landowner’s utility-loss compensative subsidy level for a biodiversity object. Eur. J. For. Res. 2006, 125, 67–78. [Google Scholar] [CrossRef]
- Yousefpour, R.; Hanewinkel, M. Modelling of forest conversion planning with an adaptive simulation-optimization approach and simultaneous consideration of the values of timber, carbon and biodiversity. Ecol. Econ. 2009, 68, 1711–1722. [Google Scholar] [CrossRef]
- Spathelf, P. Sustainable Forest Management as a Model for Sustainbale Development: Conclusions Toward a Concrete Vision. Sustain. For. Manag. Chang. World Manag. For. Ecosyst. 2009, 19, 237–240. [Google Scholar] [CrossRef]
- Buongiorno, J.; Gilless, J.K. Decision Methods for Forest Resource Management; Academic Press: Amsterdam, The Netherlands, 2003; p. 439, ISBN 9780121413606. [Google Scholar]
- Yousefpour, R.; Hanewinkel, M.; Le Moguedec, G. Evaluation of biodiversity for multi-purpose forest management using a non-linear optimization approach. Appl. Ecol. Environ. Res. 2010, 8, 241–260. [Google Scholar]
- Pretzsch, H.; Grote, R.; Reineking, B.; Rötzer, T.; Seifert, S. Models for forest ecosystem management: A European perspective. Ann. Bot. 2008, 101, 1065–1087. [Google Scholar] [CrossRef] [PubMed]
- Simon, J.; Machar, I.; Buček, A. Linking the historical research with the growth simulation model of hardwood floodplain forests. Pol. J. Ecol. 2014, 62, 273–288. [Google Scholar] [CrossRef]
- Hasenauer, H. Sustainable Forest Management: Growth Models for Europe, 1st ed.; Springer: Berlin/Heidelberg, Germany, 2006; p. 398. ISBN 978-3-540-26098-1. [Google Scholar]
- Machar, I.; Vlckova, V.; Bucek, A.; Vozenilek, V.; Salek, L.; Jerabkova, L. Modelling of Climate Conditions in Forest Vegetation Zones as a Support Tool for Forest Management Strategy in European Beech Dominated Forests. Forests 2017, 8, 82. [Google Scholar] [CrossRef]
- Hanewinkel, M. Economic aspects of the transformation from even-aged pure stands of Norway spruce to unven-aged mixed stands of Norway spruce and beech. For. Ecol. Manag. 2001, 151, 181–193. [Google Scholar] [CrossRef]
- Spiecker, H. Silvicultural management in maintaining biodiversity and resistance f forests in European-temperate zone. J. Environ. Manag. 2003, 67, 55–65. [Google Scholar] [CrossRef]
- Machar, I. Attempt to summarize the problems: Is a sustainable management of floodplain forest geobiocenoses possible? In Biodiversity and Target Management of Floodplain Forests in the Morava River Basin (Czech Republic), 1st ed.; Palacky University Olomouc: Olomouc, Czech Republic, 2010; pp. 189–226. ISBN 978-80-244-2530-6. [Google Scholar]
- Morse-Jones, S.; Luisetti, T.; Turner, R.K.; Fisher, B. Ecosystem valuation: Some principles and a partial application. Envirometrics 2011, 22, 675–685. [Google Scholar] [CrossRef]
- Sundstrom, S.M.; Allen, C.G.; Barichievy, C. Species, functional groups, and thresholds in ecological resilience. Conserv. Biol. 2012, 26, 305–314. [Google Scholar] [CrossRef] [PubMed]
- Vizzarri, M.; Tognetti, R.; Machetti, M. Forest Ecosystem Services: Issues and Challenges for Biodiversity, Conservation, and Management in Italy. Forests 2015, 6, 1810–1838. [Google Scholar] [CrossRef]
- Admiraal, J.F.; Wossink, A.; de Groot, W.T.; de Snoo, G.R. More than total economic value: How to combine economic valuation of biodiversity with ecological resilience. Ecol. Econ. 2013, 89, 115–122. [Google Scholar] [CrossRef]
- Eppink, F.V.; van den Bergh, J.C.J.M. Ecological theories and indicators in economic models of biodiversity loss and Conservation: A critical review. Ecol. Econ. 2007, 61, 284–293. [Google Scholar] [CrossRef]
- Larsen, J.B. Ecological stability of forest and sustainable silviculture. For. Ecol. Manag. 1995, 73, 85–96. [Google Scholar] [CrossRef]
- Brock, W.A.; Xepapadeas, A. Valuing Biodiversity from an Economic Perspective: A Unified Economic, Ecological and Genetic Approach. Am. Econ. Rev. 2003, 93, 1597–1614. [Google Scholar] [CrossRef]
- Salles, J.M. Valuing biodiversity and ecosystem services: Why put economic values on nature? C. R. Biol. 2011, 334, 469–482. [Google Scholar] [CrossRef] [PubMed]
- Cocks, M.; Lopez, C.; Dold, T. Cultural Importance of Non-timber Forest Products: Opportunities they Pose for Bio-Cultural Diversity in dynamic Societies. In Non-Timber Forest Products in the Global Context, 1st ed.; Part of the Tropical Forestry Book Series; Shackleton, S., Shackleton, C., Shanley, P., Eds.; Springer: Berlin/Heidelberg, Germany, 2011; Volume 7, pp. 107–128. ISBN 978-3-642-17982-2. [Google Scholar]
- Hampicke, U. Ethics and economics in conservation. Biol. Conserv. 1994, 67, 219–231. [Google Scholar] [CrossRef]
- Miteva, D.A.; Pattanayak, S.K.; Ferraro, P.J. Evaluation of Biodiversity Policy Instruments: What Works and What Doesn’t? Oxf. Rev. Econ. Policy 2012, 28, 69–92. [Google Scholar] [CrossRef]
- Houdet, J.; Trommetter, M.; Weber, J. Understanding changes in business strategies regarding biodiversity and ecosystem services. Ecol. Econ. 2012, 73, 37–46. [Google Scholar] [CrossRef]
- McGrath, M.J.; Luyssaert, S.; Meyfroidt, P.; Kaplan, J.O.; Bürgi, M.; Chen, Y.; Erb, K.; D’Amato, D.; Li, N.; Rekola, M.; et al. Linking forest ecosystem services to corporate sustainability disclosure: A conceptual analysis. Ecosyst. Serv. 2015, 14, 170–178. [Google Scholar] [CrossRef]
- Lakerveld, R.P.; Lele, S.; Crane, T.A.; Fortuin, K.P.J.; Springate-Baginski, O. The social distribution of provisioning forest ecosystem services: Evidence and insights from Odisha, India. Ecosyst. Serv. 2015, 14, 56–66. [Google Scholar] [CrossRef]
- Kuttner, M.; Essl, F.; Petrseil, J.; Dullinger, S.; Rabitsch, W.; Schindler, S.; Hulber, K.; Gattringer, A.; Moser, D. A new high-resolution habitat distribution map for Austria, Liechtenstein, southern Germany, South Tyrol and Switzerland. J. Prot. Mt. Areas Res. 2015, 7, 18–29. [Google Scholar] [CrossRef]
- Helm, D.; Hepburn, C. The economic analysis of biodiversity: An assessment. Oxf. Rev. Econ. Policy 2012, 28, 1–21. [Google Scholar] [CrossRef]
- Farber, S.C.; Constanza, R.; Wilson, M.A. Economic and ecological concepts for valuing ecosystem services. Ecol. Econ. 2002, 41, 375–392. [Google Scholar] [CrossRef]
- Machar, I.; Vozenilek, V.; Simon, J.; Pechanec, V.; Brus, J.; Fulnecek, P.; Vitek, T. Joining of the historical research and future prediction as a support tool for the assessment of management strategy for European beech-dominated forests in protected areas. Nat. Conserv. Bulg. 2017, 22, 51–78. [Google Scholar] [CrossRef]
Figure 1.
Network of Special Areas of Conservation (SAC) in the Czech Republic.

Figure 2.
Visualisation of the point value evaluation of natural forest habitats in the Czech Republic.
Figure 2.
Visualisation of the point value evaluation of natural forest habitats in the Czech Republic.


Table 1.
Point values for natural forest habitat in the Czech Republic.
| Habitat Type | Matureness | Naturalness | Diversity of Plant Species | Diversity of Animal Species | Rareness of Habitat | Rareness of Species | Vulnerability | Threat to Existence | Point Value of Habitat Type | |
|---|---|---|---|---|---|---|---|---|---|---|
| L1 | Alder carrs | 5 | 6 | 5 | 5 | 4 | 3 | 4 | 4 | 55 |
| L10.1 | Birch mire forests | 5 | 6 | 5 | 3 | 6 | 3 | 4 | 4 | 56 |
| L10.2 | Pine mire forests with Vaccinium | 6 | 6 | 5 | 3 | 6 | 2 | 4 | 4 | 56 |
| L10.3 | Pine forests of continental mires with Eriophorum | 6 | 6 | 5 | 3 | 6 | 3 | 4 | 4 | 59 |
| L10.4 | Pinus rotundata bog forests | 6 | 6 | 5 | 3 | 6 | 3 | 4 | 4 | 59 |
| L2.1 | Montane grey alder galleries | 5 | 6 | 5 | 6 | 6 | 3 | 3 | 3 | 57 |
| L2.2A | Ash-alder alluvial forests | 4 | 6 | 6 | 6 | 2 | 3 | 3 | 3 | 42 |
| L2.2B | Brooks and degraded alluvial forests | 2 | 4 | 6 | 6 | 2 | 3 | 3 | 3 | 33 |
| L2.3A | Hardwood forests of lowland rivers | 4 | 6 | 6 | 5 | 6 | 4 | 3 | 5 | 66 |
| L2.3B | Hardwood forests of lowland rivers, degraded by humans | 3 | 2 | 6 | 5 | 6 | 4 | 3 | 5 | 50 |
| L2.4 | Willow-poplar forests of lowland rivers | 4 | 6 | 6 | 6 | 6 | 3 | 3 | 5 | 65 |
| L3.1 | Hercynian oak-hornbeam forests | 4 | 6 | 6 | 5 | 3 | 3 | 3 | 4 | 47 |
| L3.2 | Polonian oak-hornbeam forests | 4 | 6 | 6 | 5 | 5 | 3 | 3 | 4 | 55 |
| L3.3 | Carpathian oak-hornbeam forests | 4 | 6 | 6 | 5 | 5 | 4 | 3 | 4 | 58 |
| L3.3A | Pannonian-Carpathian oak-hornbeam forests | 4 | 6 | 6 | 5 | 5 | 4 | 3 | 4 | 58 |
| L3.3B | West Carpathian oak-hornbeam forests | 4 | 6 | 6 | 5 | 5 | 4 | 3 | 4 | 58 |
| L3.3C | Hercynian-Carpathian oak-hornbeam forests | 4 | 6 | 6 | 5 | 5 | 4 | 3 | 4 | 58 |
| L3.3D | Polonsky Carpathian oak-hornbeam forests | 4 | 6 | 6 | 5 | 5 | 4 | 3 | 4 | 58 |
| L3.4 | Pannonian oak-hornbeam forests | 4 | 6 | 6 | 6 | 5 | 4 | 3 | 4 | 61 |
| L4A | Ravine forests | 4 | 6 | 6 | 6 | 2 | 3 | 3 | 3 | 42 |
| L4B | Ravine forests degraded | 4 | 6 | 6 | 6 | 2 | 3 | 3 | 3 | 42 |
| L5.1 | Herb-rich beech forests | 4 | 6 | 6 | 4 | 3 | 3 | 3 | 4 | 45 |
| L5.2 | Montane sycamore-beech forests | 4 | 6 | 6 | 4 | 5 | 3 | 3 | 4 | 52 |
| L5.3 | Limestone beech forests | 4 | 6 | 6 | 5 | 5 | 4 | 3 | 5 | 62 |
| L5.4 | Acidophilous beech forests | 4 | 6 | 5 | 3 | 3 | 2 | 3 | 4 | 38 |
| L6.1 | Peri-Alpidic basiphilous thermophilous oak forests | 5 | 6 | 6 | 5 | 6 | 4 | 3 | 5 | 69 |
| L6.2 | Pannonian thermophilous oak forests on loess | 5 | 6 | 6 | 6 | 6 | 4 | 3 | 5 | 72 |
| L6.3 | Pannonian thermophilous oak forests on sand | 5 | 6 | 6 | 5 | 6 | 4 | 3 | 5 | 69 |
| L6.4 | Central European basiphilous thermophilous oak forests | 5 | 6 | 6 | 6 | 4 | 4 | 3 | 4 | 60 |
| L6.5A | Acidophilous thermophilous oak forests | 5 | 6 | 6 | 5 | 4 | 4 | 3 | 5 | 62 |
| L6.5B | Acidophilous thermophilous oak forests-degraded | 4 | 6 | 6 | 5 | 4 | 3 | 3 | 4 | 51 |
| L7.1 | Dry acidophilous oak forests | 4 | 6 | 5 | 3 | 3 | 2 | 3 | 4 | 38 |
| L7.2 | Wet acidophilous oak forests | 4 | 6 | 5 | 3 | 4 | 2 | 3 | 4 | 41 |
| L7.3 | Subcontinental pine-oak forests | 5 | 6 | 5 | 3 | 4 | 2 | 3 | 4 | 43 |
| L7.4 | Acidophilous oak forests on sand | 5 | 6 | 5 | 3 | 6 | 3 | 3 | 4 | 53 |
| L8.1A | Boreo-continental pine forests with lichens on sand | 6 | 6 | 5 | 3 | 4 | 2 | 3 | 3 | 43 |
| L8.1B | Boreo-continental pine forests, other stands | 5 | 6 | 5 | 3 | 4 | 2 | 3 | 3 | 40 |
| L8.2 | Forest-steppe pine forests | 5 | 6 | 6 | 5 | 6 | 3 | 3 | 4 | 61 |
| L8.3 | Peri-Alpidic serpentine pine forests | 5 | 6 | 5 | 5 | 6 | 3 | 3 | 4 | 58 |
| L9.1 | Montane Calamagrostis spruce forests | 5 | 6 | 5 | 3 | 3 | 2 | 3 | 3 | 36 |
| L9.2A | Bog spruce forests | 5 | 6 | 5 | 4 | 6 | 3 | 3 | 4 | 56 |
| L9.2B | Waterlogged spruce forests | 5 | 6 | 5 | 3 | 3 | 3 | 3 | 4 | 43 |
| L9.3 | Montane Athyrium spruce forests | 5 | 6 | 5 | 3 | 4 | 3 | 3 | 3 | 43 |
Table 2.
Area and monetary value of natural forest habitats in the Czech Republic.
| Habitat | Area in CR (km2) | Area in SAC (km2) | Area in SAC (%) | Monetary Value of Habitat (in Thousands of Euros) | |
|---|---|---|---|---|---|
| L1 | Alder carrs | 37.47 | 11.47 | 30.6 | 373,093 |
| L10.1 | Birch mire forests | 14.48 | 7.63 | 52.7 | 252,859 |
| L10.2 | Pine mire forests with Vaccinium | 43.73 | 13.43 | 30.7 | 445,043 |
| L10.3 | Pine forests of continental mires with Eriophorum | 0.73 | 0.37 | 50.7 | 13,069 |
| L10.4 | Pinus rotundata bog forests | 10.01 | 9.52 | 95.1 | 332,253 |
| L2.1 | Montane grey alder galleries | 5.56 | 4.52 | 81.3 | 152,293 |
| L2.2A | Ash-alder alluvial forests | 524.34 | 97.9 | 18.6 | 2,432,566 |
| L2.2B | Brooks and degraded alluvial forests | 271.7 | 24.47 | 9 | 477,642 |
| L2.3A | Hardwood forests of lowland rivers | 161.66 | 117.72 | 72.8 | 4,596,270 |
| L2.3B | Hardwood forests of lowland rivers, degraded by humans | 79.72 | 44.25 | 55.5 | 1308,875 |
| L2.4 | Willow-poplar forests of lowland rivers | 26.43 | 9.14 | 34.6 | 351,457 |
| L3.1 | Hercynian oak-hornbeam forests | 1010.6 | 233.58 | 23.1 | 6,494,272 |
| L3.2 | Polonian oak-hornbeam forests | 112.58 | 16.62 | 14.8 | 540,878 |
| L3.3 | Carpathian oak-hornbeam forests | 0.01 | 0.01 | 100 | 260 |
| L3.3A | Pannonian-Carpathian oak-hornbeam forests | 42.59 | 26.63 | 62.5 | 913,761 |
| L3.3B | West Carpathian oak-hornbeam forests | 376.66 | 125.6 | 33.3 | 4,309,511 |
| L3.3C | Hercynian-Carpathian oak-hornbeam forests | 17.88 | 0.78 | 4.4 | 26,695 |
| L3.3D | Polonsky Carpathian oak-hornbeam forests | 0.44 | 0 | 0 | 0 |
| L3.4 | Pannonian oak-hornbeam forests | 57.05 | 32.91 | 57.7 | 1,187,527 |
| L4A | Ravine forests | 207.85 | 64.38 | 47.9 | 1,599,791 |
| L4B | Ravine forests degraded | 1.48 | 0.35 | 23.6 | 8,637 |
| L5.1 | Herb-rich beech forests | 1229.28 | 578.26 | 47 | 15,393,607 |
| L5.2 | Montane sycamore-beech forests | 9.21 | 7.68 | 83.4 | 236,159 |
| L5.3 | Limestone beech forests | 9.6 | 5.83 | 60.7 | 213,952 |
| L5.4 | Acidophilous beech forests | 1473.99 | 693.9 | 47.1 | 15,598,527 |
| L6.1 | Peri-Alpidic basiphilous thermophilous oak forests | 9.11 | 6.72 | 73.8 | 274,371 |
| L6.2 | Pannonian thermophilous oak forests on loess | 16.54 | 13.94 | 84.3 | 593,643 |
| L6.3 | Pannonian thermophilous oak forests on sand | 13.73 | 9.01 | 65.6 | 367,574 |
| L6.4 | Central European basiphilous thermophilous oak forests | 39.18 | 13.59 | 34.7 | 482,333 |
| L6.5A | Acidophilous thermophilous oak forests | 2.17 | 1.91 | 88 | 69,911 |
| L6.5B | Acidophilous thermophilous oak forests-degraded | 66.12 | 21.94 | 33.2 | 661,981 |
| L7.1 | Dry acidophilous oak forests | 397.51 | 50.65 | 12.7 | 1,138,513 |
| L7.2 | Wet acidophilous oak forests | 104.13 | 15.42 | 14.8 | 374,029 |
| L7.3 | Subcontinental pine-oak forests | 259.27 | 66.74 | 25.7 | 1,697,803 |
| L7.4 | Acidophilous oak forests on sand | 10.86 | 0.45 | 4.1 | 14,247 |
| L8.1A | Boreo-continental pine forests with lichens on sand | 11.73 | 9.46 | 80.6 | 240,642 |
| L8.1B | Boreo-continental pine forests, other stands | 135.64 | 23.41 | 17.3 | 553,993 |
| L8.2 | Forest-steppe pine forests | 3.84 | 1.61 | 41.9 | 58,211 |
| L8.3 | Peri-Alpidic serpentine pine forests | 0.45 | 0.36 | 80 | 12,247 |
| L9.1 | Montane Calamagrostis spruce forests | 438.81 | 344.16 | 78.4 | 7,329,289 |
| L9.2A | Bog spruce forests | 60.02 | 41.63 | 69.4 | 1,379,223 |
| L9.2B | Waterlogged spruce forests | 298.13 | 167.92 | 56.3 | 4,271,382 |
| L9.3 | Montane Athyrium spruce forests | 9.44 | 6.99 | 74 | 177,909 |
| Total | 7601.73 | 2922.89 | 38.5 | 76,956,298 | |
© 2017 by the authors. Licensee MDPI, Basel, Switzerland. This article is an open access article distributed under the terms and conditions of the Creative Commons Attribution (CC BY) license (http://creativecommons.org/licenses/by/4.0/).
Share and Cite
MDPI and ACS Style
Pechanec, V.; Machar, I.; Sterbova, L.; Prokopova, M.; Kilianova, H.; Chobot, K.; Cudlin, P. Monetary Valuation of Natural Forest Habitats in Protected Areas. Forests 2017, 8, 427. https://doi.org/10.3390/f8110427
AMA Style
Pechanec V, Machar I, Sterbova L, Prokopova M, Kilianova H, Chobot K, Cudlin P. Monetary Valuation of Natural Forest Habitats in Protected Areas. Forests. 2017; 8(11):427. https://doi.org/10.3390/f8110427
Chicago/Turabian StylePechanec, Vilem, Ivo Machar, Lenka Sterbova, Marcela Prokopova, Helena Kilianova, Karel Chobot, and Pavel Cudlin. 2017. "Monetary Valuation of Natural Forest Habitats in Protected Areas" Forests 8, no. 11: 427. https://doi.org/10.3390/f8110427
Note that from the first issue of 2016, this journal uses article numbers instead of page numbers. See further details here.