Article

Decreasing Deforestation in the Southern Brazilian Amazon—The Role of Administrative Sanctions in Mato Grosso State

by
Paulo Queiroz Sousa
Graduate School of Environmental Studies, Tohoku University, Sendai 980-0845, Japan
Forests 2016, 7(3), 66; https://doi.org/10.3390/f7030066
Submission received: 19 August 2015 / Revised: 2 March 2016 / Accepted: 9 March 2016 / Published: 12 March 2016

Abstract

:
Forest conservation efforts through regulatory enforcement routinely failed to prevent large scale deforestation in the Brazilian Amazon. However, a turning point occurred in 2005, when a combination of unfavorable economic conditions and an unprecedented coordinated effort between governmental institutions resulted in a gradual slowdown in deforestation. The continuation of this deforestation slowdown in an environment of economic recovery and expansion after 2009 suggests that regulatory enforcement achieved a measure of success not experienced before. In this study, the impact of fines, embargoes on rural private properties, and confiscation of means of production and produce on deforestation in the Southern Amazon state of Mato Grosso was considered through regression and GIS-based analyses. It was found that while all three sanctions were negatively correlated with deforestation, there were important differences in their level of enforcement. Embargoes were effectively implemented and showed high deforestation deterrence effectiveness, but the actual collection of the values of fines issued was extremely low, which casts doubts on their actual effectiveness as a deforestation deterrence mechanism. The results suggest that while sanctions for illegal deforestation have played an important role in the slowdown in deforestation, measures to increase the collection of fines issued are urgently needed.

1. Introduction

In 2012, Brazil lost in the vicinity of 4500 square kilometers of forest in the Amazon, the lowest level since satellite monitoring began in 1988. The declining trend in deforestation started in 2005, one year after the implementation of the PPCDAM (Federal Action Plan for Prevention and Control of Deforestation in the Amazon). Designed as a direct response to the extremely high deforestation of 75 thousand square kilometers between 2002 and 2004, the plan is centered on three main components: the stronger monitoring and control of deforestation activities, improved territorial management, and the promotion of sustainable economic activities.
The Brazilian Amazon is a heterogeneous region with 5 million square kilometers spread across 9 states, all of which have very distinct social and economic conditions. States like Roraima and Amapa to the north are relatively isolated and sparsely populated, whereas Mato Grosso in the southern Amazon lies in an agricultural frontier region and is relatively well connected to the rest of the country. The slowdown in deforestation has not occurred evenly across these states; rather, it is a phenomenon most notably observed in Mato Grosso, where deforestation decreased 92.7% between 2003 and 2012 (Figure 1). At the same time, growth in both bovine livestock farming and soy bean plantations was observed; these activities not only have a central role in the economy of the state [1] but are also considered as prime direct causes of Amazon deforestation [2,3,4,5,6,7,8,9,10].
A growing body of scientific literature that attempts to explain the recent slowdown in deforestation has emerged [15]. Some authors focus on government strategies that led to an increasing presence of the state in areas that would otherwise have been illegally deforested, such as the increase in the field presence of law enforcement agents as a result of the enhanced satellite-based deforestation monitoring system [16], or deforestation monitoring and control measures targeted at priority municipalities [17]. Other authors argue that the fluctuations in the demand of agricultural commodities produced in the Amazon and how this reflected in the prices of commodities was directly proportional to deforestation rates in the period [9,18]. In other reports, the importance of the roles played by the federal government and organized civil society is stressed, with particular reference to the impact of pressure and interventions on beef and soy supply chains [19,20].
Given that the slowdown in deforestation is still a recent phenomenon, knowledge gaps remain. The federal environmental agency IBAMA (Brazilian Institute for Environment and Natural Resources) has at its disposal three main types of sanctions against illegal deforestation: fines, the imposition of embargoes on rural private properties, and the confiscation of means of production used for illegal deforestation and produce derived from deforested land. While the increase in the imposition of fines [16] and in their average value [9] has been associated with the reduction in deforestation, no analyses on the actual enforcement of these fines (the collection of the actual monetary values of the fines) has been conducted for fines issued after 2005. More importantly, to our best knowledge, the role played by the confiscation of means of production and by embargoes on the deforestation slowdown process is a topic that has yet to be subject to any type of scientific analysis.
Considering the above, the aim of this paper is to assess the extent to which environmental law enforcement played a role in changing the behavior of rural producers towards compliance with the law, and therefore engaging in less deforestation. Toward this aim, the paper offers the first integrated assessment of the main administrative sanctions at the disposal of IBAMA to reduce deforestation in Mato Grosso state. In addition to deforestation-related fines, the paper uses data on the confiscation of goods and means of production carried out by the Mato Grosso branch of IBAMA and national data on the embargo of properties to perform regression and GIS temporal and spatial analyses.

2. Theoretical Background

2.1. Enforcement of Law Theory

Many discussions on the enforcement of law are based on Becker’s seminal paper Crime and Punishment: an Economic Approach. Employing the guiding question ([21], p. 170) “how many resources and how much punishment should be used to enforce different kinds of legislation?”, Becker saw crime deterrence as directly proportional to the expected penalty (actual penalty multiplied by the probability of detection and punishment) and, given the resources required for policing the laws [22], concluded that the optimal form of deterrence is to set fines as high as possible while reducing the level of costly monitoring ([23], p. 28).
However, subsequent works on Becker’s basic model cite the limitations of simply setting fines as high as possible [23], emphasizing instead that the optimal level of enforcement is likely to require a relatively high probability of detection and relatively low fine. Three main reasons are proposed. Firstly, the desirable marginal deterrence effect of capping fines at the level of an individual’s wealth [24]. Secondly, high fines encourage activities that reduce the probability of an individual being caught and fined [22,25]. Thirdly, the possibility of greater bribe taking increases when higher fines are applied in a bribery-prone environment [26]. Despite the differing views, there is a general agreement that compliance is elicited mainly through enforcement, which encompasses the monitoring, detection, and punishment of infractions [27,28,29,30].
Many factors contribute to non-compliance with forest-related law. They include (1) a flawed policy and legal framework; (2) low enforcement capacity; (3) lack of information about the forest resources and illegal operations; (4) corruption; and (5) the high demand for timber [31]. The slow pace of legal systems is also a cause for non-compliance, as costly and lengthy legal procedures culminate in few convictions, reducing the effectiveness of the law [23,32,33]. As a form to avoid the slow pace of legal systems, settlements in lieu of trial have also been considered [34], and while they have the potential to dilute deterrence because of the expected dilution of the sanction, the state may be able to counter this by increasing the level of sanctions.
In addition to fines, other methods of sanctions that rely on decreasing the marginal gain of illicit activities are also available in forest law enforcement systems, such as confiscation of produce or means of production [29], or conditioning access to public credit on compliance with (environmental) law [35]. As such, it is possible to model illegal deforestation in the Amazon as:
d e f = f ( I P p ( c F + C + E ) )
where def, the illegal deforestation, is a function f of the illegal profit IP, p is the probability of detection, c indicates the collection percentage of fines F issued, C is the confiscation of means of production or produce, and E is the embargo of the property of the law offender. From Equation (1), it follows that in order for deforestation not to occur, p ( c F + C + E )   > I P .
When considering the above conceptual discussions with the realities of Mato Grosso state, the introduction of the satellite based deforestation monitoring system DETER (Real Time Deforestation Detection) in 2004 allowed IBAMA to rapidly allocate its rangers to areas being deforested, increasing the probability of acting upon infractions and thus contributing toward higher law compliance [16,36]. However, the extent to which higher infraction detection rates were followed by the effective implementation of fines and other administrative sanctions in Mato Grosso state is still unclear. The few studies available on fines indicate that extremely low rates of collection of the value of fines reduced their deterrent effect [32,33]; however, such studies are restricted to states other than Mato Grosso, to a period prior to the recent deforestation slowdown trend, and to specific types of land regimes like protected areas.
Given that variation in the prices of commodities contributed to lower deforestation from 2004 onwards [9,18], and that the government introduced technological improvements that allowed for increased probability of detection of illegal deforestation [13,16], the present paper will test 3 hypotheses concerning the implementation of administrative sanctions and deforestation decrease. The first hypothesis is that the increase in fining intensity (value of fine per hectare) was accompanied by the higher collection of fines, as measured by higher collection percentages of the values issued. There are no benchmarks to qualify a collection percentage of fines to be high or low, and given that the limited literature available reports collection of the issued values at around 2%, the actual percentage is expected to be higher than this. The second hypothesis is that embargoes are effective deterrents against deforestation, as measured by no forest loss within the embargoed rural property after the imposition of the sanction. The last hypothesis is that there is a negative correlation between deforestation and effectively implemented administrative sanctions, namely fines, embargoed rural properties and confiscation events involving vehicles (which directly limits the ability to conduct deforestation).

2.2. Ibama and the Application of Administrative Sanctions

Until 2007, IBAMA was the main government agency responsible for forest management and illegal deforestation control in the Amazon. The enactment of Law N. 11516/2007 established ICM (Chico Mendes Institute) as the main implementer of the federal government protected areas policy, and allowed ICM and state-level environmental agencies to conduct some of the duties that had hitherto been the attribution of IBAMA alone, such as the issuing of permits for logging and deforestation, illegal deforestation monitoring, and the application of sanctions for forest crimes.
The Brazilian Constitution allows perpetrators of environmental damage to be held accountable at civil, criminal, and administrative levels. Civil liability does not require any demonstration of guilt. Offenders are obliged to restore the affected areas or, in cases where it is deemed impossible for the area to be recovered, pay an indemnity. Criminal liability occurs when there are violations of the penal code concerning the environment, and only the Prosecutorial Office can initiate criminal actions against offenders. State and federal environmental agencies, i.e., IBAMA, are responsible for the imposition of administrative penalties set under the Law of Environmental Crimes.
The three main administrative sanctions at the disposal of IBAMA in the fight against deforestation are the application of fines, the imposition of embargoes on rural properties, and the confiscation of the means used for illegal deforestation or the produce that resulted from it. Figure 2 presents the fine issuance and collection process. Upon detecting an environmental infraction and identifying the offender, IBAMA’s Inspection Division issues a notice of infraction stating which laws were violated, the extent of the damage, and the monetary value of the fine. This notice of infraction is then sent to the IBAMA Executive Management Bureau of the state where the infraction took place, where consideration is given to any relevant aggravating or extenuating circumstances, if any, and to the value of the fine. It is then homologated and sent to the offender. After receiving the fine, the offender may present their defense and request either a reduction or a cancelation of the fine. Until 2008, depending on the value of the fine, the accused could make as many as four appeals during this defense analysis period, namely to the Executive Management of IBAMA, the Presidency of IBAMA, the Ministry of Environment, and finally to CONAMA (National Council of Environment) until the fine actually entered into the category of active debt or was canceled. At any stage during the fine issuing, defense or collection processes, the offender may take legal action to query any of the procedures, further delaying the collection of the fine. A new code regulating the application of fines, Decree N. 6514/2008, substituted Decree N. 3179/1999, reducing the number of appeals to two: one within IBAMA, and one to CONAMA.
The imposition of embargoes is regulated at the federal level by Law N. 9605/1998, Decree N. 6514/2008, Ministry of Environment Normative Instruction N. 1/2008, and within IBAMA by Normative Instructions N. 14/2009. Embargoes are imposed when IBAMA agents inspect a property and detect that the deforestation occurred therein was illegal, and that the (risk of continuing) damage to the environment is grave. At this point a notice of embargo, which comes into effect immediately, is issued to the land owner or local responsible, the activity causing the environmental damage has to cease, and no product from that area can be traded. The location of the property and name of the property owner are publicly announced through a list made available by the Ministry of Environment, and the property is subject to rural credit restrictions and stricter monitoring.
There are three occasions when the embargo on the property can be lifted upon request of the property owner. The first is when the notice of embargo has insoluble data input defects and is thus deemed by the judging authority to be null and void. The second is when it is proved that the landowner had no direct responsibility for the damage incurred. The third is when the landowner implements a set of actions aimed at mitigating and recovering the area, including the signing of the so-called conduct-adjustment agreement. While in the first two cases the georeferenced polygon of the property is completely removed from the public list, in the third case the polygon remains in the list with a remark identifying that the property is no longer embargoed, but remains under a special monitoring regime.
Finally, during field inspections IBAMA may confiscate (confiscation is also regulated by Normative Instructions N. 14/2009) the means used for illegal deforestation or the products derived from it, such as vehicles and wood. Upon issuing a notice of confiscation and storage, IBAMA must decide on the final destination of the confiscated goods and products, and the costs associated with transportation and storage must be borne by the recipient of the confiscated goods. Until 2008, confiscated goods were mostly donated, but since the enactment of Decree N. 6514 that year, it is also possible for IBAMA to dispose of the confiscated goods by auction, destruction, or to make them available for government use. By including these new disposal methods, it was possible to prevent situations where, due to difficulties faced by IBAMA to determine suitable recipient for donation, the actual law offender became responsible for the custody of the confiscated goods.

3. Methods

3.1. Study Area

Mato Grosso state (Figure 3) is located between 6°00′ and 19°45′ of latitude South and 50°06′ and 62°45′ of longitude West, covering an area of 90 thousand square kilometers. It houses three distinct biomes: the Amazon biome (53.6% of the area of the state), the savannah-like Cerrado biome (39.6% of the area of the state), and the Pantanal biome (6.8% of the area of the state), which is dominated by floodplains that become submerged during the rainy season [37].
Although all of Mato Grosso state is monitored by satellites, deforestation in Cerrado and Pantanal vegetation is not reported. With this in mind, this study was restricted to municipalities located in the Amazon biome as regulated by the Ministry of Environment Ordinance N. 26 of March 2008, as well as to the municipality of Paranaita (303), in a total of 84 municipalities (Figure 3).

3.2. Datasets

The datasets used in the present study are summarized in Table 1. INPE-Instituto Nacional de Pesquisa Espacial (the Brazilian Space Research Institute) uses remote sensing to monitor deforestation in the Brazilian Legal Amazon since 1989, making the data available for public download. The data consists of polygons that describe various representations of the surface of the area monitored by Landsat-class satellites when they pass over the Brazilian Amazon territory, such as clear-cut deforestation, remaining forest, waterbodies, non-forest, cloud cover in that year, residual deforestation, and deforestation polygons that in previous years were cloud cover, all with a resolution of 6.25 ha.
In order to obtain the annual deforestation variable for the study area municipalities the INPE dataset layer was downloaded and, using ARCMap geospatial processing program (version 10.1; ESRI—Environmental Systems Resource Institute, Redlands, CA, USA), it was intersected with the municipalities’ boundaries dataset provided by IBGE-Instituto Brasileiro de Geografia e Estatística (Brazilian Institute of Geography and Statistics). Deforestation polygons that were cloud cover in previous years were considered as deforestation of the current year. Although it must be acknowledged that the presence of cloud cover may prevent the detection of deforested areas in one year, leading to possible over-reporting of deforestation in the subsequent year, this problem was found to be relatively small in the study area. In 2006, cloud cover in previous years may have led to a possible average over-reporting of 4.1% across municipalities, but on the average between 2004 and 2012, this value is 0.9%. Finally, since new deforestation is measured from August to July of the current year, all other annual variables used in the analysis were adjusted to this format.
The environmental infractions database contains information identifying the breached legislation, the municipality and date when the fine was issued, value of the fine, its collection status, and the type of infraction. The fines related to deforestation, which fall in the category of “flora” in the database, were of particular interest in this study. As the database provides information regarding particular legislation that had been breached, the fines could be further subcategorized into deforestation/fire infractions and those involving the possession/transportation of wood product without valid documentation. It should be noted that because the database does not contain the geographical coordinate of the infraction and, in the case of deforestation or fires, the extent of the damage, a more detailed GIS analysis was not possible.
The earliest records in the embargoed properties database are from 2005. While legislation enabling the imposition of embargoes as a form of administrative sanction was inforce before 2005, a systematic database started to be compiled only after the enactment of Decree N.6321/2007. Although legislation calls for the perimeter of the embargoed area to be made available, many records are more akin to point coordinates; therefore, INCRA’s (National Institute for Colonization and Agrarian Reform) georeferenced land cadastre dataset was downloaded and used to identify the perimeter of embargoed properties, in a method explained in further detail in the following section.
The data on confiscation was obtained by direct request to IBAMA-MT. The terms of confiscation and deposit contain such information as the date and municipality of the confiscation, the type of product confiscated, and the estimated value of the confiscation. While the dataset contains 5597 records of confiscations due to deforestation related infractions between 2004 and 2012, incomplete information in many records restricted the analysis to a smaller sample of 1499 records which contained the description of the confiscated goods.
Protected areas have been shown to act as a deterrent against deforestation [45,46,47], and the government has pursued a strategy of establishing new indigenous lands and conservation units also as a tool to improve territorial management. This study uses the area of newly established protected areas as one of the explanatory factors that contributed to the slowdown of deforestation since 2005.
As proxies for the direct causes of deforestation, the heads of bovine cattle and soy bean production areas were used. The most basic statistic used to analyze the dynamics of deforestation in the Amazon is the evolution of land use in the region [7]. Changes in the expansion of pasture lands are supplied by Agriculture and Livestock Farming Census, but these censuses were only carried out in 1970, 1975, 1980, 1985, 1995 and 2006. To resolve this lack of data, the annual data for the size of bovine herd were used. While price indexes are one of the best indicators of the state of the market and are commonly used to explain deforestation, obtaining reliable data on the price of beef and soy for all municipalities in the state for all the years represented in this study has proved problematic.
Finally, to account for the impact of climatic conditions on deforestation, the historical precipitation database compiled by the Brazilian water agency was used.

3.3. Methods

3.3.1. Enforcement of Fines

First, the total number of flora related fines issued in Mato Grosso between 2004 and 2012 was reported. Next, only infractions associated with forest loss (deforestation/fire and irregular wood possession/transportation) were considered for the assessment of Hypothesis 1. While the collection status of issued fines is indicated in the database compiled by IBAMA, neither date nor actual value of the collection is indicated. Given this limitation (requests to IBAMA to obtain data on the date and amount of fines collected were rejected, on the basis that the law that regulates citizens’ access to public information allows public institutions not to provide data that requires additional workload on public servants), the best way to assess the collection of the selected fines was to observe their collection status as of August 2015. There are a total of 81 different statuses, which were grouped in 7 phases that reflect the fine issuing and collection process (Figure 2), namely: (1) issuing and homologation; (2) defense analysis; (3) convicted and paid; (4) payments in instalments; (5) active debt; (6) absolved and acquitted; (7) judicial proceedings.

3.3.2. Enforcement of Embargoes and Confiscation

The effectiveness of embargoes can be assessed by determining whether the produce originating from embargoed farms is being traded or not, and by determining whether any further forest loss has occurred after the imposition of the embargo. This analysis focused on the latter (Hypothesis 2). To this end, the ARCMap 10.1 program was used to intersect the layer of embargoed properties with the layer of georeferenced land cadastre made available by INCRA. This procedure was necessary to determine the actual perimeter of the embargoed area since embargoed properties were commonly referred to by point coordinates in the records. Once the perimeter of the embargoed property was identified, the layer of properties was intersected with the deforestation dataset to identify the amount of remaining forest in the property before and after the embargo. Lack of deforestation in farms after the imposition of embargo is not always a signal of embargo effectiveness, as there may be no more forest to be felled. Therefore, to avoid mistakenly considering such embargoes as effective deforestation deterrents, measuring the remaining forest area before and after the imposition of the embargo was chosen. Finally, the Hot Spot Analysis tool was used to identify possible clusters of municipalities where embargoes are located, as well as clusters where embargoes were (in)effective. A Fixed Distance Band was set as our concept of spatial relationship, and 50 km was used as our distance band, since 50 km was the highest z-score value obtained when running the Spatial Autocorrelation tool with threshold distances set at 5 km intervals from 35 km until 100 km.
With regard to the confiscation of the means used for illegal deforestation and the produce associated with it, the database was filtered to include only the records with description of the confiscation, and these records were divided into two groups: one with confiscated wood and another with vehicles such as cars, trucks, tractors, and wheel loaders. Although some records in the dataset contain geographic coordinates, they were insufficient to allow for a finer GIS-based analysis. As such, this study was limited to a hot spot analysis. While wood or sawn wood may be consumed by law offenders in cases where IBAMA makes them the trustee until a final destination has been decided by the environmental agency (interview with IBAMA staff in November 2014), vehicles are more easily transported and stored, and their confiscation immediately deprives the producer of the means to conduct activities related to forest loss.

3.3.3. Impact of Sanctions on Deforestation

To assess whether the administrative sanctions negatively impacted deforestation and the extent of such impact (Hypothesis 3), a regression analysis in a panel data of 84 municipalities between 2004 and 2012 was performed, resulting in 756 observations. The two models used in the analysis were a pooled ordinary least square (OLS) to capture the general impact of the various explanatory variables on deforestation, and an individual effect fixed effect model to take into account spatial differences across municipalities.
An OLS model can generally be explained [48] by the equation
y i t =   α + β T x i t +   u i t
where i = 1,… n is the individual (in the present research, municipalities) index, t = 1,...,T is the time index and u i t is a random disturbance term of mean 0. This was expanded to the following:
D e f i t = α +   β X i t +   ε i t
where D e f i t is the annual deforested area in municipality i in year t, X i t is a vector of explanatory variables that affect deforestation, and includes the size of the bovine herd, the acreage of planted soy, the number of fines, the magnitude of fines, the number of embargoes, the number of terms of confiscations, the officially protected area, and the average rainfall, and ε indicates random disturbances (the error term). To reflect the imperfect imposition (collection) of fines, the nominal magnitude of fines was multiplied by a “collection factor”, which is the percentage of the value of the fine issued in time t that was effectively collected.
To model individual heterogeneity, it is assumed that the error term has two separate components, one for each individual and one that remains constant over time. This leads to the so-called unobserved effects model
y i t = α + β T x i t + μ i t + ε i t
where the idiosyncratic error ε i t is independent from the regressors x i t and the individual error component u i t   can either be correlated with the regressors or can remain independent from them. In the case of the present research, if it is assumed that the differences found in each of the municipalities of Mato Grosso are correlated to the variables, not controlling for such differences will bias the results in the parameters β in Equation (2). The fixed effects model takes the fact that the differences between individuals is correlated to the variables into account, and is defined here as
D e f i t = α +   β X i t +   S i + ε i t
where S denotes each individual municipality, and the other terms are the same as (Equation (3)).
Finally, because in the present research endogeneity between deforestation and the sanctions, protected areas is a concern, a second fixed effect model was run. In this model, the impact of sanctions applied in the previous year on current deforestation was considered.

4. Results and Discussion

4.1. Fine Issuance

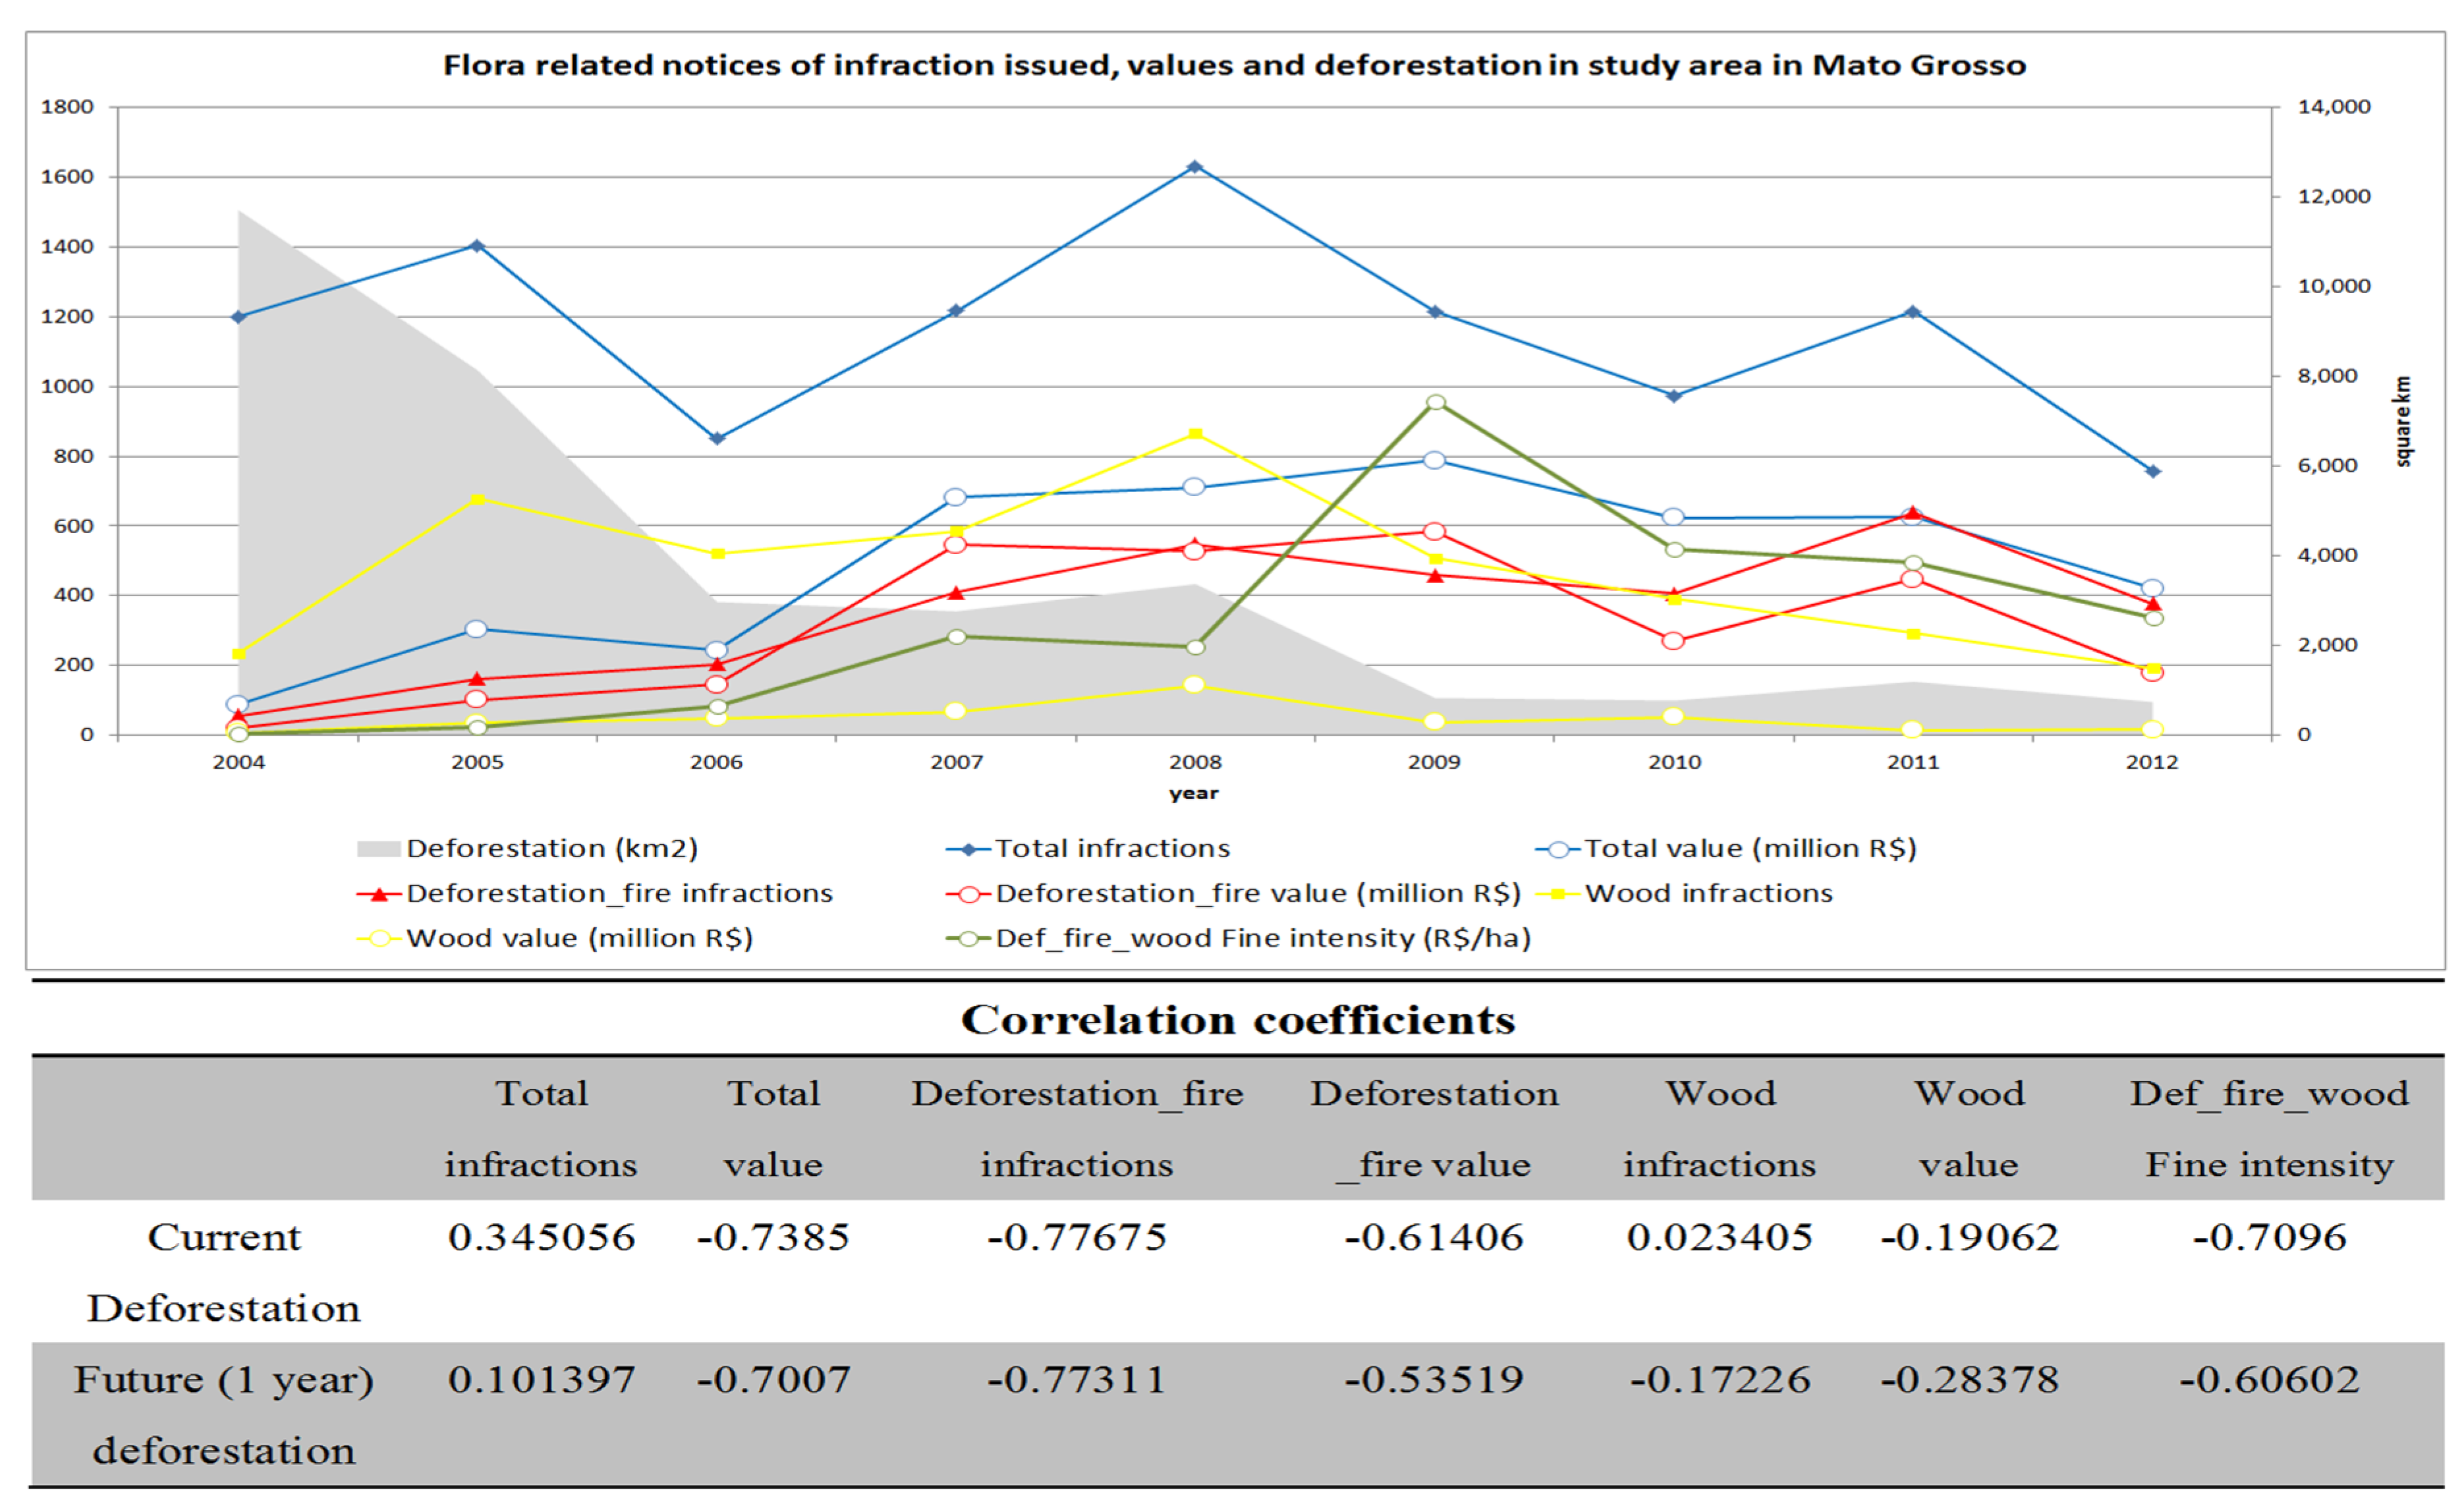
Figure 4 reports the variation in the issuing of fines for flora related infractions in Mato Grosso between 2004 and 2012, the fining intensity, and the correlation coefficients between the number of infractions, their value, and deforestation in the state. Table 2 provides the summary statistics.
There is a strong negative correlation between fines directly associated with forest loss (deforestation/fire) and deforestation, both in terms of number of fines and value. The introduction of the DETER system likely increased the probability of detecting and issuing fines by making the fast dispatch of law enforcing agent to affected areas possible. With the creation of ICB as the implementer of the national conservation units policy, IBAMA ceded a large number of its staff to the new agency, putting additional strain on the already over-loaded remaining staff (Interview with IBAMA staff in November 2014); the increase in fines was not associated with an increase in the number of inspecting staff, but rather a better allocation of the limited resources.
It is also possible to observe an increase in the fining intensity as measured by the ratio between the value of fines for deforestation and fire and the total deforestation. This is likely a reflection of changes related to the regulation of the Environmental Crimes Law. In revoking Decree N. 3179/1999, Decree N. 6514/2008 not only increased the value of fines per hectare of destroyed forest, it also increased the period for recidivism from 3 to 5 years. The extent of the increase in pecuniary punishment was considerable, with fines for deforestation in areas of permanent protection, for example, being raised from R$1,000 to R$ 5,000 per hectare.
Finally, the imposition of high fines for possession or transportation of wood or sawn timber without proper documentation is often reported in the Brazilian media as an example of forest law enforcement efforts in the Amazon. The total value of fines for this kind of infraction is also negatively correlated with current and future deforestation. The positive coefficient between the number of fines for irregular wood and current deforestation reflects the expected increase in the number of fines issued as a response to higher deforestation.

4.2. Fine collection

In order to test Hypothesis 1, 
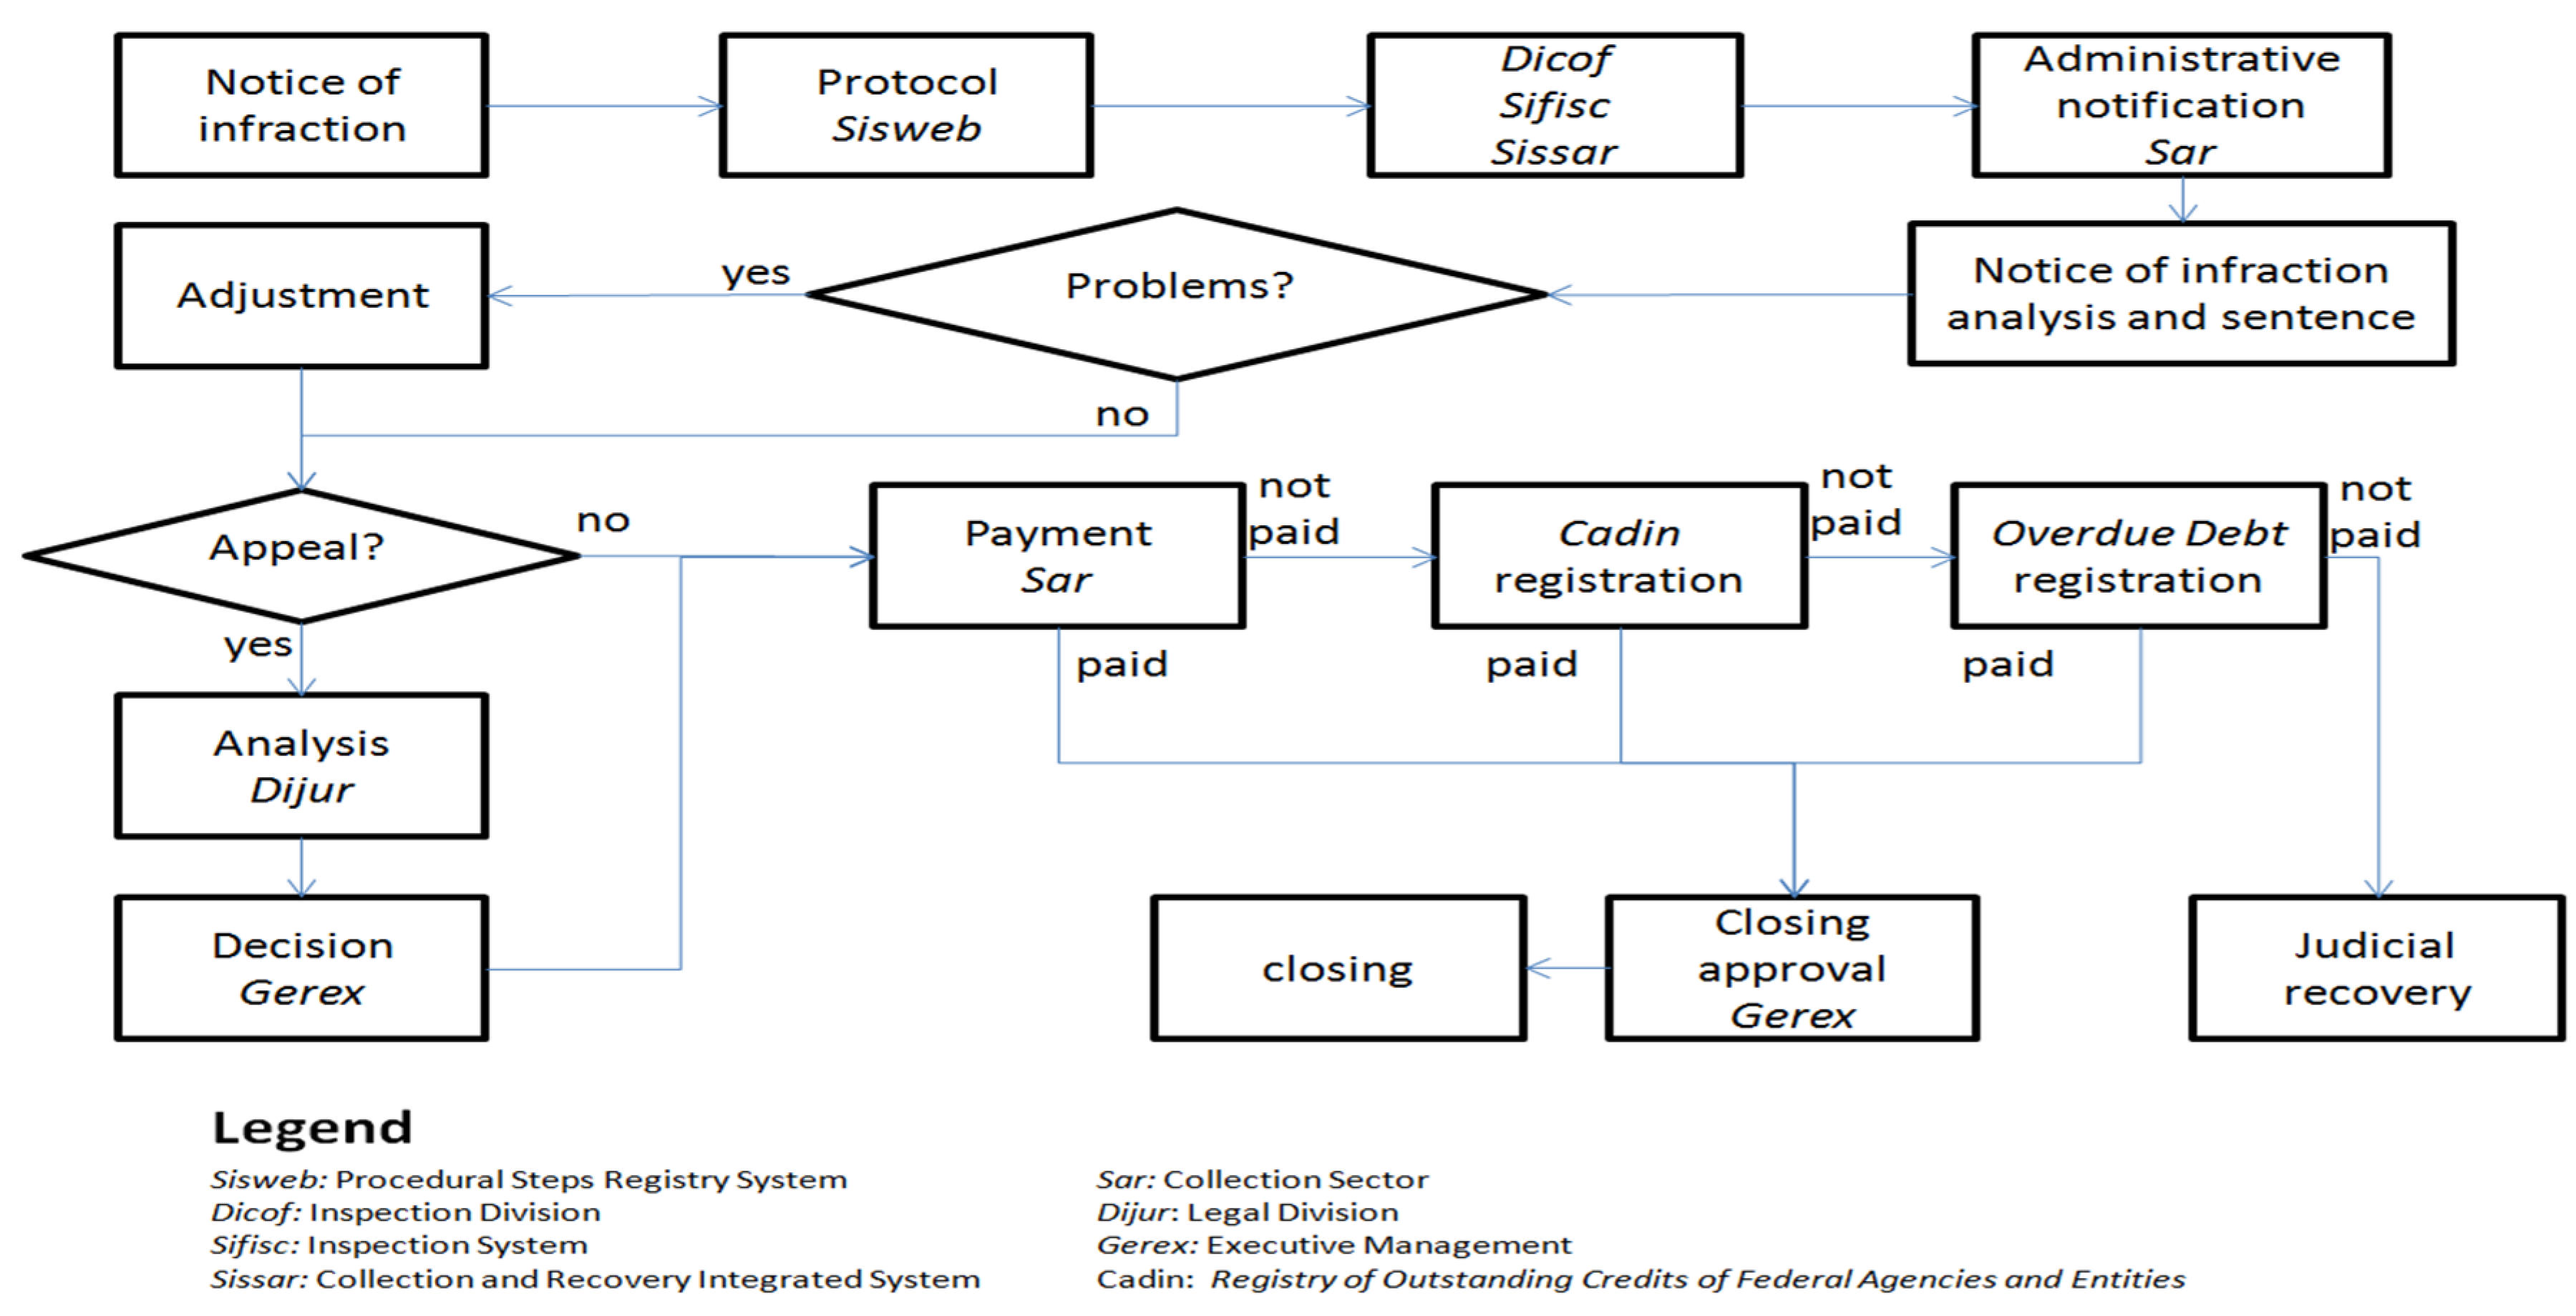
Figure 5 reports the statuses of fines issued between 2004 and 2012 as percentages of the total number of fines issued yearly and their respective values, as of August 2015. Collection rates decrease as the issuance of fines become more recent; in terms of amount, the percentage of values effectively collected is particularly minor, at less than 1%, even for fines issued at the beginning of the study period. Such a low percentage is likely to reduce the deterrence effect of fines on illegal deforestation, since the negative economic consequences of the infraction are not immediately faced by law offenders.
When an offender debt is overdue, the status of the fine changes to active debt, and IBAMA is then able to take legal action to collect the values issued. The time taken to collect the fine depends on the pace of the ruling in common courts of justice, renowned in Brazil for their slow ruling speed.
With regard to deforestation/fire and irregular wood related fines, almost 40% fell into the category of judicial proceedings in the years 2004 and 2005. This category is for infractions whose perpetrators took the whole fining process to court outside IBAMA on the grounds that the agency did not conform to legal procedures. Although the reason for such a high percentage is unclear, it may well be associated with the 2005 Operação Curupira, an anti-corruption crackdown operation that targeted a large scheme of illegal forest exploitation activity. This operation resulted not only in the arrests of IBAMA’s Mato Grosso branch superintendent and the state environmental agency chief secretary, but also in the entire overhaul of Mato Grosso environmental agency. It should be noted that the pattern of low collection of the fines in these two categories is similar to the general trend.
That a large percentage of the statuses in all graphs can be classified as defense analysis (under appeal) indicates that the effects of initiatives taken by IBAMA and the Ministry of Environment to speed up the process have yet to materialize. Among the initiatives that have been agreed upon is Decree N. 6154/2008, which reduces the number of administrative appeals from four to two. Once the notice of infraction has been confirmed, the law offender has a 20-day window to appeal to IBAMA, and if the appeal is rejected, the only course of action open to the offender is to further appeal to CONAMA (National Council on Environment), a deliberative body that decides on the formulation and implementation of the national environmental policy.
The above analysis indicates that although technological innovations have been introduced to increase the probability of detecting illegal deforestation, and that changes in legislation allow infractions to be more severely punished (at least nominally), the Brazilian government is yet to achieve effective collection of the fines issued both in terms of values as well as in terms of time passed since the infractions. The extremely low collection rate of less than 1% thus leads us to reject Hypothesis 1. That is, it can be concluded that the increase in fining intensity observed in the 2004–2012 period was not accompanied by higher collection rates of the fines.
When considering engaging in illegal forest conversion, it is likely that rural producers discount the fines to some extent due to the long time they have until payment is required. Therefore, when assessing the impact of fines on deforestation, the fact that their deterrent effect is lower than their nominal value must be kept in mind. In the subsequent regression analyses, all fines for deforestation/fire and illegal wood infractions are considered as proxies for detection rates, but their value is discounted based on the percentages in the categories “convicted/paid” and “instalments” when considering fine intensity.

4.3. The Deforestation Deterrence Impact of Embargoes

Table 3 summarizes the impact of embargoes imposed for forest-related infractions in Mato Grosso in order to assess Hypothesis 2. From a total 3426 embargoed properties, 721 intersected with INCRA’s georeferenced land cadaster. This land cadaster, although not complete, is the most reliable database of perimeters of the private properties in Mato Grosso, as it is compiled in a way that prevents the overlapping of the polygons representing the properties. The implementation of the land cadaster started in 2004 in Mato Gross, and as of February 2015, about 43.7% of the area of the state was identified as privately owned. Another 37.9% are thought to be privately owned but remained without georeferencing ([49], unpublished). It is thus possible that many properties that became target of embargoes are yet to provide their GIS information to INCRA.
By the time of the imposition of the embargo, an average 48.5% of the property area on embargoed properties remained covered with forest, which falls short of the minimum 80% required by Brazilian forest law. Nevertheless, by 2013 the remaining forest in the embargoed properties had decreased by just one percentage point to 47.5%, indicating that embargoes had deterred deforestation within the borders of the properties.
Of the 686 embargoed properties with remaining forest, the embargo was highly effective in preventing further forest loss in 495; no forest loss occurred after the imposition of the embargo. The embargoes were partially effective in preventing forest loss on 21.9% of the properties with remaining forest, and this partial effectiveness can be divided in two types: embargoed properties where forest loss occurred in the year immediately after the embargo was put into effect but not afterwards, and embargoed properties where no forest loss occurred in the year immediately after the embargo was put into effect, but afterwards. In 96 properties, embargo did not prevent further forest loss.
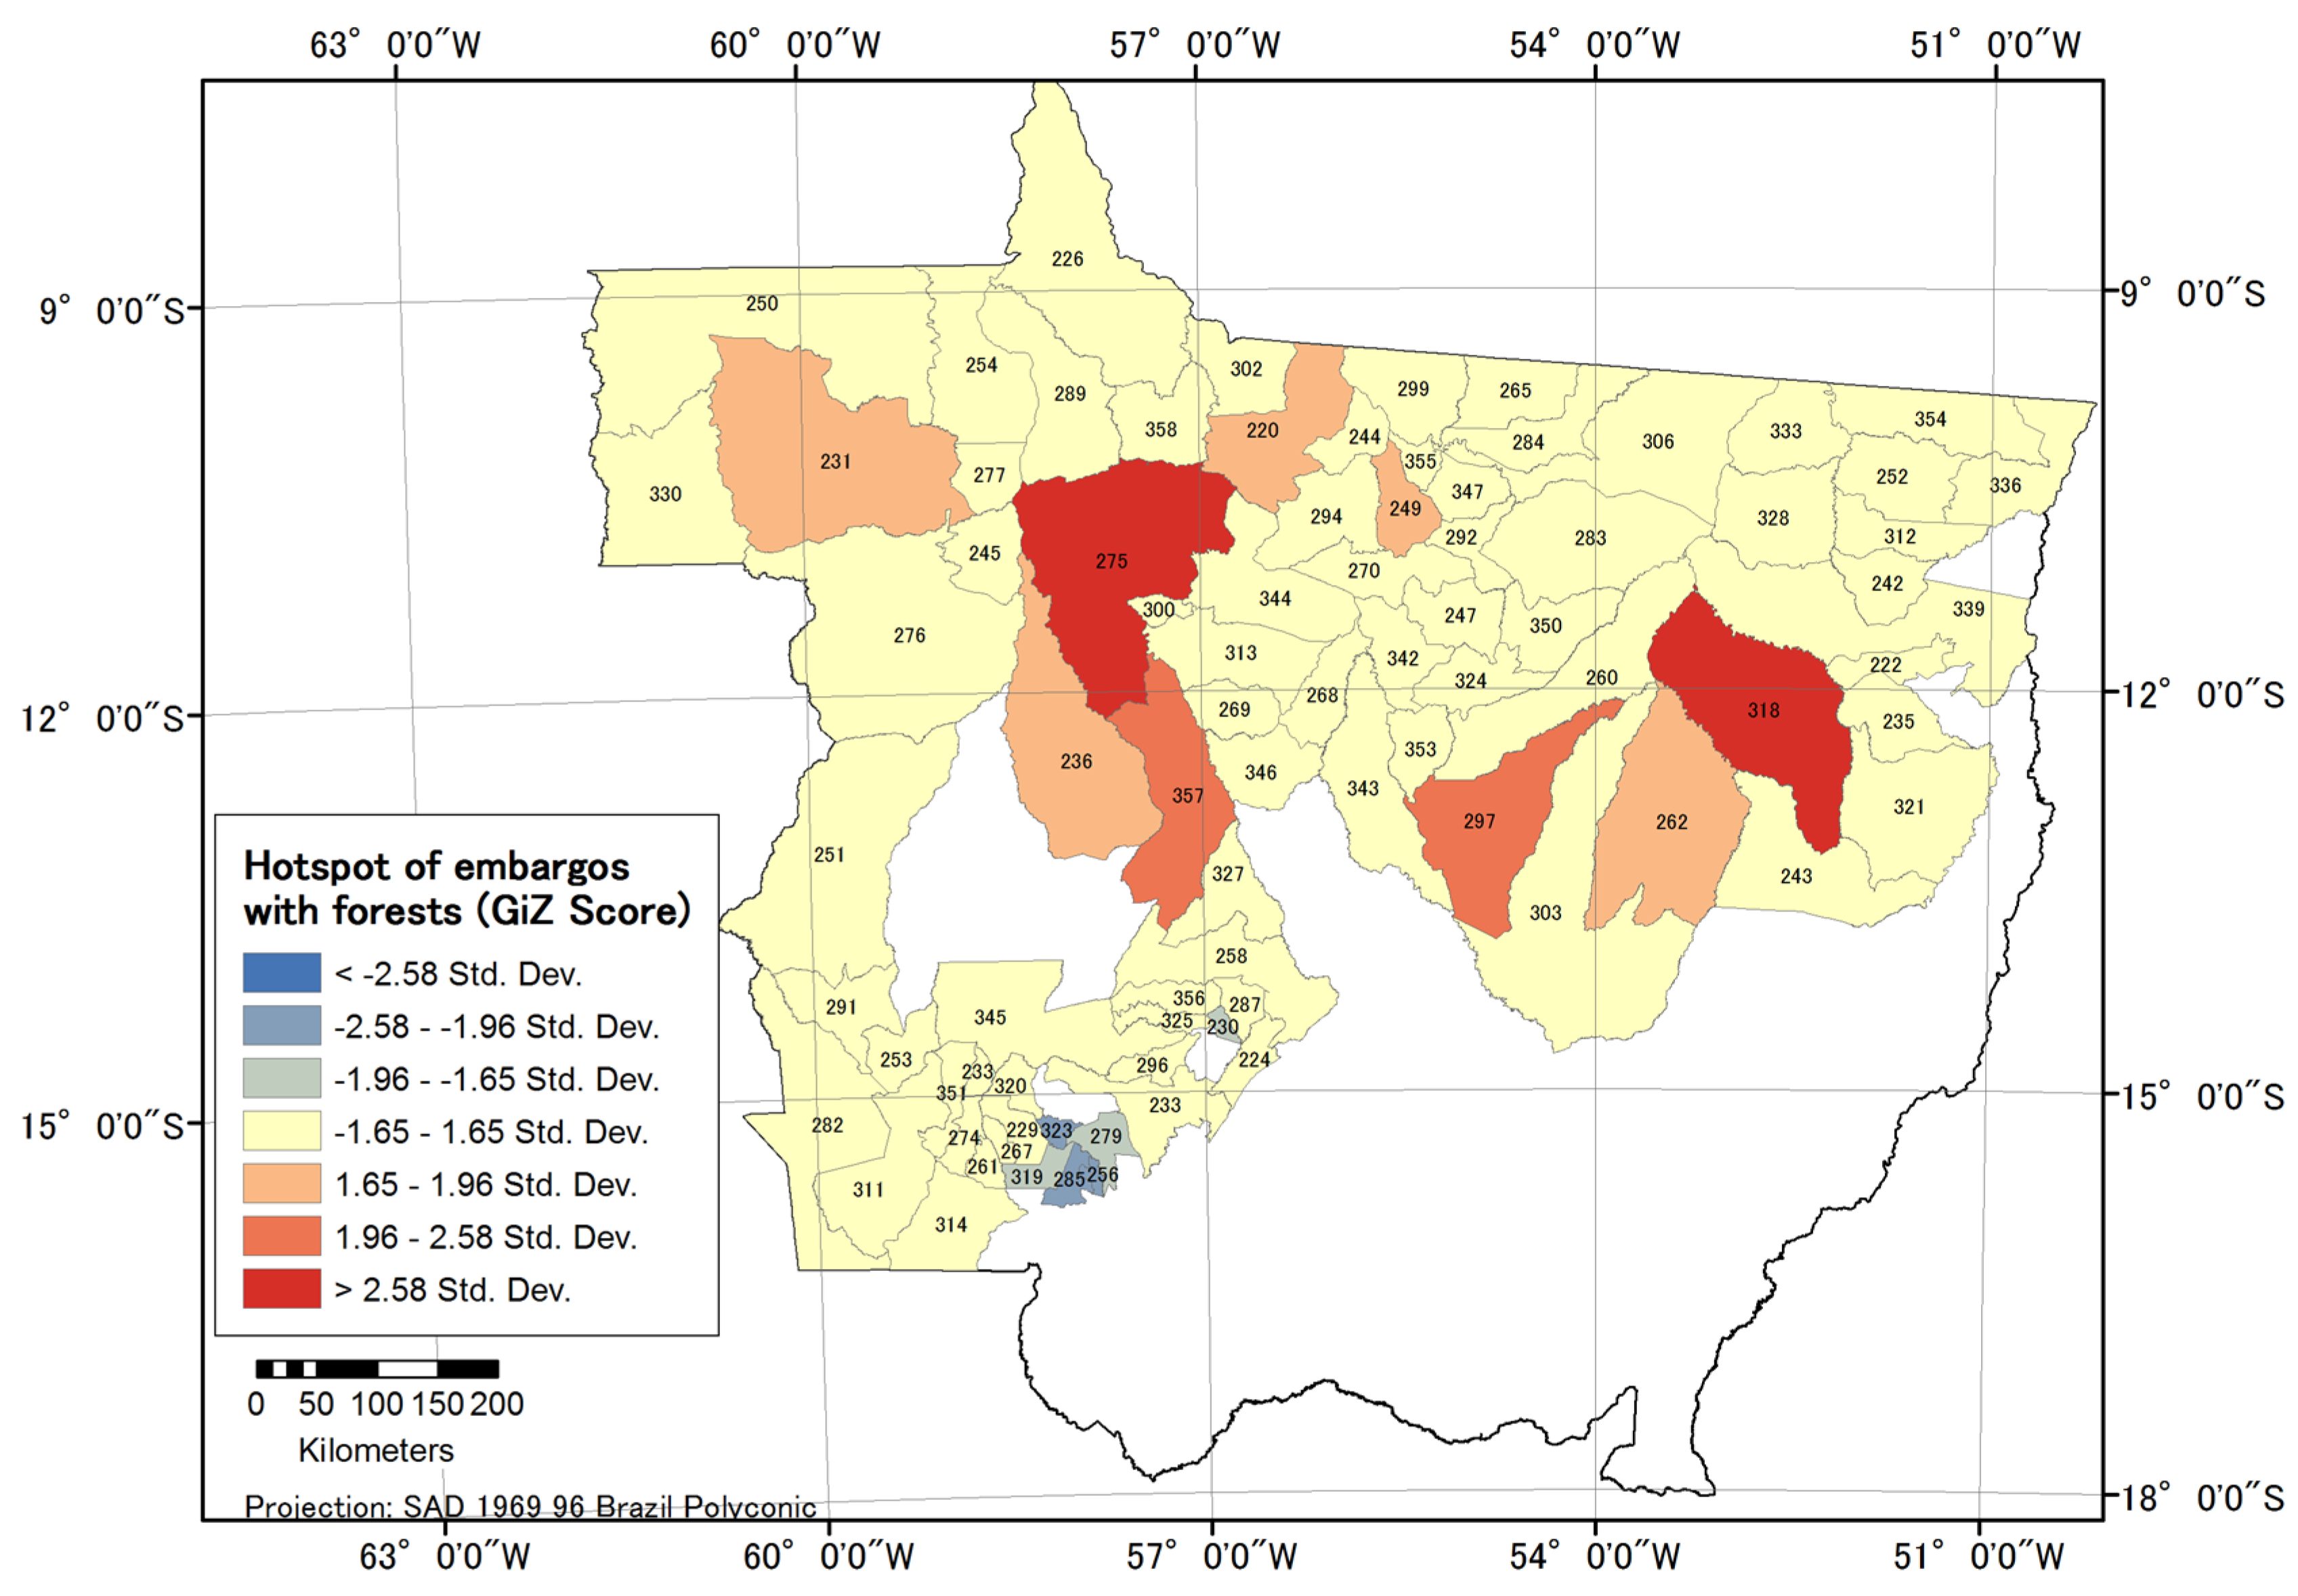
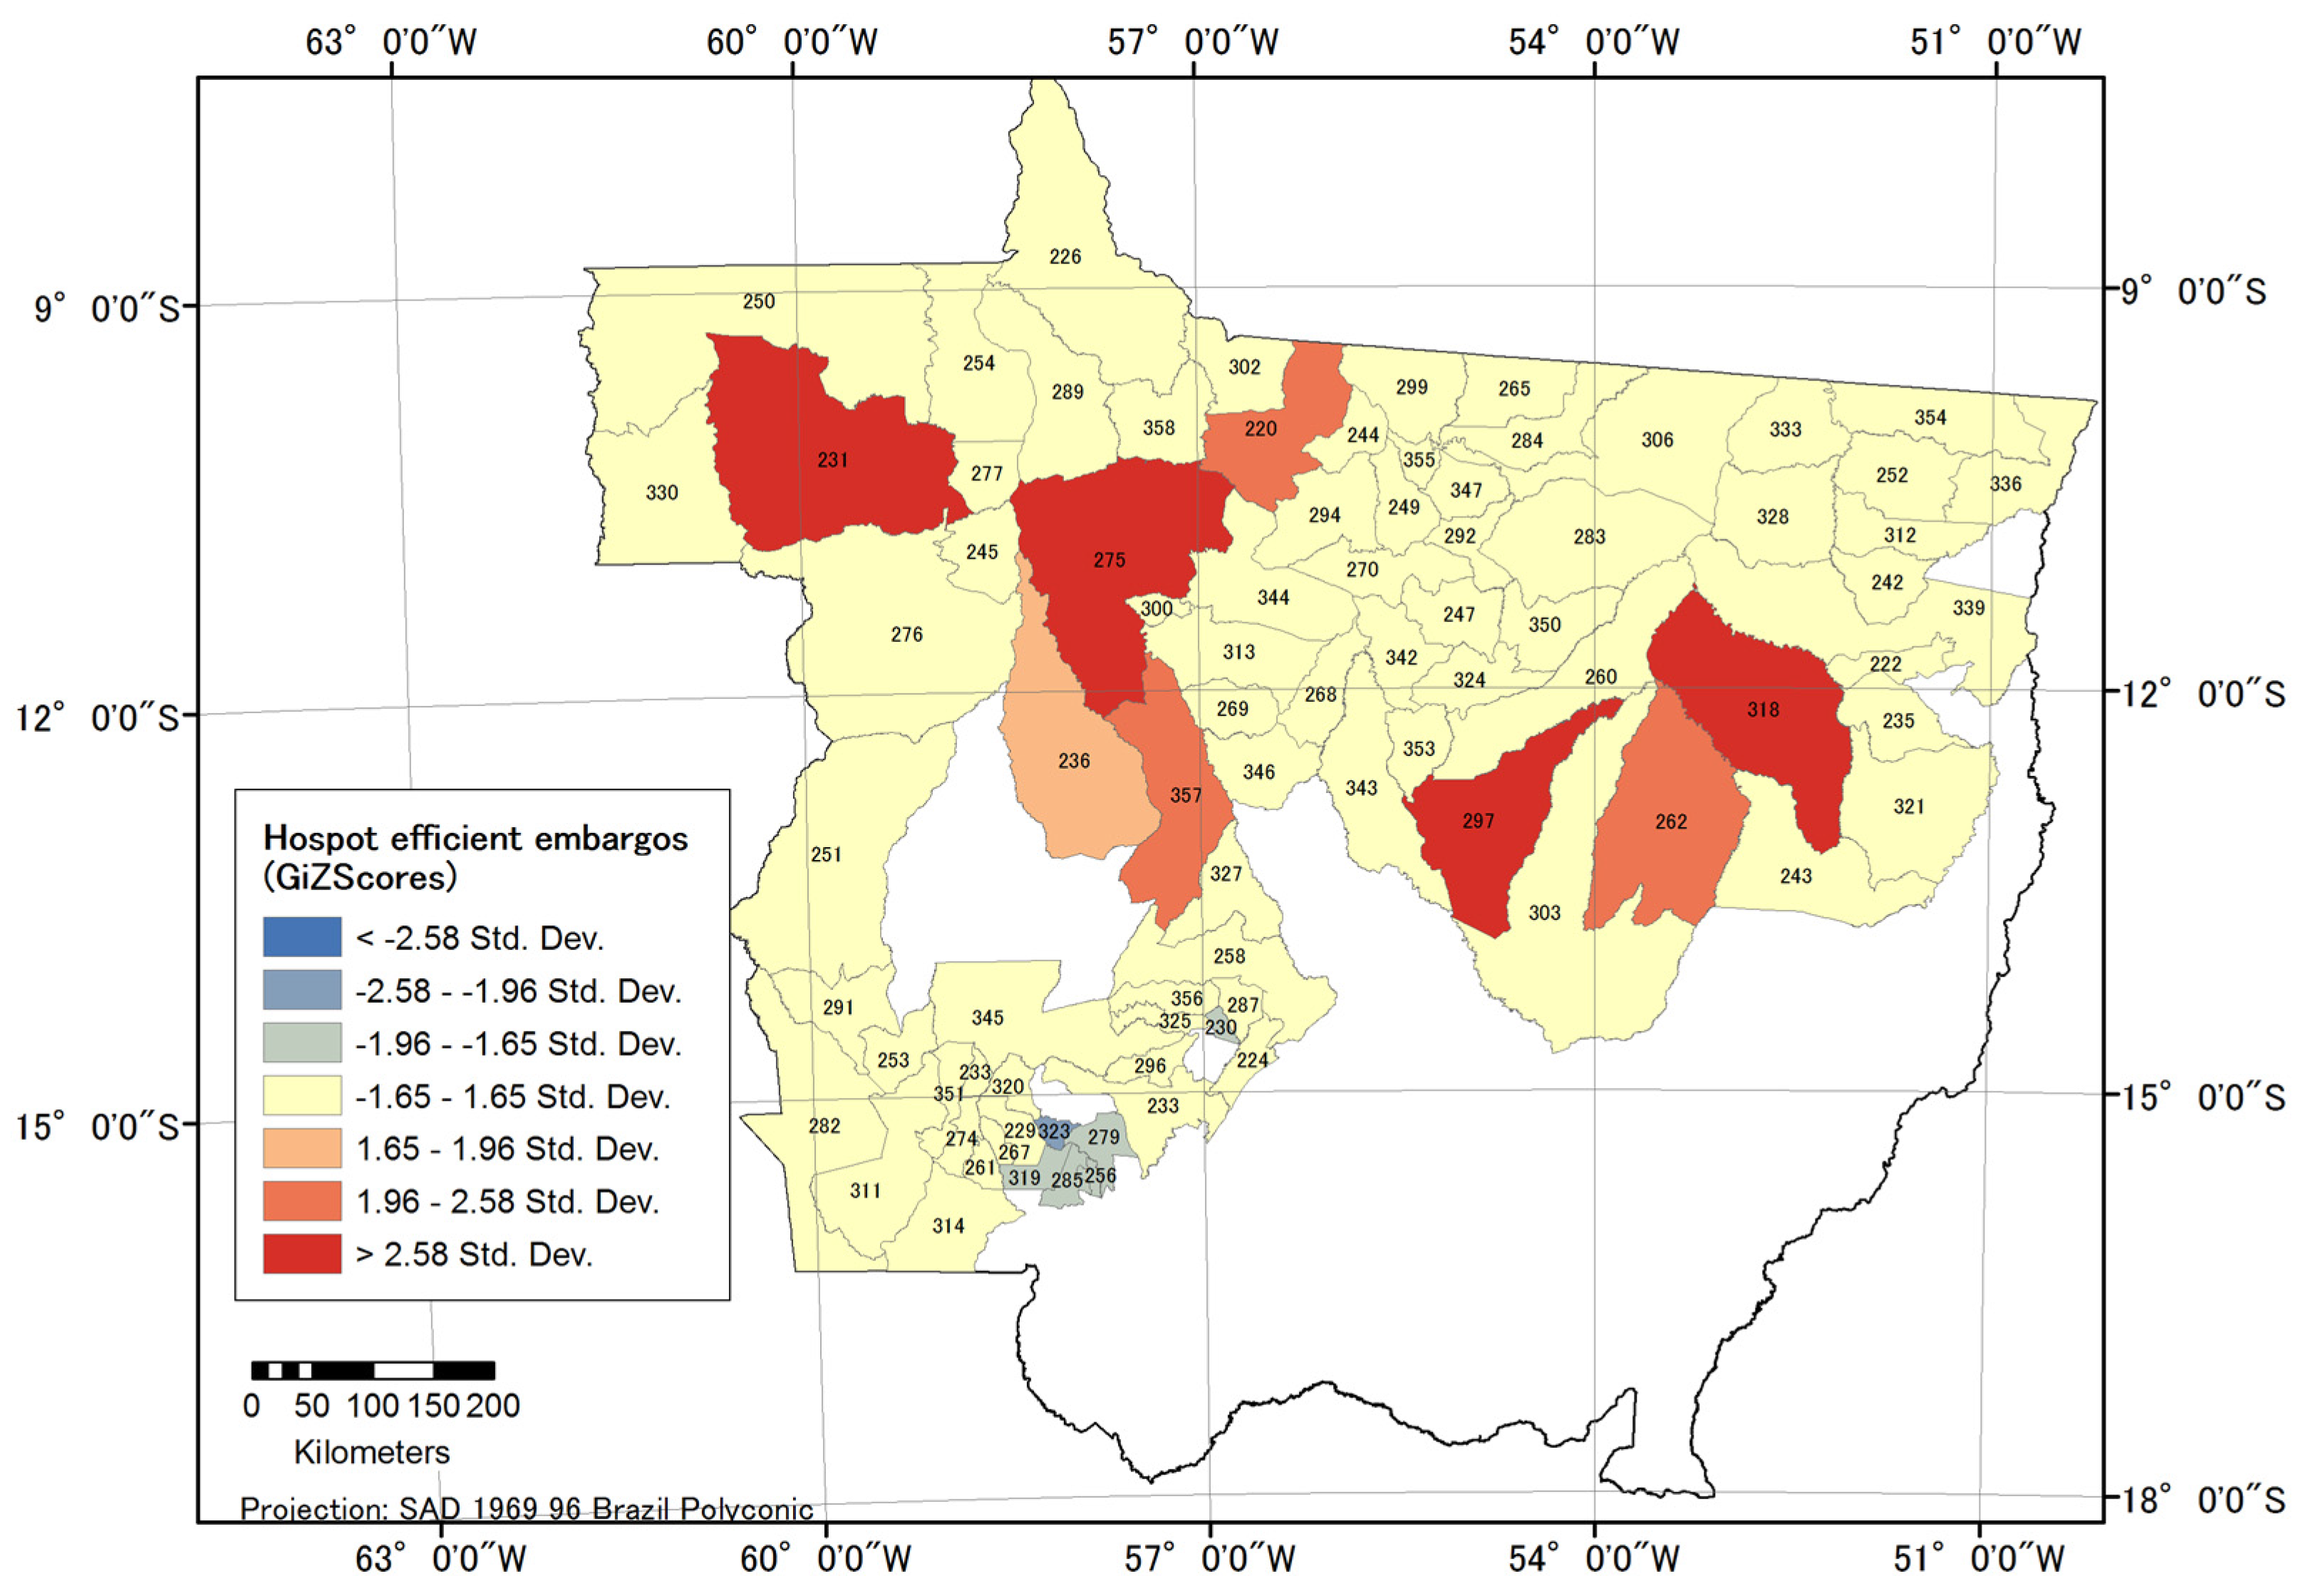
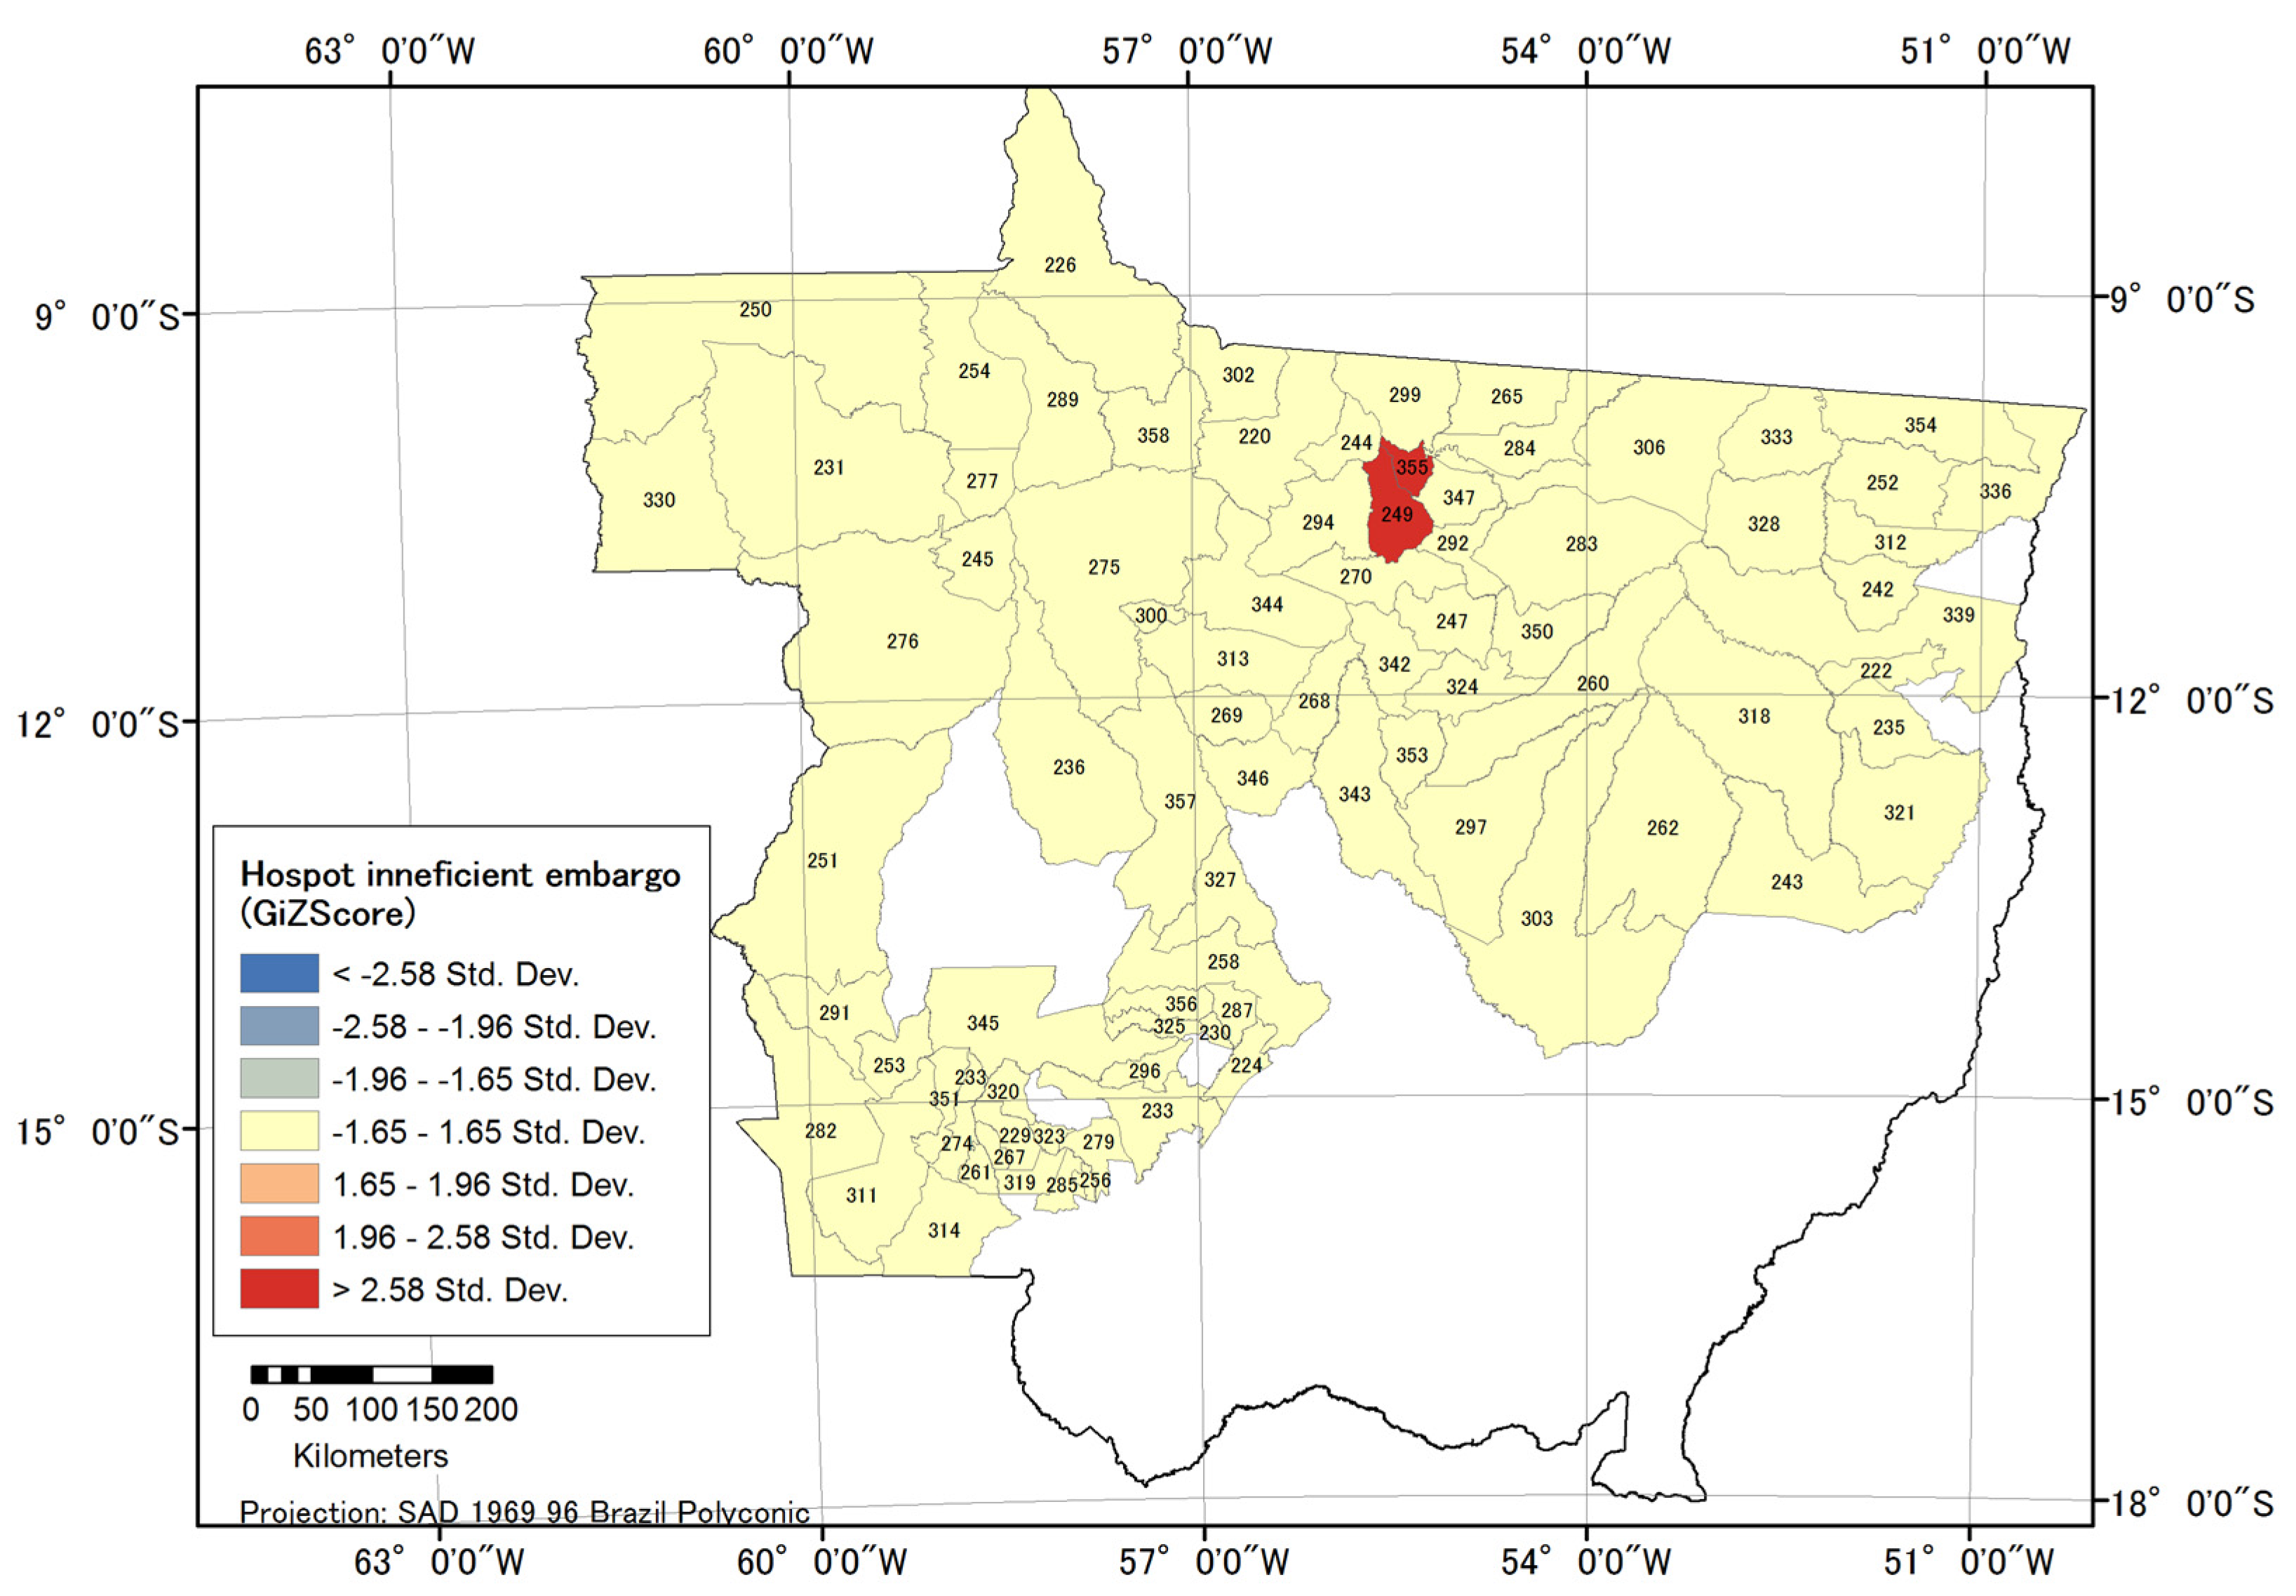
In Figure 6, Figure 7 and Figure 8, hot spot analysis maps show respectively the spatial distribution of embargoes on properties with remaining forest, the effectiveness and their ineffectiveness. The existence of overlapping hot spots of embargoes on properties with remaining forest and hot spots of effective embargoes indicates that the characteristics of these areas have an impact on deforestation. The northwest of the state is a relatively remote area with a relatively poor transportation infrastructure. The three municipalities in the central north east (297, 262, 328) are located in a region with dynamic soybean and beef production, and with a large amount of terrain within the Xingu National Park (indigenous land). The municipality of Colider (249) stands out as a place where despite the large number of embargoes on property with remaining forests, the embargoes seem to have had limited effect. While the reason for this remains unclear, it may well be related to the high incidence of socio-environmental conflicts in this part of Mato Grosso, where different levels of government have reported difficulty enforcing various types of regulations [50].
With the exception of Colider, it was observed that embargoes were mostly effective in deterring further forest loss within the borders of the embargoed property, and as such it can be concluded that they are, as suggested by Hypothesis 2, an effective form of sanction against further deforestation.

4.4. Confiscations in Mato Grosso

As shown in Table 4, although 5597 terms of confiscation and deposit were issued in the study area municipalities, only 27% included a precise description of the confiscated goods. The information in almost three quarters of the records was restricted to either the monetary estimate of the goods, the document ID, or the location of the confiscation and its date. According to the records, 840 thousand m3 of wood and sawn wood and 1926 vehicles were confiscated between 2004 and 2012.
Unlike fines and embargoes, it is not possible to establish a straightforward spatial correlation between the location of the confiscation and the location of the environmental damage. Irregular wood confiscated in a certain area may originate from either neighboring or very distant areas; likewise, confiscated trucks may be owned by producers or logging companies conducting irregular activity in either the neighborhood of the confiscation or in distant areas.
While acknowledging this limitation, a hot spot analysis for all confiscations issued in the 2004–2012 period was carried out. The results are shown in Figure 9 together with the confiscations that involved the apprehension of vehicles and wood. The municipalities of Aripuana (231) and Juina (276) are located in more remote northwest areas of the state, which still have a large percentage of remaining forest. Indications in the three maps that these municipalities are hotspots reflect the ongoing process of cattle ranching expansion in this region, which has no significant production of soy beans.

4.5. The Impact of Administrative Sanctions on Deforestation

This section reports and discusses regression analyses results to test Hypothesis 3; that is, that there is a negative correlation between deforestation and effectively implemented administrative sanctions, namely fines, embargoed rural properties and confiscation events involving vehicles. The explanatory variables used throughout the regressions are summarized in Table 5. In addition to the considerations for the choice of variables explained in Section 3.2, the variable Adjusted Fine Intensity def/fire/wood refers to the total value of fines for deforestation, forest fire, and irregular wood possession/transportation in a given year divided by the total deforestation of the given year, times the percentage of the value of those fines that have effectively been collected (paid) or are being collected. These variables are indicated in Figure 5.
The results of regressions with three types of administrative sanctions are indicated in 
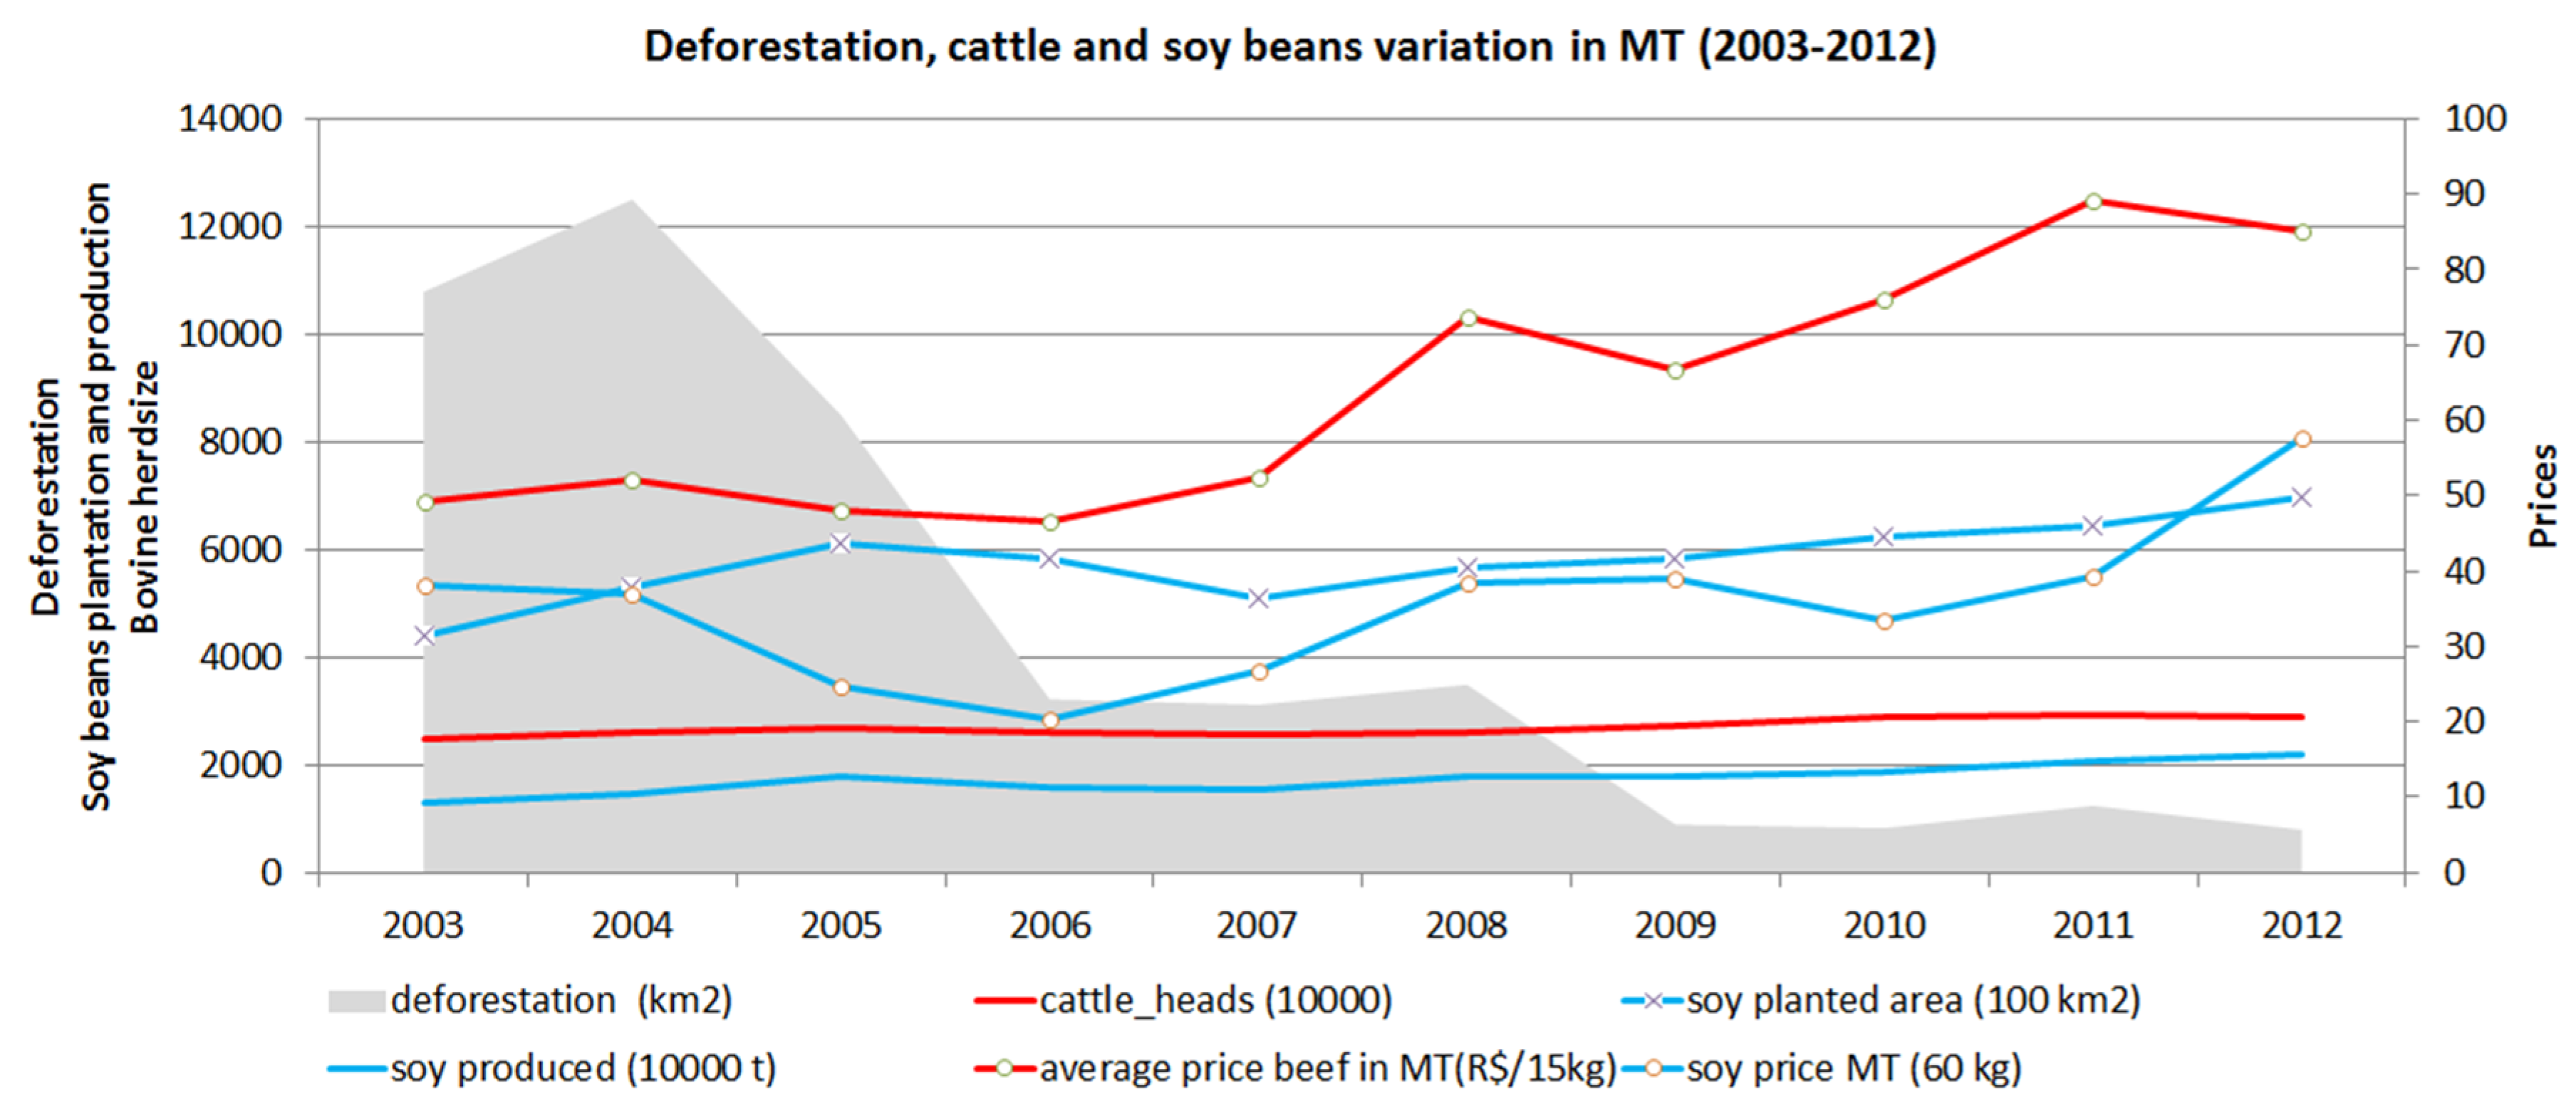
Table 6. The regressions also take the establishment of new protected areas as deforestation deterrence measures into account, along with the bovine herd size and soy plantation as deforestation causative factors. It should be noted that the effect of rainfall on deforestation has also been taken into account. In the OLS model, soy expansion is strongly correlated with deforestation. For example, a 10% increase in the area of plantation is associated with a 1.1% increase in deforestation when all other independent variables are held constant. Interestingly, cattle expansion, while having a positive coefficient, did not show any statistical significance.
The imposition of embargoes and the fine intensity are strongly inversely correlated to deforestation. An increase in 10% in the number of embargoes is associated with a deforestation decrease of 4.1%, and a similar increase of 10% in the value fines per hectare is associated with a deforestation decrease of 2.5%. In section 4.2 it was shown that the effective collection of fines issued during the study period remained low. Therefore, we interpret the coefficient −0.2597 of the Fine Intensity variable as the potential impact that fines could have had on deforestation if they were fully collected.
The statistically significant positive coefficient of infractions is likely a result of endogeneity, as the number of fines issued likely increases when there is higher deforestation.
The Fixed Effect (1) model controls for the differences across municipalities in the state. A PM dummy was added to this model to account for certain municipalities in the state that were added to IBAMA’s priority municipalities list since 2008. It should be noted that municipalities on this list are subject to more intense monitoring and control efforts. The role of cattle and soy on deforestation in this model differs significantly from that of the OLS model; while soy is no longer statistically significant, cattle ranching shows a strong negative correlation with deforestation. While this may seem counterintuitive at first, when seen in the light that bovine herd size was used as a proxy for cattle ranching expansion due to the unavailability of pasture land data, this finding may highlight a process of increasing occupancy rate.
As observed in the OLS, the issuing of fines in the Fixed Effect (1) model has a strong positive correlation with deforestation. On the other hand, in addition to fine intensity and embargoes, the confiscation of vehicles was also statistically significant, and had the expected negative impact on deforestation. When controlling for the individual effect of municipalities, the negative impact of a 10% increase in the percentage of protected areas in the state was found to result in a 1.5% decrease in deforestation. The large coefficient found for priority municipalities highlights the effectiveness of the additional monitoring and controls in these municipalities.
In the second fixed effect model, the possible endogeneity between the increase in the number of fines and deforestation, as well as the imperfect collection of fines were considered. Toward this means, the number of infractions was subject to a one year lag in order to show the effect of the number of fines issued in the previous year on deforestation of the following year. In addition, the fine intensity variable was substituted for an adjusted fine intensity variable to provide a more accurate assessment of the real impact of the magnitude of fines on deforestation. In this model, the results with regard to deforestation causative factors show that soy expansion is again statistically significant to explain increasing deforestation, and cattle expansion retains its statistically significant negative coefficient observed in the first fixed effect model.
With regard to the effectiveness of fines, the introduction of the two new variables provides reassuring results. First, the number of fines issued became negatively related to deforestation. In this situation, rather than having the number of fines increase as a response to higher deforestation, the increase in fines in the recent past is associated with a decrease in deforestation. A 10% increase in the issuing of fines in the previous year is associated with a 1.8% decrease in deforestation that year. Second, the adjusted fine intensity was also statistically significant to explain variations in deforestation. The negative coefficient of 0.131 implies that a 10% increase in effectively collected fine intensity is associated with a 1.3% decrease in deforestation. Although this figure may seem small, it would have amount to approximately 4570 hectares of avoided deforestation in 2008, for example.
As was the case with the Fixed Effect (1) model, the confiscation variable is statistically significant in the Fixed Effect (2) model, and has the expected negative coefficient. While the limitations of directly associating the location of the confiscation with the location of the deforestation must be acknowledged, the confiscations appear to have a direct impact on the ability to conduct deforestation by depriving offenders of the means to continue illegal deforestation.
In the Fixed Effect (2) model, the variance inflation factors indicate that overall there is no autocorrelation between the variables. Furthermore, the model is capable of explaining approximately 70% of the variation in deforestation in the selected municipalities in Mato Grosso. These characteristics of the model, along with the statistically significant negative impact on deforestation shown by the sanctions variables give credence to hypothesis 3; that is, there is a negative correlation between deforestation and effectively implemented administrative sanctions, namely fines, embargoed rural properties and confiscation events involving vehicles.
However, is this correlation a causal one? Given that increased regulatory vigor since 2004 coincided with a decrease in deforestation, one is likely to ask what would have happened in the absence strengthened illegal deforestation control mechanisms. Would a similar deforestation decrease be observed, would there be no change, or would deforestation actually increase? Although counterfactuals are one of the central elements for any type of policy impact evaluation that aims to go further than being a general description of a process [51,52], the present research does not provide such explicit counterfactuals that would bolster the argument that the decrease in deforestation observed is resulted from improvements in deforestation control measures.
One of the main difficulties in providing counterfactuals in the present study lies in the current low understanding of the working of fines as an imperfect deforestation deterrent mechanism. The logic behind the effectiveness of embargoes and confiscations lies in negation of trade opportunity, increased monitoring and the removal of means used for deforestation. On the other hand, why would a producer be more law abiding in a situation where the likelihood of more and heavier fines is higher, but their actual collection continues to be extremely low? Increased knowledge on how the low collection of fines affected and affects land owners behavior in Mato Grosso is a topic that demands urgent attention by the academic literature in order to accurately evaluate the Brazilian government deforestation control efforts.

5. Concluding Remarks

This study used a GIS analysis and regression analyses to evaluate the impact of sanctions imposed by IBAMA on illegal deforestation in 84 municipalities in Mato Grosso state between 2004 and 2012. To address a literature gap on how various types of sanctions impacted deforestation in the southern Brazilian Amazon, three datasets were heavily employed: underexplored datasets on fines issued by IBAMA, a vector based dataset on embargoed farms for illegal deforestation, and a non-public dataset on the confiscation of means of production and produce in Mato Grosso.
Three main hypotheses were explored: (1) the increase in fining intensity observed in the 2004–2012 period was accompanied by higher collection rates of the fines; (2) embargoes are effective deterrents against deforestation; and (3) there is a negative correlation between deforestation and effectively implemented administrative sanctions, namely fines, embargoed rural properties and confiscation events involving vehicles.
While the application of punishment is considered perfect once an infraction is detected in classical literature on law enforcement regimes, the extremely low rates of actual payments of fines for deforestation led to the rejection of Hypothesis 1. This investigation suggests that the two most compelling reasons for the low payment rate are the slow pace of defense analysis of the fines within the IBAMA and the inability of courts to enforce the payment of overdue debts. On the other hand, Hypothesis 2 was not rejected. The high effectiveness of embargoes against deforestation can be observed by the low variation in remaining forest in embargoed properties after the imposition of the sanction. This likely occurs as the result of stricter monitoring, as well as credit and trade restrictions. Finally, the results of the regression analyses clearly showed that the effective implementation of fines, embargoes and confiscations all had a statistically significant correlation with decreasing deforestation, supporting Hypothesis 3. It is important, however, to acknowledge that the present study is limited by the absence of counterfactuals, which prevents a conclusive statement on the causal relationshop between strengthened deforestation control initiatives and deforestation decrease in Mato Grosso.
Despite its limitation, the present investigation has important implications for the academic community, environmental policy makers and law enforcement agents. It has shown that among deforestation control mechanisms, embargoes are very effective. On the other hand, protracted collection procedures of fines were shown to have given birth to a sense of impunity that weakens efforts to protect what is left of the Amazon. Within the academic community, further research is necessary to clarify and quantify the working of fines as a deforestation control mechanism when they are imperfectly enforced.
Within the government, special effort is being made to promote sustainable economic practice in the new phase of the PPCDAM. While welcoming this focus of action, more decisive measures should be taken in this new phase to guarantee the full implementation of the various environmental laws in place in Brazil, and punitive measures should be fully implemented for non-compliance. The alarming rebound deforestation in Mato Grosso since 2012 is evidence that it is imperative that these improvements are made.

Appendix A

Table A1. List of Municipalities in Study Area.
IDMunicipalityIDMunicipality
220ALTA FLORESTA294NOVA CANAA DO NORTE
222ALTO BOA VISTA355NOVA GUARITA
224ALTO PARAGUAI291NOVA LACERDA
226APIACAS356NOVA MARILANDIA
229ARAPUTANGA357NOVA MARINGA
230ARENAPOLIS358NOVA MONTE VERDE
231ARIPUANA296NOVA OLIMPIA
233BARRA DO BUGRES292NOVA SANTA HELENA
235BOM JESUS DO ARAGUAIA297NOVA UBIRATA
236BRASNORTE299NOVO MUNDO
242CANABRAVA DO NORTE300NOVO HORIZONTE DO NORTE
243CANARANA302PARANAITA
244CARLINDA303PARANATINGA
245CASTANHEIRA306PEIXOTO DE AZEVEDO
247CLAUDIA311PONTES E LACERDA
249COLIDER312PORTO ALEGRE DO NORTE
250COLNIZA313PORTO DOS GAUCHOS
251COMODORO314PORTO ESPERIDIAO
252CONFRESA318QUERENCIA
253CONQUISTA D’OESTE320RESERVA DO CABACAL
254COTRIGUACU321RIBEIRAO CASCALHEIRA
256CURVELANDIA323RIO BRANCO
258DIAMANTINO330RONDOLANDIA
260FELIZ NATAL324SANTA CARMEM
261FIGUEIROPOLIS D’OESTE333SANTA CRUZ DO XINGU
264GLORIA D’OESTE336SANTA TEREZINHA
262GAUCHA DO NORTE325SANTO AFONSO
265GUARANTA DO NORTE339SAO FELIX DO ARAGUAIA
267INDIAVAI327SAO JOSE DO RIO CLARO
268IPIRANGA DO NORTE328SAO JOSE DO XINGU
269ITANHANGA319SAO JOSE DOS QUATRO MARCOS
270ITAUBA342SINOP
274JAURU343SORRISO
275JUARA344TABAPORA
276JUINA345TANGARA DA SERRA
277JURUENA346TAPURAH
279LAMBARI D’OESTE347TERRA NOVA DO NORTE
283MARCELANDIA350UNIAO DO SUL
284MATUPA351VALE DE SAO DOMINGOS
285MIRASSOL D’OESTE353VERA
287NORTELANDIA282VILA BELA DA SANTISSIMA TRINDADE
289NOVA BANDEIRANTES354VILA RICA

References

  1. Figueiredo, M.G.; Barros, A.L.M.; Guilhoto, J.J.M. Relação economica dos setores agricolas do Estado do Mato Grosso com os demais setores pertencentes tanto ao Estado quanto ao restante do Brasil. Rev. Econ. Sociol. Rural 2005, 43, 557–575. [Google Scholar] [CrossRef]
  2. Fearnside, P.M. Deforestation in Brazilian Amazon: History, rates and consequences. Conserv. Biol. 2005, 19, 680–688. [Google Scholar] [CrossRef]
  3. Neptstad, D.C.; Soares-Filho, B.S.; Merry, F.; Lima, A.; Moutinho, P.; Carter, J.; Bowman, M.; Cattaneo, A.; Rodrigues, H.; Schwatzman, S.; et al. The end of deforestation in the Brazilian Amazon. Science 2009, 326, 1350–1351. [Google Scholar] [CrossRef] [PubMed]
  4. Rivero, S.; Almeida, O.; Avila, S.; Oliveira, W. Pecuária e desmatamento: Uma análise das principais causas diretas do desmatamento na Amazônia. Nova Econ. 2009, 19, 41–66. [Google Scholar] [CrossRef]
  5. Barona, E.; Ramankutty, N.; Hyman, G.; Coomes, O.T. The role of pasture and soybean in deforestation of the Brazilian Amazon. Environ. Res. Lett. 2010, 5. [Google Scholar] [CrossRef]
  6. Reis, E. Os impactos do pólo siderúrgico de Carajás no desflorestamento da Amazônia brasileira. Econ. Bras. Perspect. 1996, 2, 691–715. [Google Scholar]
  7. Margulis, S. Causas do Desmatamento da Amazônia Brasileira; World Bank: Brasília, Brazil, 2003. [Google Scholar]
  8. Barreto, P.; Pereira, R.; Arima, E. A Pecuaria e o Desmatamento na Amazonia na era das Mudancas Climaticas; Imazon: Belem, Brazil, 2008. [Google Scholar]
  9. Hargrave, J.; Kis-Katos, K. Economic Causes of Deforestation in the Brazilian Amazon: A panel data analysis for the 2000s. Environ. Resour. Econ. 2013, 54, 471–494. [Google Scholar] [CrossRef]
  10. Andersen, L.E. The causes of deforestation in the Brazilian Amazon. J. Environ. Dev. 1996, 5, 309–328. [Google Scholar] [CrossRef]
  11. INPE-Instituto Nacional de Pesquisa Espacial. Divulgação da Estimativa da Taxa de Desmatamento por Corte Raso do PRODES 2013. Available online: http://www.obt.inpe.br/prodes/Prodes_Taxa2013.pdf (accessed on 22 March 2014).
  12. IBGE—Instituto Brasileiro de Geografia e Estatistica. Produção da Pecuária Municipal—39. IBGE: Rio de Janeiro, Brazil. Available online: http://www.ibge.gov.br/home/estatistica/economia/ppm/2013/default.shtm (accessed on 30 January 2015).
  13. IBGE—Instituto Brasileiro de Geografia e Estatistica. Produção Agrícola Municipal—40. IBGE: Rio De Janeiro, Brazil. Available online: ftp://ftp.ibge.gov.br/Producao_Agricola/Producao_Agricola_Municipal_[anual]/2013/pam2013.pdf (accessed on 30 January 2015).
  14. AGROLINK. Commodities Prices. 2015. Available online: http://www.agrolink.com.br/ (accessed on 10 January 2015).
  15. Boucher, D.; Roquemore, S.; Fitzhugh, E. Brazil’s success in reducing deforestation. Trop. Conserv. Sci. 2013, 6, 426–445. [Google Scholar]
  16. Assunção, J.; Gandour, C.C.; Rocha, R. DETERing Deforestation in the Brazilian Amazon: Environmental Monitoring and Law Enforcement; CPI Report; Climate Policy Initiative: Rio de Janeiro, Brazil, 2013. [Google Scholar]
  17. Arima, E.Y.; Barreto, P.; Araujo, E.; Soares-Filho, B. Public policies can reduce tropical deforestation: lessons and challenges from Brazil. Land Use Policy 2014, 41, 465–473. [Google Scholar] [CrossRef]
  18. Assunção, J.; Gandour, C.C.; Rocha, R. Deforestation Slowdown in the Legal Amazon: Prices or Policies? CPI Working Paper; Climate Policy Initiative: Rio de Janeiro, Brazil, 2012. [Google Scholar]
  19. Rudorff, B.F.T.; Adami, M.; Risso, J.; Aguiar, D.A.; Pires, B.; Amaral, D.; Fabiani, L.; Cecarelli, I. Remote sensing images to detect soy plantations in the Amazon Biome—The soy moratorium initiative. Sustainability 2012, 4, 1074–1088. [Google Scholar] [CrossRef]
  20. Neptstad, D.; McGratch, D.; Stickler, C.; Alencar, A.; Azevedo, A.; Swette, B.; Bezerra, T.; DiGiano, M.; Shimada, J.; Motta, R.S.; et al. Slowing Amazon deforestation through public policy and interventions in beef and soy supply chains. Science 2014, 344, 1118–1123. [Google Scholar] [CrossRef] [PubMed]
  21. Becker, G.S. Crime and punishment: An economic approach. J. Polit. Econ. 1968, 76, 169–217. [Google Scholar] [CrossRef]
  22. Malik, A.S. Avoidance, screening and optimum enforcement. RAND J. Econ. 1990, 21, 341–353. [Google Scholar] [CrossRef]
  23. Robinson, E.J.Z. Protecting developing countries forests: Enforcement in theory and practice. J. Nat. Resour. Policy Res. 2010, 2, 25–38. [Google Scholar] [CrossRef]
  24. Stigler, J. The optimum enforcement of laws. J. Polit. Econ. 1970, 78, 526–536. [Google Scholar] [CrossRef]
  25. Lear, K.K.; Maxwell, J.W. The impact of industry structure and penalty policies on incentives for compliance and regulatory enforcement. J. Regul. Econ. 1998, 14, 127–148. [Google Scholar] [CrossRef]
  26. Mookherjee, D.; Png, I.P.L. Corruptible law enforcers: How should they be compensated? Econ. J. 1995, 105, 145–159. [Google Scholar] [CrossRef]
  27. Schwartz, W.F.; Tullock, G. The cost of a legal system. J. Legal Stud. 1975, 4, 75–82. [Google Scholar] [CrossRef]
  28. Young, O. Compliance and Public Authority: A theory with International Applications; Resources for the Future Inc.: Washigton, DC, USA, 1979. [Google Scholar]
  29. Clarke, H.R.; Reed, W.J.; Shrestha, R.M. Optimal enforcement of property rights on developing country forests subject to illegal logging. Resour. Energy Econ. 1993, 15, 271–293. [Google Scholar] [CrossRef]
  30. Sutinen, J.G.; Kuperan, K. A socio-economic theory of regulatory compliance. Int. J. Soc. Econ. 1990, 26, 174–193. [Google Scholar] [CrossRef]
  31. Contreras-Hermosilla, A.; Peter, E. Best Practices for Improving Law Compliance in the Forestry Sector; FAO Forestry Paper 145; Food and Agriculture Organization of the United Nations (FAO): Rome, Italy, 2005. [Google Scholar]
  32. Brito, B.; Barreto, P. A eficácia da aplicação da lei de crimes ambientais pelo Ibama para proteção de florestas no Pará. Rev. Direito Ambient. 2006, 43, 35–65. [Google Scholar]
  33. Barreto, P.; Mesquita, M. Como Prevenir e Punir Infracoes Ambientais em Areas Protegidas na Amazonia; Imazon: Belem, Brazil, 2009. [Google Scholar]
  34. Polinsky, A.M.; Shavell, S. The economic theory of public enforcement of law. J. Econ. Lit. 2000, 38, 45–76. [Google Scholar] [CrossRef]
  35. Bartolini, F.; Gallerani, V.; Raggi, M.; Viaggi, D. Modelling the linkage between cross-compliance and agri-environmental schemes under asymmetric information. J. Agric. Econ. 2012, 63, 310–330. [Google Scholar] [CrossRef]
  36. Teures, R.A.; Castilho, A.C.C. Relacao entre os Autos de Infracao lavrados pelo IBAMA e deteccoes do sistema DETER no estado de Mato Grosso. In Proceedings of the Anais XV Simpósio Brasileiro de Sensoriamento Remoto—SBSR, Curitiba, Brazil, April 30 to May 5 2011; p. 2980.
  37. Ministério das Minas e Energia/Secretaria Geral. Projeto RADAMBRASIL Folha SC.21 Juruena v.20; Ministério das Minas e Energia: Rio de Janeiro, Brazil, 1980.
  38. INPE—Instituto Nacional de Pesquisa Espacial. Acesso aos Dados PRODES (Mapas e Imagens). Available online: http://www.dpi.inpe.br/prodesdigital/prodes.php (accessed on 10 January 2015).
  39. IBAMA—Instituto Brasileiro do Meio Ambiente e dos Recursos Naturais Renováveis. Consulta Pública de Autuações Ambientais e Embargos. Available online: https://servicos.ibama.gov.br/ctf/publico/areasembargadas/ConsultaPublicaAreasEmbargadas.php (accessed on 30 August 2015).
  40. IBGE—Instituto Brasileiro de Geografia e Estatistica. Mapas. Available online: http://mapas.ibge.gov.br/sbases-e-referenciais/bases-cartograficas/malhas-digitais (accessed on 10 January 2015).
  41. INCRA—Insituto Instituto Nacional de Colonização e Reforma Agrária. Acervo Fundiário. Available online: http://acervofundiario.incra.gov.br/i3geo/interface/incra.html?ateivdlepce46025tlep1l7nn3 (accessed on 10 January 2015).
  42. FUNAI—Fundação Nacional do Índio. Shape. Available online: http://www.funai.gov.br/index.php/shape (accessed on 1 Feburary 2015).
  43. SEMA-MT—Secretaria de Estado de Meio Ambiente de Mato Grosso. Available online: http://www.sema.mt.gov.br/index.php?searchword=shape.zip&ordering=newest&searchphrase=all&limit=20&option=com_search (accessed on 1 December 2014).
  44. ANA—Agencia Nacional de Águas. Hidro Web Sistema de Informações Hidrológicas. Available online: http://hidroweb.ana.gov.br/HidroWeb.asp?TocItem=1080&TipoReg=7&MostraCon=true&CriaArq=false&TipoArq=0&SerieHist=true (accessed on 10 September 2014).
  45. Sanchez-Azofeifa, G.A.; Quesada-Mateo, C.; Gonzales-Quesada, P.; Dayanandan, S.; Bawas, K.S. Protected areas and conservation of biodiversity in the tropics. Conserv. Biol. 1999, 13, 407–411. [Google Scholar] [CrossRef]
  46. Naughton-Treves, L.; Holland, M.B.; Brandon, K. The role of protected areas in conserving biodiversity and sustaining local livelihoods. Annu. Rev. Environ. Resour. 2005, 30, 219–252. [Google Scholar] [CrossRef]
  47. Neptstad, D.C.; Schwatzman, S.; Bamberger, B.; Santilli, M.; Ray, D.; Schlesinger, P.; Alencar, A.; Prinz, E.; Fiske, G.; Rolla, A. Inhibition of Amazon deforestation and fire by parks and indigenous lands. Conserv. Biol. 2006, 20, 65–73. [Google Scholar] [CrossRef]
  48. Croissant, Y.; Millo, G. Panel data econometrics in R: The plm package. J. Stat. Softw. 2008, 27, 1–43. [Google Scholar] [CrossRef]
  49. Queiroz Sousa, P. Protecting common goods in private properties: the implementation of georeferenced land cadastre in the Southern Amazon and its impact on deforestation. Int. J. Commons 2016. under review. [Google Scholar]
  50. Silva, M.J.; Sato, M.T. Territórios em tensão: O mapeamento dos conflitos socioambientais do Estado de Mato Grosso—Brasil. Ambient. Soc. 2012, 15, 1–22. [Google Scholar] [CrossRef]
  51. Ferraro, P.J.; Pattanayak, S.K. Money for Nothing? A Call for Empirical Evaluation of Biodiversity Conservation Investments. PLoS Biol. 2006, 4, 482–488. [Google Scholar] [CrossRef] [PubMed]
  52. Pirard, R.; dal Secco, L.; Warman, R. Do timber plantations contribute to forest conservation? Environ. Sci. Policy 2016, 57, 122–130. [Google Scholar] [CrossRef]
Figure 1. Deforestation, cattle and soy beans variation in Mato Grosso (2003–2012). Source: author, based on [11,12,13,14].
Forests 07 00066 g001
Figure 2. Steps for fine collection in IBAMA. Source: adapted from [32].
Forests 07 00066 g002
Figure 3. Study area municipalities (See Appendix 1 for the names of municipalities represented by numbers in this and subsequent maps) in Mato Grosso.
Forests 07 00066 g003
Figure 4. Fines in study area in Mato Grosso.
Forests 07 00066 g004
Figure 5. Collection of fines issued in the period 2004–2012.
Forests 07 00066 g005
Figure 6. Hot spot map of embargoed properties with remaining forest.
Forests 07 00066 g006
Figure 7. Hot spot map of effective embargoes.
Forests 07 00066 g007
Figure 8. Hot spot map of ineffective embargoes.
Forests 07 00066 g008
Figure 9. Hot spot analysis of confiscations.
Forests 07 00066 g009
Table 1. Datasets sources.
DatasetSource
Deforestation (2004–2012)INPE-PRODES [38]
Environmental infractions (2004–2012)IBAMA [39]
Embargoed areas (2005–2012)IBAMA [39]
Confiscation of production and means of production (2004–2012)IBAMA-MT (direct request)
Municipalities in Mato GrossoIBGE [40]
INCRA georeferenced rural properties (2004–2015_feb)INCRA [41]
Indigenous Lands in Mato GrossoFUNAI [42]
Conservation Units in Mato GrossoSEMA-MT[43]
Bovine herd sizeIBGE-Produção Pecuaria Municipal [12]
Soy beans plantation areaIBGE-Produção Agricola Municipal [13]
Mean annual precipitationANA-HidroWeb Sistema de Informacoes Hidrologicas [44]
Table 2. Summary statistics for fines in study area in Mato Grosso.
VariableMin.Max.MeanSD
Deforestation (ha)058,311.64301.77691.6
Total fines 032513.84624
Total value (R$)0134,059,2455,895,98412,666,846.9
Deforestation_fire infraction010649.23
Deforestation_fire value0810,362,2003,730,2199,466,473
Wood infraction0118612.18
Wood value024,167,711.5555,4801,861,930
Fine intensity (R$/ha) *0164,848.07396313,931.7
N: 756 observations (84 municipalities between 2004 and 2012). * Fine intensity considers the total value of infractions for deforestation fine and wood.
Table 3. Embargoed properties in study area in Mato Gross and deforestation deterrence effect.
MeasurementScaleValue
Embargoed properties (2005–2012)Property3426
Intersect embargo with INCRA georeferenced land cadasterProperty721
Embargoed properties with remaining forestProperty686
Average remaining forest at time of embargo (% of embargoed property area)%48.51
Average remaining forest in 2012 (% of embargoed property area)%47.52
Properties with no forest loss after embargoProperty440
Properties with no forest loss in year immediately after embargo but afterwardsProperty85
Properties with forest loss in year immediately after embargo then none afterwardsProperty65
Properties with forest loss immediately after embargo and beyondProperty96
Average property size (property with remaining forest)ha6027
Standard deviation (property with remaining forest)ha12,174
Table 4. Summary statistics for confiscation in study area in Mato Grosso.
VariableMin.Max.AverageSDTotal
Term of Confiscation0594.879.385597
Number of confiscation with description0160.872.271499
Estimated value of confiscation02,827,963107,579379,519142,871,088
Confiscated wood (m3)0696.74740.15129.67840,748
Confiscated vehicles0130.461.721926
Confiscations with vehicle090.341.17650
Number confiscations with wood060.431.16893
N: 756 observation (84 municipalities between 2004 and 2012).
Table 5. Variables used in regression models.
VariableScaleMinMaxMeanSD
ln Deforestationha058,3124352.97723.6
ln Bovine cattlehead−263,073169,6955346.15822,355.2
ln Soy plantationha−597,315256,548−370.796542,751.7
ln Infraction def/fire/woodunit012810.06317.46
ln Fine intensity def/fire/woodR$/ha0164,8483836.413,228
ln Adjusted fine intensity def/fire/woodR$/ha011,136253.2837.74
ln embargoesunit01547.7216.76
ln Confiscation with vehicleunit0400.622.7
ln Protected area (Indigenous Land and Conservation Units)ha01,614,656.1155,107.1935315,113.5
ln Average rainfallmm854.163680.61660.8343.77
For variables with negative values, natural log transformation was performed as ln(1 + variable).
Table 6. Impact of deforestation causative and deterrent factors.
Explanatory Variables and R2Dependent: ln Deforestation
OLSFixed Effect (1)Fixed Effect (2)
EstimatesVariance IF
(intercept)0.316 (1.769)12.632 (1.318) ***15.441 (1.437) ***
ln Cattle0.157 (0.135)−0.278 (0.07) ***−0.278 (0.085) ***5.80
ln Soy0.111 (0.017) ***0.0383 (0.034)0.033 (0.035) *5.38
ln Infractions1.428 (0.078) ***0.7762 (0.061) ***
ln Infraction lagged −0.183 (0.056) ***3.66
ln Fine Intensity−0.2597 (0.027) ***−0.231 (0.021) ***
ln Adjusted Fine Intensity −0.131 (0.026) ***2.34
ln Embargo−0.4146 (0.07) ***−0.446 (0.054) ***−0.2055 (0.057) ***2.6
ln Confiscation0.0857 (0.082)−0.258 (0.092) ***−0.2676 (0.106) **2.16
ln Protected Area0.0034 (0.012)−0.156 (0.032) ***−0.1824 (0.039) ***2.97
ln Rainfall0.4286 (0.126) ***−0.023 (0.103)−0.1153 (0.108)1.78
PM dummyNO−0.681 (0.12) ***−0.865 (0.13) ***2.27
Individual Fixed EffectNOYESYES
R20.3900.74050.709
All explanatory variables expressed in natural log, except for intersect and PM dummy. OLS: ordinary least square. IF: inflation factor. *, **, *** denote significance at 10%, 5%, and 1%, respectively. In all models, to control for heteroscedasticity, White’s correction of standard error was applied; robust standard errors are shown in parentheses.

