Article

Simulating the Effect of Climate Change on Vegetation Zone Distribution on the Loess Plateau, Northwest China

1
State Key Laboratory of Soil Erosion and Dryland Farming on Loess Plateau, Northwest A&F University, Yangling 712100, China
2
Institute of Soil and Water Conservation, Chinese Academy of Sciences and Ministry of Water Resources, Yangling 712100, China
3
State Key Laboratory of Vegetation and Environmental Change, Institute of Botany, Chinese Academy of Sciences, Beijing 100093, China
*
Author to whom correspondence should be addressed.
Forests 2015, 6(6), 2092-2108; https://doi.org/10.3390/f6062092
Submission received: 1 April 2015 / Revised: 17 May 2015 / Accepted: 4 June 2015 / Published: 11 June 2015

Abstract

:
A risk assessment of vegetation zone responses to climate change was conducted using the classical Holdridge life zone model on the Loess Plateau of Northwest China. The results show that there are currently ten vegetation zones occurring on the Loess Plateau (1950–2000), including alvar desert, alpine wet tundra, alpine rain tundra, boreal moist forest, boreal wet forest, cool temperate desert, cool temperate desert scrub, cool temperate steppe, cool temperate moist forest, warm temperate desert scrub, warm temperate thorn steppe, and warm temperate dry forest. Seventy years later (2070S), the alvar desert, the alpine wet tundra and the cool temperate desert will disappear, while warm temperate desert scrub and warm temperate thorn steppe will emerge. The area proportion of warm temperate dry forest will expand from 12.2% to 22.8%–37.2%, while that of cool temperate moist forest will decrease from 18.5% to 6.9%–9.5%. The area proportion of cool temperate steppe will decrease from 51.8% to 34.5%–51.6%. Our results suggest that future climate change will be conducive to the growth and expansion of forest zones on the Loess Plateau, which can provide valuable reference information for regional vegetation restoration planning and adaptive strategies in this region.

1. Introduction

Warming of the climate system is unequivocal. The atmosphere and ocean have warmed, the amounts of snow and ice have diminished, sea level has risen, and the concentrations of greenhouse gases have increased [1]. Anthropogenic climate changes have impacted natural and human systems on all continents [2]. Many terrestrial ecosystems and species have shifted their geographic ranges, seasonal activities, migration patterns, abundances, and species interactions in response to ongoing climate change [3,4,5,6] and have already gone extinct due to their slower rates of migration than anthropogenic climate change over the past few hundred years [7,8,9]. Accurate assessment of the possible effects of climate change and its irreversible and catastrophic impacts are increasingly viewed as a major challenge for human beings [10].
Understanding future climate change depends on global climate models (GCMs, also known as General Circulation Models). The fifth assessment report of the Intergovernmental Panel on Climate Change (IPCC) had used a new set of concentration-driven experiments from the framework of the Coupled Model Intercomparison Project Phase 5 (CMIP5) based on four representative concentration pathways [RCP2.6, RCP4.5, PCP6.0, and RCP8.5, named according to the intensity of the radiative forcing (W/m2) in the year of 2100] to simulate future climate change. These experiments showed that global mean surface temperatures will likely (66%–100%) increase by 0.3 °C to 1.7 °C (RCP2.6), 1.1 °C to 2.6 °C (RCP4.5), 1.4 °C to 3.1 °C (RCP6.0) and 2.6 °C to 4.8 °C (RCP8.5) for 2081–2100 relative to 1986–2005 [1]. These climate change scenarios provide a new opportunity to assess the possible response of vegetation, ecosystems, and species to climate change.
Many climate-vegetation models have been used to simulate the effects of climate change on vegetation patterns. Climate-vegetation models are classified into static and dynamic models [11]. Dynamic models require more data or physiological parameters than static models and are not easy to obtain and execute. Furthermore, many of the mechanisms of vegetation/ecosystem dynamics are still not clear [12,13]. Consequently, the static models are still widely used in different studies. Among these static models, the Holdridge life zone (HLZ) model emerged as a model for tropical dry-wet areas and then was spread worldwide including arid zones. The use of the HLZ model has not been exactly and precisely conceived to identify life zone for the most arid zones, although it is widely used in arid zones for various objectives due to its simple and accessible climatic parameters: annual biotemperature, annual precipitation, and potential evapotranspiration ratio [14,15,16,17]. The HLZ model has been used extensively in ecological research involving the carbon sequestration, climate change, and ecomapping [12,14,17,18]. This model has also been successfully used in China [12,19,20,21,22].
The Loess Plateau in China is dominated by the monsoon climate and has a total area of about 6.5 × 10⁵ km2 (6.76% of the area of China). The complicated landscape, frequent droughts, severe soil erosion and sustained deterioration of the ecosystem have attracted worldwide attention to this region [23,24,25,26]. Many ecological engineering projects have been implemented such as the Three-North Shelterbelt Project, the Grain for Green Project, and a soil-retaining dam project [27]. Previous studies have focused on the restoration of vegetation diversity, nutrient cycling, carbon sequestration, hydrological effects, and afforestation technology, and other topics [28,29,30]; however, the potential impacts of climate change on the distribution pattern of vegetation have not yet been studied in detail.
Here, we conducted a risk assessment of the vegetation zone responses to climate change on the Loess Plateau by using the classical HLZ model under current and future climate scenarios. This study mainly focuses on the following two objectives: (1) How many vegetation zones exist on the Loess Plateau in the concept framework of HLZ model? (2) How the structure of vegetation zones responses to future climate change in the aspects of boundaries, areas, and their centroids shift at zonal, meridional, and vertical directions. This study is especially important for improving our understanding of the effect of climate change on vegetation zones and for planning the adaptation strategies of future ecological engineering projects on the Loess Plateau of China.

2. Materials and Methods
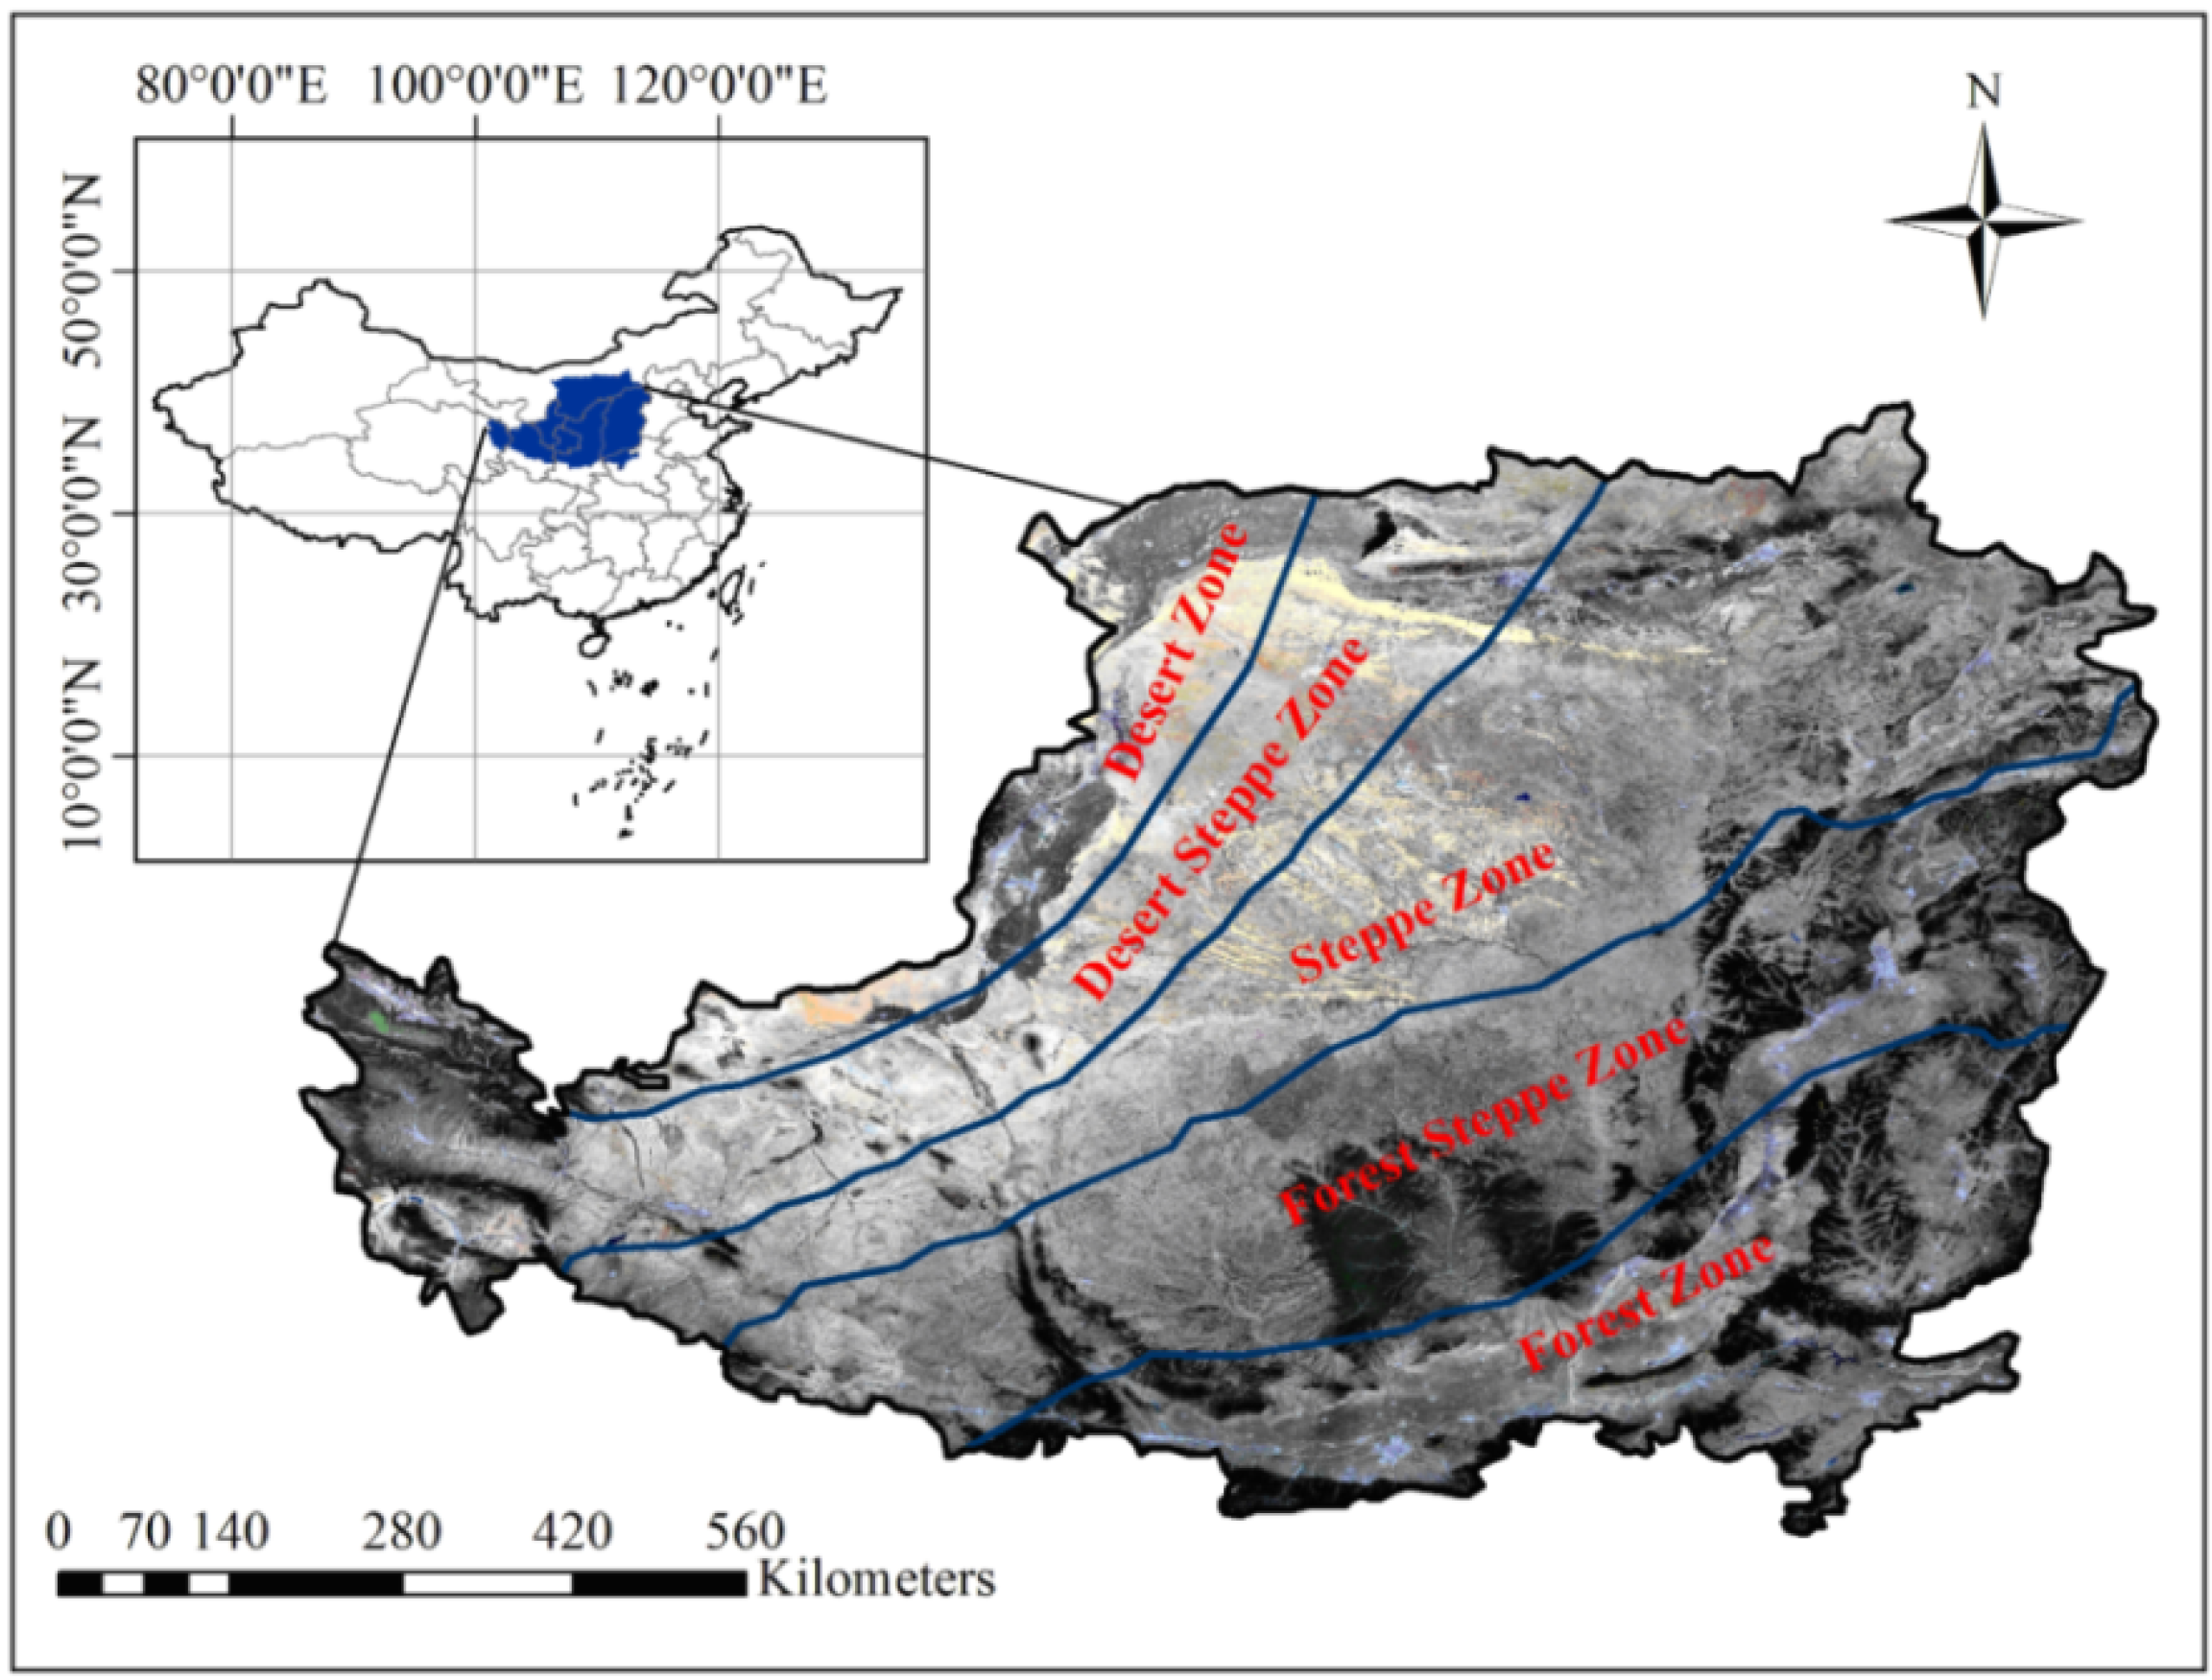
2.1. Study Region

The Loess Plateau (33°43′–41°16′ N, 100°54′–114°33′ E) is a highland region in Northwest China, with an average elevation of about 1200 m. It has the thickest known loess deposits in the world. The climate of Loess Plateau is strongly influenced by a typical continental monsoon climate. Winters are cold and dry, and most rainfall occurs during the summer (June to September) [31]. Annual mean temperature is 7.6 °C, while annual precipitation is approximately 441 mm. According to the gradient of precipitation, the potential vegetation on Loess Plateau can be divided into five zones: forests, forest steppe, steppe, desert steppe, and desert. These vegetation zones change from forest to desert with a declining precipitation gradient from the southeast to the northwest of the plateau [26,32]. The location of the Loess Plateau with its Google Earth image and its potential vegetation zones are provided in Figure 1.
Figure 1. Location of Loess Plateau in Northwest China with its Google Earth image and its potential vegetation zones: forest, forest steppe, steppe, desert steppe, and desert zones [26,32].
Forests 06 02092 g001

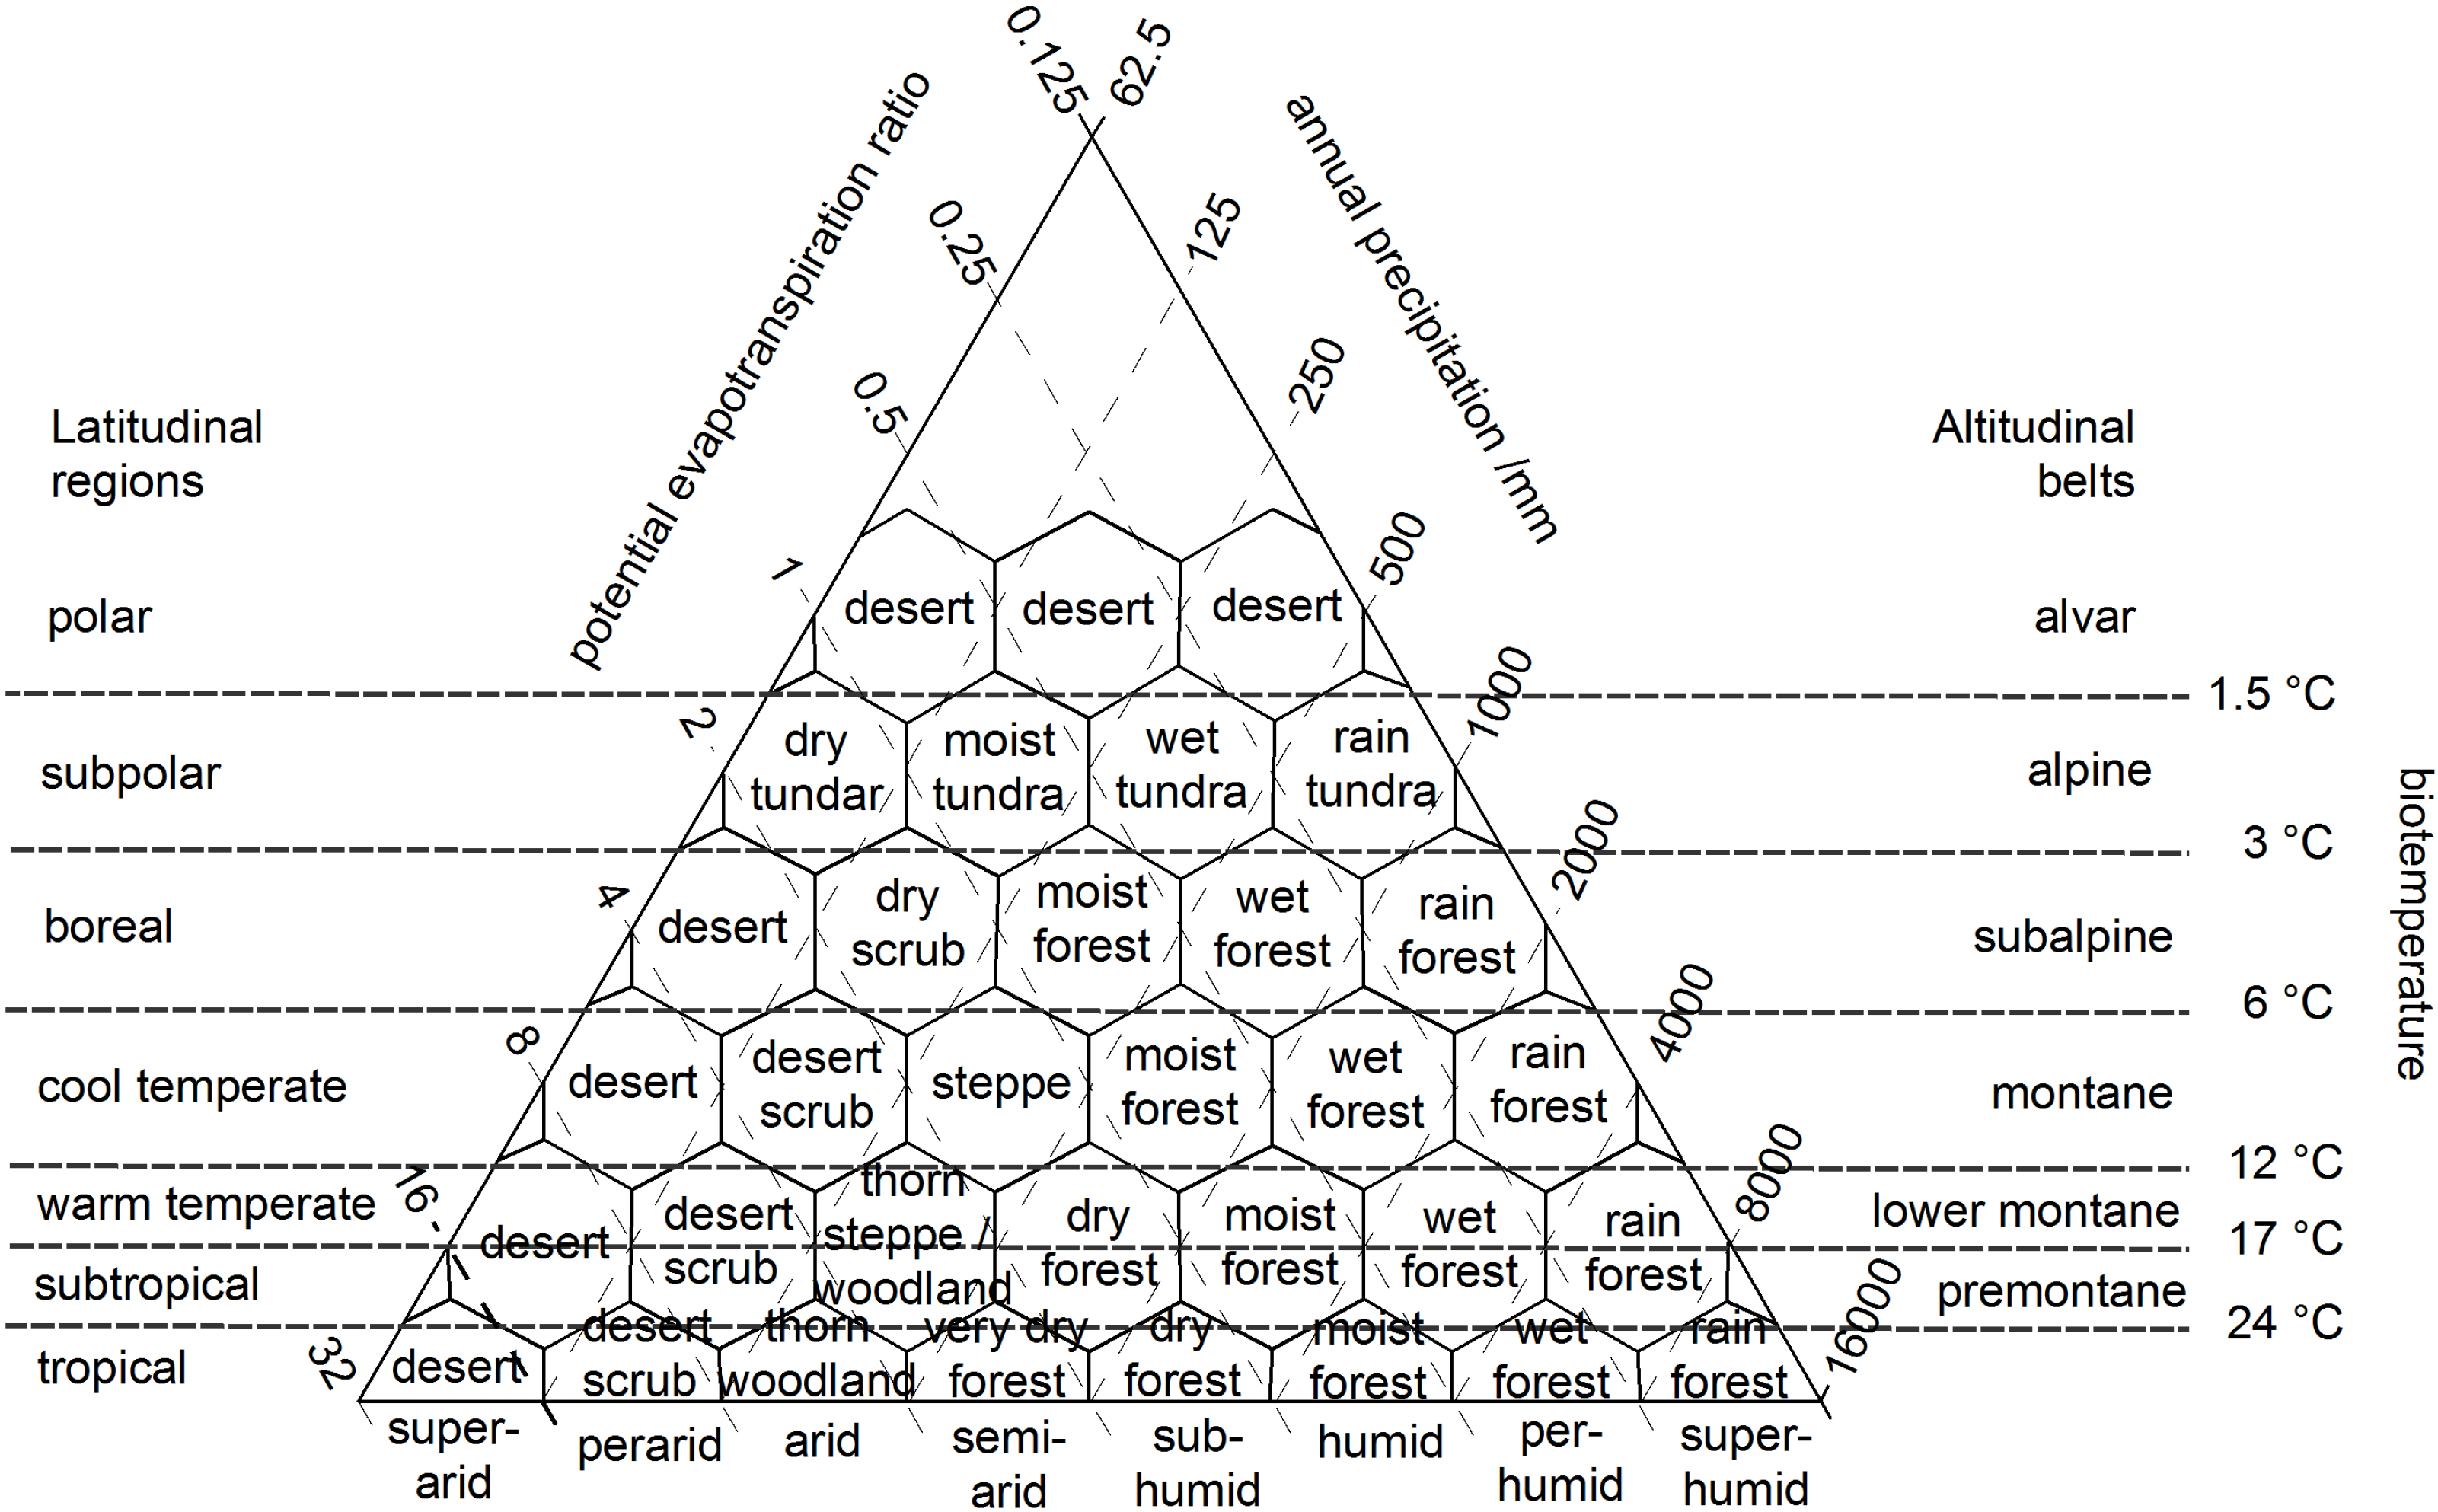
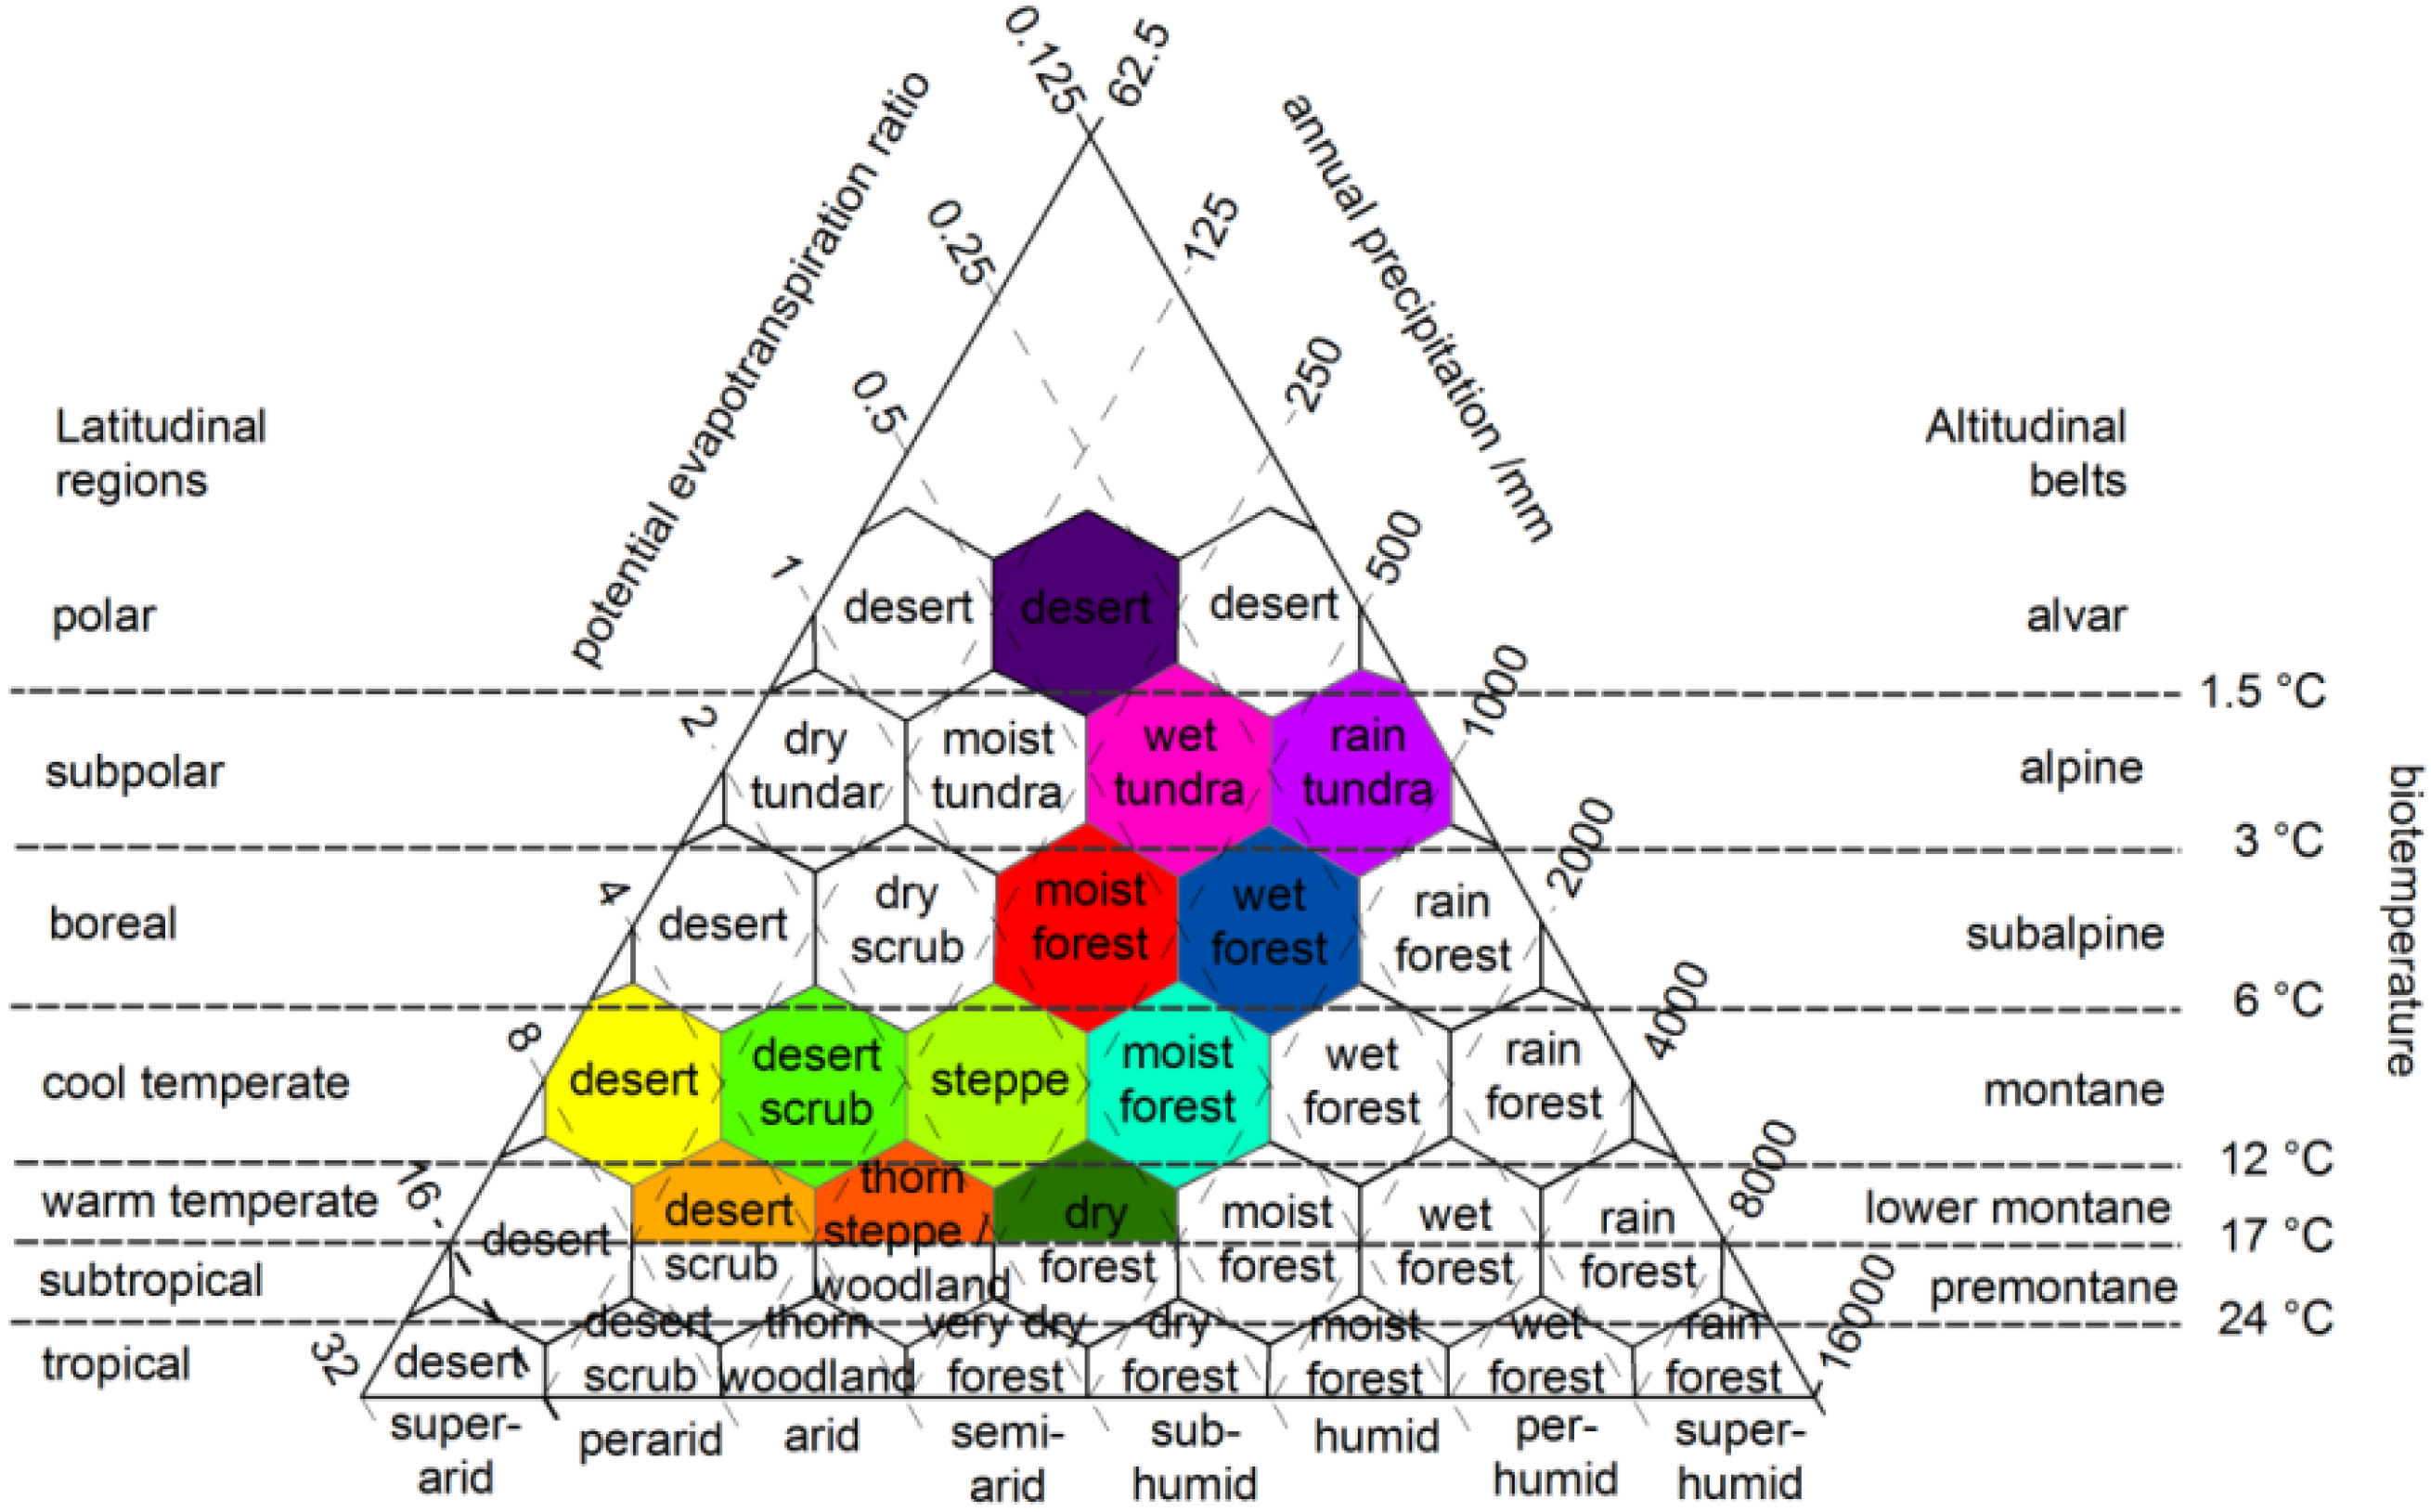
2.2. Holdridge Life Zone Model

The HLZ model is a classic climate-vegetation model designed by L.R. Holdridge [33]. It divides world territorial ecosystems into 39 vegetation zones (life zones, Figure 2). The 39 vegetation zones are mapped in a triangular coordinate system with three logarithmic axes (climatic variables), represented by a series of hexagonal forms. The triangular coordinate system includes three key climatic variables: annual biotemperature (ABT), annual precipitation (AP), and potential evapotranspiration ratio (PER). In this study, ABT, AP, and PER are estimated with the following Equations (1)–(3):
A B T = 1 12 i = 1 12 T i
A P = i = 1 12 P i
P E R = 58.93 × A B T / A P
where Ti is monthly mean temperature with values above 30 °C or below 0 °C substituted by 0 °C; Pi is monthly precipitation.
Figure 2. The concept framework of Holdridge Life Zone model, which divides world territorial ecosystems into 39 vegetation zones (life zones) [33].
Forests 06 02092 g002

2.3. Current Climate Layers and Future Climate Scenarios

The current climatic layers (average monthly mean temperature and average monthly mean precipitation) and future climatic layers (minimum monthly temperature, maximum monthly temperature, and average monthly precipitation) with spatial resolution 2.5 arc-min (grid cell is about 4305 m × 3360 m) with coordinate system of GCS_WGS_1984 were obtained from the WorldClim database [34]. We resampled all climatic layers to 4000 m × 4000 m resolution with coordinate system of Clarke_1866_Albers for convenient and accuracy of simulation process.
The current climate layers (1950–2000) in WorldClim database were mainly produced by using major climate databases compiled by the Global Historical Climatology Network (GHCN), World and Meteorological Organization (WMO), Food and Agriculture Organization of the United Nations (FAO), the International Centre for Tropical Agriculture (CIAT), Regional, Electronic Hydrometeorological Data Network (R-HydroNET), and a number of additional minor databases [13].
The future climate layers in WorldClim database are produced by many GCMs based on four representative concentration pathways (RCPs): RCP2.6, RCP4.5, RCP6.0, and RCP8.5. There is no supremacy between different GCMs, but attempts should be made to justify the use of a particular GCMs. Xu and Xu [35] have evaluated the simulation performance of 18 GCMs from CMIP5 based on geographic distribution of temperature and precipitation during 1961–2005. They believed that most GCMs underestimate the actual temperature and overestimate precipitation. Ensemble of the 18 GCMs to smooth temperature shows a good performance with temporal correlation coefficient up to 0.82. For precipitation, the multi-ensembles seem to show more precipitation than observation (overestimation of about 35%). Unfortunately, the article of Xu and Xu [35] did not give the selection of optimal model for China and also did not separate the evaluation of Loess Plateau region. Digging the past climate data (1956–2000) by Yao et al. [36] has shown that climate change tends to be warmer and dryer on Loess Plateau. Therefore, the previous works by Xu and Xu [35] and Yao et al. [36] had shown us the way of selecting suitable GCMs on Loess Plateau: the simulation of temperature should be an approximation to the value of multi-models’ ensemble, while the simulation of precipitation should be as low as possible.
This study chose a period from 2061 to 2080 (represented by 2070s) as the research object, during which the CO2 concentration will increase from 390.5 ppm (2011) to 437.5 ppm in RCP2.6, to 524.3 ppm in RCP4.5, to 549.8 ppm in RCP6.0, and to 677.1 ppm in RCP 8.5 scenarios by the year 2070 [1]. Seven GCMs were selected as candidate models from seven modeler centers of six countries (China, USA, UK, France, Japan, and Norway), and their simulation performances on Loess Plateau were summarized in Table 1. According to the established standards for selection, it seems that BCC_CSM1.1 performs best on Loess Plateau. BCC_CSM1.1 completely couples the atmospheric model BCC_AGCM2.1, the land surface model BCC_AVIM1.0, the global ocean circulation model MOM4_L40, and the global dynamic/thermodynamic sea ice model SIS using a flux coupler. Detailed descriptions of these models are provided by Xu et al. [34] and Xin et al. [37,38]. The future climate conditions (2070s) shows that mean temperature will increase from 2 °C to 4.1 °C and annual precipitation will increase from 8 mm to 34 mm relative to 1950–2000 (7.6 °C and 441 mm) on Loess Plateau under four RCP scenarios predicted by BCC_CSM1.1.
Table 1. Summary of future climate change scenarios (2070s) from seven global climate models (GCMs) on Loess Plateau.
GCMsSimulation of Temperature (°C)Simulation of Precipitation (mm)
RCP2.6RCP4.5RCP6.0RCP8.5RCP2.6RCP4.5RCP6.0RCP8.5
BCC-CSM1-1 a9.610.210.511.7449467454475
CCSM4 b9.210.110.311.5444467460491
GISS-E2-R c9.09.910.110.9455485463498
HadGEM2-AO d9.911.010.812.5475550466524
IPSL-CM5A-LR e10.011.111.113.0489485456490
MIROC-ESM-CHEM f10.011.411.113.1499480484492
NorESM1-M g9.910.610.611.8481480459472
Model Ensemble h9.710.610.612.1470488463492
a: Beijing Climate Center Climate System Model version 1, BBC, China; b: The Community Climate System Model version 4, The National Center for Atmospheric Research (NCAR), USA; c: Goddard Institute for Space Studies Model E version 2 with Russell ocean model, GISS, USA; d: Hadley Centre Global Environment Model version 2, Met Office Hadley Centre, UK; e: Institut Pierre Simon Laplace Climate Model 5A-Low Resolution, IPSL, France; f: Atmospheric Chemistry Coupled Version of Model for Interdisciplinary Research on Climate-Earth System, AMSTEC, AORI, NIES, Japan; g: The Norwegian Earth System Model version 1 with Intermediate Resolution, Norwegian Climate Centre, Norway; h: Simple arithmetic mean.

2.4. Simulation Process and Statistical Analysis

Firstly, we obtained the center points of each hexagon (life zone) in the HLZ model, which were transformed into their natural logarithm (log2ABTi, log2PETi and log2APi). We natural logarithm transformed each grid cell for both current and future climate layers, which were represented by log2ABTj, log2PETj, and log2APj. We calculate the distance of all grid cells to each center point using the following expression:
d j ( l o n g , l a t ) = ( L o g 2 A B T j L o g 2 A B T i ) 2 + ( L o g 2 A B T j L o g 2 A B T i ) 2 + ( L o g 2 A B T j L o g 2 A B T i ) 2
where, dj(long, lat) represents the distance of a grid to the hexagon center (life zone) under j climate conditions (including current and four future scenarios). If, dij = min(dj(long, lat)), then the site (long, lat) is classified into the i vegetation zone (valued from 1 to 39) under j climate conditions (valued from 1 to 5).
Secondly, we ran the HLZ model and obtained five vegetation maps including one map for current climate conditions and four maps for RCP2.6, RCP4.5, RCP6.0, and RCP8.5 scenarios. We used the Pearson correlation coefficient to measure their similarity. The larger the Pearson coefficient was, the more similarity between vegetation conditions was under the climate change and the current climate. We also used non-metric multidimensional scaling (NMDS) to analyze vegetation structure changes. NMDS seeks an ordination in which the distances between all pairs of the five vegetation maps, as far as possible, are in rank-order agreement with their dissimilarity (measured by Bray-Curtis) in vegetation composition [39,40]. The further each is from the other, the more different is their vegetation composition.
Finally, we analyzed the change area of the vegetation zone (represented by grid cells, each grid cell is 4000 m × 4000 m, 16 km2) by ArcGIS9.3. We also analyzed the zonal, meridional and vertical shift of dominant vegetation zones by investigating the movement of their centroids of distribution areas and elevation ranges. The centroids of distribution area for each domain vegetation zone were calculated as the following Equations (5) and (6):
l o n g ¯ i = j = 1 N i l o n g i j N i
l a t ¯ i = j = 1 N i l a t i j N i
where longi and lati are the longitude and latitude coordinates of the center of the grid cell of i vegetation zone; longij and latij are the longitude and latitude coordinates of the j cell in i vegetation zone; Ni is the number of grid cells in i vegetation zone.

3. Results

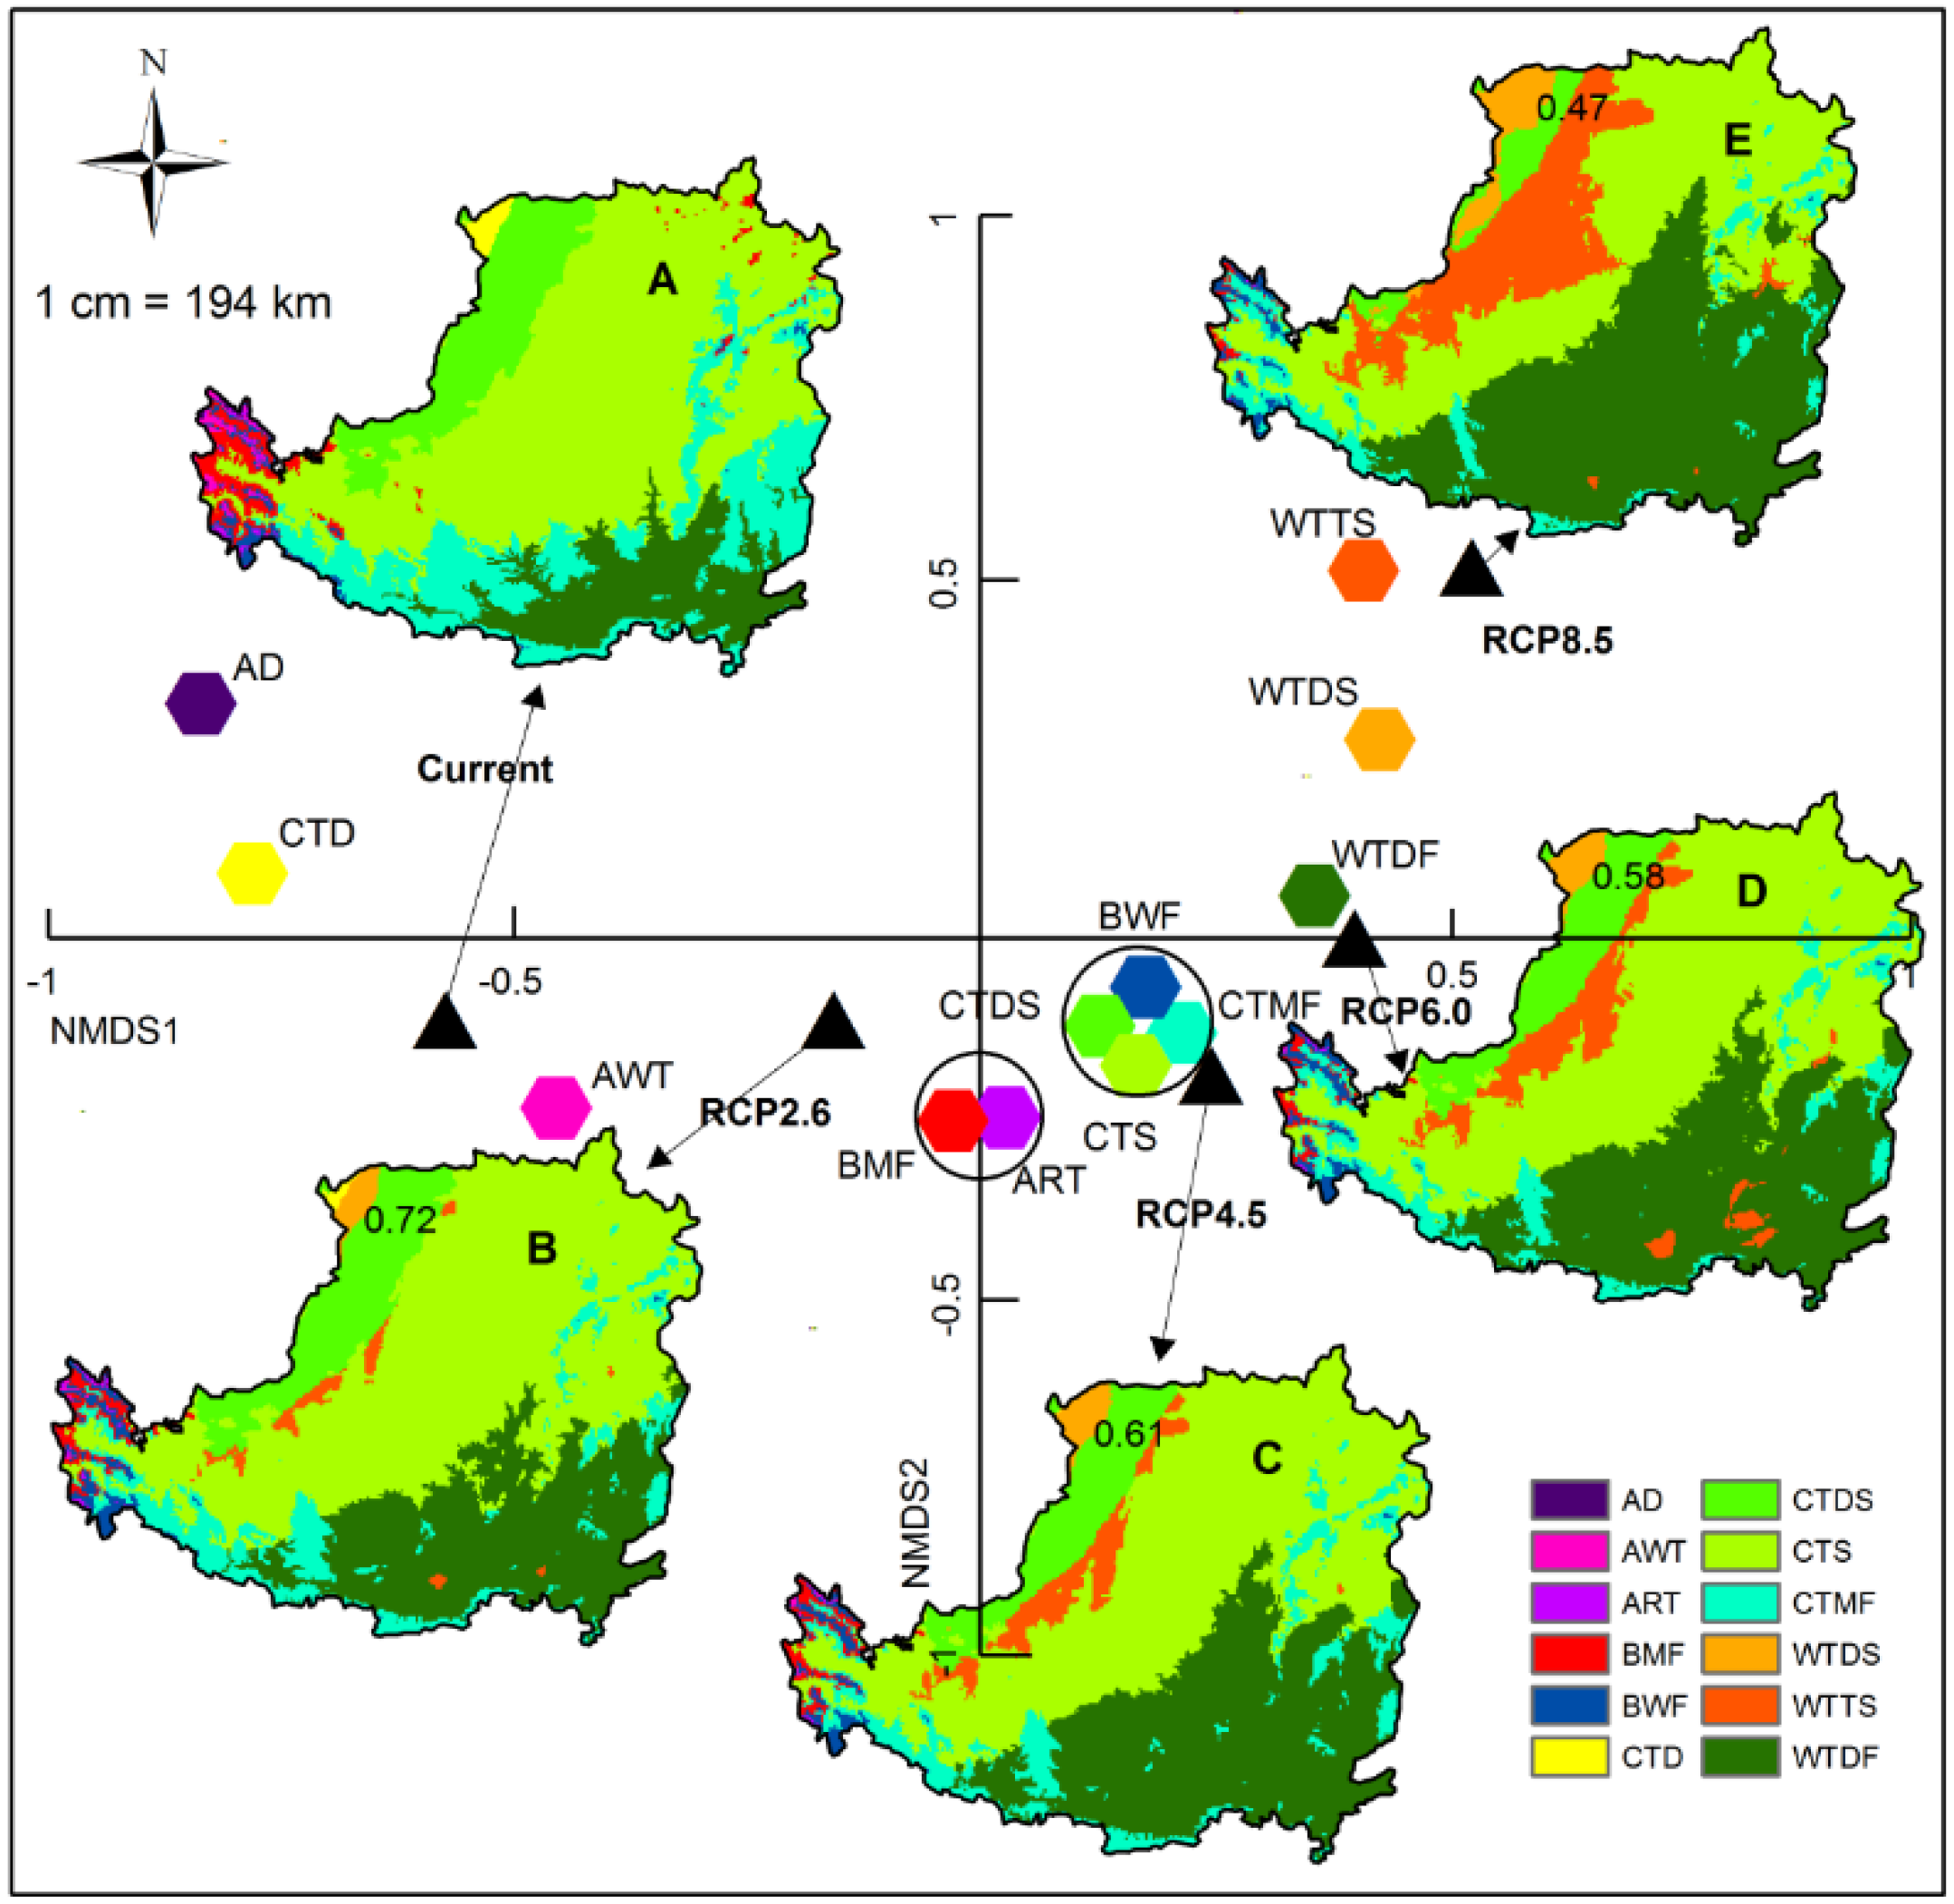
3.1. Spatial Distribution Patterns of Vegetation Zones

Twelve vegetation zones (life zones) will be observed under both current climate condition and future climate change scenarios on Loess Plateau from the concept framework of Holdridge Life Zone model system (Figure 3). They were alvar desert, alpine wet tundra, alpine rain tundra, boreal moist forest, boreal wet forest, cool temperate desert, cool temperate desert scrub, cool temperate steppe, cool temperate moist forest, warm temperate desert scrub, warm temperate thorn steppe, and warm temperate dry forest. Under current climate conditions, there were 10 vegetation zones occurring on Loess Plateau: alvar desert, alpine wet tundra, alpine rain tundra, boreal moist forest, boreal wet forest, cool temperate desert, cool temperate desert scrub, cool temperate steppe, cool temperate moist forest, and warm temperate dry forest (Figure 3). Under future climate scenarios, two new vegetation zones will emerge on Loess Plateau (warm temperate desert scrub and warm temperate thorn steppe) and desert zones will disappear.
Spatial distributions of vegetation zones on Loess Plateau under current and future climate condition were mapped in Figure 4. The NMDS ordination found that vegetation zones under the current climate (Figure 4A) and low emission scenarios (e.g., RCP2.6, Figure 4B) are characterized by alpine wet tundra, alpine rain tundra, and boreal moist forest. Meanwhile, vegetation zones under high emission scenarios (e.g., RCP8.5, Figure 4E) are characterized by warm temperate desert scrub and warm temperate thorn steppe, which is a new vegetation zone on Loess Plateau. Pearson correlation coefficients between maps of current and future distribution are 0.72 for RCP2.6, 0.61 for RCP4.5, 0.58 for RCP6.0, and 0.47 for RCP8.5. This indicates that the vegetation zone distribution pattern changes little under the lower emission scenarios (e.g., RCP2.6), while the vegetation zone distribution pattern changes more under higher emission scenarios (e.g., RCP8.5). The NMSD ordination also supports the conclusion that the distance between RCP8.5 and the current position is farther than the distance between PCP2.6 and the current position (Figure 4).
Figure 3. Twelve vegetation zones (life zones) under both current climate conditions and future climate change scenarios on Loess Plateau in the Holdridge Life Zone model system. Except for warm temperate desert scrub and warm temperate thorn steppe zones, all other zones occurred under the current climate situation. The alvar desert zone will disappear under future climate scenarios.
Forests 06 02092 g003
Figure 4. NMSD ordinations of vegetation structure under current and future climate scenarios on Loess Plateau and Pearson coefficients between current and future vegetation map (shown in the left-corner of each submap). (A) current climate; (B) RCP2.6; (C) RCP4.5; (D) RCP6.0; (E) RCP8.5. Alvar desert (AD), alpine wet tundra (AWT), alpine rain tundra (ART), boreal moist forest (BMF), boreal wet forest (BWF), cool temperate desert (CTD), cool temperate desert scrub (CTDS), cool temperate steppe (CTS), cool temperate moist forest (CTMF), warm temperate desert scrub (WTDS), warm temperate thorn steppe (WTTS), and warm temperate dry forest (WTDF).
Forests 06 02092 g004

3.2. Change Distribution Area of Vegetation Zones

We calculated the area of each vegetation zone under current and future climate conditions using ArcGIS9.3 (Table 2). The alvar desert disappears under each RCP scenario, while the alpine wet tundra and the cool temperate desert disappears under future higher emission scenarios (e.g., RCP6.0, RCP8.5). Two new vegetation zones (warm temperate desert scrub and warm temperate thorn steppe) will emerge under each RCP scenario. Warm temperate dry forest will expand its area proportion from 12.2% to 22.8%–37.2%, while cool temperate moist forest will decrease its area proportion from 18.5% to 6.9%–9.5%. The area proportion of cool temperate steppe will decrease from 51.8% to 34.5%–51.6%. These changes are significant under high emission scenarios.
Table 2. The area proportion (%) of vegetation zones under the current climate (1950–2000) and future climate change scenarios (2070s). Area proportion was calculated from each corresponding map from grid cells with 4000 m × 4000 m resolutions. Vegetation zones with grid cells of less than 20 were combined with nearby vegetation zones. The unit of area is 103 km2.
Vegetation ZoneCurrent Climate
Area
(Percent)
Future Climate Scenarios (2070s)
RCP2.6
Area
(Percent)
RCP4.5
Area
(Percent)
RCP6
Area
(Percent)
RCP8.5
Area
(Percent)
Alvar desert1 (0.2)----
Alpine wet tundra4 (0.7)1 (0.2)1 (0.2)--
Alpine rain tundra2 (0.3)1 (0.2)1 (0.2)1 (0.2)-
Boreal moist forest18 (3.0)8 (1.3)7 (1.1)4 (0.7)1 (0.2)
Boreal wet forest8(1.3)9 (1.5)7 (1.1)8 (1.3)6 (1.0)
Cool temperate desert5(0.8)2 (0.3)---
Cool temperate desert scrub68(11.2)63 (10.3)51 (8.4)48 (7.9)22 (3.6)
Cool temperate steppe317(51.8)314 (51.6)274 (44.9)279 (46.0)210 (34.5)
Cool temperate moist forest114 (18.5)58 (9.5)56 (9.2)49 (8.0)42 (6. 9)
Warm temperate desert scrub-6 (1.0)8 (1.3)8 (1.3)17 (2.8)
Warm temperate thorn steppe-8 (1.3)24 (3.9)39 (6.4)84 (13.8)
Warm temperate dry forest74 (12.2)139 (22.8)181 (29.7)172 (28.2)227 (37.2)

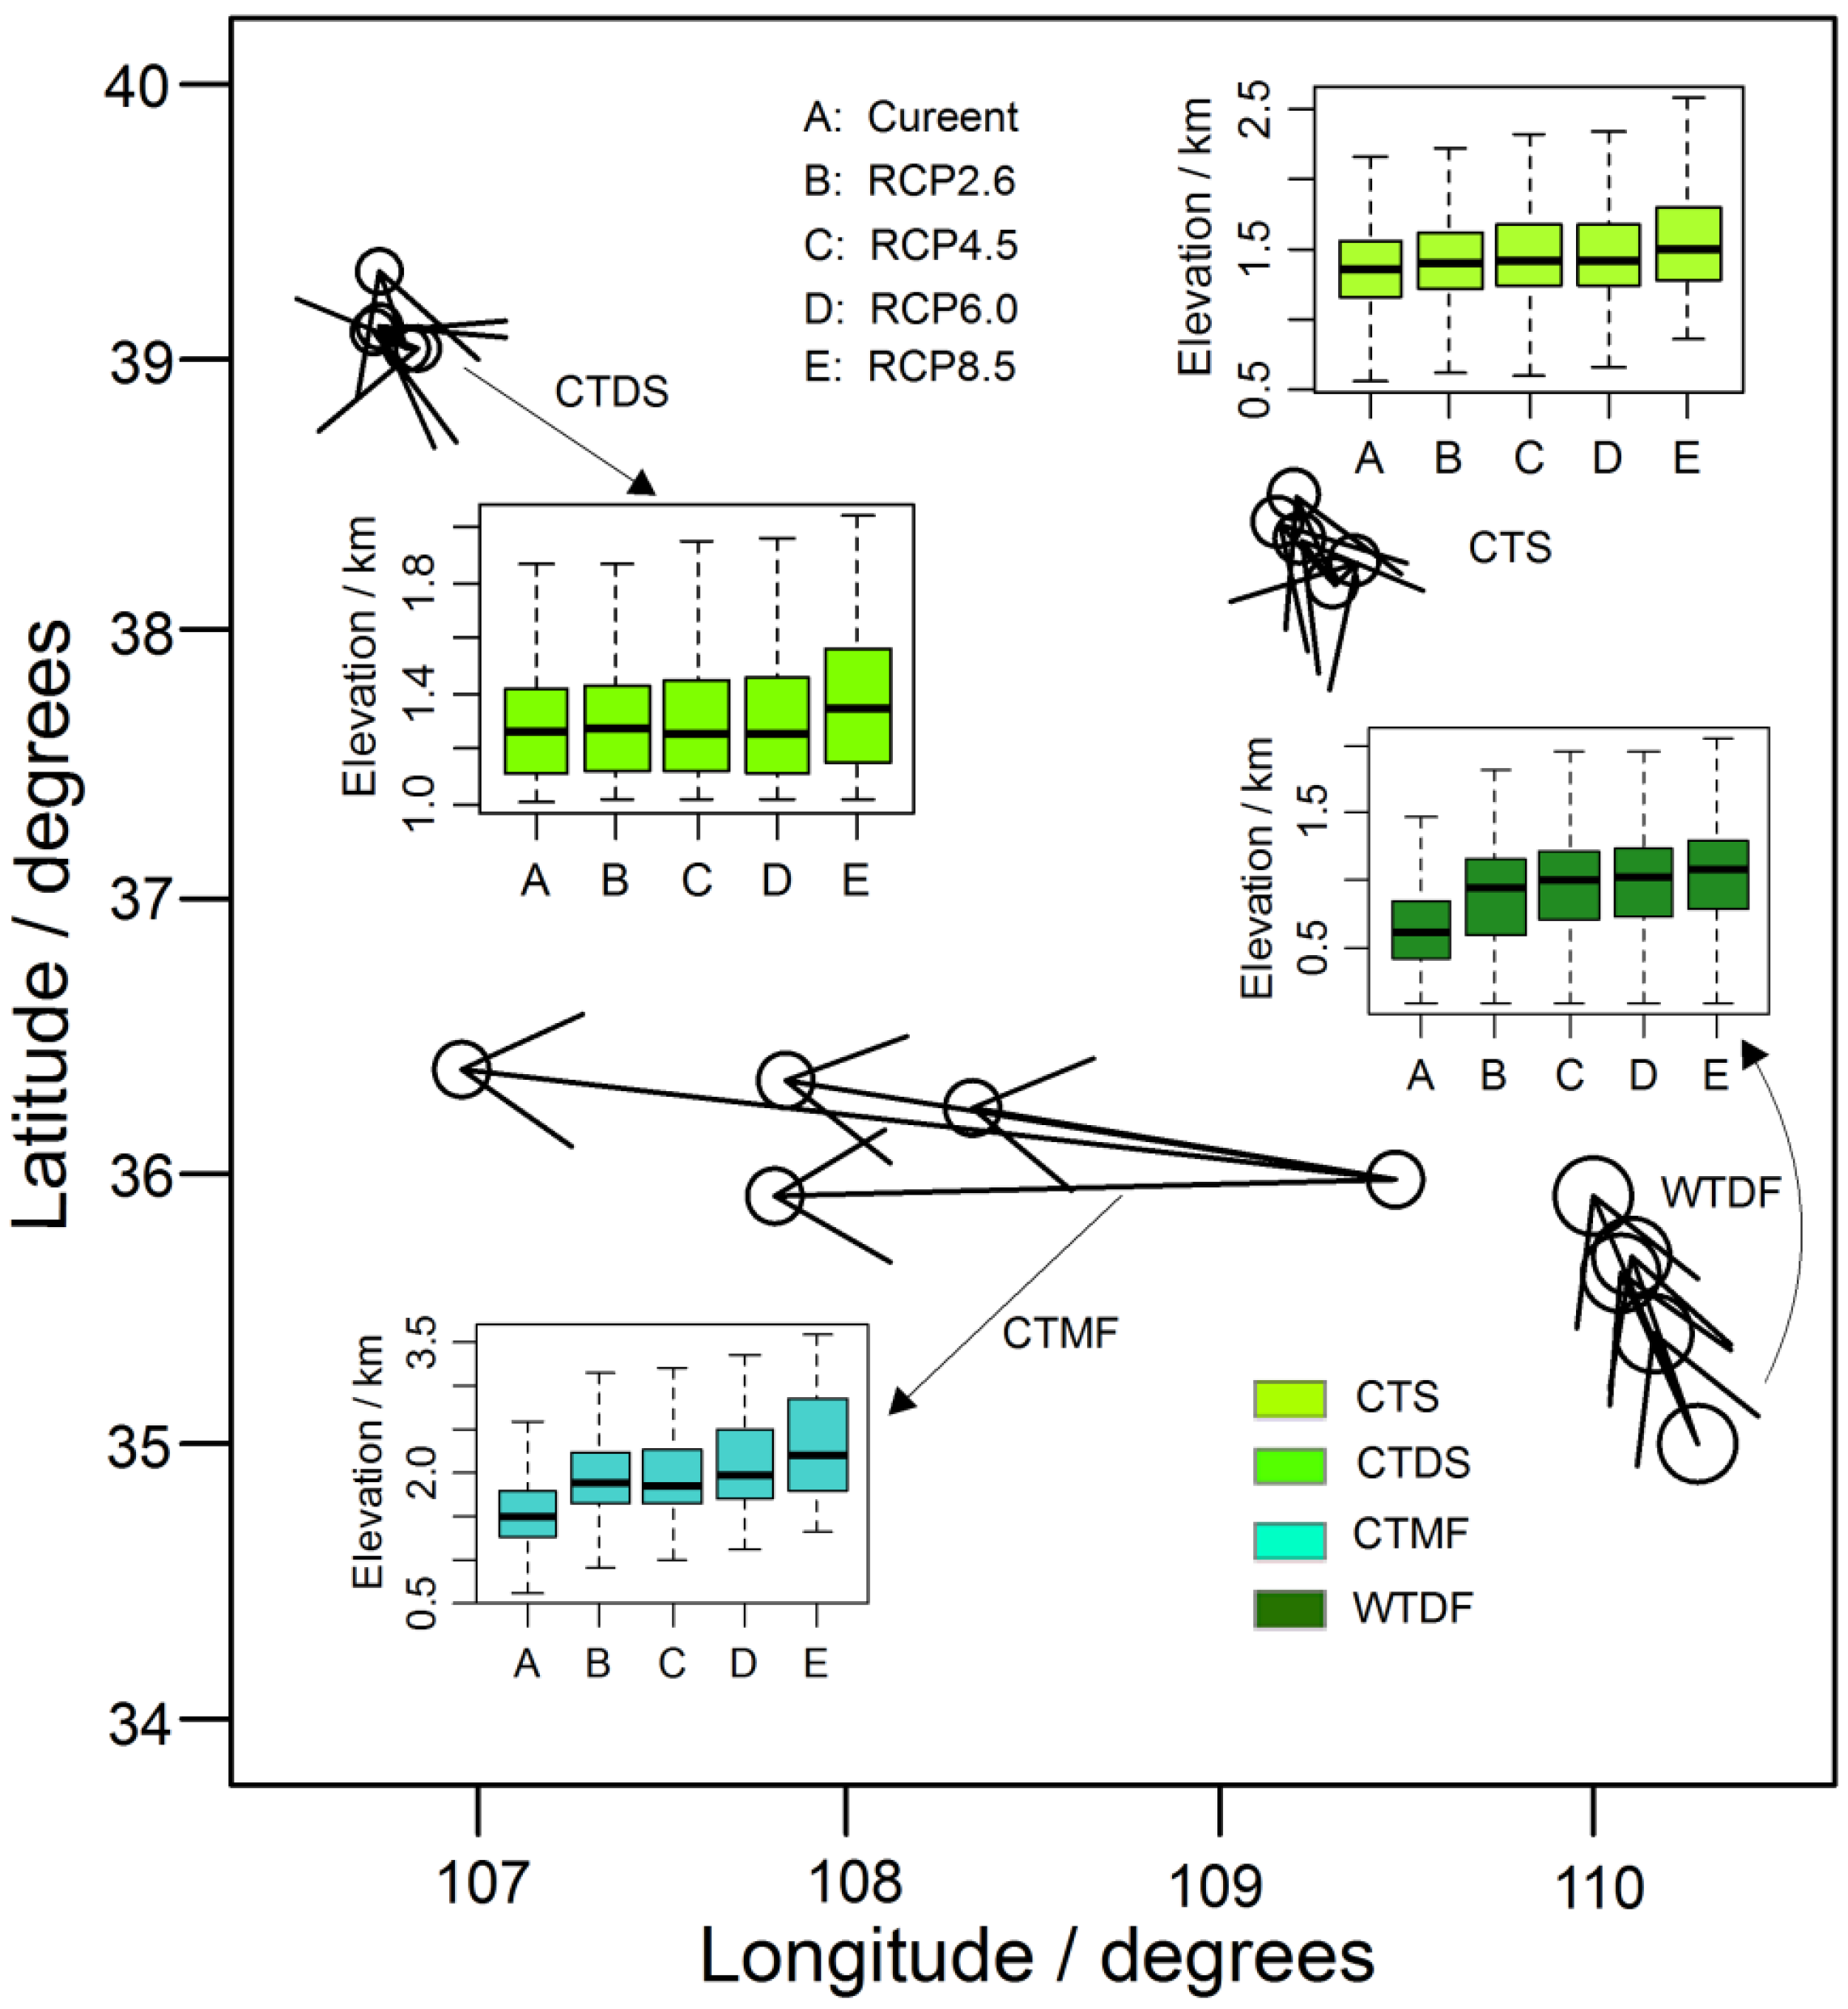
3.3. Zonal, Meridional and Vertical Shift of Domain Vegetation Zones

The four dominant vegetation zones on Loess Plateau are warm temperate dry forest, cool temperate moist forest, cool temperate steppe, and cool temperate desert scrub, which account for 93.7% of the area of Loess Plateau (Table 2). The zonal, meridional and vertical shift of these dominant vegetation zones were illustrated in Figure 5. The results show that forest zones have a significant zonal and meridional transition, while scrub and steppe zones have less zonal and meridional transition and their centroids hardly shift. Cool temperate moist forests will transition westward 100 km (about 1.13° E) under RCP2.6 to 220 km (about 2.5° E) under the RCP8.5 scenario. Warm temperate dry forests will transition northward from 44 km (about 0.4° N) under RCP2.6 to 102 km (about 0.9° N) under RCP8.5. The vertical shift of domain vegetation zones to climate change shows similar patterns as their zonal and meridional movement behaviors (Figure 5). Cool temperate moist forests will shift upward from 1498 m (current climate condition) to 1873 m and 2216 m under RCP2.6 and RCP8.5 scenarios separately. Warm temperate dry forests will shift upward from 603 m (current climate condition) to 934 m and 1072 m under RCP2.6 and RCP8.5 scenarios separately. The vertical shift of cool temperate desert scrub is quite small under lower emission scenarios (−10 to 5 m) except RCP8.5 scenario (86 m), while the vertical shift of cool temperate steppe is significantly under higher emission scenarios (66 to 136 m) except RCP2.6 (37 m).
Figure 5. The zonal, meridional and vertical shift of four dominant vegetation zones on Loess Plateau. Cool temperate steppe (CTS), cool temperate desert scrub (CTDS), cool temperate moist forest (CTMF), and warm temperate dry forest (WTDF).
Forests 06 02092 g005

4. Discussion

4.1. Vegetation Zone Response to Climate Change and Its Explanation

A number of studies have been carried out to investigate the potential impacts of climate change on the distribution of terrestrial vegetation at regional scales [4,5,6]. In this study, a simulation experiment shows that vegetation zone responses to climate change are significantly different under four emission scenarios (RCP2.6, RCP4.5, RCP6.0, RCP8.5, Figure 4) from the latest IPCC fifth assessment based on a GCM. Vegetation zone distribution patterns changed little under RCP2.6, while vegetation zone distribution patterns changed much more significantly under RCP8.5. Both the Pearson correlation coefficient method and the NMDS ordination method demonstrate that the structure and composition of vegetation zones under different climate change scenarios changed substantially. It has been demonstrated that the alvar desert, alpine wet tundra, and cool temperate desert will likely disappear under every RCP scenario. In addition, two new vegetation zones (warm temperate desert scrub and warm temperate thorn steppe) will appear under every RCP scenario.
The IPCC fifth assessment report shows that the Eastern Asian Monsoon will increase [1], and the enhanced monsoon climate will bring large amounts of rain [41,42,43,44]. Loess Plateau is located in the northwestern extent of the Asian monsoon where water availability limits the northern marginal distribution of forest [26]. Therefore, the forests should extend their distribution areas in the southeast and northwest due to the enhanced Asian monsoon [45]. We found two migration strategies of forest zones with climate change in the Loess Plateau region. The centroid of warm temperate forest will shift northward about 44–102 km and shift upward 331–369 m. The centroid of cold temperate forest will move toward the west about 100–220 km and shift upward 375–718 m under four scenarios. Although the centroid of cold temperate forest will shift westward, the overall distribution area of cold temperate forest will decrease from 18.5% to 6.9%–9.5% as the forest is replaced by warm temperate forest. The area of warm temperate forest will increase from 12.2% to 22.8%–37.2%, which increases the total forest zone area. Warm temperate forests may be limited by thermal factors at the northern marginal boundary of Loess Plateau, so future climate warming will cause northward expansion of the distribution of warm temperate forests. This indicates that future climate changes will be beneficial for the growth and expansion of the warm temperate forest, which was also demonstrated by Fang’s research [46].
In comparison with the forest zones, the range shift of steppe and desert scrubland zones in the zonal, meridional, and vertical directions were simulated less sensitively under future climate change scenarios (Figure 5). This may be related to the flat terrain in the region of steppe and desert scrubland zones. Furthermore, evapotranspiration will increase as a result of climate warming in the region, which decreases the effects of enhanced precipitation [47,48,49]. However, the distribution area of grassland and scrubland zones will decrease from 51.8% to 34.5%–51.6% and from 11.2% to 3.6%–10.3%, respectively. This is because the southern distribution area of grassland and scrubland will be replaced by cold temperate forest and warm temperate forest. Desert areas will probably disappear and be replaced by grasslands and shrub zones under future climate change scenarios.
Comparable studies of vegetation zones migration in other regions have been done. Niu and Lv [22] set two climate change scenarios (T + 2 °C P+20%; and T + 4 °C, P + 20%) to study the vegetation zones in Inner Mongolia. Their results indicate that warm steppe and warm forest zones will increase, while cool temperate steppes and desert steppes will decrease. Xu et al. [50] set five scenarios (T + 2.5 °C, P + 10%; T + 2.5 °C, P + 20%; T + 4 °C, P + 10%; T + 4 °C, P + 0%; and T + 4 °C, P – 10%) to study the vegetation zones in the Sichuan Basin. The results reveal that forests will increase, while alpine meadows and tundra zones will decrease. These conclusions concur with our research that forest areas will increase and steppe areas will decrease (T + 2 – 4.1 °C; P + 2 – 8%). Wu et al. [21] studied the vegetation zones in Northeast China and their climate change scenario was based on doubled CO2 levels predicted by GISS (T + 3.7~4.0 °C; P + 9 – 10%). Their results differ from this research and imply that forest areas will decrease, while steppe areas will increase. Actually, Northeast China is located in a high latitude region, which is farther north than Loess Plateau. Global warming will be more severe in the northern region with high latitudes [1] and will result in increases of potential evapotranspiration, which will decrease the amount of water available for forest vegetation [51,52,53].

4.2. Potentials and Limitations of HLZ Model and Its Applications

The HLZ model is the first method for simulating vegetation zones by combining the concepts of life forms [54] and life zones [33]. Since then, various climate-vegetation models have been also used, such as Box, DOLY (Dynamic Global Phytogeography Model), MAPPSS (Mapped Atmosphere Plant Soil System), BIOME2 (A Coupled Carbon and Water Flux Model), BIOME3 (A Coupled Biogeography and Biogeochemistry Model), and IBIS (the Integrated Biosphere Simulator) models [55]. This research used the HLZ model to predict the effects of climate change on vegetation zones (life zones). Some studies have shown that there is a slight difference between the HLZ model and some mechanism models [56]. However, researchers must be aware that the parameters required for mechanism models are more complex. The missing data in the Loess Plateau area was difficult to acquire. Since the HLZ model needs only three parameters, its advantage is obvious [12,13,57].
In addition to the algorithm, most climate-vegetation models do not consider the destruction of vegetation that human activities in the future may cause. Human activities may change the response of vegetation to climate change through the transformation of land use types. For example, restoration of forest can be realized in habitat frangibility areas by the change of regional water cycles and construction of irrigation systems [58,59,60]. Expansion of agricultural, industrial, and urban areas will never stop since large numbers of the population need to be fed and their living standard will be advanced in the future on our planet [61,62,63,64]. Although the bioclimatic indices used for classification may sufficiently simulate vegetation patterns, the actual patterns can be described by a function of additional factors, which are not explicitly considered in the model (e.g., soils), and may vary both temporally and spatially under changed climate conditions. Some say that the HLZ model simulates ecosystem potential functions other than actual ecosystem structure [13,17,65]. We also agree with this point of view.
Therefore, the HLZ model can link the biodiversity conservation of land planning, regional carbon reserves estimation, and vegetation mapping [14,16,17,66]. Since natural and anthropogenic results in the degradation of vegetation on Loess Plateau, this region has gained a lot of attention regarding vegetation restoration and construction. A number of ecological restoration projects have been implemented [27]. The geographical distribution boundaries and areas of vegetation zones under current climate and future climate conditions obtained by this study can provide important reference information for policy makers in planning regional vegetation restoration.

5. Conclusions

The HLZ model has been used widely in analyzing the effects of climate change on vegetation distribution patterns. In this study, a risk assessment of vegetation zones to climate change was performed on the basis of four climate change scenarios (RCP2.6, RCP4.5, RCP6.0, and RCP8.5) projected by the Beijing Climate Center Climate System Model (BCC_CSM1.1) for the 2070s. The change in characteristics of vegetation structure, the area percentage of each vegetation zone, and the distribution centroid of the dominant vegetation zone were investigated. The research shows that the overall range of vegetation zones shifts northwestward and upward, but there are differences for different vegetation zones. Areas of forest zones will increase, areas of steppe zones will decrease, areas of deserts will disappear, and warm temperate desert scrub and thorn steppe will appear. Our simulation results demonstrate that future climate change will be conducive to the growth and expansion of warm temperate dry forest zone on Loess Plateau, which causes positive effects on reforestation projects in this region.

Acknowledgments

The authors acknowledge two anonymous reviewers for their constructive comments, which significantly improved the manuscript. We are grateful to Jinghua Huang for her improvement of language expression. We thank the Global Climate Database for providing current and future climatic layers around the world. The project was supported financially by the National Nature Science Foundation of China (No. 31300407), the Specialized Research Fund for the Doctoral Program of Higher Education (No. 20130204120028) and Chinese Universities Scientific Fund (2014YB054).

Author Contributions

Guoqing Li, Zhongming Wen, Ke Guo and Sheng Du conceived and designed the experiments; Guoqing Li performed the experiments; Guoqing Li wrote the paper.

Conflicts of Interest

The authors declare no conflict of interest.

References

  1. IPCC. Climate change 2013: The physical science basis. In Contribution of Working Group I to the Fifth Assessment Report of the Intergovernmental Panel on Climate Change; Stocker, T.F., Qin, D., Plattner, G.-K., Tigno, M.R., Allen, S.K., Boschung, J., Nauels, A., Xia, Y., Bex, V., Midgley, P.M., Eds.; Cambridge University Press: Cambridge, UK; New York, NY, USA, 2013. [Google Scholar]
  2. IPCC. Summary for plicymakers. In Climate Change 2014: Mitigation of Climate Change. Contribution of Working Group III to the Fifth Assessment Report of the Intergovernmental Panel on Climate Change; Edenhofer, O., Pichs-Madruga, R., Sokona, Y., Farahani, E., Kadner, S., Seyboth, K., Adler, A., Baum, I., Brunner, S., Eickemeier, P., et al., Eds.; Cambridge University Press: Cambridge, UK; New York, NY, USA, 2014. [Google Scholar]
  3. IPCC. Summary for policymakers. In Climate Change 2014: Impacts, Adaptation, and Vulnerability. Part A: Global and Sectoral Aspects. Contribution of Working Group II to the Fifth Assessment Report of the Intergovernmental Panel on Climate Change; Field, C.B., Barros, V.R., Dokken, D.J., Mach, K.J., Mastrandrea, M.D., Bilir, T.E., Chatterjee, M., Ebi, K.L., Estrada, Y.O., Genova, R.C., et al., Eds.; Cambridge University Press: Cambridge, UK; New York, NY, USA, 2014. [Google Scholar]
  4. Pearson, R.G.; Phillips, S.J.; Loranty, M.M.; Beck, P.S.A.; Damoulas, T.; Knight, S.J.; Goetz, S.J. Shifts in arctic vegetation and associated feedbacks under climate change. Nat. Clim. Chang. 2013, 3, 673–677. [Google Scholar] [CrossRef]
  5. Lenoir, J.; Gegout, J.C.; Marquet, P.A.; de Ruffray, P.; Brisse, H. A significant upward shift in plant species optimum elevation during the 20th century. Science 2008, 320, 1768–1771. [Google Scholar] [CrossRef] [PubMed]
  6. Felde, V.A.; Kapfer, J.; Grytnes, J.A. Upward shift in elevational plant species ranges in sikkilsdalen, central norway. Ecography 2012, 35, 922–932. [Google Scholar] [CrossRef]
  7. Thomas, C.D.; Franco, A.M.A.; Hill, J.K. Range retractions and extinction in the face of climate warming. Trends Ecol. Evol. 2006, 21, 415–416. [Google Scholar] [CrossRef] [PubMed]
  8. Massot, M.; Clobert, J.; Ferriere, R. Climate warming, dispersal inhibition and extinction risk. Glob. Chang. Biol. 2008, 14, 461–469. [Google Scholar] [CrossRef]
  9. Walters, R.J.; Blanckenhorn, W.U.; Berger, D. Forecasting extinction risk of ectotherms under climate warming: An evolutionary perspective. Funct. Ecol. 2012, 26, 1324–1338. [Google Scholar] [CrossRef] [Green Version]
  10. IGBP. International Geosphere-Biosphere Programme. Available online: http://www.igbp.net/ (accessed on 12 February 2015).
  11. Peng, C.H. From static biogeographical model to dynamic global vegetation model: A global perspective on modelling vegetation dynamics. Ecol. Model. 2000, 135, 33–54. [Google Scholar] [CrossRef]
  12. Chen, X.W.; Zhang, X.S.; Li, B.L. The possible response of life zones in china under global climate change. Glob. Planet. Chang. 2003, 38, 327–337. [Google Scholar] [CrossRef]
  13. Chakraborty, A.; Joshi, P.K.; Ghosh, A.; Areendran, G. Assessing biome boundary shifts under climate change scenarios in India. Ecol. Indic. 2013, 34, 536–547. [Google Scholar] [CrossRef]
  14. Post, W.M.; Emanuel, W.R.; Zinke, P.J.; Sangenberger, A.G. Soil carbon pools and world life zones. Nature 1982, 298, 156–159. [Google Scholar] [CrossRef]
  15. Khatun, K.; Imbach, P.; Zamora, J.C. An assessment of climate change impacts on the tropical forests of central America using the holdridge life zone (HLZ) land classification system. iForest 2013, 6, 183–189. [Google Scholar] [CrossRef]
  16. Yue, T.X.; Fan, Z.M.; Liu, J.Y.; Wei, B.X. Scenarios of major terrestrial ecosystems in China. Ecol. Model. 2006, 199, 363–376. [Google Scholar] [CrossRef]
  17. Lugo, A.E.; Brown, S.L.; Dodson, R.; Smith, T.S.; Shugart, H.H. The holdridge life zones of the conterminous United States in relation to ecosystem mapping. J. Biogeogr. 1999, 26, 1025–1038. [Google Scholar] [CrossRef]
  18. Belotelov, N.V.; Bogatyrev, B.G.; Kirilenko, A.P.; Venevsky, S.V. Modelling of time-dependent biome shifts under global climate changes. Ecol. Model. 1996, 87, 29–40. [Google Scholar] [CrossRef]
  19. Yue, T.X.; Liu, J.Y.; Jorgensen, S.E.; Gao, Z.Q.; Zhang, S.H.; Deng, X.Z. Changes of Holdridge life zone diversity in all of China over half a century. Ecol. Model. 2001, 144, 153–162. [Google Scholar] [CrossRef]
  20. Chen, Y.F. Research on impacts of global climate change to holdridge’s life zones of china by geo-information system. J. Remote Sens. 1997, 1, 74–79. [Google Scholar]
  21. Wu, F.Z.; Jin, Y.H.; Liu, J.P.; Shang, L.N.; Zhao, D.S. Response of vegetation distribution to global climate change in northeast china. Sci. Geogr. Sin. 2003, 23, 564–570. [Google Scholar]
  22. Niu, J.M.; Lv, G.F. Life zones determination and their responds to climate changes in neimongol. Acta Sci. Nat. Univ. NeiMonggol 1999, 30, 360–366. [Google Scholar]
  23. Zheng, F.L. Effects of accelerated soil erosion on soil nutrient loss after deforestation on the Loess Plateau. Pedosphere 2005, 15, 707–715. [Google Scholar]
  24. Li, C.B.; Qi, J.G.; Feng, Z.D.; Yin, R.S.; Guo, B.Y.; Zhang, F.; Zou, S.B. Quantifying the effect of ecological restoration on soil erosion in China’s Loess Plateau region: An application of the mmf approach. Environ. Manag. 2010, 45, 476–487. [Google Scholar] [CrossRef] [PubMed]
  25. Fu, B.J.; Wang, Y.F.; Lu, Y.H.; He, C.S.; Chen, L.D.; Song, C.J. The effects of land-use combinations on soil erosion: A case study in the Loess Plateau of China. Prog. Phys. Geogr. 2009, 33, 793–804. [Google Scholar] [CrossRef]
  26. Tsunekawa, A.; Liu, G.; Yamanaka, N.; Du, S. Restoration and Development of the Degraded Loess Plateau, China; Springer Verlag: Tokyo, Japan, 2013. [Google Scholar]
  27. National Development and Reform Commission; Ministry of Water Resources; Ministry of Agriculture; State Forestry Administration. The Integrated Management Planning of the Loess Plateau from 2010 to 2030. Available online: http://www.ndrc.gov.cn/zcfb/zcfbtz/2010tz/t20110117_391043.htm (accessed on 11 December 2014).
  28. Du, S.; Wang, Y.L.; Kume, T.; Zhang, J.G.; Otsuki, K.; Yamanaka, N.; Liu, G.B. Sapflow characteristics and climatic responses in three forest species in the semiarid Loess Plateau region of China. Agric. For. Meteorol. 2011, 151, 1–10. [Google Scholar] [CrossRef]
  29. Zou, N.G.; Luo, W.X. Sylviculture on the Loess Plateau; China Forestry Press: Beijing, China, 1997. [Google Scholar]
  30. Shao, M.A.; Guo, Z.S.; Xia, Y.Q.; Wang, Y.P. Vegetation Carrying Capacity of Soil Water in the Loess Plateau; Science Press: Beijing, China, 2010. [Google Scholar]
  31. Worldclim. Global Climate Data—Free Climate Data for Ecological Modeling and gis. Available online: http://www.worldclim.org/ (accessed on 12 November 2014).
  32. Chen, J.M.; Wan, H.E. Vegetation Construction and Soil and Water Conservation in the Loess Plateau of China; China Forestry Press: Beijing, China, 2002. [Google Scholar]
  33. Holdridge, L.R. Determination of world plant formations from simple climatic data. Science 1947, 105, 367–368. [Google Scholar] [CrossRef] [PubMed]
  34. Hijmans, R.J.; Cameron, S.E.; Parra, J.L.; Jones, P.G.; Jarvis, A. Very high resolution interpolated climate surfaces for global land areas. Int. J. Climat. 2005, 25, 1965–1978. [Google Scholar] [CrossRef]
  35. Xu, Y.; Xu, C.H. Preliminary assessment of simulations of climate changes over China by CMIP5 multi-models. Atmos. Oceanic Sci. Lett. 2012, 5, 489–494. [Google Scholar]
  36. Yao, Y.B.; Wang, Y.R.; Li, Y.H.; Zhang, X.Y. Climate warming and drying and its environmental effects in the Loess Plateau. Resour. Sci. 2005, 27, 146–152. [Google Scholar]
  37. Wu, T.W.; Song, L.C.; Li, W.P.; Wang, Z.Z.; Zhang, H.; Xin, X.G.; Zhang, Y.W.; Zhang, L.; Li, J.L.; Wu, F.H.; et al. An overview of bcc climate system model development and application for climate change studies. J. Meteorol. Res. 2014, 28, 34–56. [Google Scholar] [CrossRef]
  38. Xin, X.G.; Wu, T.W.; Li, J.L.; Wang, Z.Z.; Li, W.P.; Wu, F.H. How well does bcc_csm1.1 reproduce the 20th century climate change over china? Atmos. Ocean. Sci. Lett. 2013, 6, 21–26. [Google Scholar]
  39. Faith, D.P.; Minchin, P.R.; Belbin, L. Compositional dissimilarity as a robust measure of ecological distance. Vegetatio 1987, 69, 57–68. [Google Scholar] [CrossRef]
  40. Minchin, P.R. An evaluation of relative robustness of techniques for ecologcial ordinations. Vegetatio 1987, 69, 89–107. [Google Scholar] [CrossRef]
  41. Gao, X.J.; Shi, Y.; Giorgi, F. A high resolution simulation of climate change over china. Sci. China Earth Sci. 2011, 54, 462–472. [Google Scholar] [CrossRef]
  42. Lee, J.Y.; Wang, B. Future change of global monsoon in the CMIP5. Clim. Dyn. 2014, 42, 101–119. [Google Scholar] [CrossRef]
  43. Wei, M. A coupled model study on the intensification of the asian summer monsoon in ipccsres scenarios. Adv. Atmos. Sci. 2005, 22, 798–806. [Google Scholar] [CrossRef]
  44. Wang, S.Z.; Yu, E.T. Simulation and projection of changes in rainy season precipitation over China using the wrf model. Acta Meteorol. Sin. 2013, 27, 577–584. [Google Scholar] [CrossRef]
  45. Editorial Committee for Physical Geography of China. Physical Geography of China; Science Press: Beijing, China, 1985. [Google Scholar]
  46. Fang, J.Y.; Kato, T.; Guo, Z.D.; Yang, Y.H.; Hu, H.F.; Shen, H.H.; Zhao, X.; Kishimoto-Mo, A.W.; Tang, Y.H.; Houghton, R.A. Evidence for environmentally enhanced forest growth. Proc. Natl. Acad. Sci. USA 2014, 111, 9527–9532. [Google Scholar] [CrossRef] [PubMed]
  47. Wang, Y.J.; Li, J.; Lin, Z.H.; Tong, X.J.; Xing, L.M. Assessing the impacts of climate change on the potential evapotranspiration in the upper middle reach of Yellow River. Sci. Soil Water Conserv. 2013, 11, 48–56. [Google Scholar]
  48. Zuo, D.P.; Xu, Z.X.; Li, J.Y.; Liu, Z.F. Spatiotemporal characteristics of potential evapotranspiration in the weihe river basin under future climate change. Adv. Water Sci. 2011, 22, 455–461. [Google Scholar]
  49. Wang, S.; Wang, Q.J. Analysis of variation of climate and potential evapotranspiration and its influencing factors in the loess area in last 50 years. Agric. Res. Arid Areas 2012, 30, 270–278. [Google Scholar]
  50. Xu, X.; Su, Z.X.; Yang, D.A. Simulation of influence on life zone in Sichuan Basin under the change of climate in the future. Chin. J. Ecol. 2004, 23, 192–196. [Google Scholar]
  51. Zhang, Y.F.; Deng, J.L.; Guan, D.X.; Jin, C.J.; Wang, A.Z.; Wu, J.B.; Yuan, F.H. Spatiotemporal changes of potential evapotranspiration in songnen plain of northeast china. Chin. J. Appl. Ecol. 2011, 22, 1702–1710. [Google Scholar]
  52. Wang, Y.P.; Huang, Y.; Zhang, W. Variation and tendency of surface aridity index from 1960 to 2005 in three provinces of northeast china. Adv. Earth Sci. 2008, 23, 619–627. [Google Scholar]
  53. Li, X.F.; Jiang, L.X.; Wang, L.L. Variation characteristics of water budget condition of heilongjiang province in recent 50 years. J. Anhui Agric. Sci. 2012, 40, 14391–14396. [Google Scholar]
  54. Raunkiaer, C. Plant Life Forms; The Clarendon Press: Oxford, UK, 1937. [Google Scholar]
  55. Prentice, I.C.; Cramer, W.; Harrison, S.P.; Leemans, R.; Monserud, R.A.; Solomon, A.M. A global biome model based on plant physiology and dominance, soil properties and climate. J. Biogeogr. 1992, 19, 117–134. [Google Scholar] [CrossRef]
  56. Yates, D.N.; Kittel, T.G.F.; Cannon, R.F. Comparing the correlative holdridge model to mechanistic biogeographical models for assessing vegetation distribution response to climatic change. Clim. Chang. 2000, 44, 59–87. [Google Scholar] [CrossRef]
  57. Enquist, C.A.F. Predicted regional impacts of climate change on the geographical distribution and diversity of tropical forests in costa rica. J. Biogeogr. 2002, 29, 519–534. [Google Scholar] [CrossRef]
  58. Xue, X.; Liao, J.; Hsing, Y.T.; Huang, C.H.; Liu, F.M. Policies, land use, and water resource management in an arid oasis ecosystem. Environ. Manag. 2015, 55, 1036–1051. [Google Scholar] [CrossRef] [PubMed]
  59. Takanose, Y.; Ishida, S.; Kudo, N.; Kamitani, T. Effects of tillage and irrigation on the occurrence and establishment of native wetland plant species in fallow paddy fields. Paddy Water Environ. 2013, 11, 45–58. [Google Scholar] [CrossRef]
  60. Josa, R.; Jorba, M.; Vallejo, V.R. Opencast mine restoration in a mediterranean semi-arid environment: Failure of some common practices. Ecol. Eng. 2012, 42, 183–191. [Google Scholar] [CrossRef]
  61. Lopez, T.D.; Aide, T.M.; Thomlinson, J.R. Urban expansion and the loss of prime agricultural lands in puerto rico. Ambio 2001, 30, 49–54. [Google Scholar] [PubMed]
  62. Liu, X.H.; Wang, J.F.; Liu, M.L.; Meng, B. Spatial heterogeneity of the driving forces of cropland change in china. Sci. China Ser. D 2005, 48, 2231–2240. [Google Scholar] [CrossRef]
  63. Robichaud, W.G.; Sinclair, A.R.E.; Odarkor-Lanquaye, N.; Klinkenberg, B. Stable forest cover under increasing populations of swidden cultivators in central laos: The roles of intrinsic culture and extrinsic wildlife trade. Ecol. Soc. 2009, 14, 33. Available online: http://www.ecologyandsociety.org/vol14/iss1/art33/ (1 April 2015). [Google Scholar]
  64. Bahadur, K.C.K. Linking physical, economic and institutional constraints of land use change and forest conservation in the hills of nepal. For. Policy Econ. 2011, 13, 603–613. [Google Scholar] [CrossRef]
  65. Holdridge, L.R.; Grenke, W.C.; Hatheway, W.H.; Liang, T.; Tosi, J.A. Forest Environments in Tropical Life Zones: A Pilot Study; Pergamon Press: Oxford, UK, 1971. [Google Scholar]
  66. Villers-Ruiz, L.; Trejo-Vazquez, I. Climate change on mexican forests and natural protected areas. Glob. Environ. Chang. 1998, 8, 141–157. [Google Scholar] [CrossRef]

