Article

Forest Structure and Fine Root Biomass Influence Soil CO2 Efflux in Temperate Forests under Drought

1
Max-Planck-Institute for Biogeochemistry, Hans-Knöll-Str. 10, 07745 Jena, Germany
2
Department of Soil Science, Friedrich Schiller University Jena, Löbdergraben 32, 07743 Jena, Germany
3
German Centre for Integrative Biodiversity Research (iDiv) Halle-Jena-Leibzig, Deutscher Platz 5e, 04103 Leipzig, Germany
4
Faculty of Forest Sciences, University of Göttingen, Wilhelmsplatz 1, 37073 Göttingen, Germany
5
Environmental Informatics, Department of Geography, Phillips-Universität Marburg, Deutschhausstraße 12, 35037 Marburg, Germany
*
Author to whom correspondence should be addressed.
This manuscript is part of the Ph.D. thesis by the first author, available online at db-thueringen.de.
Forests 2023, 14(2), 411; https://doi.org/10.3390/f14020411
Submission received: 26 December 2022 / Revised: 3 February 2023 / Accepted: 14 February 2023 / Published: 17 February 2023
(This article belongs to the Section Forest Soil)

Abstract

:
Soil respiration is rarely studied at the landscape scale where forest and soil properties can be important drivers. We performed forest and soil inventories in 150 temperate forest sites in three German landscapes and measured in situ soil CO2 efflux with the soda-lime method in early summer 2018 and 2019. Both years were affected by naturally occurring summer droughts. Our aim was to investigate the impact of forest structural and compositional properties, soil properties and climate on soil CO2 efflux at the landscape. Forest properties explained a large portion of soil CO2 efflux variance (i.e., 14% in 2018 and 20% in 2019), which was comparable or larger than the portion explained by soil properties (i.e., 15% in 2018 and 6% in 2019), and much larger than that of climate. Using Structural Equation Modeling, we found that forest structural properties, i.e., tree density and basal area, were negatively linked to soil CO2 efflux, while forest composition, i.e., conifer share and tree species richness, was not important. Forest structure effects on soil CO2 efflux were either direct or mediated by fine root biomass under dry summer conditions. Summer soil CO2 efflux was positively linked to fine root biomass but not related to total soil organic carbon stocks or climate. Forest structural properties influence soil CO2 efflux under drought events and should be considered when predicting soil respiration at the landscape scale.

1. Introduction

Forests are important sinks for the greenhouse gas CO2, storing around 860 Pg C globally, with 40–70% being in soils [1]. A part of this carbon (C), however, returns each year back to the atmosphere via soil respiration. Soil respiration is one of the largest natural sources of CO2 [2] and understanding its drivers is important for predicting its response to future land management.
In central Europe, almost all forests are subject to management. Forest management includes the selection of tree species as well as the frequency and intensity of thinning and harvesting events and, thus, it shapes forest properties at the stand level. Forest properties include the structural properties of a forest stand, like tree density, basal area and mean diameter at breast height (DBH) and the forest composition, which is expressed by tree species’ identity and richness as well as their functional composition, e.g., conifer share. Forest properties control multiple ecosystem conditions and functions, such as microclimate and litter production and quality [3,4,5,6]. These can influence soil respiration [7] in a direct or indirect way but are difficult to be addressed in forest experiments as these cannot cover all management types and stages found in a landscape. Therefore, soil CO2 efflux measurements at the landscape scale are required to understand the effects of forest properties on soil respiration.
At present, most studies relating forest properties to soil respiration mainly focus on single or dual forest properties. Several studies investigate soil respiration across age gradients, and forest structural properties, like stand basal area and DBH, are commonly used to explain soil respiration [8,9]. Similarly, the effects of forest composition on soil respiration are usually studied as single-species effects or, less frequently, along functional gradients, e.g., from pure deciduous to pure evergreen forests [10,11,12]. Tree species’ diversity, however, is rarely included in soil respiration studies [13]. Obtaining forest inventory data from a high number of forest sites is associated with a large amount of effort [14], but it provides the opportunity to describe the complex effects of forest management on soil respiration through multiple forest properties, both structural and compositional.
Soil respiration has two components; an autotrophic component that is respired by roots, mycorrhiza and the rhizospheric microorganism, and a heterotrophic component respired by soil organisms [15,16]. Autotrophic respiration is mainly determined by root biomass and activity. Similarly, heterotrophic respiration is determined by soil organism biomass, composition and activity, which are, in turn, affected by the quantity, quality and availability of soil organic matter, as well as by soil properties (like texture and pH) and climate (i.e., soil temperature and moisture). Forest properties can differentially affect the two components of soil respiration through their impact on root biomass, soil organic matter and soil environmental conditions.
In forests, in situ soil respiration integrates components derived from the organic layer and the underlying mineral soil. The C stored in these two pools is not equally protected, and, frequently, studies compare their C losses through respiration [17,18]. Under field conditions, this can be done by comparing total soil respiration fluxes with fluxes measured after removing the organic layer.
Temporal monitoring of soil respiration while maintaining a high spatial coverage at the regional scale requires a large amount of effort. For this reason, most field studies on the temporal variability of soil respiration are conducted only on a small number of sites. However, forest and physicochemical soil properties, like texture, pH and OC stocks, change at slow rates that can be effectively considered constant over short periods (months to years), if no management activities (like harvesting and soil amendments) take place over the examined period. In addition, the spatial patterns of soil respiration remain relatively stable over the growing season [19]. Thus, single measurements of in situ soil respiration taken in parallel across a large number of forest sites in a landscape can reduce the aforementioned constraints and allow the investigation of the spatial variation of soil respiration during the growing season.
We obtained single soil CO2 efflux measurements of long exposure time (i.e., 5-day-long) from 150 forest sites in the Biodiversity Exploratories project, which cover a broad range of forest properties. Four replicated soil CO2 efflux measurements were taken at each forest site in summer 2018 and 2019 with the soda-lime method. To determine the contribution of organic layer to the total soil respiration, we measured the CO2 efflux from the mineral soil after removing the organic layer at a subset of 29 forest sites. We hypothesized that:
  • Since soil respiration consists of an autotrophic and a heterotrophic component, both soil organic carbon (OC) and root biomass are positively associated with soil CO2 efflux.
  • Both forest and soil properties are important drivers of soil CO2 efflux at the landscape scale.
  • Forest structure and composition influence soil CO2 efflux through their impact on soil OC, fine root biomass and (soil) climate.

2. Methods

2.1. Study Region

This study was conducted in the framework of the Biodiversity Exploratories project, which includes three study regions in Germany, the Schwäbische-Alb (ALB), the Hainich-Dün (HAI) and the Schorfheide-Chorin (SCH). The study regions differ in their geology, climate and topology (Table 1) and, thus, have different soil types. ALB soils developed mainly on Jurassic limestone and were clay-rich Leptosols or Cambisol [20]. In HAI, soils had a loamy or clayey texture due to the dominant geological substrate of loess over limestone, and the main soil types were Luvisols and Stagnosols. Soils in SCH had a sandy texture as the geological substrate was glacial until covered by glacio-fluvial or aeolian sand and were classified as Arenosols or Cambisols.

2.2. Forests and Forest Properties

We established 50 forest sites in each of the three study regions, resulting in a total of 150 forest sites. Each forest site covered an area of 100 m × 100 m within larger forests. The forests were dominated by European beech (Fagus sylvatica), oak (Quercus robur and Quercus petraea), Norway spruce (Picea abies), or Scots pine (Pinus sylvestris). Basic forest and soil properties for each of the three study regions are listed in Table 2. The wide regional range of stand tree densities, basal area and conifer share indicates the breadth of forest types and developmental stages included in our study.
The forest inventory of the 150 forest sites was conducted between 2014–2016 and included trees with a DBH ≥ 7 cm [14]. Forest structure was described by the basal area (m2 ha−1), the mean DBH (cm) and the stand density (number of trees per ha). Stand age data were obtained from forest administration records or, in the case of HAI unmanaged forests, estimated from the diameter of the largest 30 trees per ha. Forest composition was expressed by conifer share (%) calculated as the cumulative basal area of conifer trees over the total basal area. Tree species’ richness is the number of different tree species found in a forest stand.

2.3. Soil Properties

Fourteen soil samples of the upper 10 cm of the mineral soil were collected along two intersecting 40 m transects (Figure S1) in each of the 150 sites in May 2017. There was no change in forest management within these transects. The upper 10 cm of the mineral soil reflect approximately the thickness of the A horizon [22], however, samples could contain a bit of B or E horizon. Undisturbed samples were collected with a split-tube sampler (Eijkelkamp, Giesbeek, The Netherlands) with a diameter of 48 mm. They were used to prepare one composite soil sample per forest site. The forest floor at each sampling point was sampled beforehand within a 15 cm × 15 cm metal frame. All soil samples were air-dried and sieved to <2 mm, and a portion was ground for elemental analysis. Total carbon (TC) and total nitrogen (TN) were determined by dry combustion at 1100 °C with an elemental analyzer VarioMax (Elementar, Hanau, Germany). Soil inorganic C concentration was determined with the same analyzer after removing OC by exposing 250 mg of soil to 450 °C for 16 h. Soil OC concentration was calculated as the difference between total and inorganic C concentration. OC stocks were calculated for (i) the organic layer and ii) the upper 10 cm of the mineral soil, by considering the dry weight of the sample and the area sampled. Hereafter, we refer to the sum of the organic stocks from the organic layer and the 10 cm of mineral soil as total soil OC stocks. The soil texture and fine root (<2 mm) biomass were determined previously for the same sites in 2011 [23]. For soil texture determination, a combined sieving and sedimentation method was used [24], and the fine root biomass was determined by weighing the isolated, cleaned and oven-dried roots (at 40 °C for two days).
To explain forest soil respiration at the regional scale, we selected the following physico-chemical soil properties: total soil OC stock (for total in situ soil respiration) or mineral soil OC stocks (for mineral in situ soil respiration), carbon to nitrogen (C:N) ratio, silt content and pH and fine root biomass. Clay content is typically assumed to be important for C stabilization in soils [25] but, in our forest sites, it was not an important predictor of soil OC stocks after accounting for the effects of study regions [22]. Possibly, this is because clay content, and generally soil texture variations, were greater between the study regions than within them, so that variance explained by study regions could be partly due to differences in particle size distribution. We decided to use silt content in the analysis and not clay for two reasons: first, to avoid collinearities as clay and silt content were strongly correlated in our study (R2 = 0.96, with study region effects included), and second, because silt content is more relevant for available water-holding capacity than clay [26] (Figure S2). Thus, it is a good indicator for available soil water during the dry soil conditions (such as those of our study).

2.4. Soil Temperature and Volumetric Water Content

Soil temperature and volumetric water content were recorded in 30-min intervals in each of the 150 forest sites using the ADL-MX Data Logger System (Meier-NT GmbH, Zwönitz, Germany) from 2008 to 2019. Soil temperature (°C) was monitored at a 5 cm depth below the surface of the mineral soil with the MNT FExtension. The Delta-T ML2X Soil Moisture Probe (Delta-T Ltd., Cambridge, England) was installed at a 10 cm depth below the surface of the mineral soil and the voltage measurement was transformed to volumetric water content (%) using a generalized equation applicable for mineral soils. Soil temperature and water content sensors were installed in a fenced area (20 m × 20 m) located within each forest site, but not falling within the soil sampling area (Figure S1). Sub-hourly soil climate data were averaged for the period of the soil respiration measurements for each forest site and year.

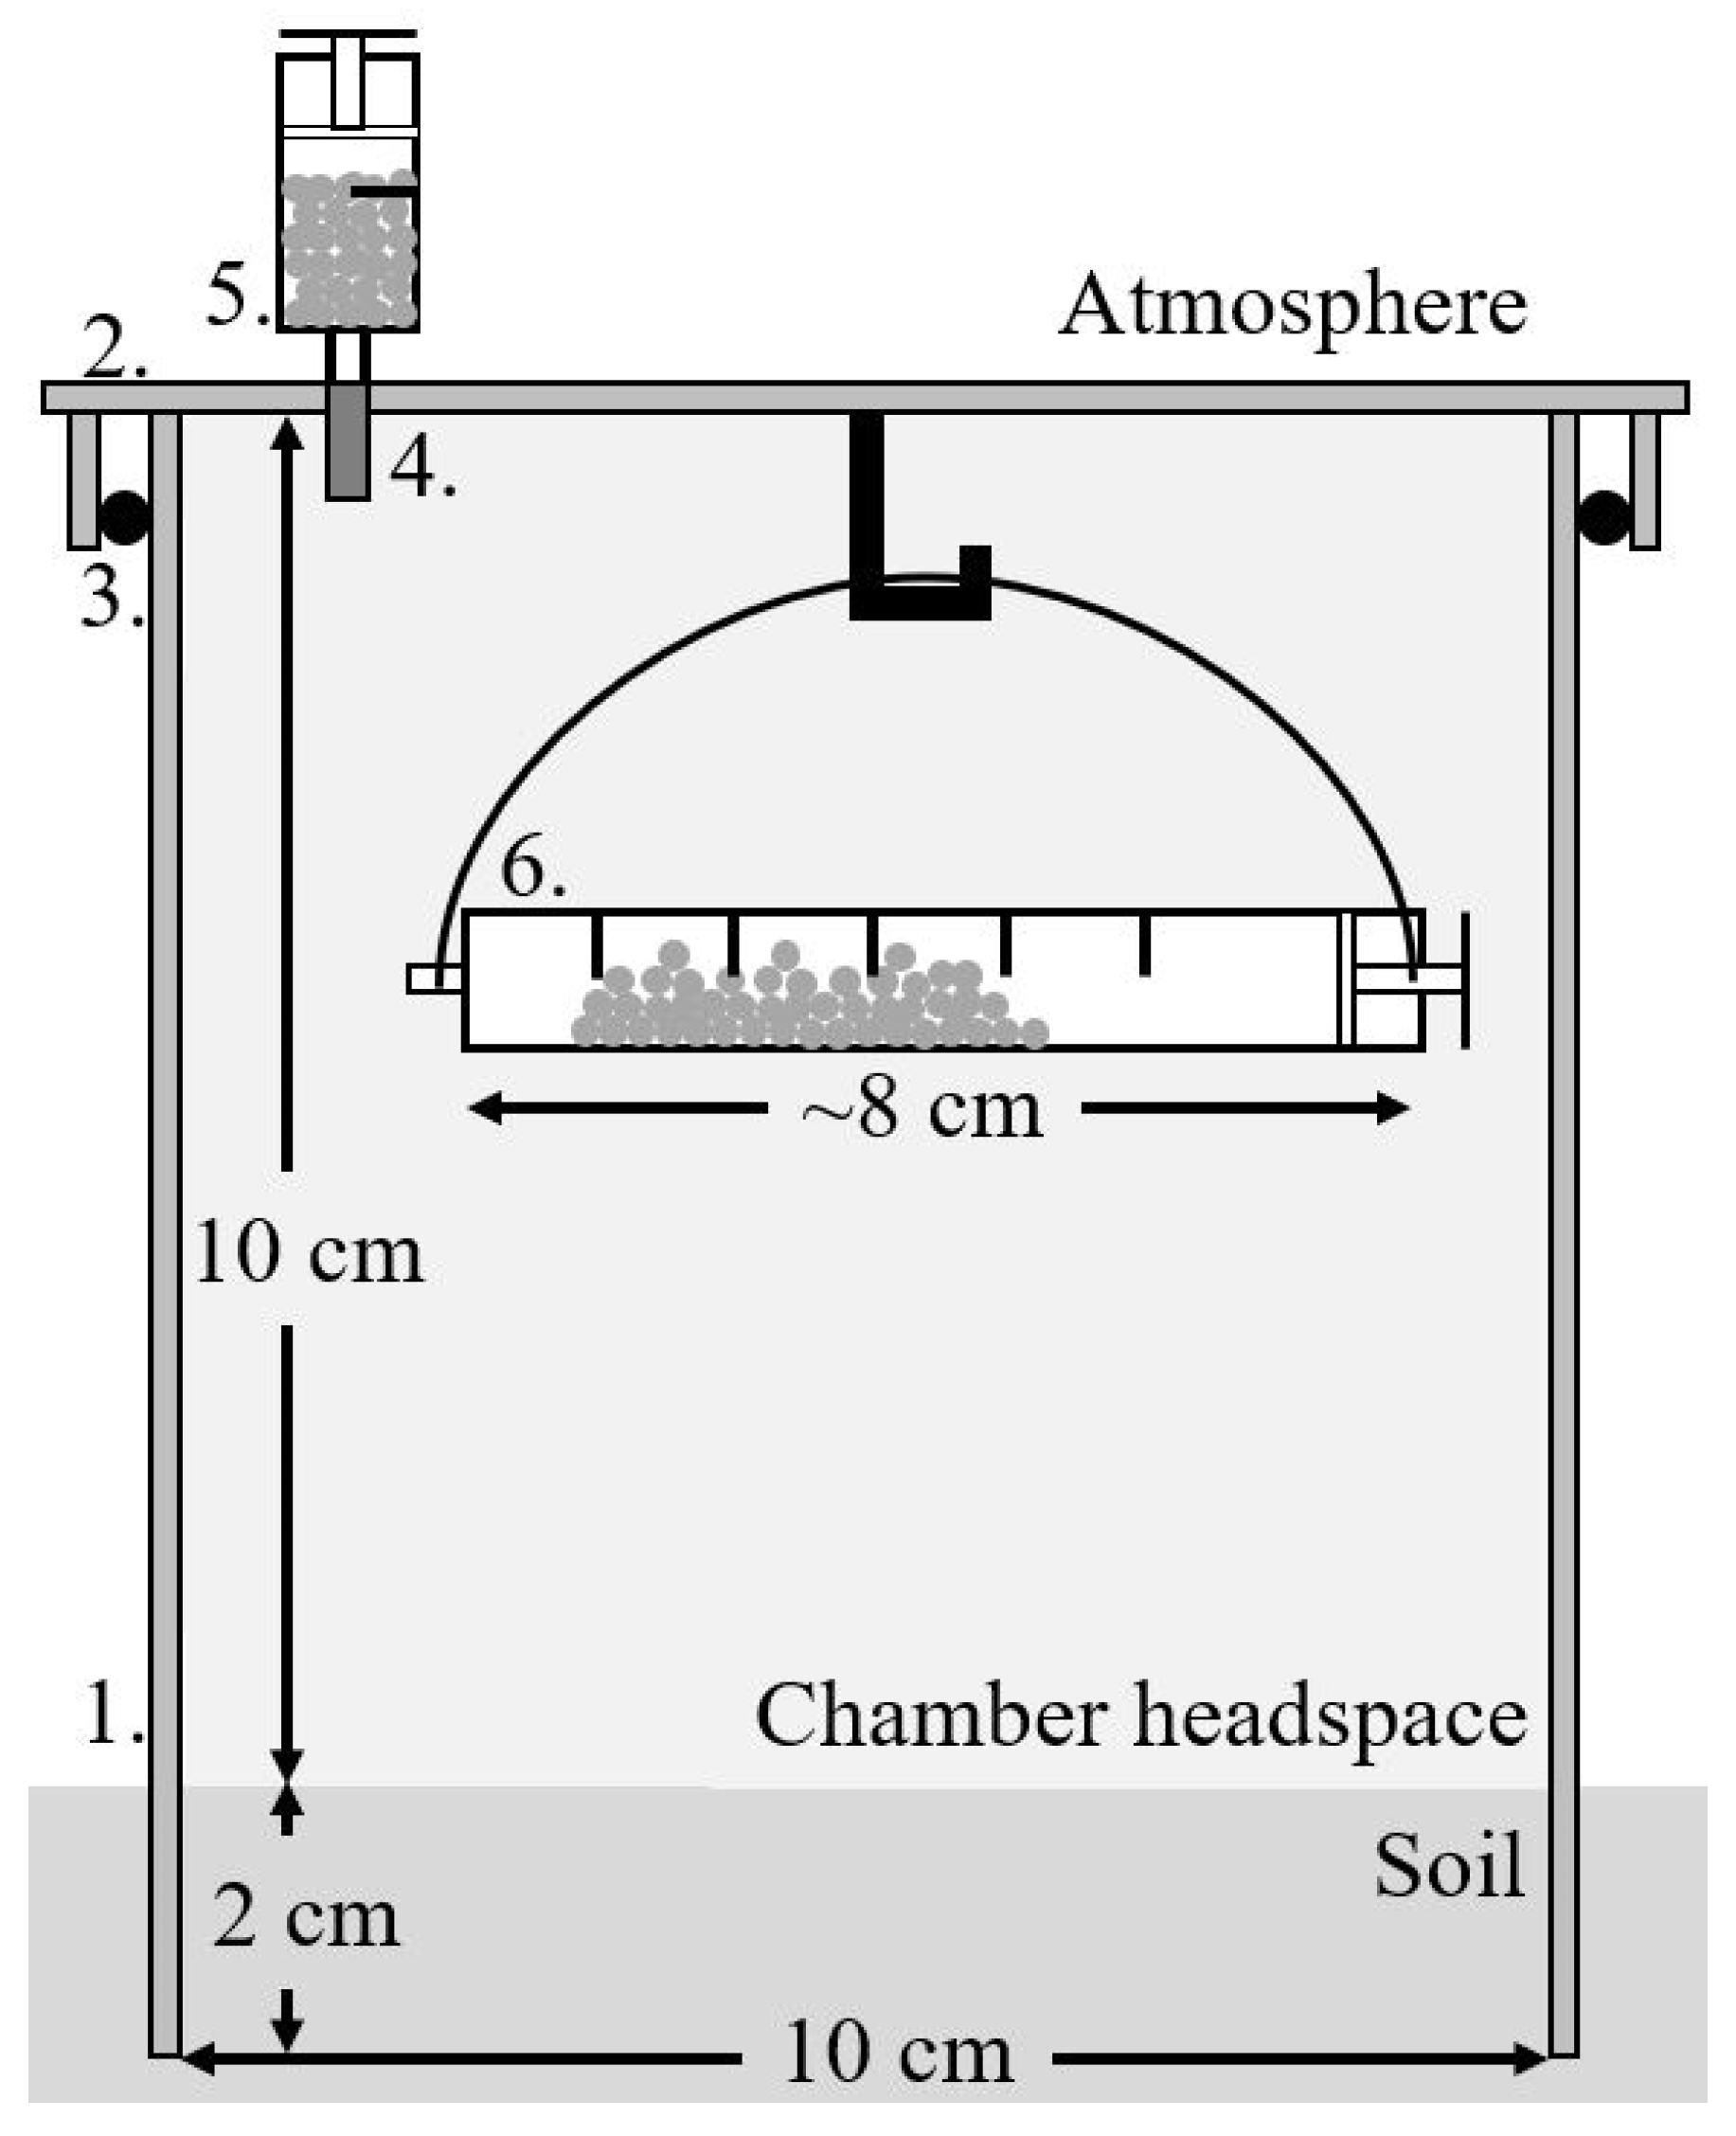
2.5. In Situ Soil CO2 Efflux

In this study, the soda-lime absorption method was used with an open and static chamber to determine soil CO2 efflux. Soda-lime, i.e., mainly Ca(OH)2 and NaOH, was used as the absorption material [27]. The chemical reactions involved in the absorption of CO2 are [28]:
2 NaOH + CO 2 Na 2 CO 3 + H 2 O
Ca OH 2 + CO 2 CaCO 3 + H 2 O
The soda-lime method has been tested against dynamic systems with Infrared Gas Analyzers and is suitable for applications with large numbers of measurements [27,29]. Moreover, the soda-lime method provides a measure of the cumulative soil CO2 efflux over periods of hours [27] to weeks [30]. Long installation periods integrate the diurnal and climatic variability in the measurements [28] and allow the investigation of variables that emphasize other causes of variability, including forest and soil properties. This is an advantage of the soda-lime method compared to (single measurements) with IRGA systems that are influenced to a greater extent by short-term climatic and diurnal conditions.
The chamber design was a modification of previous work from Bierbaß et al., Näthe et al. and Apostolakis et al. [31,32,33]. The chamber consisted of a PVC ring with an internal diameter of 10.0 cm and a height of 12.0 cm; a PVC lid and an O-ring ensured the airtightness of the chamber (Figure 1). Inside the chamber, soda-lime was contained in a 50 mL syringe with 64 1-mm-holes held on the lid. A plastic tube passing through a hole on the lid allowed pressure equilibrium between the headspace of the chamber and the ambient air. The outer ending of the tube was connected to a syringe containing 10 g of soda-lime to filter incoming ambient air CO2. To correct for atmospheric CO2 absorbed during the laboratory and field work, bottom-sealed chambers were used as controls.
Non-hygroscopic soda-lime with a diameter range of 2.4–5.0 mm and a saturation point of about 28% was used (Fisher Scientific GmbH, Schwerte, Germany). Soda-lime reacts with CO2 to form CaCO3. The mass of the absorbed CO2 can be determined by the difference of soda-lime mass before and after the field measurement after drying at 105 °C for 48 h. Dry soda-lime mass was weighed with an accuracy of 0.1 mg before and after the exposure to soil CO2 efflux. A soda-lime mass of about 4 g d−1 was used and the exposure time was 5 to 7 days. Each 50 mL syringe containing soda-lime was sealed in a sampling bag, while syringes of each forest site were stored in CO2-free sampling bags until field installation. The soil efflux is calculated by the equation [27]
R s gCO 2 C   m 2   d 1 = WG sample   gCO 2 WG blank gCO 2 Chamber   area   m 2 × 24 h d T   h × 12 gC mol 44 gCO 2 mol × 1.69
where WG is the weight gain [g], chamber basal area in [m2], T is the exposure time in [h] and the factor 1.69 compensates for the H2O formed during CO2 sorption and lost during drying [28].
Soil CO2 efflux was measured from June to July in 2018 and 2019. Field work started in HAI followed by the SCH and ALB and lasted two weeks in each study regions. From the 150 forest sites of the Biodiversity Exploratories project we measured soil CO2 efflux in 149 sites due to access restrictions in one forest site in HAI. Considering an exposure time of 5 to 7 days, the measurements coincided in each region for more than 24 h. In each forest site, we installed four chambers in the 2.5 m projections of the soil sampling transects (cardinal orientation forming a 40 m length cross; Figure S1) together with one control chamber. Vegetation-free spots were selected as installation areas. PVC rings were installed to a depth of 1 to 2 cm into the soil to restrict severing roots. PVC rings and soda-lime were installed simultaneously. Soda-lime was rewetted before the installation to compensate for the initial moisture content of about 18%, since CO2 needs to be hydrated before reacting with the soda-lime. In a subset of 29 out of the 149 forest sites (nine in ALB and SCH and 11 in HAI), we measured the mineral soil respiration after removing the organic layer. The installation of the chambers for the mineral soil respiration happened right after the removal of the organic layer to ensure similar environmental conditions and comparability between the two treatments (total and mineral soil respiration). Total and mineral soil respiration fluxes were measured at the same time. Over the two years, we conducted 1200 total and 216 mineral soil CO2 efflux measurements and used 300 controls.
The soda-lime method is associated with some disadvantages. First, long installation periods of closed chambers, though common in the literature, can influence the microclimate underneath [27], i.e., heat up when exposed to sun or dry down as rain is excluded. In contrast, IRGA systems close only for a few seconds or minutes. This effect should, however, be small in forests with closed canopies and was one of the reasons why the chambers were only in the field for a few days to prevent a significant change in soil moisture relative to surrounding soil. Second, if the soda-lime mass is not sufficient, it can become saturated during the exposure to the soil CO2 efflux. Here, the soda-lime mass gain did not exceed 9.0% of the initial dry mass (given a saturation point of about 28%) in any of our measurements (Table S1), which is within the proposed limits [34].

2.6. Data Analysis

Using the analysis of variance (ANOVA) models and Tukey’s Honest Significant Difference (HSD) test, we tested for differences in in situ soil CO2 efflux, soil temperature, soil water content and forest and soil properties (listed in Table 2) among the study regions and, when applicable, years. Differences were considered significant at p-value < 0.05.
We performed a variance partitioning to find the relative importance of (i) climate (i.e., soil temperature and water content), (ii) forest properties (i.e., age, tree density, basal area, mean DBH, conifer share, tree species richness, fine root biomass) and (iii) soil properties (organic layer and mineral soil OC stocks, soil C:N ratio, pH and silt content) on in situ soil CO2 efflux, separately for the two study years. Then, we ran a (backward elimination) stepwise analysis to evaluate the importance of individual variables on model performance based on the Akaike information criterion. We examined the significance of the variables selected from stepwise analysis using the analysis of covariance (ANCOVA). ANCOVA models were performed assuming a type II sum of squares, which is not influenced by the order in which the explanatory variables are introduced in the model [35]. Diagnostic plots were applied to evaluate the assumptions of linearity, normality and homoscedasticity in the residuals, and to check for influential values. We applied logarithmic transformation on soil CO2 efflux and square root transformation on conifer share to tackle heteroscedasticity issues. In the set of independent variables for the ANCOVA models, we used the variance inflation ratio to test for collinearities, and values ≤3.0 were considered acceptable.
We used Structural Equation Modeling (SEM) to understand how forest structure (i.e., tree density and basal area) and composition (i.e., conifer share and tree species richness) affect soil CO2 efflux not only directly, but also indirectly by influencing fine root biomass, soil OC stocks and soil water content (Figure S3). Using one-way ANOVA, we removed the effects of study regions from each variable, and we used their residuals in the SEMs. Structures with p-values > 0.05 and root mean square errors of approximation (RMSEA) <0.05 were considered acceptable. The high number of observations (i.e., 142 observations from 150 forest sites due to missing values) compared to estimated parameters provided stability against multivariate non-normality issues. We used bootstrapping (with 1000 bootstrap draws) for additional stability. SEMs represent associations between variables, and not necessarily causal relationships. However, we interpret these associations as evidence of management effects and, for simplicity, we often use terms such as ‘effects’ and ‘drivers’ hereafter [36].
Statistical analysis was performed with the R software (Version 3.6.2, Vienna, Austria) [37]. ANOVA and ANCOVA models were performed with the lm function. Tukey’s HSD test was performed with the TukeyHSD of the stats package. For the backward elimination stepwise analysis, the step function from the stats package was used. Variance inflation ratio was calculated with the vif function of the faraway package [38]. Variance partitioning was performed with the calc.relimp function using the lmg method of the relaimpo package [39]. Structural Equation Modeling was performed with the sem function from the lavaan package [40].

3. Results

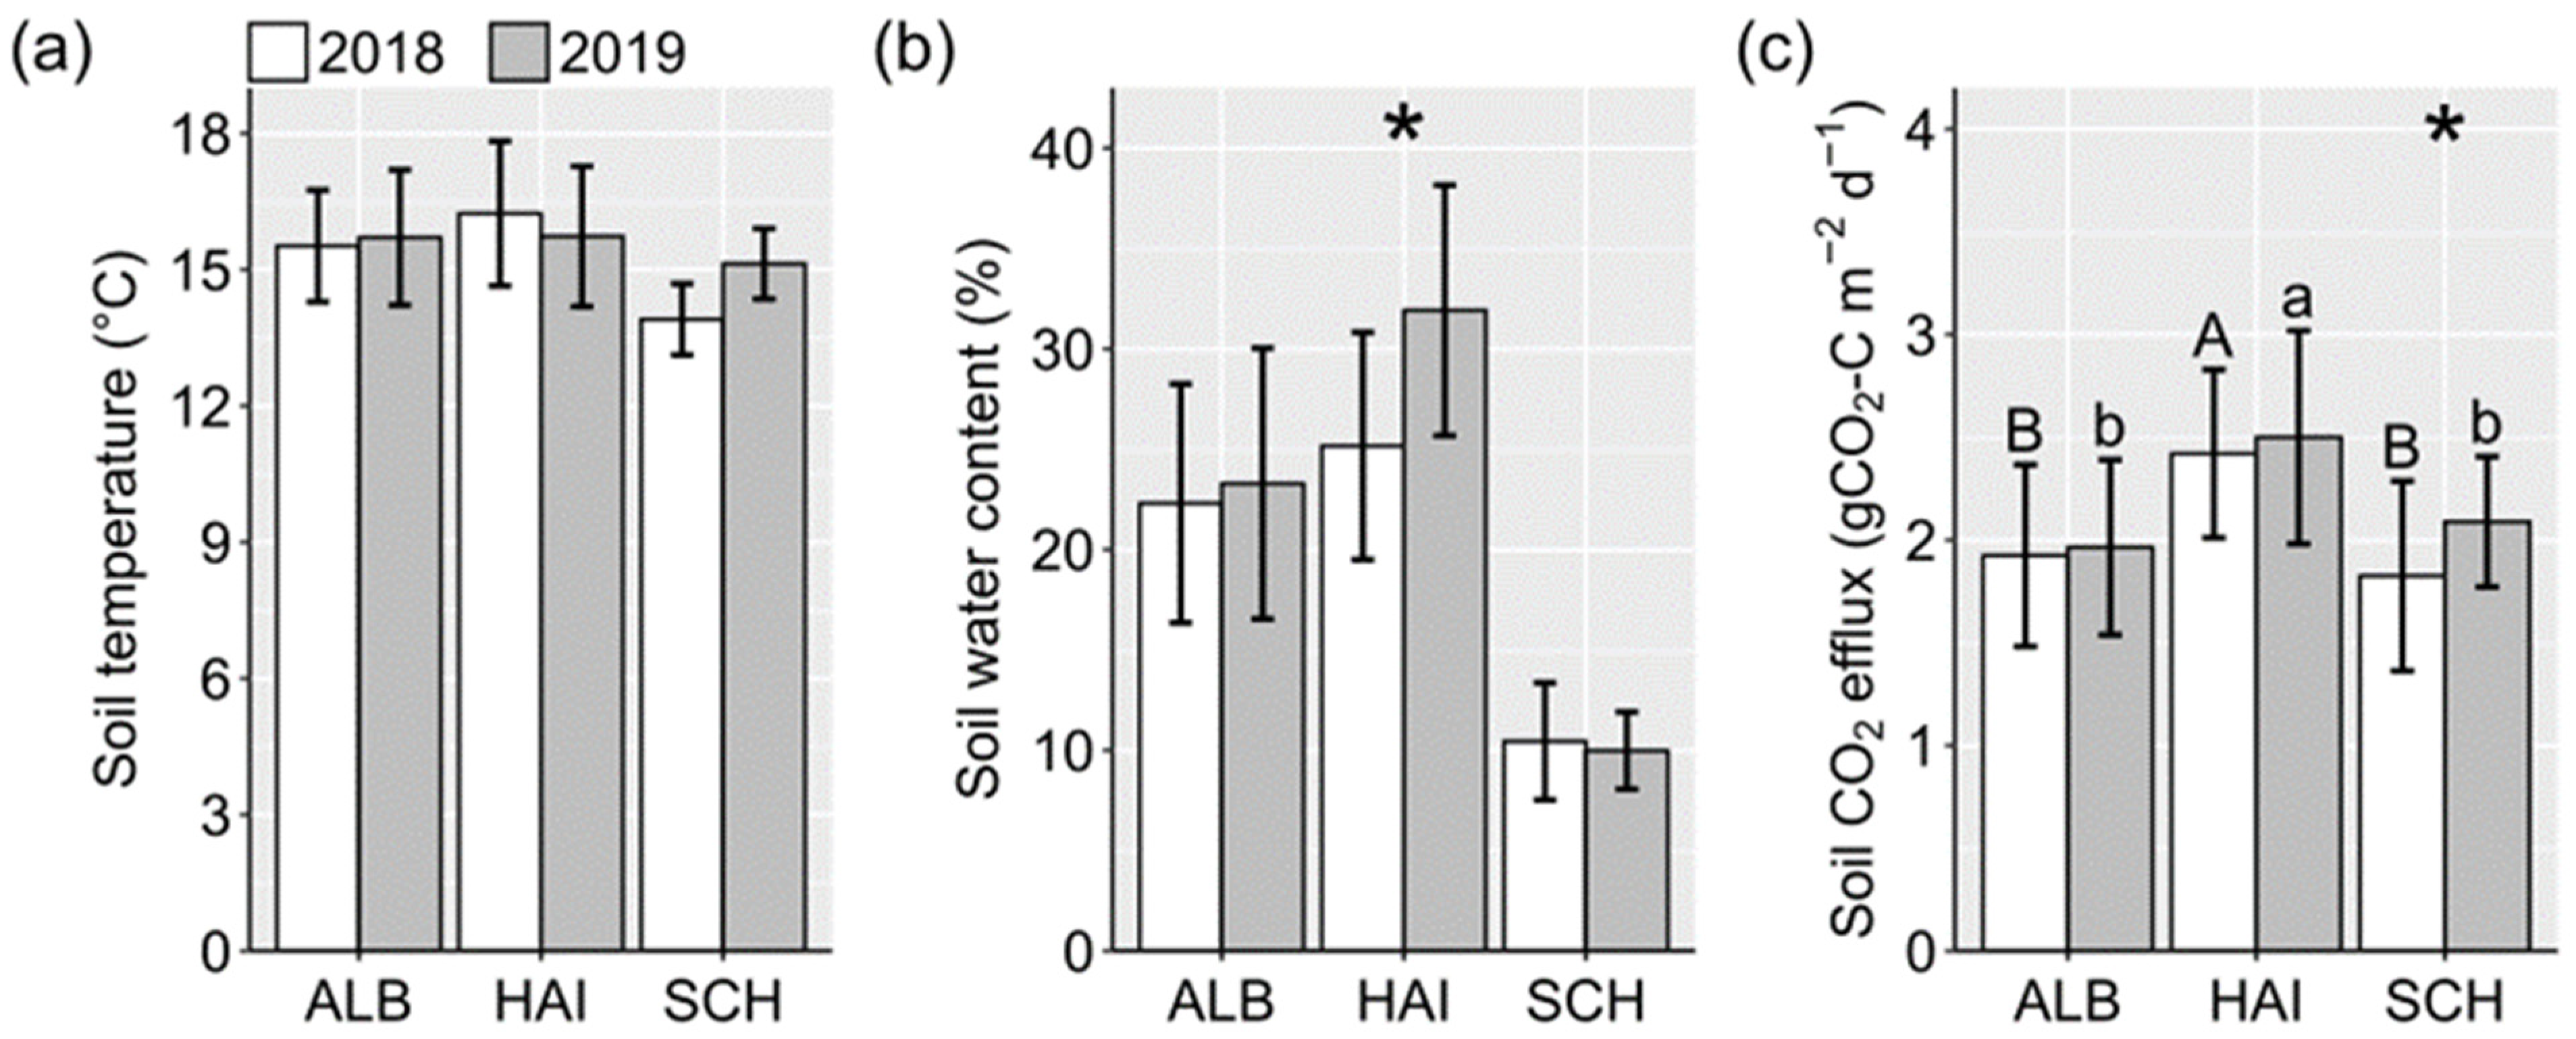
3.1. Forest Soil Temperature and Water Content

During field campaigns, the soil temperature ranged from 13.9 to 16.2 °C across the three study regions and two sampling years and increased in the order SCH<ALB<HAI both in 2018 and in 2019 (Figure 2a). The soil temperature did not differ significantly between the years in any of the study regions. The soil volumetric water content ranged from 10.4 to 25.2% in 2018 and from 10.0 to 31.9% in 2019 increasing in the order SCH<ALB<HAI (Figure 2b). Between study years, differences were observed only in HAI, where the soil water content in 2018 was lower than in 2019. Low soil water content in SCH is probably explained by the sandy soils found in the region (Table 2) and their lower water-holding capacity. In ALB, despite the high mean annual precipitation (Table 1) and the high silt and clay content (Table 2), the soil water content was between that of SCH and HAI, showing that sampling in ALB took place during very dry conditions. Higher soil temperature and lower water content during the summer months of 2018 and 2019 compared to the 10-year-average indicated natural droughts in central Europe during the field campaigns (Table S2 and Figure S4). Only in HAI in June 2019, the soil water content was not below the long-term average.

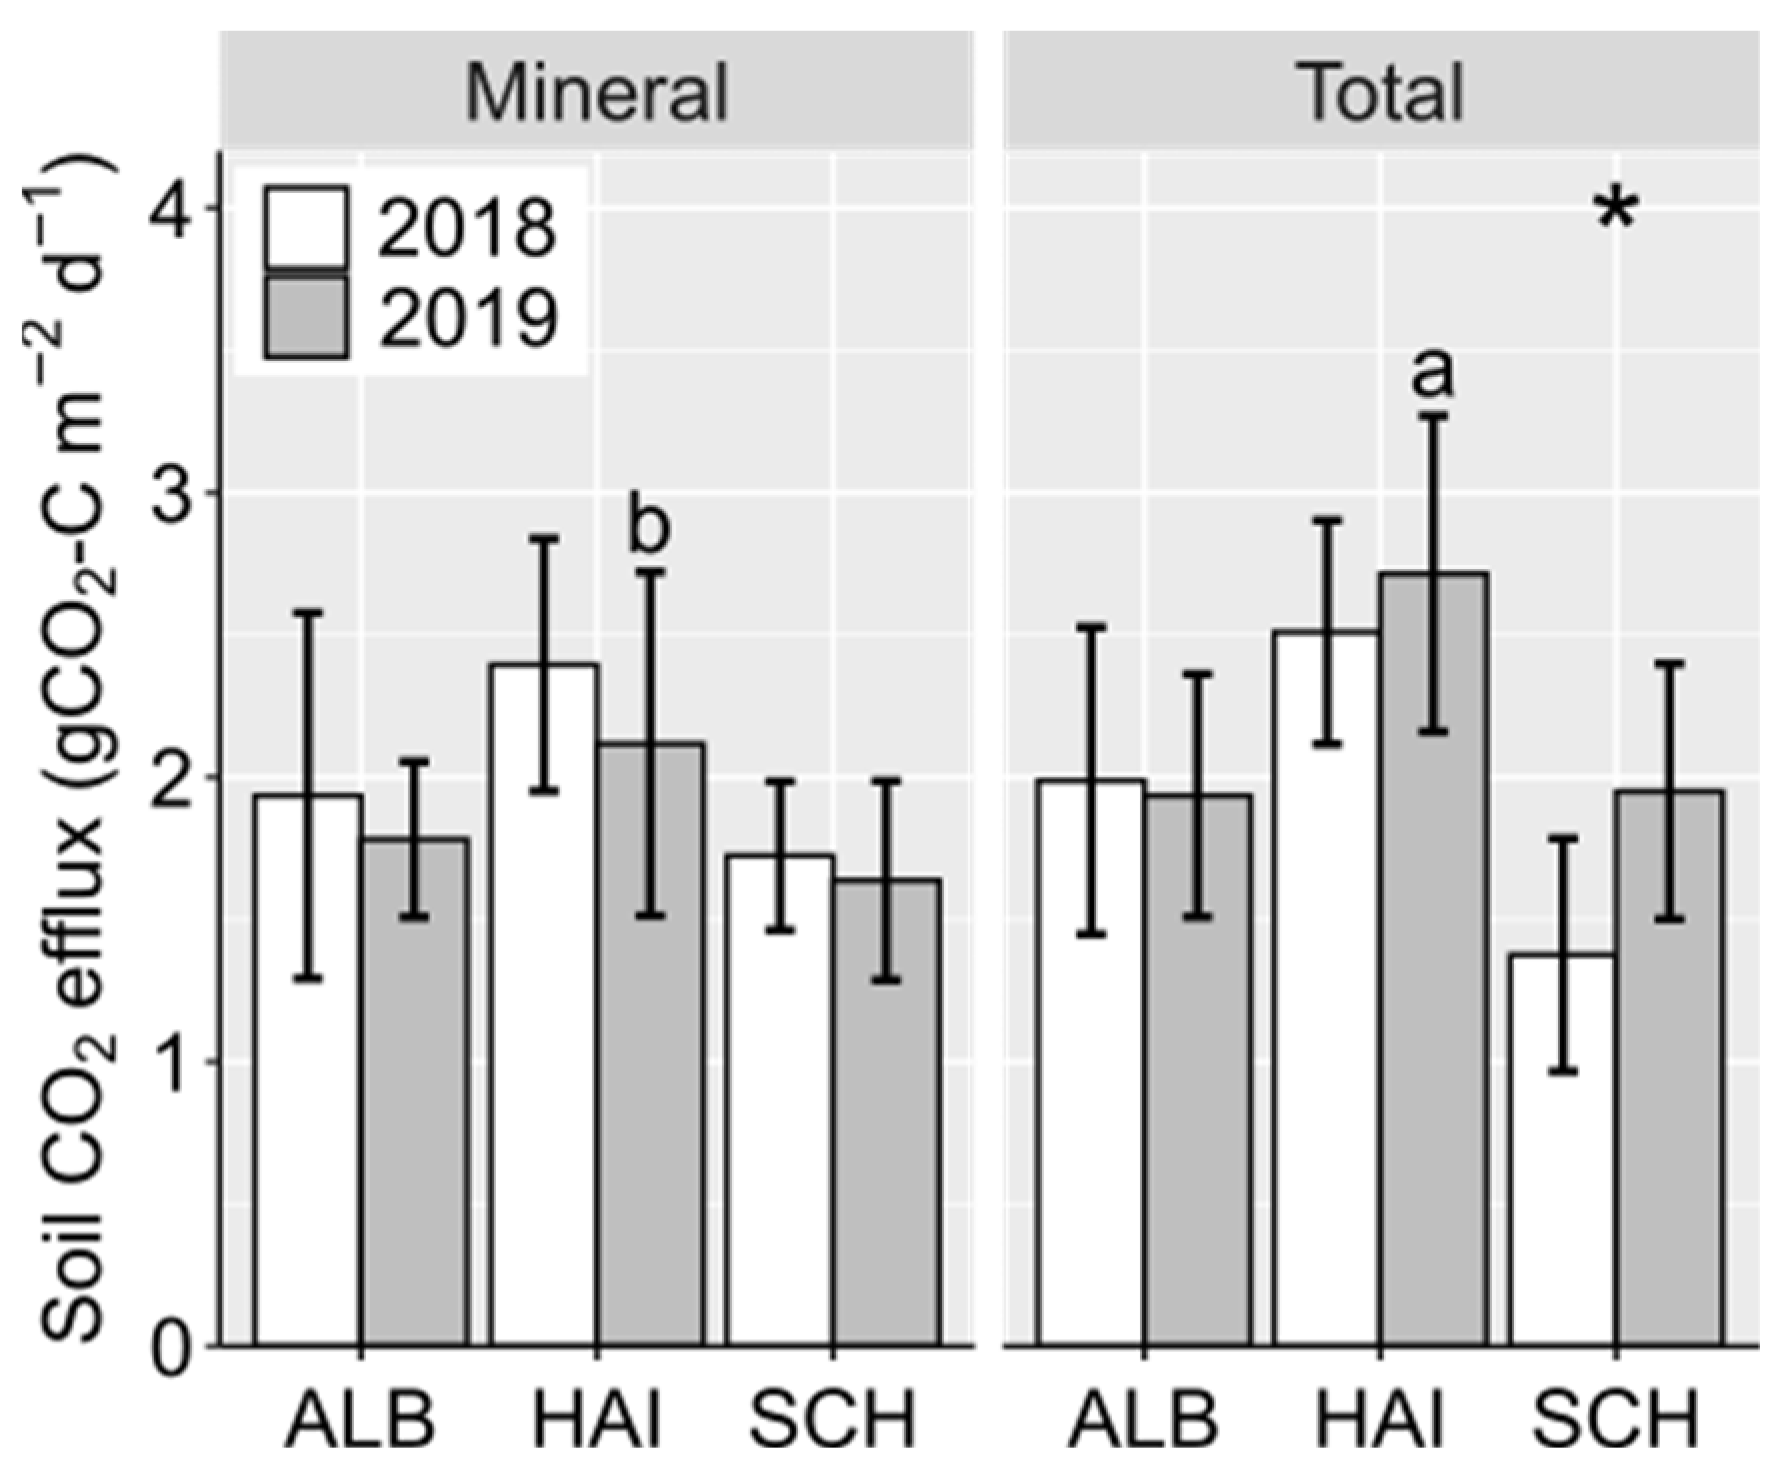
3.2. Forest Soil CO2 Efflux

In situ soil CO2 efflux ranged from 0.9 to 3.3 g CO2-C m−2 d−1 in 2018 and from 1.0 to 3.9 g CO2-C m−2 d−1 in 2019. HAI had the highest fluxes in both years (Figure 2c), while SCH and ALB had the lowest fluxes in 2018 and 2019, respectively. Interestingly, HAI was also the region with the highest soil water availability in both years (Figure S5), which possibly influenced soil CO2 efflux. Comparing the two years, soil CO2 efflux differed only in SCH and it was higher in 2019. Soil CO2 efflux significantly correlated with soil water content across study regions both in 2018 and 2019 (p < 0.010, Figure S6).
In a subset of 29 forest sites (out of the 150 forest sites), in-situ mineral soil CO2 efflux ranged from 1.4 to 3.5 g CO2-C m−2 d−1 in 2018 and from 1.1 to 3.8 g CO2-C m−2 d−1 in 2019, and there were no differences between the two years in any study region (Figure 3, left). In contrast, for these 29 forest sites, in-situ total soil CO2 efflux in SCH was higher in 2019 than 2018 (Figure 3, right), which verified the differences observed in the full dataset (149 forest sites, Figure 2c). Comparing total and mineral soil CO2 efflux of the same subset of sites (Figure 3), the total soil CO2 efflux in HAI in 2019 was higher than the respective mineral soil CO2 efflux, while no differences were observed for the other regions in 2018 and in 2019.

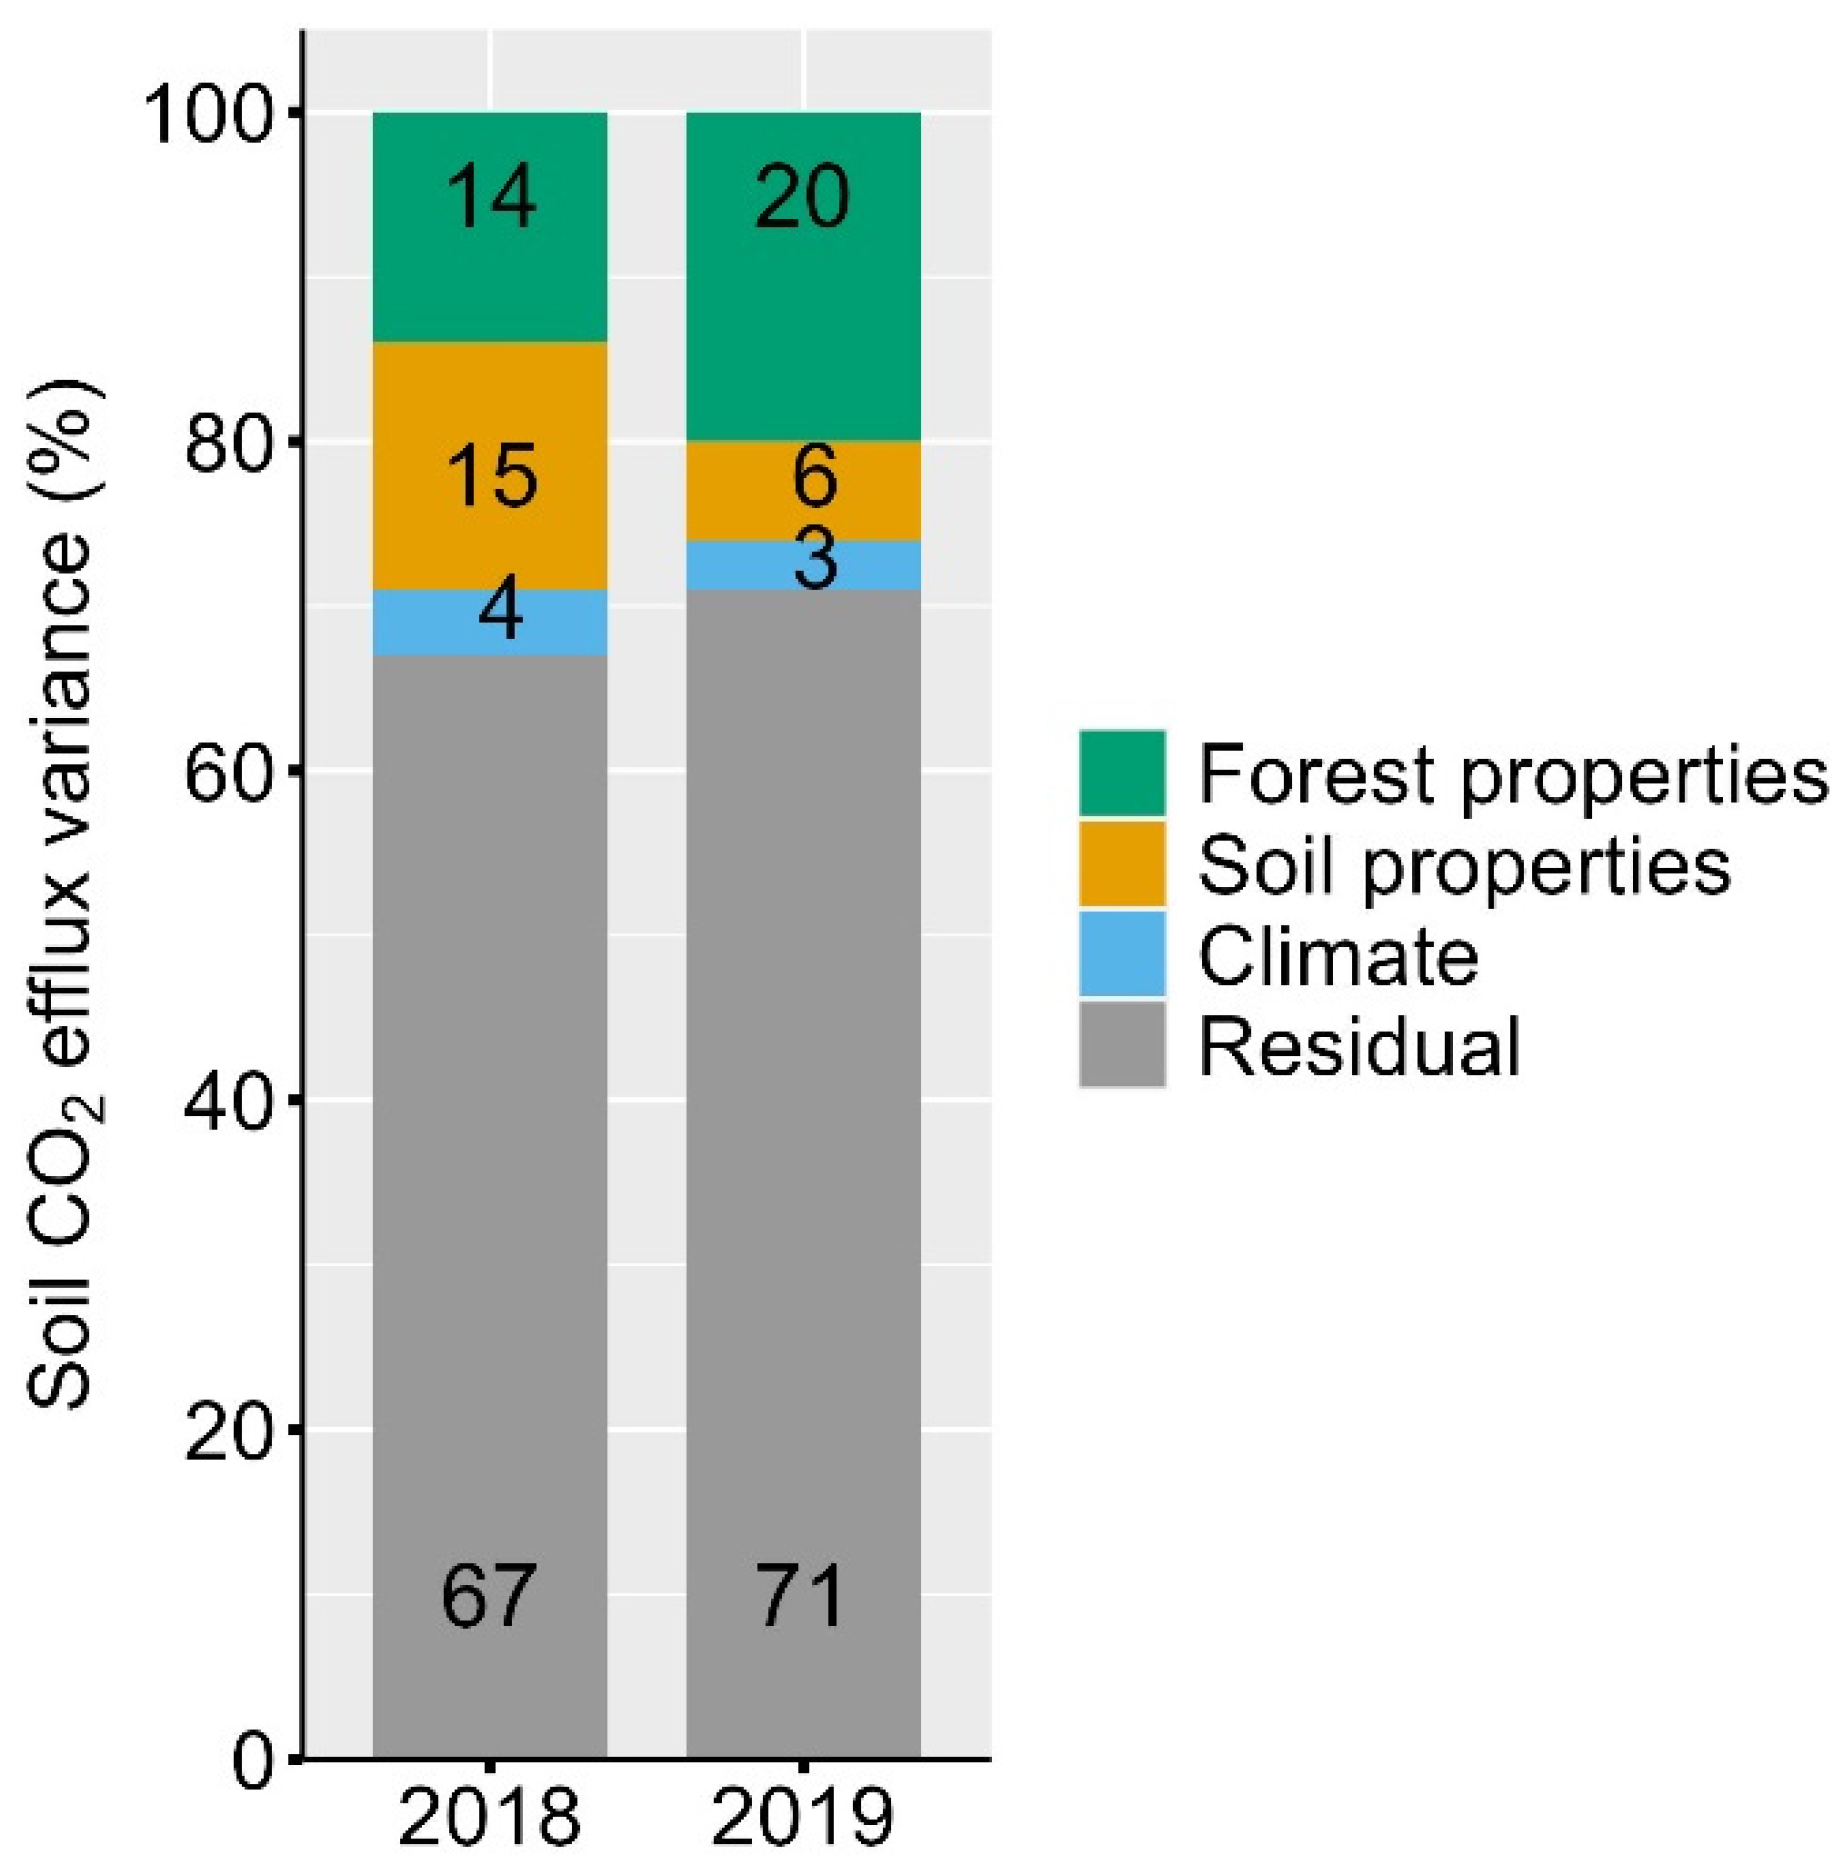
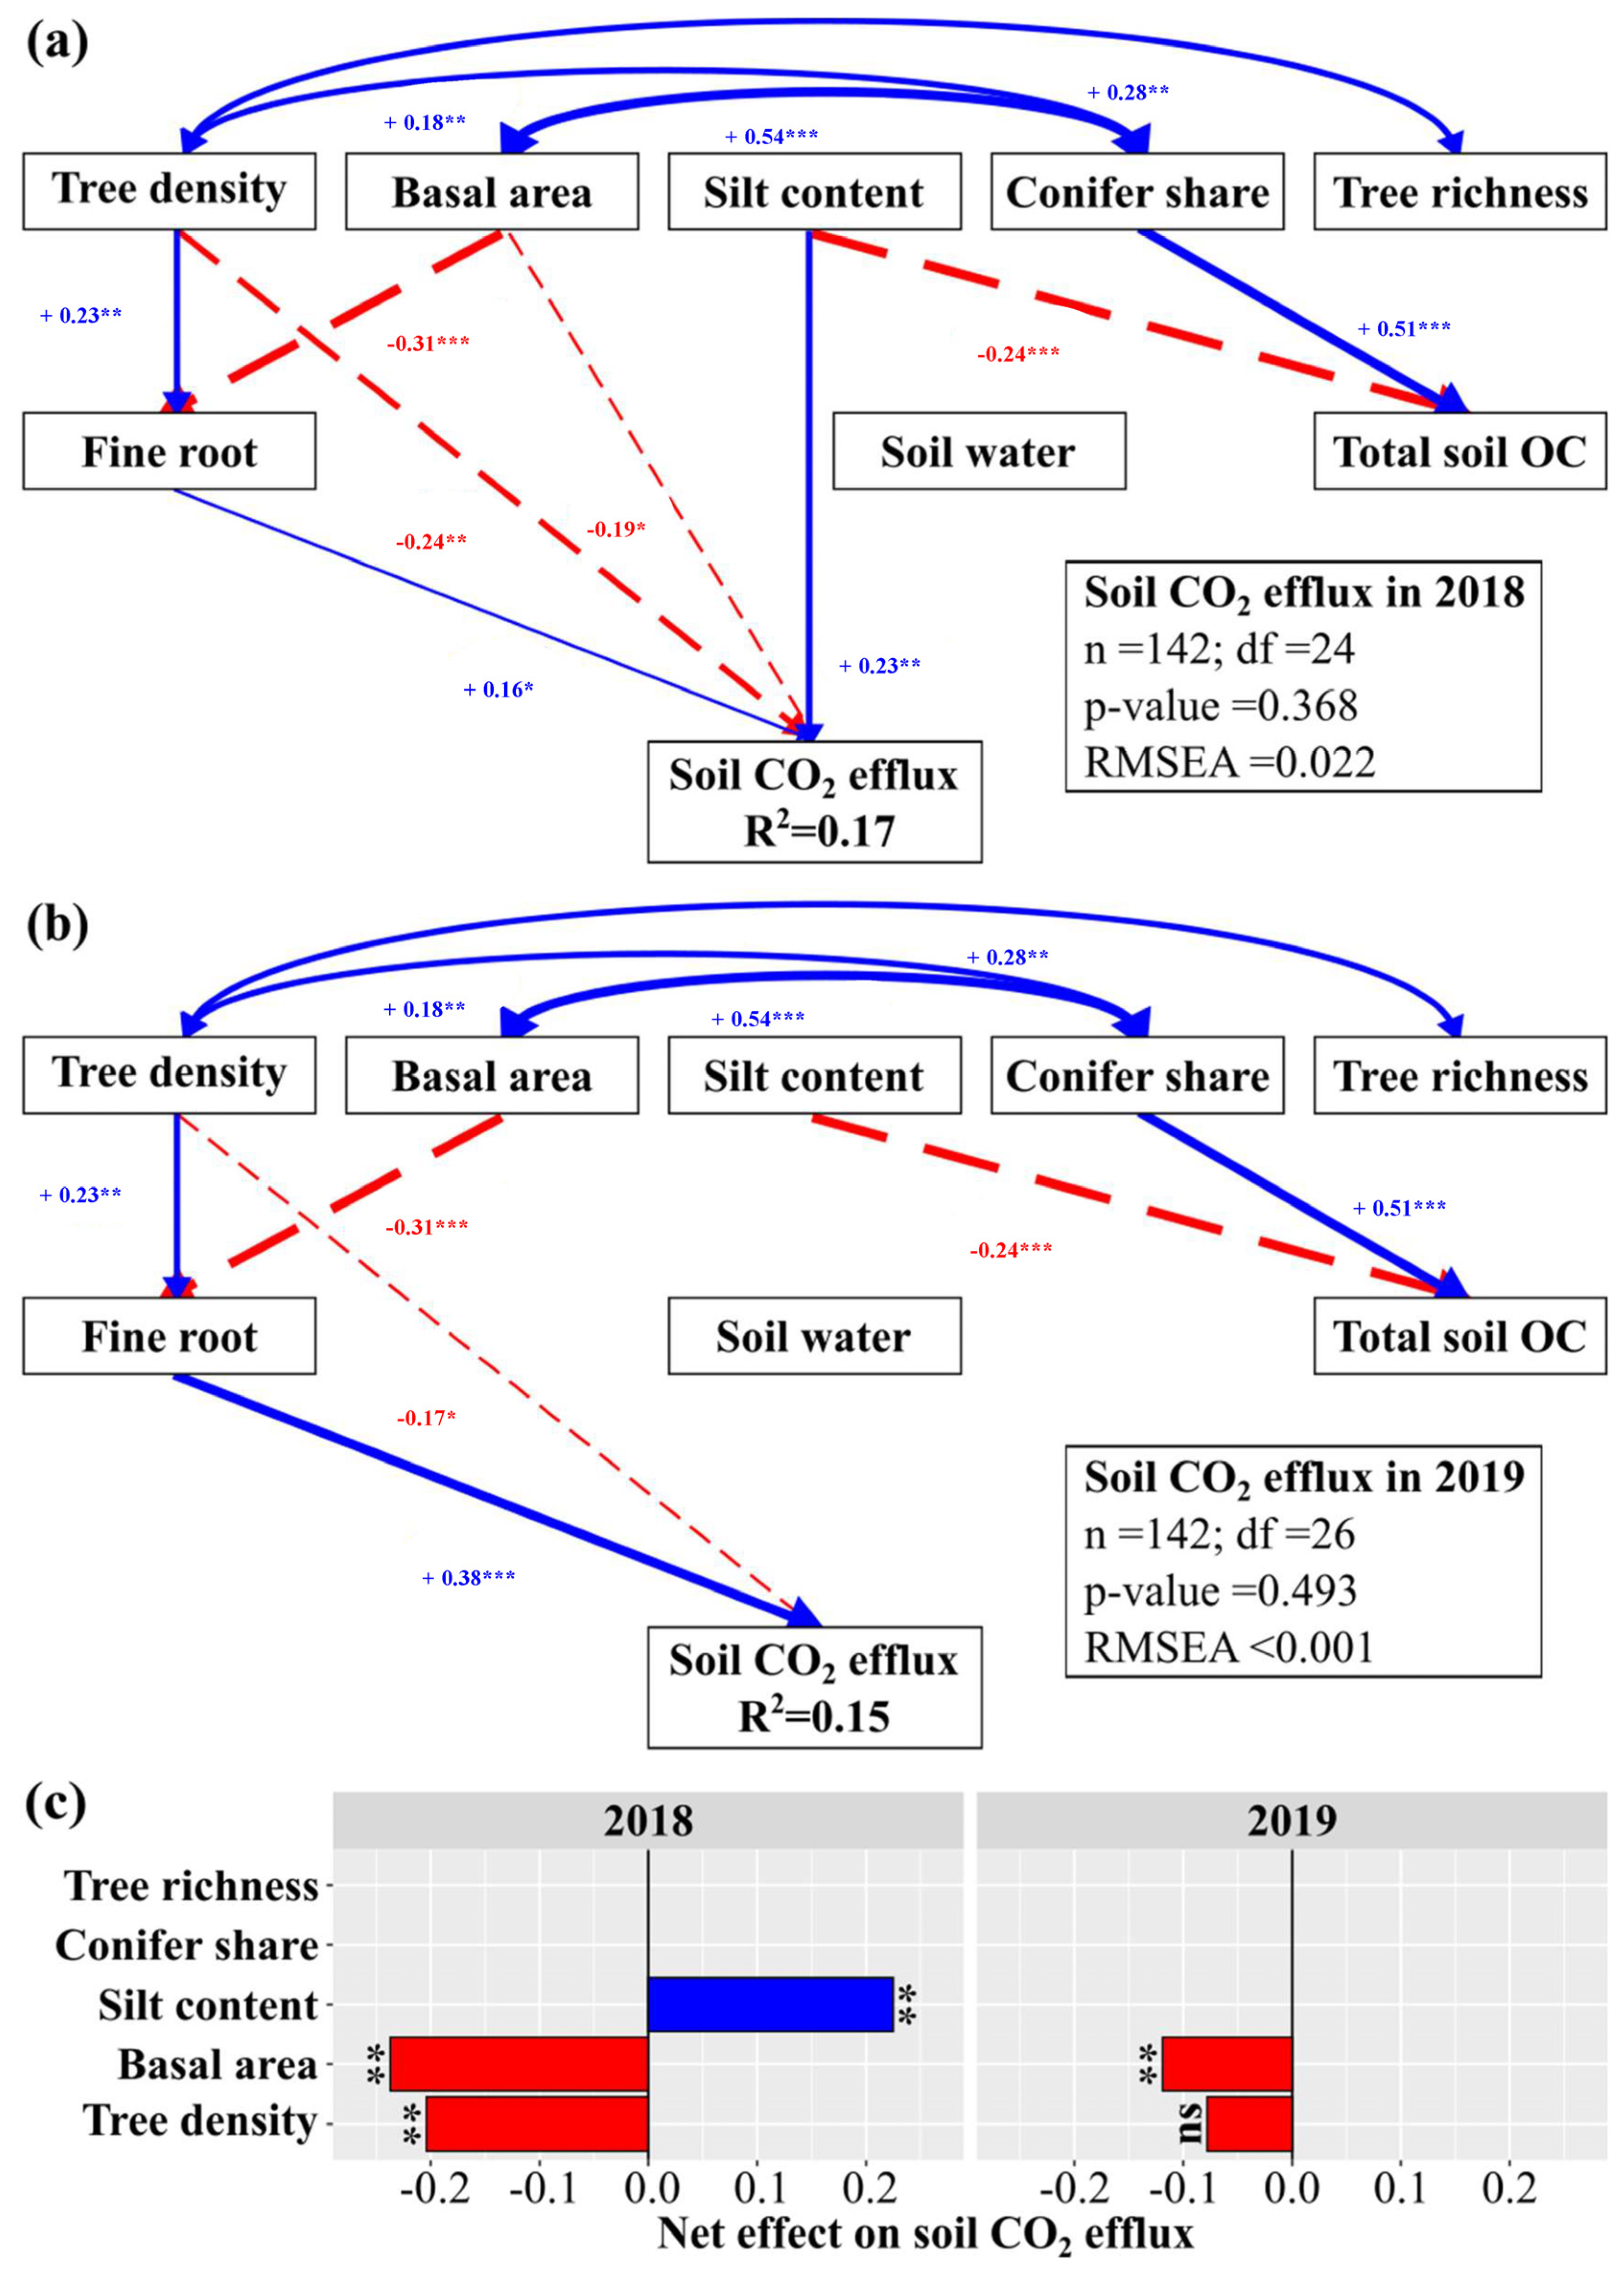
3.3. Forest Properties, Soil Properties and (Soil) Climate Effects on Soil CO2 Efflux

Forest properties explained 14% of the soil CO2 efflux variance in 2018 and 20% of the variance in 2019 (Figure 4). Soil properties explained 15% and 6% of the soil CO2 efflux variance in 2018 and in 2019, respectively, while (soil) climate explained only 4% and 3% of the variance in the two years. The explanatory power of forest properties was equal or larger than that of soil properties, and much larger than that of (soil) climate, underlining the importance of forest properties as predictors of soil CO2 efflux at the landscape scale.
Based on the ANCOVA models, study regions were always important predictors of soil CO2 efflux (Table 3). Tree density was negatively associated with soil CO2 efflux both in 2018 and in 2019, and it was the only variable, other than study regions, that was significant in both years. Fine root biomass was positively linked with soil CO2 efflux in both years, but this relationship was significant only in 2019. Similarly, in 2018, the stand basal area was significantly and negatively related with soil CO2 efflux and silt content was positively related with soil CO2 efflux, but these relationships were not observed in 2019. The soil pH was positively related to soil CO2 efflux in both years, but these relationships were only marginally significant. Similarly, soil temperature and soil water content were positively related with soil CO2 efflux in 2019, but these relationships were not, or only marginally, significant.
We used SEM to examine how forest structure and composition affect soil CO2 efflux. Forest structure was associated with fine root biomass, while forest composition mostly associated with total soil OC stocks (organic layer and mineral soil organic carbon stocks), and neither of them associated with soil water content (Figure 5). In detail, tree density was positively linked to fine root biomass and basal area was negatively linked to it. The conifer share was positively linked to total soil OC stocks, while tree species richness was not linked to fine root biomass or to total soil OC stocks. In addition, silt content was negatively linked to total soil OC stocks, but it did not associate with fine root biomass or with soil water content. Both in 2018 and in 2019, total soil OC stocks and soil water content were not linked to soil CO2 efflux but, in contrast, fine root biomass was positively and significantly linked to it (Figure 5a,b). This led to a positive indirect link from tree density to soil CO2 efflux and a negative indirect link from basal area to it. In addition to the indirect links, tree density had a negative direct link to soil CO2 efflux both in 2018 and in 2019. Similarly, but only in 2018, basal area had a negative direct link to soil CO2 efflux and silt content had a positive direct link to it (Figure 5a). These direct links were not explained by fine root biomass, total soil OC stocks or soil water content. Considering both direct and indirect effects, basal area had a negative net effect on soil CO2 efflux both in 2018 and in 2019, and tree density had a negative net effect that was significant only in 2018 (Figure 5c). No direct or indirect links were found from conifer share and tree species richness to soil CO2 efflux.

4. Discussion

4.1. Low Soil CO2 Efflux Due to Dry Conditions

In this study, in situ soil CO2 efflux averaged at 2.1 ± 0.5 g CO2-C m−2 d−1 in 2018 and at 2.2 ± 0.5 g CO2-C m−2 d−1 in 2019. Reported summer soil CO2 effluxes in similar temperate European forests range from 0.9 to 4.9 g CO2-C m−2 d−1 [8,10,11,12,17,19,41,42]. Compared to literature values, our in situ soil CO2 effluxes fell into the lower part of the range. Summer months in 2018 and in 2019 were on average drier and warmer than the 10-year mean (Table S2), which probably led to reduced soil respiration.
In temperate forests, CO2 efflux from the organic layer contributes 38–46% to the total soil CO2 efflux over the year [17]. In this study, however, differences between total and mineral soil CO2 effluxes were only observed in HAI in 2019 (Figure 3). Two processes might explain the lack of differences between total and mineral soil CO2 effluxes in the other study regions and years: first, the organic layer dries out faster than the underlying mineral soil, and so soil respiration from the organic layer made a negligible contribution to the total soil CO2 efflux, and second, autotrophic respiration was the main contributor to total soil respiration. Regarding the first process, we visually observed during fieldwork that the organic layers were drier than the underlying mineral soil (no data available), which supports the idea of reduced microbial activity in the organic layer due to water limitation. Low soil moisture in the organic layer, and subsequently reduced CO2 emissions, have been observed in several throughfall exclusion experiments [42,43,44]. Here, total soil CO2 efflux was higher than that from the mineral soil only in the case of HAI in 2019 (Figure 3). HAI was also the only study region with significantly different soil volumetric water contents between the two years (Figure 2b; with 2019 wetter than 2018). However, neither total nor mineral soil CO2 efflux was related to organic layer or mineral soil OC stocks (Table 3 and Table S3), indicating that both the organic layer and the mineral soil were affected by the dry conditions.
For the second process, several studies suggest that the autotrophic contribution to total soil respiration peaks in summer [43,44,45]. Some studies have reported reductions in both the heterotrophic and autotrophic soil respiration under dry conditions [41,42], while others determined mainly reductions in the heterotrophic respiration [42,43]. This agrees with the lack of significant correlation between in situ soil CO2 efflux and soil OC stocks, and the significance of fine root biomass (Table 3). We suggest that water limitations, caused by two successive summer droughts in Europe in 2018 and in 2019, were responsible for the lack of differences between total and mineral soil CO2 effluxes. We assume that autotrophic respiration, i.e., CO2 respired by roots, mycorrhiza and rhizospheric microorganism [15,16], was probably the main contributor to summer soil respiration in our study.
Fine root biomass has been proposed as an important predictor of soil respiration, especially at larger spatial scales and a positive relationship with soil respiration has been shown [19,46]. Similarly, we identified fine root biomass as one of the strongest and most stable predictors of in situ soil CO2 effluxes at the landscape. Fine root biomass had a positive effect on soil CO2 fluxes both in 2018 and 2019 (Figure 5), but the effect was stronger in 2019 compared to 2018.

4.2. Both Forest and Soil Properties Drive Soil CO2 Efflux at the Landscape under Drought

Forest properties, soil properties and (soil) climate explained about a third of the soil CO2 efflux variance at the landscape scale (Figure 4). Forest and soil properties explained comparable amounts of soil CO2 variance in 2018, but in 2019, forest properties had a much greater explanatory power than soil properties. In contrast, climate (i.e., soil temperature and water content) accounted only for small amounts of soil CO2 efflux variance. In line with our second hypothesis, both forest and soil properties were important for soil CO2 efflux at the landscape scale and should be considered when predicting forest soil respiration at the landscape scale.
Early summer soil temperature and water content were not related to in situ soil CO2 efflux neither in 2018 nor in 2019 (Table 3). This agrees with previous studies on spatial soil respiration dynamics [19], where the spatial variation of soil temperature was small and, thus, did not explain soil respiration variation. Similarly, in our study, soil temperature and water content variations in each of the three regions were smaller than the variation between them (Figure 2) and, thus, did not drive differences in soil CO2 efflux. In addition, we measured soil CO2 efflux over long installation periods (i.e., from five to seven days) that are considered to integrate the diurnal and climatic variability in the measurements [28] and to allow the investigation of variables that emphasize other causes of variability. Accordingly, observed differences in soil CO2 fluxes are not expected to be due to differences in soil temperature or water content, but rather due to forest or soil properties.
In our study, neither the organic layer nor mineral soil OC stocks were (significantly) related to in situ soil CO2 efflux (Table 3 and Table S3), while a previous study on the same forest sites identified soil OC as important for soil respiration in incubation experiments with standardized temperature and moisture [47]. In the literature, both strong and weak, positive and negative relationships have been reported for soil OC and soil respiration under non-limiting water conditions [7,11,48]. Our fieldwork in 2018 and 2019 was conducted under drier and warmer conditions in comparison to the 10-year average (Table S2), which, we hypothesize, reduced the heterotrophic soil respiration and weakened its dependency on soil OC. Similarly, drought might weaken soil respiration dependency on soil pH and texture, which are important determinants of soil OC stocks and stability in temperate forests [25,48,49]. In our SEMs, total soil OC stocks were linked to conifer share and silt content (Figure 5), but soil OC did not mediate any effect on soil CO2 efflux.
Silt content was positively related to soil CO2 efflux in 2018 (Table 3) and, interestingly, this effect was not mediated by fine root biomass, soil OC stocks or soil water content (Figure 5). Soil water in silty soils is more available to plants and microbes compared to clayey soils [26]. However, to understand these processes, soil water tension measurements, rather than soil volumetric water content, are needed. The relationship between silt content and soil CO2 efflux could represent water availability and release characteristics among the three study regions, since HAI had greater silt content and soil depth than ALB and SCH (Table 2) as well as higher soil CO2 efflux and available soil water (Figure 2 and Figure S5).

4.3. Forest Structure, but Not Composition, Influence Soil CO2 Efflux at the Landscape under Drought

Partially in line with our third hypothesis, we found that the forest structure related to soil CO2 efflux at the landscape, while the forest composition did not. In detail, stand tree density and basal area decreased soil CO2 efflux (Figure 5c), while conifer share and tree species richness were not related, directly or indirectly, to soil CO2 efflux. This suggests that forest management actions that result in forests with lower stand tree density and basal area, such as thinning, could also result in increased in situ soil CO2 efflux during dry summertime periods. These forest management actions might also increase soil CO2 efflux under non-limiting water conditions when heterotrophic respiration contributes more to soil respiration.
Stand basal area had a negative indirect link with soil CO2 efflux both in 2018 and in 2019, and an additional negative direct link in 2018. The direct link between basal area and soil CO2 efflux was not mediated by fine root biomass, total soil OC stocks or climate (here, expressed by soil water content) but, possibly, it relates to a lower fine root activity and respiration in stands with larger and older trees [50]. The negative relationship between the basal area and fine root biomass (Figure 5) is not in agreement with the literature. Studies investigating deeper soil profiles or the whole rooting depth reported positive relationships between fine root biomass and stand age, basal area or DBH [6,51,52]. This discrepancy might be due to methodological differences since we sampled only the upper 10 cm of the mineral soil. This might have resulted in an underestimation of fine root biomass in some age classes or tree species, as the relationship between fine root biomass and forest properties differs among tree species [53]. In addition, our fine root biomass data originated from 2011, and they do not correspond to the soil CO2 efflux study years (i.e., 2018 and 2019). Even so, our topsoil fine root biomass data explained well the soil CO2 fluxes suggesting, first, that the upper soil fine root biomass might be more relevant for the soil respiration and, second, that the spatial patterns of fine root biomass might remain relatively stable interannually.
After considering several forest properties, we found that forest composition is not important for soil CO2 efflux at least in early summer (Table 3). The conifer share was not related to summer soil CO2 efflux. Even so, conifer share was positively linked with total soil OC stocks (Figure 5), presumably due to the positive relationship between the conifer share and the organic layer OC stocks (R2 = 0.48, p-value < 0.001; including study region effects). Therefore, the conifer share might be important for C storage in forest soils [54], and a relevant driver of soil respiration under non-limiting water conditions when the organic layer contributes to total soil CO2 efflux [17]. Similarly, we did not observe any relationship, direct or indirect, between tree species’ richness and soil CO2 efflux (or soil OC stocks), despite recent evidence suggesting that stand diversity is positively associated with soil respiration [13]. However, our early summer soil CO2 fluxes were affected by natural droughts, which could have masked additional effects from these forest properties.

5. Conclusions

The drier than regular conditions observed in central Europe in 2018 and 2019 led to low summer in situ soil CO2 efflux. In situ soil CO2 efflux was positively related with fine root biomass, but not with organic layer or mineral soil OC stocks. Water limiting conditions associated with drought events might not only reduce soil respiration, but also alter the relative contribution of autotrophic and heterotrophic respiration to total soil CO2 fluxes.
The ability of forest properties to explain soil CO2 efflux variation at the landscape scale was high and remained so over the two study years. Forest structural properties, i.e., tree density and basal area, were important predictors of soil CO2 efflux, while forest composition, i.e., conifer share and tree species richness, was not. Fine root biomass partially mediated the effects of forest structure on soil CO2 efflux, but there were remaining effects both from tree density and basal area on soil CO2 efflux that were not explained by soil OC stocks, fine root biomass or climate. Future research should investigate soil respiration and its sources (autotrophic and heterotrophic respiration) with high spatial coverage at the landscape scale and, ideally, over an annual timescale, to better understand the effects of forest properties and management and their importance for carbon cycling.

Supplementary Materials

The following supporting information can be downloaded at: https://www.mdpi.com/article/10.3390/f14020411/s1, Table S1: Minimum, average and maximum values of soda-lime sample mass increase (% of the initial dry mass) for the 2018 and 2019 campaigns in the three study regions of the Biodiversity Exploratories project. Mass gain did not exceed the limit of 9.0% proposed by Janssen et al. [34]; Table S2: Soil temperature and volumetric water content per month from March to July for the 10-year-average (2008-17) and the two sampling years 2018 and 2019 in the three study regions; Table S3: ANCOVA models for mineral soil CO2 efflux in 2018 and in 2019. Full models were stepwise re-duced. Study region effects are given relative to the Schwäbische-Alb region; Figure S1: Representative map a forest plot (black square of 100 m × 100 m) showing the subplots of (i) soil sampling (blue cross of 40 m length), (ii) soil CO2 efflux measurements (blue square: 2 m × 2 m), (iii) fence of weather station (black square: 12 m × 12 m) and (iv) climate sensors (grey rectangles: 4 m × 2 m). This map is based on the forest site AEW01 in Schwäbische-Alb; Figure S2: Correlation between soil volumetric water content and (a) silt and (b) clay content for the two sampling years (i.e., 2018 and 2019) and the three study regions (i.e., Schwäbische-Alb: ALB, Hainich-Dün: HAI and Schorfheide-Chorin: SCH). Equation and R2 describe the linear relationship of soil volumetric water content and silt and clay content over all study regions; Figure S3: Hypothetical structure to test forest structure and composition effects on soil CO2 efflux through fine root biomass, total soil OC stocks and soil water content; Figure S4: Mean (a) soil temperature (°C) and (b) volumetric water content (%) per month for the 10-year-mean (2008-17) and the two study years i.e., 2018 and 2019, for the three study regions (Schwäbische-Alb: ALB, Hainich-Dün: HAI and Schorfheide-Chorin: SCH). Error bars represent standard deviations around the mean.; Figure S5: Soil volumetric water content (SVWC) during the soil respiration measurements over Water holding capacity (WHC) for the three study regions (i.e., Schwäbische-Alb: ALB, Hainich-Dün: HAI and Schorfheide-Chorin: SCH) and the two years (i.e., 2018 and 2019). Asterisks indicate differences between the two years for a given study site. Lower-case letters indicate differences between the tree study regions in 2018 and upper-case letters indicate differences between the tree study regions in 2019.; Figure S6: Correlation between total in-situ soil respiration and soil volumetric water content for the two sampling years (i.e., 2018 and 2019) and the three study regions (i.e., Schwäbische-Alb: ALB, Hainich-Dün: HAI and Schorfheide-Chorin: SCH). Equations and coefficient of determinations describe the linear relationship of total in-situ soil respiration and soil volumetric water content over all study regions.

Author Contributions

A.A. designed and carried out the field measurements and the laboratory work, analyzed and discussed the data and was responsible for writing this manuscript. I.S., B.M., S.T. and M.S. designed the experiment and reviewed and edited drafts of the manuscript. C.A. and P.S. provided data and expertise related to forest ecology and management and reviewed and edited drafts of the manuscript. F.H. and T.N. provided data related to climate and reviewed drafts of the manuscript. All authors have read and agreed to the published version of the manuscript.

Funding

The work has been funded by the DFG Priority Program 1374 “Biodiversity- Explorato-ries” (TR 1054/4-3 and SCHR 1181/2-3). Open access funding was provided by the Max Planck Society.

Data Availability Statement

This work is based on data elaborated by the projects TR 1054/4-3 and SCHR 1181/2-3 of the Biodiversity Exploratories program (DFG Priority Program 1374). The datasets are publicly available in the Biodiversity Exploratories Information System (https://www.bexis.uni-jena.de/ (accessed on 15 December 2019); datasets: 14448, 14686, 17026, 17486, 25046, 22246, 22766, 23846, 24346, 26908, 26946).

Acknowledgments

We thank Theresa Klötzing and Steffen Ferber for their contribution in the lab and field work. We thank the managers of the three Exploratories, Kirsten Reichel-Jung, Florian Staub, Juliane Vogt, Miriam Teuscher and all former managers for their work in maintaining the plot and project infrastructure; Christiane Fischer for giving support through the central office, Andreas Ostowski for managing the central database, and Markus Fischer, Eduard Linsenmair, Dominik Hessenmöller, Daniel Prati, François Buscot, Ernst-Detlef Schulze, Wolfgang W. Weisser and the late Elisabeth Kalko for their role in setting up the Biodiversity Exploratories project. We thank the administration of the Hainich national park, the UNESCO Biosphere Reserve Swabian Alb and the UNESCO Biosphere Reserve Schorfheide-Chorin as well as all landowners for their excellent collaboration. Field work permits were issued by the responsible state environmental offices of Baden-Württemberg, Thüringen, and Brandenburg.

Conflicts of Interest

The authors declare that they have no conflict of interest.

References

  1. Pan, Y.; Birdsay, R.A.; Fang, J.; Houghton, R.; Kauppi, P.E.; Kurz, W.A.; Phillips, O.L.; Shvidenko, A.; Lewis, S.L.; Canadell, J.G.; et al. A Large and Persistent Carbon Sink in the World’s Forests. Science 2011, 333, 988–993. [Google Scholar] [CrossRef] [PubMed]
  2. Schlesinger, W.H.; Andrews, J.A. Soil respiration and the global carbon cycle. Biogeochemistry 2000, 48, 7–20. [Google Scholar] [CrossRef]
  3. Berg, B.; McClaugherty, C. Plant Litter: Decomposition, Humus Formation, Carbon Sequestration; Springer: Berlin/Heidelberg, Germany, 2004. [Google Scholar]
  4. Ehbrecht, M.; Schall, P.; Ammer, C.; Fischer, M.; Seidel, D. Effects of structural heterogeneity on the diurnal temperature range in temperate forest ecosystems. For. Ecol. Manag. 2019, 432, 860–867. [Google Scholar] [CrossRef]
  5. Felipe-Lucia, M.R.; Soliveres, S.; Penone, C.; Manning, P.; van der Plas, F.; Boch, S.; Prati, D.; Ammer, C.; Schall, P.; Gossner, M.M.; et al. Multiple forest attributes underpin the supply of multiple ecosystem services. Nat. Commun. 2018, 9, 4839. [Google Scholar] [CrossRef] [PubMed]
  6. Finér, L.; Ohashi, M.; Noguchi, K.; Hirano, Y. Factors causing variation in fine root biomass in forest ecosystems. For. Ecol. Manag. 2011, 261, 265–277. [Google Scholar] [CrossRef]
  7. Rodeghiero, M.; Cescatti, A. Main determinants of forest soil respiration along an elevation/temperature gradient in the Italian Alps. Glob. Chang. Biol. 2005, 11, 1024–1041. [Google Scholar] [CrossRef]
  8. Kukumägi, M.; Ostonen, I.; Uri, V.; Helmisaari, H.S.; Kanal, A.; Kull, O.; Lõhmus, K. Variation of soil respiration and its components in hemiboreal Norway spruce stands of different ages. Plant Soil 2017, 414, 265–280. [Google Scholar] [CrossRef]
  9. Zhao, X.; Li, F.; Zhang, W.; Ai, Z.; Shen, H.; Liu, X.; Cao, J.; Manevski, K. Soil respiration at different stand ages (5, 10, and 20/30 years) in coniferous (Pinus tabulaeformis Carrière) and deciduous (Populus davidiana Dode) plantations in a sandstorm Source Area. Forests 2016, 7, 153. [Google Scholar] [CrossRef]
  10. Berger, T.W.; Inselsbacher, E.; Zechmeister-Boltenstern, S. Carbon dioxide emissions of soils under pure and mixed stands of beech and spruce, affected by decomposing foliage litter mixtures. Soil Biol. Biochem. 2010, 42, 986–997. [Google Scholar] [CrossRef]
  11. Borken, W.; Xu, Y.J.; Davidson, E.A.; Beese, F. Site and temporal variation of soil respiration in European beech, Norway spruce, and Scots pine forests. Glob. Chang. Biol. 2002, 8, 1205–1216. [Google Scholar] [CrossRef]
  12. Vesterdal, L.; Elberling, B.; Christiansen, J.R.; Callesen, I.; Schmidt, I.K. Soil respiration and rates of soil carbon turnover differ among six common European tree species. For. Ecol. Manag. 2012, 264, 185–196. [Google Scholar] [CrossRef]
  13. Jewell, M.D.; Shipley, B.; Low-Décarie, E.; Tobner, C.M.; Paquette, A.; Messier, C.; Reich, P.B. Partitioning the effect of composition and diversity of tree communities on leaf litter decomposition and soil respiration. Oikos 2017, 126, 959–971. [Google Scholar] [CrossRef]
  14. Schall, P.; Schulze, E.D.; Fischer, M.; Ayasse, M.; Ammer, C. Relations between forest management, stand structure and productivity across different types of Central European forests. Basic Appl. Ecol. 2018, 32, 39–52. [Google Scholar] [CrossRef]
  15. Bond-Lamberty, B.; Wang, C.; Gower, S.T. A global relationship between the heterotrophic and autotrophic components of soil respiration? Glob. Chang. Biol. 2004, 10, 1756–1766. [Google Scholar] [CrossRef]
  16. Hanson, P.J.; Edwards, N.T.; Garten, C.T.; Andrews, J.A. Seperating root and soil microbial contributions to soil respiration: A review of methods and observations. Biogeochemistry 2000, 48, 115–146. [Google Scholar] [CrossRef]
  17. Borken, W.; Beese, F. Soil respiration in pure and mixed stands of European beech and Norway spruce following removal of organic horizons. Can. J. For. Res. Can. Rech. For. 2005, 35, 2756–2764. [Google Scholar] [CrossRef]
  18. Hobbie, S.E.; Ogdahl, M.; Chorover, J.; Chadwick, O.A.; Oleksyn, J.; Zytkowiak, R.; Reich, P.B. Tree species effects on soil organic matter dynamics: The role of soil cation composition. Ecosystems 2007, 10, 999–1018. [Google Scholar] [CrossRef]
  19. Søe, A.R.B.; Buchmann, N. Spatial and temporal variations in soil respiration in relation to stand structure and soil parameters in an unmanaged beech forest. Tree Physiol. 2005, 25, 1427–1436. [Google Scholar] [CrossRef]
  20. IUSS Working Group WRB. World Reference Base for Soil Resources 2014, Update 2015. International Soil Classification System for Naming Soils and Creating Legends for Soil Maps 2014; World Soil Resources Reports No. 106; FAO: Rome, Italy, 2015. [Google Scholar]
  21. Fischer, M.; Bossdorf, O.; Gockel, S.; Hänsel, F.; Hemp, A.; Hessenmöller, D.; Korte, G.; Nieschulze, J.; Pfeiffer, S.; Prati, D.; et al. Implementing large-scale and long-term functional biodiversity research: The Biodiversity Exploratories. Basic Appl. Ecol. 2010, 11, 473–485. [Google Scholar] [CrossRef]
  22. Herold, N.; Schöning, I.; Berner, D.; Haslwimmer, H.; Kandeler, E.; Michalzik, B.; Schrumpf, M. Vertical gradients of potential enzyme activities in soil profiles of European beech, Norway spruce and Scots pine dominated forest sites. Pedobiologia 2014, 57, 181–189. [Google Scholar] [CrossRef]
  23. Solly, E.F.; Schöning, I.; Boch, S.; Kandeler, E.; Marhan, S.; Michalzik, B.; Müller, J.; Zscheischler, J.; Trumbore, S.E.; Schrumpf, M. Factors controlling decomposition rates of fine root litter in temperate forests and grasslands. Plant Soil 2014, 382, 203–218. [Google Scholar] [CrossRef]
  24. DIN ISO 11277; Soil Quality—Determination of Particle Size Distribution in Mineral Soil Material—Method by Sieving and Sedimentation. Beuth: Berlin, Germany, 2002.
  25. Grüneberg, E.; Schöning, I.; Hessenmöller, D.; Schulze, E.D.; Weisser, W.W. Organic layer and clay content control soil organic carbon stocks in density fractions of differently managed German beech forests. For. Ecol. Manag. 2013, 303, 1–10. [Google Scholar] [CrossRef]
  26. Salter, P.J.; Williams, J.B. The influence of texture on the moisture characteristics of soils. II. Available-water capacity and moisture release characteristics. J. Soil Sci. 1965, 16, 310–317. [Google Scholar] [CrossRef]
  27. Keith, H.; Wong, S.C. Measurement of soil CO2 efflux using soda lime absorption: Both quantitative and reliable. Soil Biol. Biochem. 2006, 38, 1121–1131. [Google Scholar] [CrossRef]
  28. Grogan, P. CO2 flux measurement using soda lime: Correction for water formed during CO2 adsorption. Ecology 1998, 79, 1467–1468. [Google Scholar] [CrossRef]
  29. Janssens, I.; Ceulemans, R. Spatial variability in forest soil CO2 efflux assessed with a calibrated soda lime technique. Ecol. Lett. 1998, 1, 95–98. [Google Scholar] [CrossRef]
  30. McCoy, K.; Zimbron, J.; Sale, T.; Lyverse, M. Measurement of Natural Losses of LNAPL Using CO2 Traps. Groundwater 2015, 53, 658–667. [Google Scholar] [CrossRef]
  31. Bierbaß, P.; Gutknecht, J.L.M.; Michalzik, B. Nest-mounds of the yellow meadow ant (Lasius flavus) at the “Alter Gleisberg”, Central Germany: Hot or cold spots in nutrient cycling? Soil Biol. Biochem. 2015, 80, 209–217. [Google Scholar] [CrossRef]
  32. Näthe, K.; Levia, D.F.; Tischer, A.; Michalzik, B. Low-intensity surface fire effects on carbon and nitrogen cycling in soil and soil solution of a Scots pine forest in central Germany. Catena 2018, 162, 360–375. [Google Scholar] [CrossRef]
  33. Apostolakis, A.; Schöning, I.; Michalzik, B.; Klaus, V.H.; Boeddinghaus, R.S.; Kandeler, E.; Marhan, S.; Bolliger, R.; Fischer, M.; Prati, D.; et al. Drivers of soil respiration across a management intensity gradient in temperate grasslands under drought. Nutr. Cycl. Agroecosyst 2022, 124, 101–116. [Google Scholar] [CrossRef]
  34. Janssens, I.; Kowalski, A.S.; Longdoz, B.; Ceulemans, R. Assessing forest soil CO2 efflux: An In Situ comparison of four techniques. Tree Physiol. 2000, 20, 23–32. [Google Scholar] [CrossRef] [PubMed]
  35. Zuur, A.F.; Ieno, E.N.; Walker, N.J.; Saveliev, A.A.; Smith, G.M. Mixed Effects Models and Extensions in Ecology with R; Book Series 2009: Statistics for Biology and Health; Springer: New York, NY, USA, 2009. [Google Scholar] [CrossRef]
  36. Apostolakis, A.; Schöning, I.; Klaus, V.H.; Michalzik, B.; Bischoff, W.-A.; Boeddinghaus, R.S.; Bolliger, R.; Fischer, M.; Hölzel, N.; Kandeler, E.; et al. Direct and plant community mediated effects of management intensity on annual nutrient leaching risk in temperate grasslands. Nutr. Cycl. Agroecosystems 2022, 123, 83–104. [Google Scholar] [CrossRef]
  37. R Core Team. R: A Language and Environment for Statistical Computing; R Foundation for Statistical Computing: Vienna, Austria, 2019; Available online: https://www.R-project.org/ (accessed on 15 December 2019).
  38. Faraway, J. Faraway: Functions and Datasets for Books by Julian Faraway, R package version 1.0.7; 2016. Available online: https://CRAN.R-project.org/package=faraway (accessed on 15 December 2019).
  39. Groemping, U. Relative Importance for Linear Regression in R: The Package relaimpo. J. Stat. Softw. 2006, 17, 1–27. [Google Scholar] [CrossRef]
  40. Rosseel, Y. lavaan: An R Package for Structural Equation Modeling. J. Stat. Softw. 2012, 48, 1–36. [Google Scholar] [CrossRef]
  41. Nikolova, P.S.; Raspe, S.; Andersen, C.P.; Mainiero, R.; Blaschke, H.; Matyssek, R.; Häberle, K.H. Effects of the extreme drought in 2003 on soil respiration in a mixed forest. Eur. J. For. Res. 2009, 128, 87–98. [Google Scholar] [CrossRef]
  42. Schindlbacher, A.; Wunderlich, S.; Borken, W.; Kitzler, B.; Zechmeister-Boltenstern, S.; Jandl, R. Soil respiration under climate change: Prolonged summer drought offsets soil warming effects. Glob. Chang. Biol. 2012, 18, 2270–2279. [Google Scholar] [CrossRef]
  43. Borken, W.; Savage, K.; Davidson, E.A.; Trumbore, S.E. Effects of experimental drought on soil respiration and radiocarbon efflux from a temperate forest soil. Glob. Chang. Biol. 2006, 12, 177–193. [Google Scholar] [CrossRef]
  44. Muhr, J.; Borken, W. Delayed recovery of soil respiration after wetting of dry soil further reduces C losses from a Norway spruce forest soil. J. Geophys. Res. Biogeosciences 2009, 114, 1–11. [Google Scholar] [CrossRef]
  45. Shabaga, J.A.; Basiliko, N.; Caspersen, J.P.; Jones, T.A. Seasonal controls on patterns of soil respiration and temperature sensitivity in a northern mixed deciduous forest following partial-harvesting. For. Ecol. Manag. 2015, 348, 208–219. [Google Scholar] [CrossRef]
  46. Luan, J.; Liu, S.; Wang, J.; Chang, S.X.; Liu, X.; Lu, H.; Wang, Y. Tree species diversity promotes soil carbon stability by depressing the temperature sensitivity of soil respiration in temperate forests. Sci. Total Environ. 2018, 645, 623–629. [Google Scholar] [CrossRef]
  47. Gan, H.Y.; Schöning, I.; Schall, P.; Ammer, C.; Schrumpf, M. Soil Organic Matter Mineralization as Driven by Nutrient Stoichiometry in Soils Under Differently Managed Forest Stands. Front. For. Glob. Chang. 2020, 3, 1–15. [Google Scholar] [CrossRef]
  48. Reichstein, M.; Rey, A.; Freibauer, A.; Tenhunen, J.; Valentini, R.; Banza, J.; Casals, P.; Cheng, Y.; Grünzweig, J.M.; Irvine, J.; et al. Modeling temporal and large-scale spatial variability of soil respiration from soil water availability, temperature and vegetation productivity indices. Glob. Biogeochem. Cycles 2003, 17, 1104. [Google Scholar] [CrossRef]
  49. Grüneberg, E.; Schöning, I.; Riek, W.; Ziche, D.; Evers, J. Carbon Stocks and Carbon Stock Changes in German Forest Soils. In Status and Dynamics of Forests in Germany. Ecological Studies (Analysis and Synthesis); Wellbrock, N., Bolte, A., Eds.; Springer: Cham, Switzerland, 2019; Volume 237. [Google Scholar] [CrossRef]
  50. Saiz, G.; Byrne, K.A.; Butterbach-Bahl, K.; Kiese, R.; Blujdea, V.; Farrell, E.P. Stand age-related effects on soil respiration in a first rotation Sitka spruce chronosequence in central Ireland. Glob. Chang. Biol. 2006, 12, 1007–1020. [Google Scholar] [CrossRef]
  51. Ammer, C.; Wagner, S. An approach for modelling the mean fine-root biomass of Norway spruce stands. Trees—Struct. Funct. 2005, 19, 145–153. [Google Scholar] [CrossRef]
  52. Jagodzinski, A.M.; Ziolkowski, J.; Warnkowska, A.; Prais, H. Tree age effects on fine root biomass and morphology over chronosequences of fagus sylvatica, quercus robur and alnus glutinosa stands. PLoS ONE 2016, 11, 1–25. [Google Scholar] [CrossRef] [PubMed]
  53. Finér, L.; Helmisaari, H.S.; Lõhmus, K.; Majdi, H.; Brunner, I.; Børja, I.; Eldhuset, T.; Godbold, D.; Grebenc, T.; Konôpka, B.; et al. Variation in fine root biomass of three European tree species: Beech (Fagus sylvatica L.), Norway spruce (Picea abies L. Karst.), and Scots pine (Pinus sylvestris L.). Plant Biosyst. 2007, 141, 394–405. [Google Scholar] [CrossRef]
  54. Vesterdal, L.; Clarke, N.; Sigurdsson, B.D.; Gundersen, P. Do tree species influence soil carbon stocks in temperate and boreal forests? For. Ecol. Manag. 2013, 309, 4–18. [Google Scholar] [CrossRef]
Figure 1. Sketch of the soda-lime method with an open and static chamber (after Apostolakis et al. [33]). A PVC ring (1) of 12 cm is inserted to the soil down to 2 cm. A PVC lid (2) is placed over the PVC ring and a plastic O-ring (3) ensures the airtightness of the chamber. The color of the PVC ring and lid was orange brown. A plastic tube (4), which is glued on the PVC lid with CO2-impermeable silicon, passes through the PVC lid. This tube provides a flow-channel between the headspace of the chamber and ambient atmosphere and, thus, pressure equilibrium between the two. In line with the plastic tube, a syringe (5) with 4 holes of a diameter of 1 mm is placed out of the chamber. This syringe contains soda-lime granules to prevent atmospheric CO2 from entering the headspace of the chamber. Inside the chamber, a syringe (6) with 64 holes (1 mm diameter) is held from a hook and contains soda-lime granules for the determination of soil CO2 efflux.
Forests 14 00411 g001
Figure 2. (a) Soil temperature, (b) volumetric water content and (c) in situ soil CO2 efflux from the forest sites of the Biodiversity Exploratories project (i.e., 50 forest sites in ALB, 50 in SCH and 49 in HAI) in 2018 and 2019. Bars represent mean values, and the error bars represent standard deviations. Upper case letters indicate differences among the study regions in 2018 and lower case letters indicate differences in 2019. Asterisks indicate differences between the years for a given study region.
Forests 14 00411 g002
Figure 3. Total and mineral in situ soil CO2 efflux for a subset of 29 forest sites out of the 150 forest sites of the Biodiversity Exploratories project. Bars represent mean values, and the error bars represent standard deviations. Lower case letters indicate differences between total and mineral soil CO2 efflux for a given study region in 2019. Asterisks indicate significant differences between the years for a given study region.
Forests 14 00411 g003
Figure 4. Soil CO2 efflux variance partitioning among forest properties (stand age, basal area, mean breast height diameter, tree density, conifer share, tree species diversity and fine root biomass), soil properties (organic layer and mineral soil OC stock, soil C:N ratio, silt content and pH) and soil climate (soil temperature and volumetric water content) for the two sampling campaigns in 2018 and in 2019.
Forests 14 00411 g004
Figure 5. Structural equation models of soil CO2 efflux measured (a) in 2018 and (b) in 2019 and (c) net effects. Mediation variables include fine root biomass, volumetric water content and total soil organic carbon stocks (mineral soil OC and organic layer stocks). Number of observations (n), degrees of freedom (df), fitness statistics (p-value, RMSEA) and standardized path coefficients and their significance level are given. Single-headed arrows represent direct paths and double-headed arrows represent covariances. Solid blue arrows represent positive associations, and dashed red arrows represent negative associations. Thin arrows represent associations with p < 0.050 (*), medium-width arrows represent p < 0.010 (**) and thick arrows represent p < 0.001 (***). Coefficients of determination are given for soil CO2 efflux.
Forests 14 00411 g005
Table 1. Geographical, topological and climatic characteristics of the three study regions included in the Biodiversity Exploratories project after Fischer et al. [21]. Abbreviations: AMT: Annual Mean Temperature, AMP: Annual Mean Precipitation, asl: above sea level.
ParameterSchwäbische-AlbHainich-DünSchorfheide-Chorin
Size (km2)~422~1300~1300
GeologyCalcareous bedrock with
karst phenomena
Calcareous
bedrock
Young glacial
landscape
Altitude (m asl)460–860285–5503–140
AMT (°C)6.0–7.06.5–8.08.0–8.5
AMP (mm)700–1000500–800500–600
Table 2. Forest and soil properties for the three study regions. Regional mean values and standard deviations are given. Names and units are given in the first column where the ‘-’ represents coefficients or count data. Lower case letters indicate significant differences (p-value < 0.05) between study regions.
Study RegionSchwäbische-AlbHainich-DünSchorfheide-Chorin
Forest properties
Stand age (y)87 ± 49 b133 ± 48 a107 ± 40 b
Basal area (m2 ha−1)30.0 ± 10.030.5 ± 9.130.5 ± 7.5
Mean diameter at breast height (cm)25.4 ± 10.0 b26.6 ± 10.0 b33.3 ± 11.3 a
Stand density (trees ha−1)701 ± 550 a568 ± 448 ab442 ± 492 b
Conifer share (%)30.1 ± 40.7 a6.6 ± 22.3 b37.4 ± 44.2 a
Tree species richness (species ha−1)6.2 ± 3.1 a5.6 ± 2.1 a3.7 ± 1.7 b
Soil properties
Organic layer OC stock (kg m−2)0.95 ± 0.45 b0.59 ± 0.18 b1.8 ± 1.3 a
Mineral soil OC stock (kg m−2)3.8 ± 0.06 a3.3 ± 0.07 b2.4 ± 0.05 c
pH5.3 ± 0.8 a4.8 ± 0.9 b3.5 ± 0.1 c
Silt content (g kg−1 soil)444.5 ± 107.6 b646.0 ± 94.4 a84.8 ± 49.2 c
Clay content (g kg−1 soil)496.1 ± 104.8 a301.0 ± 100.3 b44.8 ± 18.9 c
Total soil depth (cm)36.4 ± 21.2 c54.5 ± 13.1 b88.8 ± 6.3 a
Table 3. ANCOVA models for soil CO2 efflux in 2018 and in 2019. Full models were stepwise reduced. Study region effects are given relative to the Schwäbische-Alb region. Stand age, mean diameter at breast height, tree species richness and mineral soil OC stocks were never selected in the final models.
Soil CO2 Efflux2018 2019
df=133df=132
adj. R2 =0.39adj. R2 =0.42
Model p<0.001Model p<0.001
Explanatory variablet-valuep-valuet-valuep-value
Intercept5.68<0.0011.410.160
Region Hainich-Dün1.760.0804.42<0.001
Region Schorfheide-Chorin1.120.2670.770.443
Soil temperature--1.520.130
Soil water content--1.780.077
Tree density−2.270.025−3.100.002
Basal area−2.310.023--
Conifer share--1.920.057
Tree species richness----
Fine root biomass1.580.1164.87<0.001
Organic layer OC stock--−1.730.085
Soil C:N ratio−1.620.107--
Silt content2.410.017--
Soil pH1.770.0801.660.100
Disclaimer/Publisher’s Note: The statements, opinions and data contained in all publications are solely those of the individual author(s) and contributor(s) and not of MDPI and/or the editor(s). MDPI and/or the editor(s) disclaim responsibility for any injury to people or property resulting from any ideas, methods, instructions or products referred to in the content.

