Article

Assessing Sumatran Peat Vulnerability to Fire under Various Condition of ENSO Phases Using Machine Learning Approaches

1
Department of Forest Resource Conservation and Ecotourism, Faculty of Forestry and Environment, IPB University, Bogor 16680, Indonesia
2
Center for Remote Sensing Technology and Data, Deputy of Remote Sensing Affairs, Indonesian National Institute of Aeronautics and Space (LAPAN), Jakarta 13710, Indonesia
3
Department of Silviculture, Faculty of Forestry and Environment, IPB University, Bogor 16680, Indonesia
4
Department of Computer Science, Faculty of Mathematics and Natural Sciences, IPB University, Bogor 16680, Indonesia
5
Center for International Forestry Research (CIFOR), Jl. CIFOR, Bogor 16115, Indonesia
6
Department of Geophysics and Meteorology, IPB University, Bogor 16680, Indonesia
*
Author to whom correspondence should be addressed.
Forests 2022, 13(6), 828; https://doi.org/10.3390/f13060828
Submission received: 31 March 2022 / Revised: 20 May 2022 / Accepted: 23 May 2022 / Published: 25 May 2022

Abstract

:
In recent decades, catastrophic wildfire episodes within the Sumatran peatland have contributed to a large amount of greenhouse gas emissions. The El-Nino Southern Oscillation (ENSO) modulates the occurrence of fires in Indonesia through prolonged hydrological drought. Thus, assessing peatland vulnerability to fires and understanding the underlying drivers are essential to developing adaptation and mitigation strategies for peatland. Here, we quantify the vulnerability of Sumatran peat to fires under various ENSO conditions (i.e., El-Nino, La-Nina, and Normal phases) using correlative modelling approaches. This study used climatic (i.e., annual precipitation, SPI, and KBDI), biophysical (i.e., below-ground biomass, elevation, slope, and NBR), and proxies to anthropogenic disturbance variables (i.e., access to road, access to forests, access to cities, human modification, and human population) to assess fire vulnerability within Sumatran peatlands. We created an ensemble model based on various machine learning approaches (i.e., random forest, support vector machine, maximum entropy, and boosted regression tree). We found that the ensemble model performed better compared to a single algorithm for depicting fire vulnerability within Sumatran peatlands. The NBR highly contributed to the vulnerability of peatland to fire in Sumatra in all ENSO phases, followed by the anthropogenic variables. We found that the high to very-high peat vulnerability to fire increases during El-Nino conditions with variations in its spatial patterns occurring under different ENSO phases. This study provides spatially explicit information to support the management of peat fires, which will be particularly useful for identifying peatland restoration priorities based on peatland vulnerability to fire maps. Our findings highlight Riau’s peatland as being the area most prone to fires area on Sumatra Island. Therefore, the groundwater level within this area should be intensively monitored to prevent peatland fires. In addition, conserving intact forests within peatland through the moratorium strategy and restoring the degraded peatland ecosystem through canal blocking is also crucial to coping with global climate change.

1. Introduction

Tropical peatland ecosystems play a critical role in mitigating the effects of global climate change [1]. Indonesian peatland has been estimated to form a vast carbon pool by storing a large amount of carbon, covering more than half of the pan-tropical peat carbon storage [2]. This pristine ecosystem represents an essential habitat for rare, endemic, or endangered biodiversity [3,4,5]. Moreover, it also contributed to ecosystem services, such as water provisioning, and provides economic benefits for the local or indigenous community [3,6,7].
Nevertheless, tropical peatland is fragile to extreme disturbances [8,9], particularly in its hydrological stability, due to unwise intervention in the drainage system [10]. Peatland is susceptible to fire and land subsidence when the groundwater levels drop below the critical threshold of 40 cm from the peat surface [11]. In this recent decades, tropical peat swamp forests have been strongly impacted by harmful anthropogenic activities [12]. Deforestation and drained peat can increase the tropical peatland flammability [13] that, leading to numerous greenhouse gases (GHGs) emission [14,15]. According to Hooijer et al. [14], most of the CO2 emissions from peat decomposition came from Indonesia, mainly from Sumatra and Kalimantan. Meanwhile, peat fires are a critical perturbation that significantly impacts ecology, climate, and socio-economic [9,16,17,18]. Widespread peat fires in Southeast Asia resulted in substantial carbon emissions, with about 0.1 Gt per year [9]. In addition, fires within peatland have been responsible for losses of tree diversity [19], endangered mammals defaunation [20] (e.g., Sumatran orangutan [21]), and soil-organism extirpation [22].
El-Nino Southern Oscillation (ENSO) is vital in determining rainfall seasonality in the humid tropical region [23]. ENSO is climatic inter-seasonal variability associated with the interannual oscillations in sea-level pressure and intense excursions of the sea surface temperature in the eastern Pacific [24], which has three states (i.e., El-Nino, La-Nina, and Normal/Neutral) [25]. During the El-Nino years (i.e., the warming phase of the eastern Pacific Ocean), the maritime continent can experience a more extended dry season. Meanwhile, during the La-Nina years (i.e., the cooling phase), the onset of the monsoon is usually earlier than normal conditions [26]. Although ENSO is initiated in the tropical Pacific, it can affect the global climate system, with a more prominent signal than the other inter-annual climate variations [26]. Moreover, increasing temperature and dry weather during El-Nino events can potentially trigger wildfires [27,28].
In 1997 and 2015, the recurring catastrophic fires within the peat areas occurred during strong El-Nino events [15,27]. Previous studies showed the massive impacts of the strong El-Nino wildfires event in Indonesia, which produced enormous carbon emissions and prolonged smoke-haze episodes across Indonesia and neighboring countries [15,27,29], with economic costs in the range of USD 1.62–USD 2.7 billion [30]. However, fire emissions within the peatland also cascaded in La-Nina and Normal phases [31,32]. In addition, according to Murdiyarso et al. [32], most fires that occurred on Sumatra Island can be attributed to anthropogenic activities, which are significantly related to land-use policies. A recent study showed that Sumatra Island had the highest fire vulnerability [33]. Therefore, assessing peat vulnerability to fires based on multidimensional perspectives across Sumatra Island under various ENSO phases is crucial to eradicating global carbon emissions and achieving sustainable peat management.
Understanding the fire regime is essential to assessing forest regeneration potential, fire management, and human impacts [34]. There is little uncertainty that climate-induced disruptions to fires will occur [35], although a previous study showed a strong connection between fire and climate [36]. Fire needs biomass fuel to burn, atmospheric conditions to allow for combustion, and ignitions [37]. Climate variability can influence all of these descriptors in complex ways and over multiple temporal scales [35]. In addition, there is a common debate related to the driving factors contributing to the fire and the influences of land use policies in controlling fire regimes [38]. Thus, quantifying peat vulnerability to fires and understanding the underlying driving mechanisms is crucial to developing mitigation and adaptation strategies [39]. According to the Intergovernmental Panel on Climate Change (IPCC), vulnerability is the predisposition to be adversely affected by the hazard (i.e., peat fires), including sensitivity to harm and low capacity to adapt [40]. Fire vulnerability models are used to predict the degree of susceptibility using a set of observations as a function of external explanatory predictors, such as topographic, climate, biophysics, and anthropogenic predictors [41].
Previous studies have predicted fire vulnerability using several approaches, i.e., multicriteria analysis [42], an analytic hierarchy process [43], and non-parametric statistical test [44]. A recent study investigated wildfire susceptibility at the national level using multi-dimensional explanatory variables (i.e., climatic, biophysics, and socio-economic) for mitigation strategies [33]. However, they still used a scoring analysis to identify wildfire susceptibility, which has shortcomings in terms of statistical robustness. In recent years, the application of machine learning algorithms has rapidly increased, particularly in wildfire science and management [45]. Previous studies showed that machine learning had better performance than non-machine learning approaches [46,47,48]. The random forest algorithm was the most popular machine learning algorithm to predict fire vulnerability, followed by the maximum entropy, support vector machine, and boosted regression tree algorithms [45]. Song et al. [49] used a random forest algorithm to estimate fire occurrence in Hefei, China. Peters and Iverson [50] incorporate fine-scale drought variables into a wildfire model based on the maximum entropy framework in the eastern US. A previous study also used support vector machine and boosted regression tree to assess fire susceptibility across the Spanish Peninsula [51]. However, there is still a lack of studies providing a fire vulnerability assessment in the tropical maritime continent, particularly on Sumatra Island. In addition, a prior study showed that an ensemble model (i.e., the integration of multiple machine learning predictions) could increase predictability and reduce bias from the models [52]. However, their study was only elaborated on two different algorithms (i.e., random forest and support vector machine) to develop an ensemble.
In this study, we develop a map of peatland vulnerability to the fire of Sumatra under various ENSO phases (i.e., El-Nino, Normal, and La-Nina) using four different machine learning algorithms (i.e., random forest, support vector machine, maximum entropy, and boosted regression tree) and their ensemble. We also investigate the most critical aspect influencing their vulnerability to determine further actions that can be taken to reduce future wildfires in Sumatran peatland. This study incorporates the three underlying driving factors to fires (i.e., climatic, biophysical, and proxy to anthropogenic activities) following Forzieri et al. [39].

2. Materials and Methods
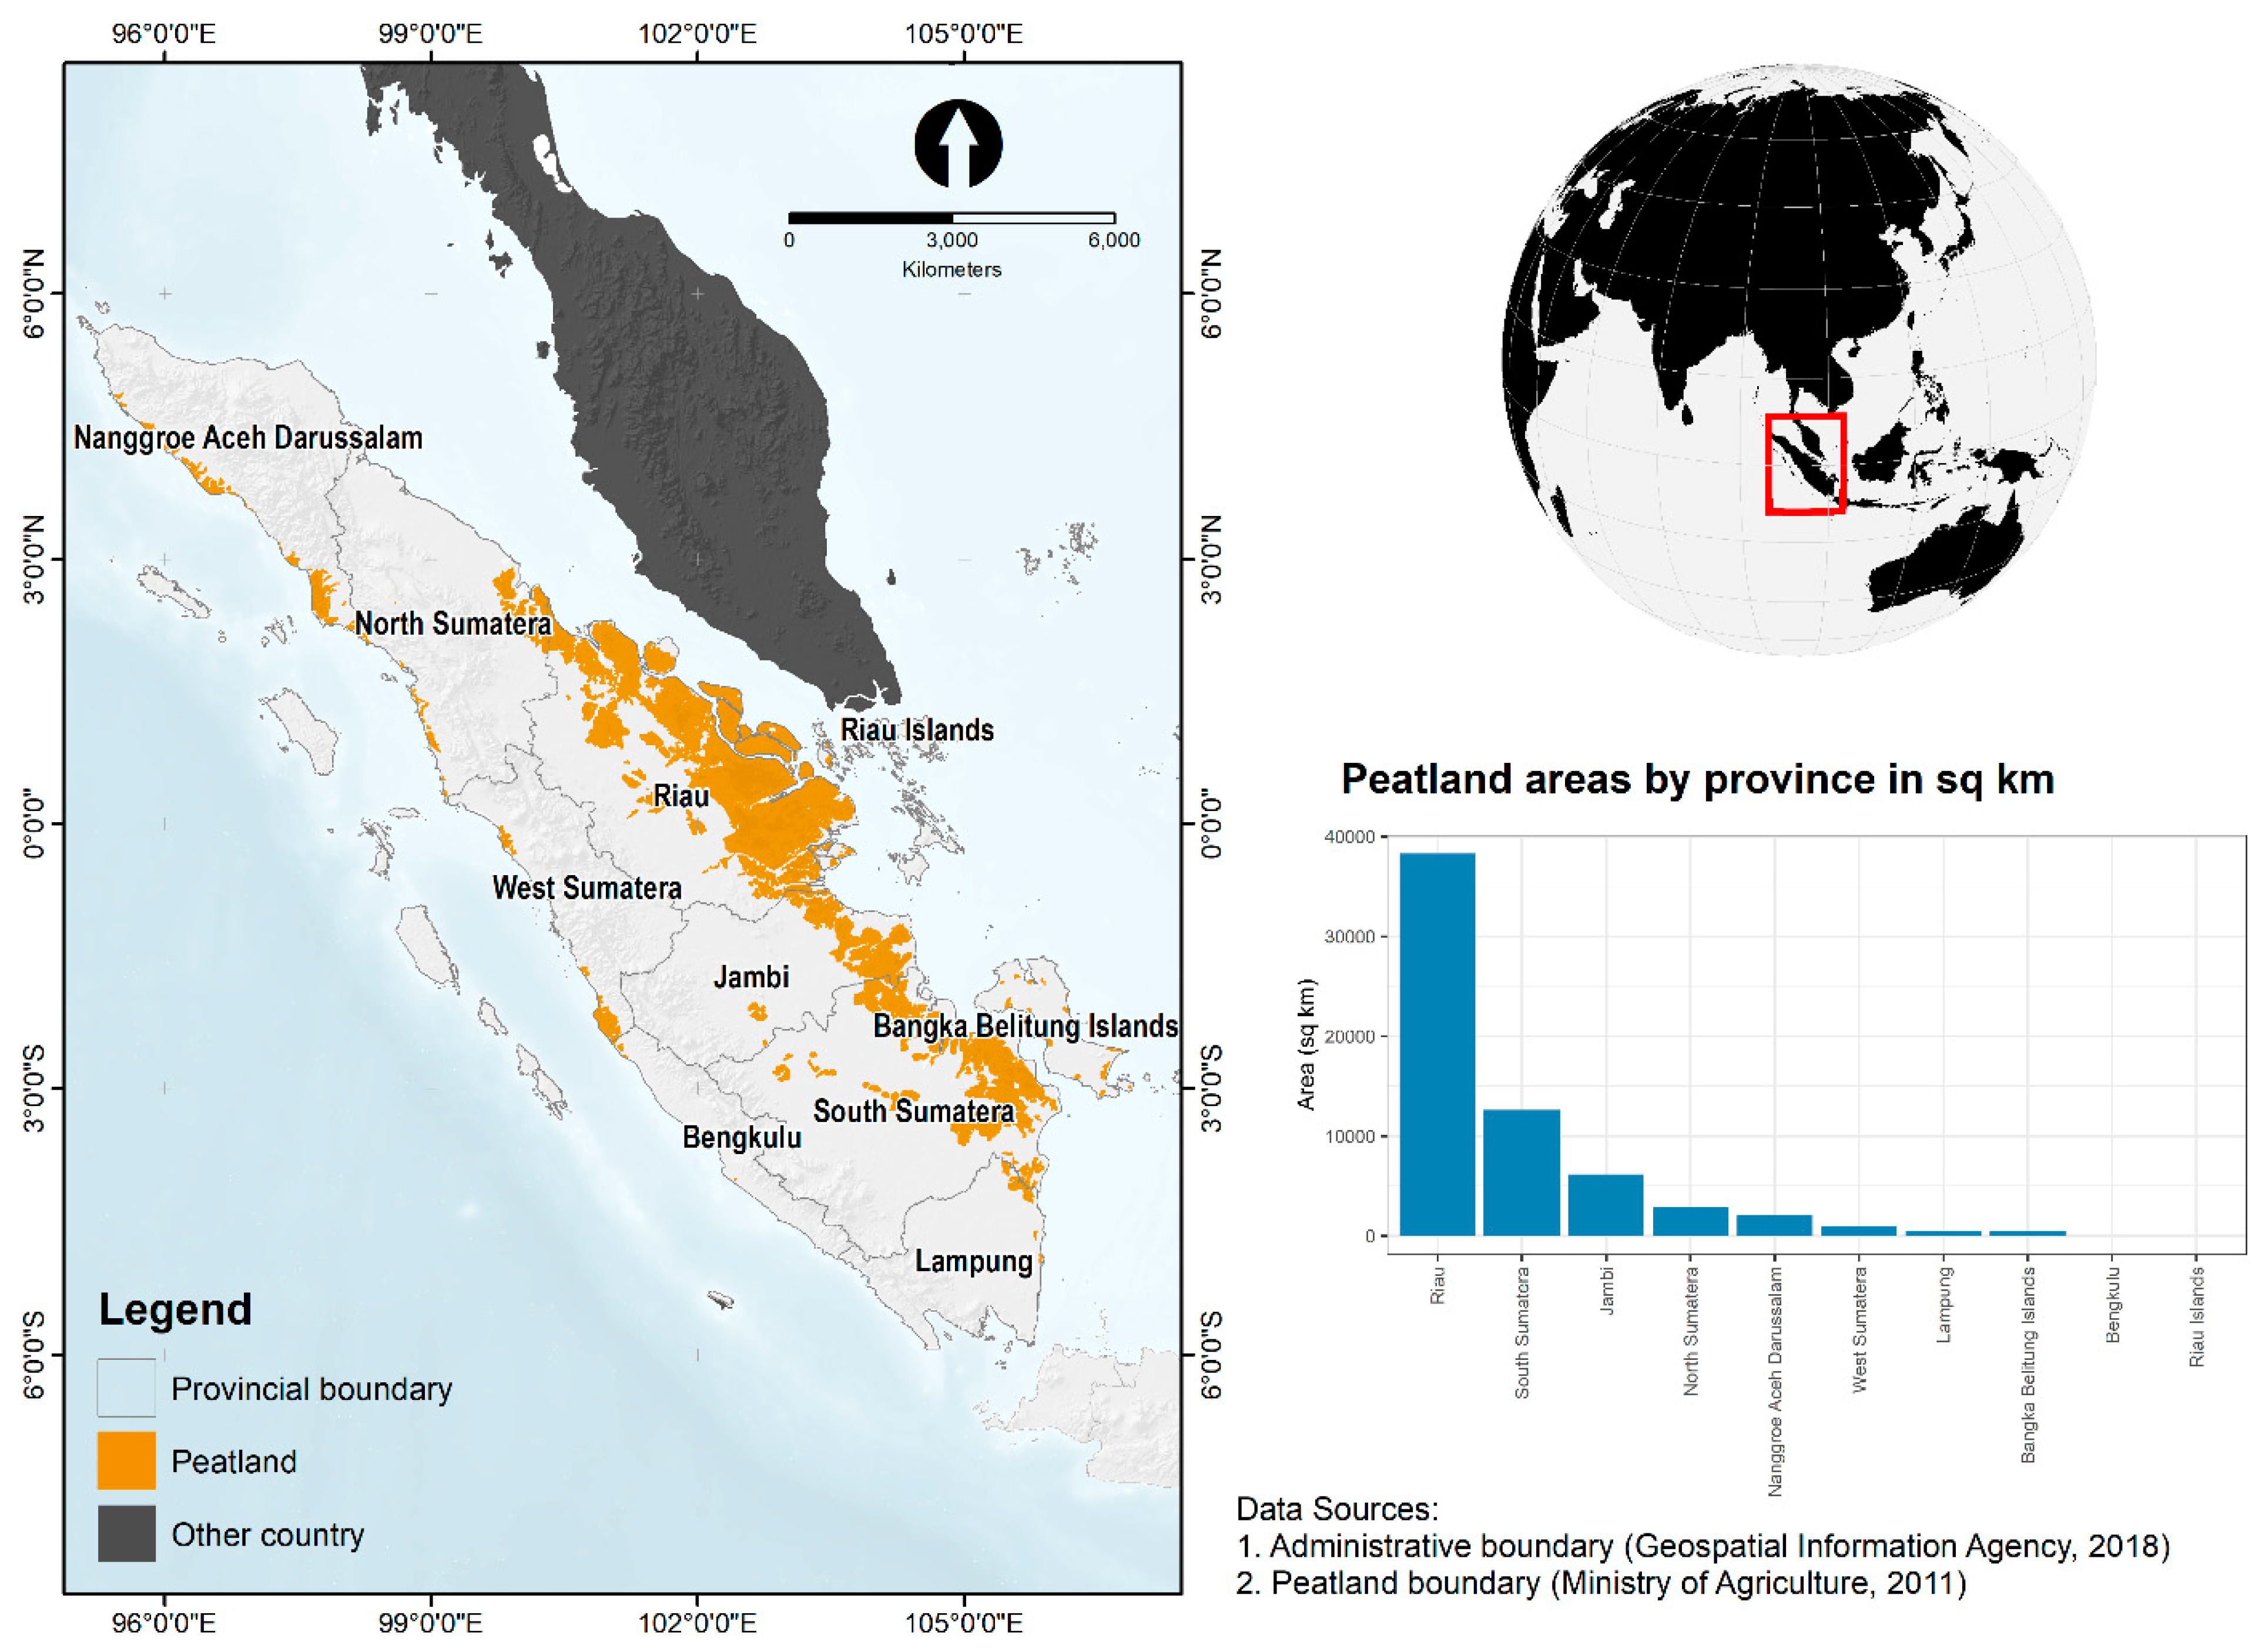
2.1. Study Area

This study focused on peatland extents in Sumatra (Figure 1), referred to using the peatland map published by the Ministry of Agriculture [53]. Peatlands in this area have been rapidly disturbed due to logging activities, fire, drainage, and conversion to plantation since the 1980s [54] which makes them more vulnerable to yearly fire activity [55,56]. Sumatran peatland covered about 63,832.55 km2, consisting of 202 Peat Hydrological Units/PHUs, which are spread across six provinces, mainly at Riau, Jambi, and South Sumatra, followed by Bengkulu, Bangka Belitung Islands, Riau Islands, Lampung, Nanggroe Aceh Darussalam, West Sumatra, and North Sumatra. PHU refers to the peat ecosystem that situated between two rivers as stated in Government Regulation No.57/2016, which highlights the ecosystem boundary as providing a new basis for peatland management [57].

2.2. Data Collection

We used the historical fire occurrences (in frequency) from the Visible Infrared Imaging Radiometer Suite (VIIRS) 375 m active fire product from Fire Information for Resource Management System (FIRMS), (https://earthdata.nasa.gov/earth-observation-data/near-real-time/firms/v1-vnp14imgt; accessed on 4 February 2022) and the Moderate Resolution Imaging Spectroradiometer (MODIS) active fire product (https://earthdata.nasa.gov/earth-observation-data/near-real-time/firms/mcd14dl; accessed on 4 February 2022), as the response variable to determine the level of fire vulnerability within the peatlands.
The hotspot data selection was conducted by plotting MODIS-based (Confidence level > 90%) or VIIRS-based hotspots (High confidence level) over the last 8 years (2012–2019). Using this selection process, 40,933 hotspots were obtained from VIIRS and 48,256 hotspots from MODIS. The filter process was continued by overlaying with GRID measuring (1 × 1) km2 and selecting grids that only contain one hotspot with a high confidence level of VIIRS and confidence level greater than 90% for MODIS. We conducted spatial autocorrelation (Global Moran’s I) [58] to reduce spatial autocorrelation [59] before input to the model and selected 8400 hotspot points.
Considering that fire events and severity are influenced by El-Nino Southern Oscillation (ENSO), we categorized our study period during 2012–2019 into El-Nino, La-Nina, and Normal phases. We defined ENSO years based on the Oceanic Nino Index (ONI) [60] which has become the standard by National Oceanic and Atmospheric Administration (NOAA) standard to identify El-Nino and La-Nina events. Table 1 indicates the yearly classification based on various ENSO phases.

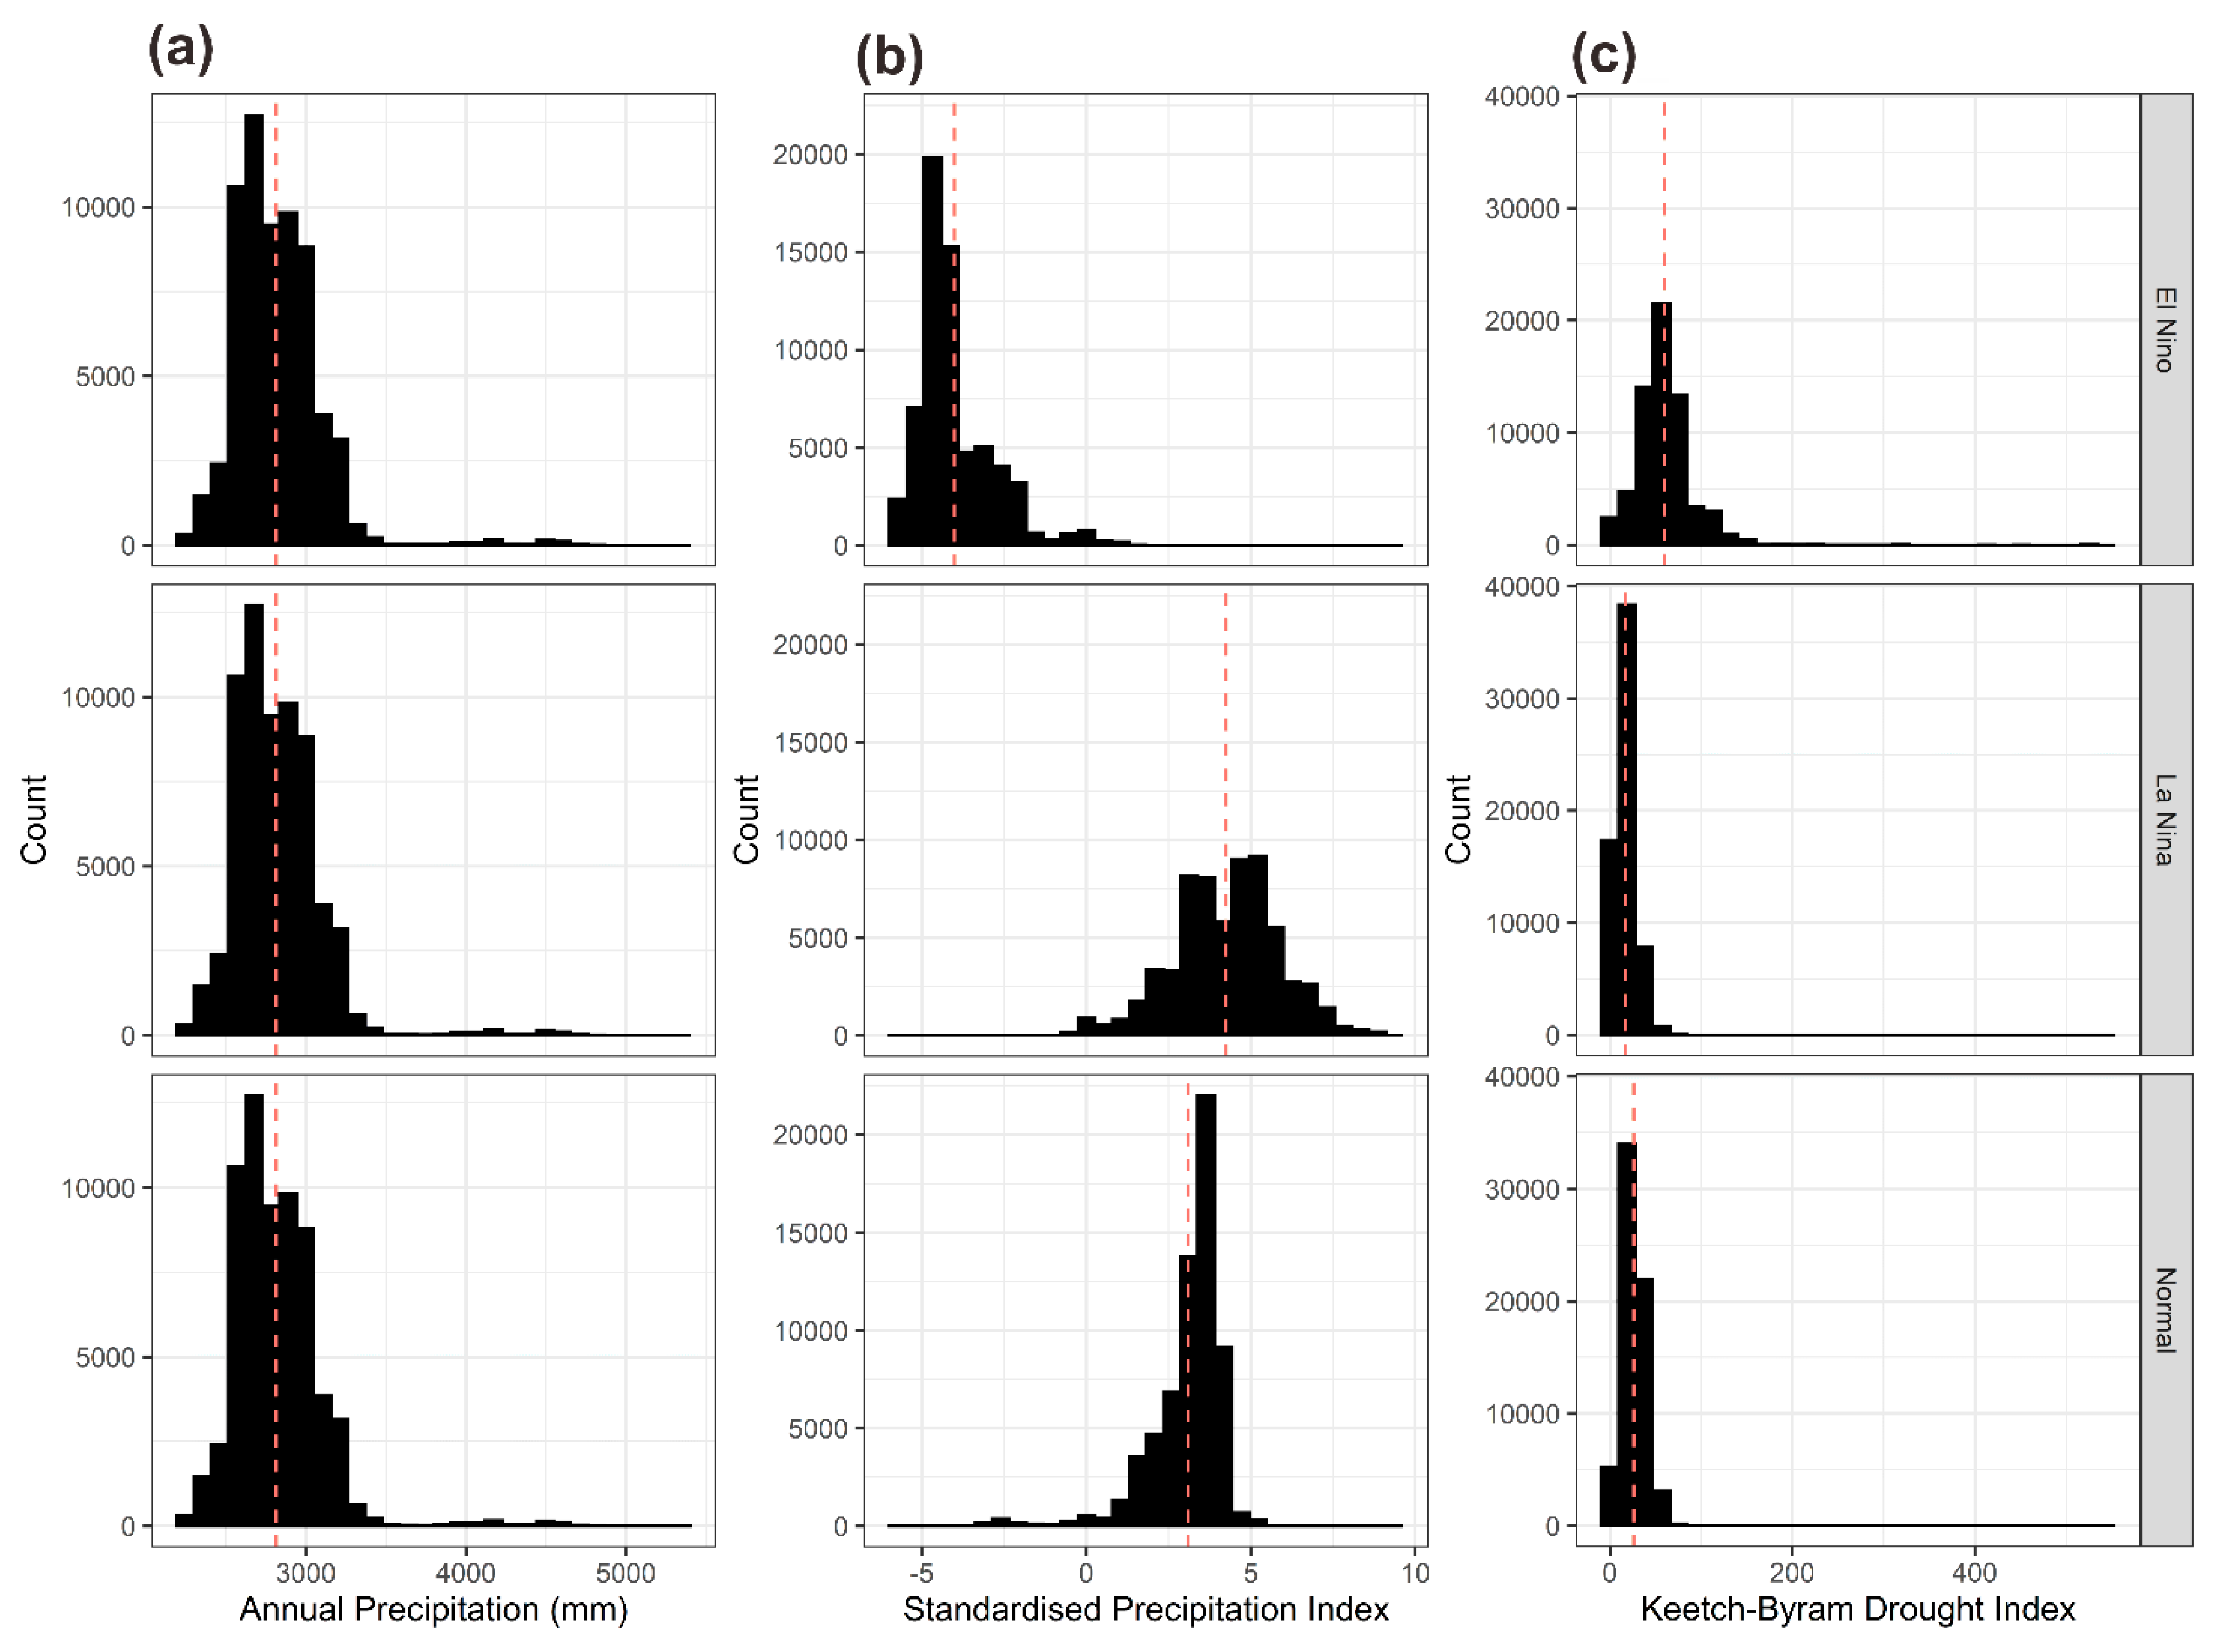
2.2.1. Climatic Variable Data

To capture climatic variability within the peat layers, this study used precipitation data retrieved from Climate Hazards Group Infra-Red Precipitation with Station data (CHIRPS) during our timeframe analysis (2012–2019) [61] with a spatial resolution of about 0.05° (~5-km). We used mean and standard deviation values of precipitation data for each ENSO scenario. This study performed statistical downscaling based on bias correction (Delta method) [62] since prior data of climate had a relatively coarse resolution. We used the high spatial resolution (~1 km) annual precipitation dataset of model output statistics combined with mechanistic processes (i.e., the CHELSA algorithm [63]). These data incorporate the effects of wind effects and, therefore allows for a better estimation of precipitation patterns. Moreover, we also used a standardized precipitation index (SPI) [64] to capture climatic anomaly signals from the rainfall during ENSO.
In addition, we used the Keetch-Byram Drought Index (KBDI), a continuous index to estimate the dryness of the soil and duff layers. This index increases for the accumulation of dry spells within the study area and decreases when it rains. Previous studies also used KBDI as an indicator for wildfires, particularly in peatland [65,66]. We retrieved the KBDI dataset that was developed by Van et al. [67] through Google Earth Engine [68] (Table 2).

2.2.2. Proxy to Anthropogenic Activities Variable Data

Undisturbed peat ecosystems are always water-saturated and therefore they are not prone to fire [34], but if they are disturbed by human activities in the form of forest exploitation, plantation, and agricultural land clearing, the level of vulnerability to fire increases, especially during El-Niño [34,69,70,71]. As a proxy to estimate the level of human disturbance on the peat ecosystem, we use the travel times to roads, forests, and cities rather than Euclidean distances [72] in order to obtain a better understanding of human activities within the peatland. This dataset also incorporates slope to represent the friction map [73], retrieved from Shuttle Radar Topography Mission (SRTM) [74]. We used OpenStreetMap data [75] as a point of interest (i.e., roads and cities) for distance–cost analyses. Furthermore, we used intact forest landscape data to define the ecological point of interest for accessibility [76]. In addition, we used a global human modification dataset that represents a cumulative measure of human modification towards terrestrial ecosystems [77]. Population data, retrieved from WorldPop, were also used in this study [78]. The proxy variable of human disturbance hereafter is called anthropogenic data (Table 2).

2.2.3. Biophysical Variable Data

This study used harmonized global maps of aboveground and belowground biomass carbon density [79,80]. The aboveground biomass map integrates land-cover specific, remotely sensed maps of forests, grassland, cultivation, and tundra biomass. The belowground biomass map similarly integrates matching maps derived from each aboveground biomass map and land-cover-specific empirical models. In addition, we also used several vegetation indices, namely, the Normalized Difference Vegetation Index (NDVI), Enhanced Vegetation Index (EVI), Normalized Difference Water Index (NDWI), Normalized Burned Ratio Index (NBR), and Soil Adjusted Vegetation Index (SAVI), retrieved from Nadir BRDF-adjusted MODIS reflectance (MCD43 product). We also used topographical data retrieved from Farr et al. [74] to capture slope and elevation.
As a proxy, to represent the amount of biomass/fuel load, we used the aboveground biomass (AGB) map and belowground biomass (BGB) data from the Spawn et al. [80] map (Table 2).
Table 2. Predictor used for the modelling.
NoFeatureVariableUnitSource
1ClimaticAnnual Precipitation (Average)mm[61]
2 Annual Precipitation (Std)mm[61]
3 Annual Standardized Precipitation Index (SPI)-[61,64]
4 Annual Keetch-Byram Drought Index (KBDI)mm[67]
5Proxy to anthropogenic activitiesAccess to roadday[75]
6 Access to forestsday[76]
7 Access to citiesday[75]
8 Human modification index-[77]
9 Human populationhead[78]
10BiophysicalBelow ground biomass (BGB)Mg C per ha[80]
11 Above ground Biomass (AGB)Mg C per ha[80]
12 Elevationm asl[74]
13 Slopedegree[74]
14 NBR-[81]
15 EVI-[82]
16 NDVI-[82]
17 NDWI-[83]
18 SAVI-[84]

2.3. Variable Selection

Variable selection performing multicollinearity analysis is commonly used in analysis with high-dimensional data [85,86]. This is because the multicollinearity that occurs in two or more variables will increase the standard error, unreliable model, and weak predictive ability [86,87,88,89,90,91,92,93,94,95,96]. Therefore, the degree of collinearity can affect the estimation of model coefficients and interpretation of the model [97]. To overcome this issue, we conducted a variable selection for all proposed covariates (e.g., climate, anthropogenic, and biophysical features) using Pearson correlation [87]. We used the Pearson correlation cut-off of 0.7 to filter out highly correlated predictors for the selection of variables.

2.4. Vulnerability Modelling and Evaluation

Models were calibrated with ENMTML R package [98], running four algorithms with a range of different machine learning techniques [99,100,101,102], i.e., Support Vector Machine (SVM), Maximum Entropy (MXD), Boosted Regression Tree (BRT), and Random Forest (RDF) to construct the probability of fire occurrence based on active-fires hotspots, based on a coupled MODIS-VIIRS dataset with confidence levels of greater than 80% [34]. Background points were randomly sampled within the study area based on the geographical and environmental constraints, following Barbet-Massin et al. [103]. We used a mobility-oriented parity analysis [104] to extrapolate geographical locations to assess the model’s transference onto various ENSO phases. Higher probability values indicate areas more vulnerable to fires. To deal with overprediction, we incorporated spatial constraints into our models with a peatland map across Sumatera Island from the Ministry of Agriculture of Indonesia [53,105]. Moreover, we also conducted an ensemble model from all machine learning algorithms based on a PCA-based ensemble that performs a principal components analysis of selected suitability maps according to Sørensen value and used the first component as the result [106].
We evaluated the models using five discrimination metrics: area under the curve (AUC), true skill statistic (TSS), and Sørensen similarity indices. A previous study showed that the use of TSS can be misleading regarding model performance due to its dependency on prevalence [107]; thus, we considered Sørensen’s similarity index (F-measure), as proposed by Leroy et al. [107], to evaluate the model. This study transformed continuous output from the model into binary maps to assess model performance based on a suitability value that maximizes the Sørensen index [107].
In this study, we overlaid maps of high and very-high vulnerability to fires with existing land-cover data within the peat areas to investigate further management of wildfire prevention based on land-cover information. We used the Climate Change Initiative (CCI) land cover dataset in 2019 from European Space Agency (ESA) with a spatial resolution of about 300-m per pixel (available from https://maps.elie.ucl.ac.be/CCI/viewer/; accessed on March 16, 2022). CCI land cover [108] contains 22 land-cover classes, retrieved from Medium-Resolution Imaging Spectrometer (MERIS), Advanced Very-High Resolution Radiometer (AVHRR), SPOT-Vegetation, and Proba-V satellites. Then, we reclassified land-cover classification into the six Intergovernmental Panel on Climate Change (IPCC) land categories, i.e., cropland, forest, wetland, urban, shrubs, and others, as suggested by [109].

3. Results

3.1. Variable Selection

Figure 2 showed pairwise variable analysis under three ENSO phases (i.e., El-Nino, Normal, and La-Nina). We found several variables that had strongly correlated with each other, particularly in the spectral indices of biophysical data. Under El-Nino and La-Nina phases conditions, NDVI-NBR, NDWI-NBR, NDVI-EVI, SAVI-NBR, and SAVI-EVI showed a very strong correlation. Meanwhile, under normal conditions, only NDVI-EVI, SAVI-NDVI, and SAVI-EVI were correlated (|r| > 0.7; p-value < 0.05).
Due to this collinearity issue of the spectral indices, we only selected NBR from all spectral indices for consideration in the model. A previous study also revealed that NBR showed a good performance for burn areas or fire event indicators [110]. Wang [111] also showed that spectral indices such as NDVI, EVI, and SAVI encountered multicollinearity issues. Similarly, NDWI, which represents water content, was also negatively correlated with NBR. Therefore, we considered using NBR as a model predictor. Alademomi et al. [112] also found a high collinearity between NDVI and EVI.
We also found highly correlated predictors between AGB-BGB and SPI-Precipitation (STD). We selected BGB and SPI as the selected predictors to capture peat depth and climate variability within the location, respectively. This study selected SPI because it could capture the variability in drought conditions under El-Nino, La Nina, and normal conditions compared to the annual precipitation (Figure 3a). SPI averages were −4.0, 4.0, and 3.1 under El-Nino, La-Nina, and Normal phases. Meanwhile, the annual precipitation did not significantly differ under El-Nino, La-Nina, and normal conditions. KBDI was also significant under various ENSO phases. KBDI averages were 59.3 mm, 16.4 mm, and 25.9 mm under El-Nino, La-Nina, and Normal phases, respectively (Figure 3).
Considering the above analysis, thus, 12 out of 18 uncorrelated input variables (i.e., Precipitation (Average), SPI, KBDI, access to road, access to forests, access to cities, human modification, human population, below ground biomass, elevation, slope, and NBR) were selected for further analysis of model selection. The use of uncorrelated variables will eliminate data redundancy and reduce errors during analysis [113].

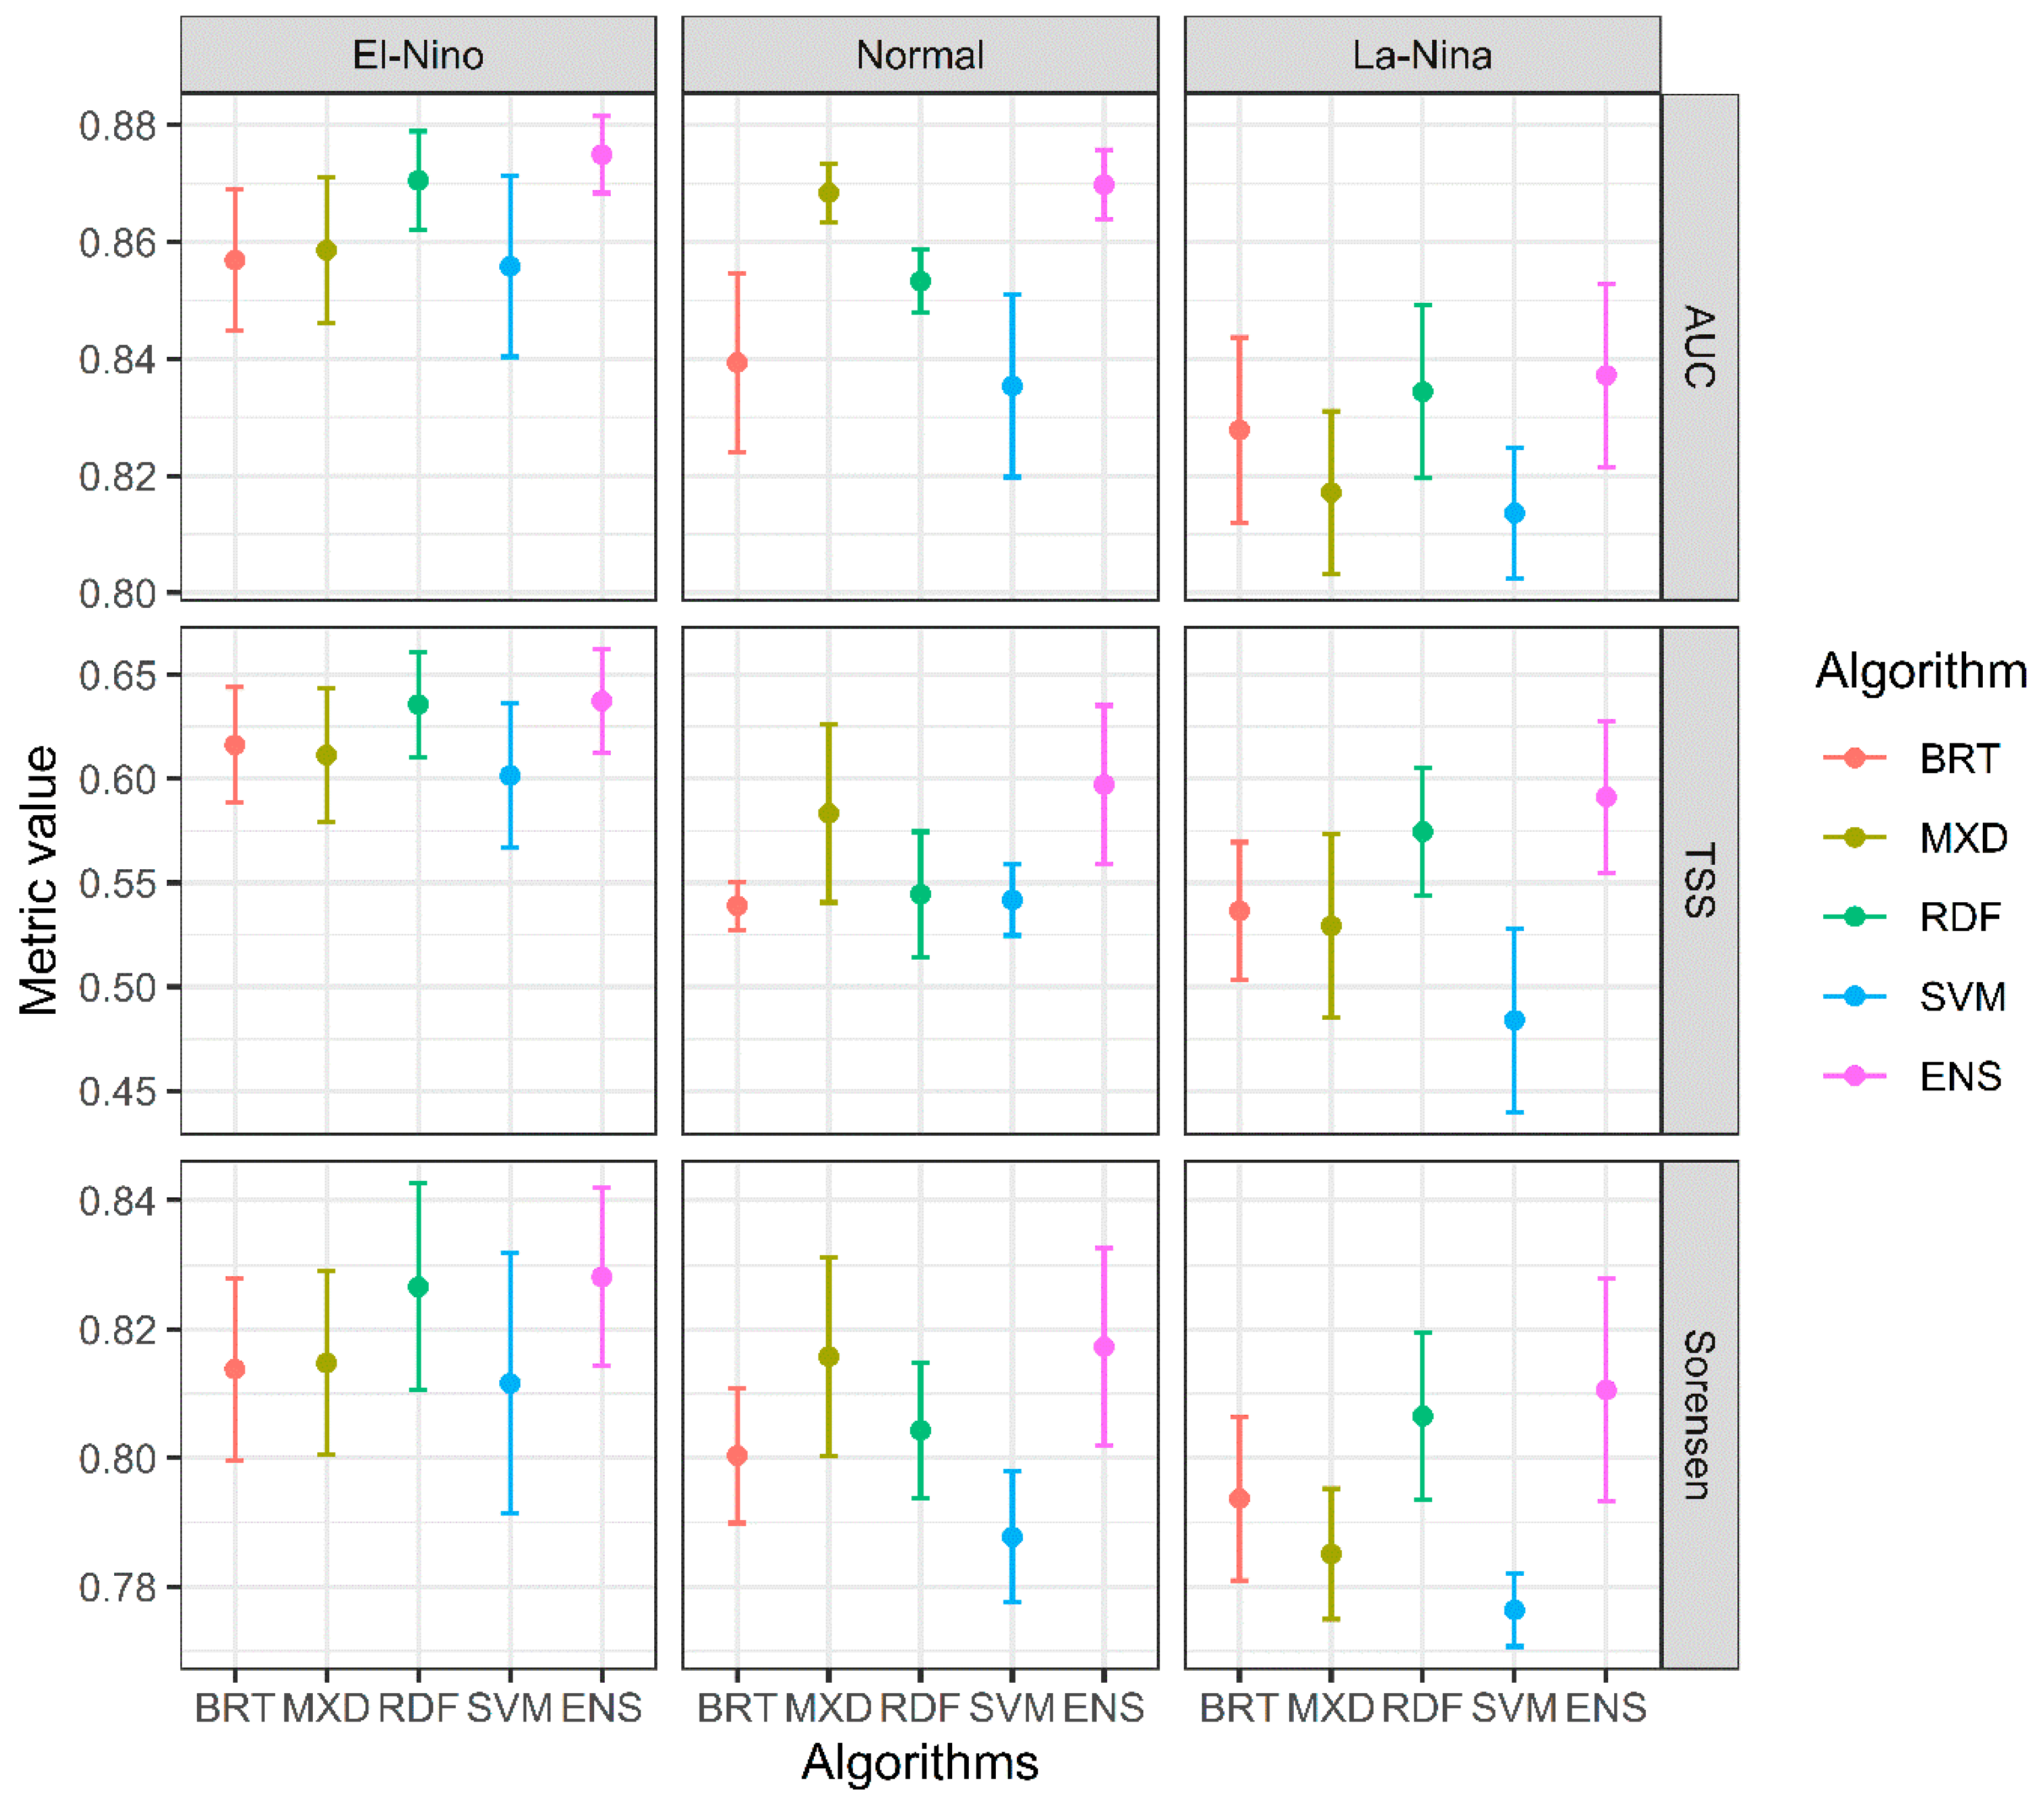
3.2. Model Evaluation

Figure 4 shows the results from testing the performance of several algorithms under various ENSO phases. The performance of all algorithms is excellent in all ENSO phases, as indicated by the average AUC value of 0.85 (ranging from 0.81 to 0.87). Based on AUC, there is a tendency for models under the El-Nino phase to obtain a better performance, followed by the Normal and La-Nina phases.
The average TSS value of all algorithms under all ENSO phases is 0.57 (ranging from 0.48 to 0.64). From the TSS metric, the performance of the model is generally better under the El-Nino phase, followed by the Normal and La-Nina phases. A widespread fire event during El-Nino can improve the detectability of fires and thus increase the model performance.
The average Sorensen index value of all algorithms in all scenarios is 0.81 (ranging from 0.79 to 0.83). Comparing the Sorensen values, there is a tendency for the model to perform better in the El-Nino phase, followed by the Normal and La-Nina phases. Furthermore, in a comparison among algorithms, the Ensemble model showed the best performance under all ENSO phases (Figure 4).

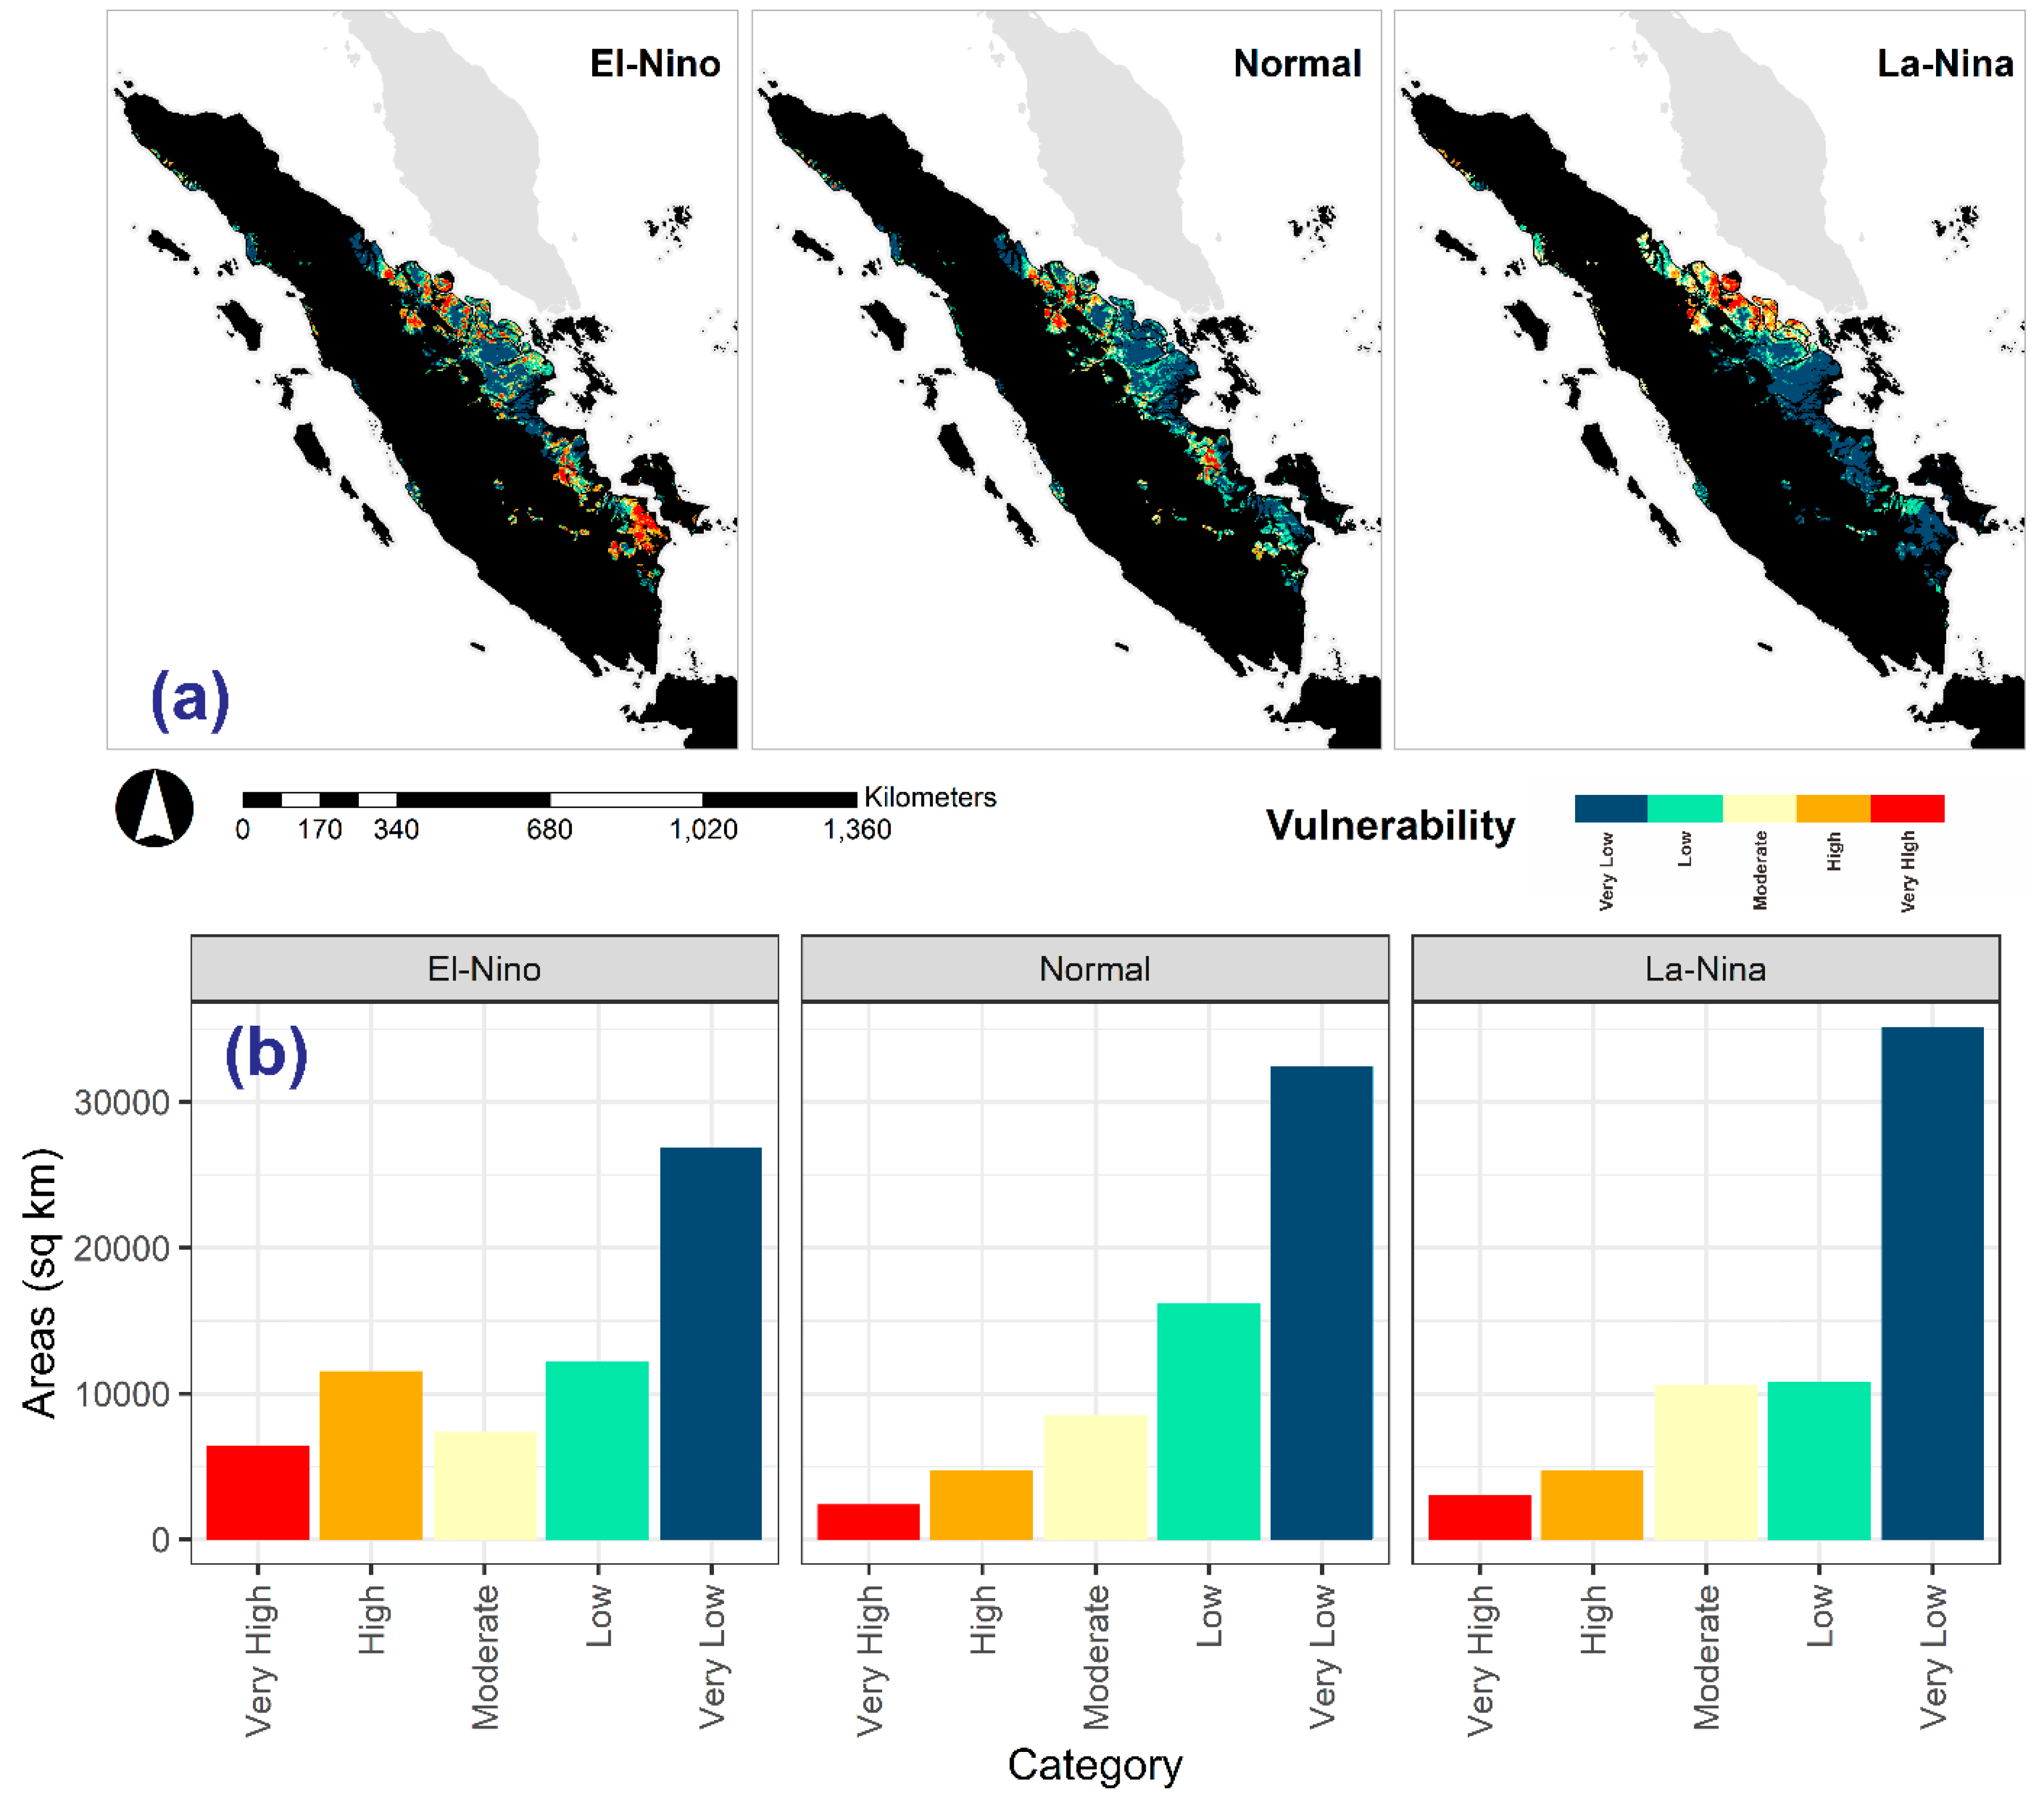
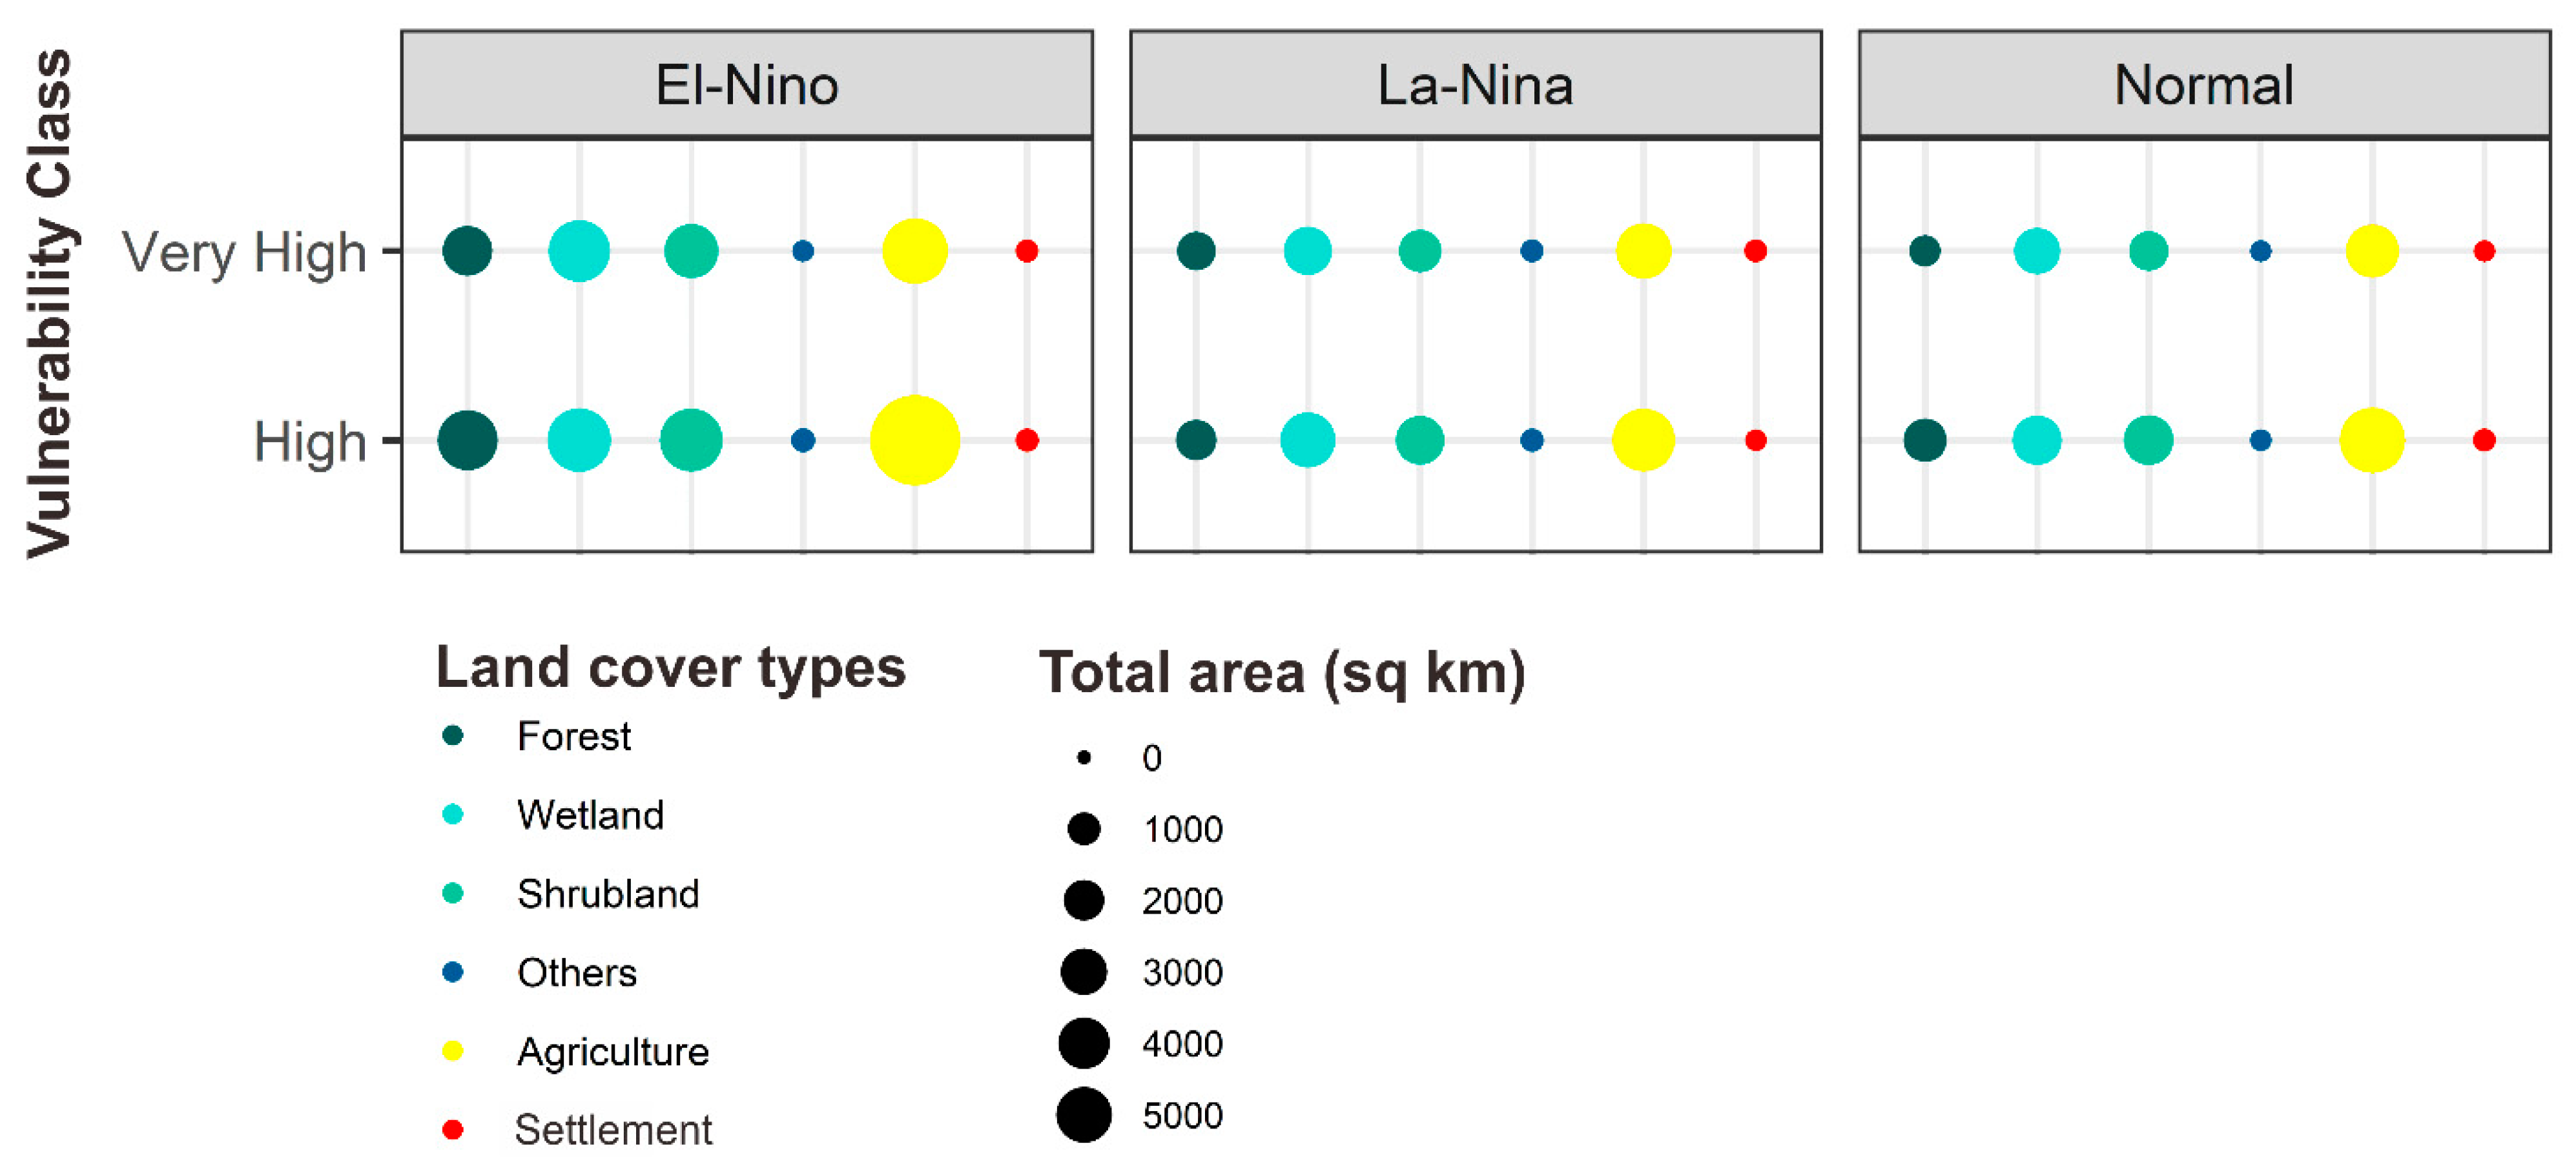
3.3. Peat Vulnerability to Fires

The vulnerability of peatland to fire maps under various ENSO phases was generated from the ensemble model with a continuous scale ranging from 0 to 1. The greater the value, the higher the level of vulnerability. Overlaying these map data with hotspots showed the correspondence between the frequency of fire occurrences and the level of vulnerability—the more vulnerable, the greater the frequency of the fire occurrence (Figure 5). Regarding the response of variables, it shows that the higher the NBR, and the human population, the higher the level of vulnerability in all ENSO phases (Figure S1).
Further, the map was converted into a fire vulnerability map with five vulnerability classes based on quantile following Sakti [33], and classified into very low, low, medium, high, and very-high classes of vulnerability (Figure 6). Based on Figure 6, it was apparent that the areas in the high and very-high categories during El-Nino are more than two times higher than Normal and La-Nina phase conditions. On the other hand, we found broader areas to have very low vulnerability to fires during La-Nina.
Based on the El-Nino phase, we found that Sumatran peatland areas covered 18% and 10%, belonging to high and very-high vulnerability, respectively. Based on the La-Nina phase condition, we found that Sumatran peatland areas with 7% and 5% coverage have high and very-high vulnerability, respectively. Furthermore, the Normal phase of ENSO showed that Sumatran peatland areas with 7% and 4% coverage have high and very-high vulnerability, respectively. We indicated that El-Nino phases could significantly increase the vulnerability to peat fires (about two times higher than the Normal and La-Nina phases). The Wilcoxon tests showed a significant discrepancy between the high and very high peat fire vulnerability under various ENSO phases (p-value < 0.05).
An overlay analysis can identify areas with high and very-high classes in all ENSO phases. The land category of high peat fire susceptibility is typically seen in cultivation areas (57.74%), shrubs (18.63%), wetland (15.86%), forest (7.71%), and a small proportion of settlement (0.05%) (Figure 7). The area is primarily located on Riau (97.38%), followed by Aceh (2.10%) and South Sumatra (0.52%) (Figure 8). The elevated susceptibility to fires is distributed in PHU Sungai Rokan—Sungai Siak Kecil (46.11%), PHU Sungai Barumun—Sungai Kubu (12.65%), PHU Sungai Rokan Kiri—Sungai Mandau (12.01%), and PHU Batang Rokan Kiri—Batang Sosa (10.42%) in Riau Province (See Table S1 for further detail). This study showed that high or very high vulnerability to peatland fires mainly occurred in agriculture and shrubs, indicating that the degraded areas were more prone to fires rather than undisturbed ecosystems.

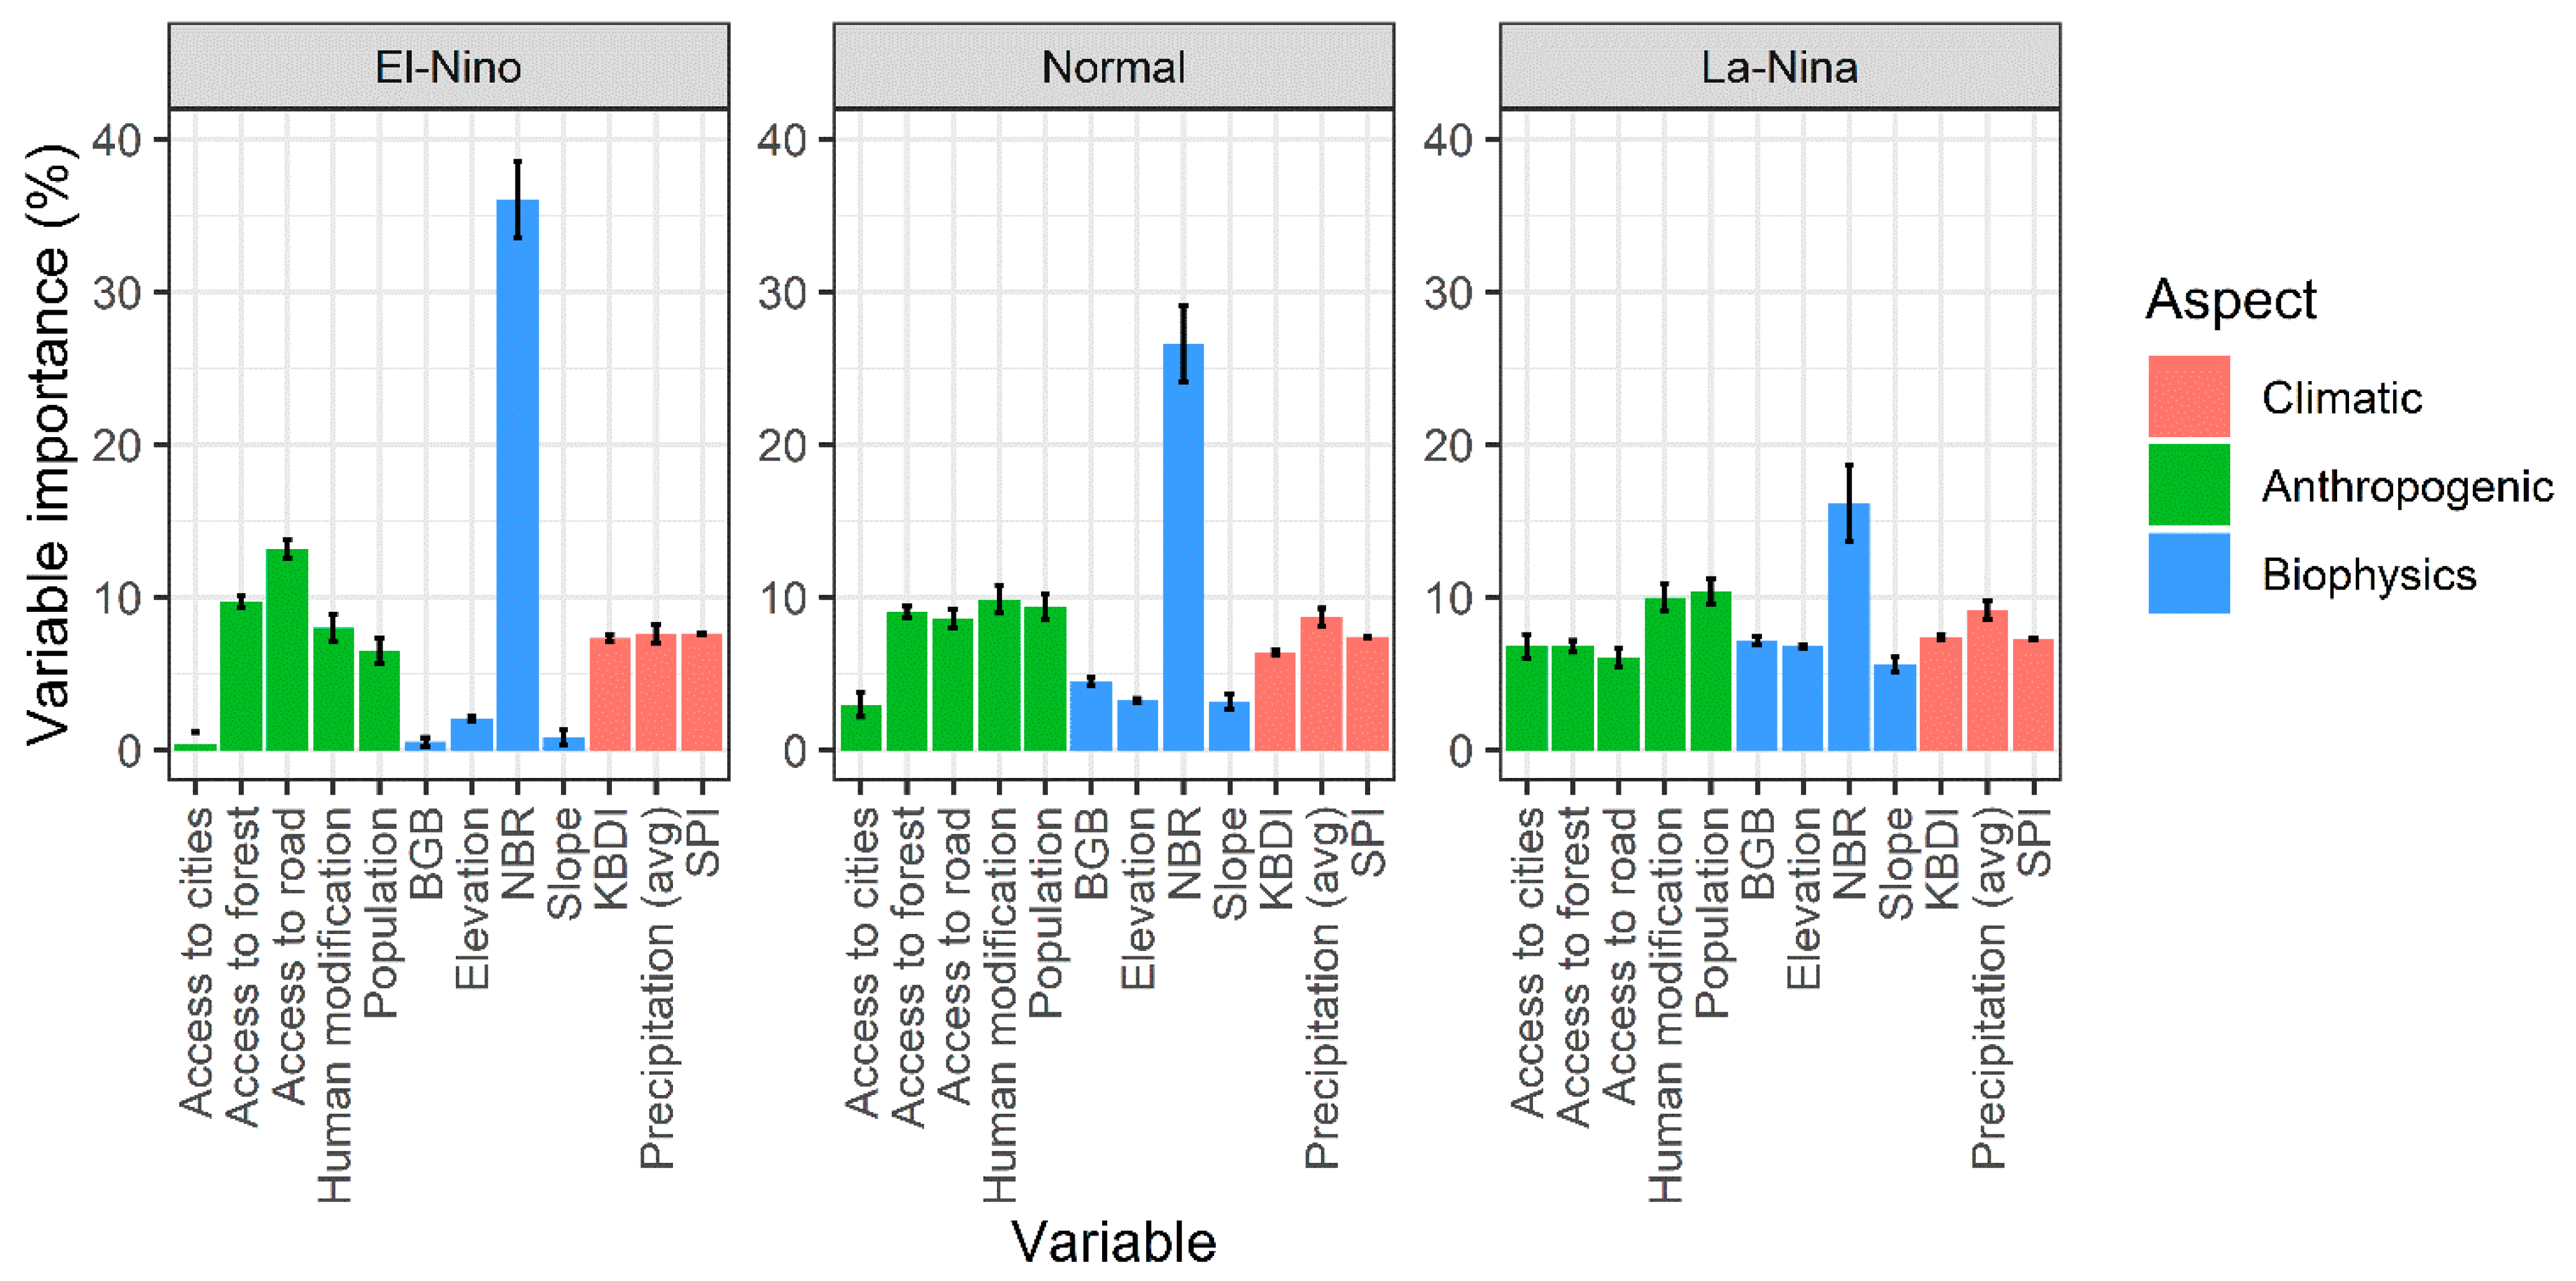
3.4. Variable Contribution

This study found the discrepancy of the variable contributions under various ENSO phases (i.e., El-Nino, Normal, and La-Nina phases). However, the role of NBR is always higher than the other variables under all ENSO phases. Other important factors include access to roads (13.15%), human modification (9.87%), and population (10.40%) for the El-Nino, Normal, and La-Nina phases, respectively (Figure 9 and Table S2).

4. Discussion

Climate change derived from altered land-use is threatening the tropical peatlands [114]. A recent study found that the positive Indian Ocean Dipole (IOD), combined with El-Nino phases caused the greenhouse-gas emissions from intact peatland to significantly increase [114]. Due to climate change, the vulnerability of peatlands to fire is accelerating [115,116]. A previous study also showed that El-Nino event could amplify the risk of wildfire [117]. Hydrological approaches (e.g., groundwater levels) have been widely used to indicate fire warnings within the peatland [28]. However, they could not capture the spatial patterns of the peat fires regime [66]. A recent study developed wildfire vulnerability based on national-scale multidimensional parameters using a scoring approach [33]. Nevertheless, they cannot capture inter-seasonal climatic variations due to the limited timeframe used in their study. Therefore, we developed a map of the vulnerability of peatlands to the fire in Sumatra under the various conditions of El-Nino Southern Oscillation (ENSO) phases and investigated the most important aspect that influences their susceptibility to determine further actions for reducing future wildfires in Sumatran peatland.
To quantify the vulnerability of Sumatran peat to fires during the various ENSO phases, we ensembled models based on various machine-learning approaches. However, it is also important to select good predictors for the machine-learning approaches [118] prior to running the machine-learning approaches to simplify the model. Sakti [33] provided a new, multidimensional approach to spatial prioritization for wildfire mitigation at the national scale. However, their estimation of wildfire susceptibility still relies on equal-weighted analysis, leading to biased output interpretation. The use of many variables without a good treatment of predictor collinearity is prone to error [87]. Our approaches performed a multicollinearity analysis, preprocessing the predictors to overcome several errors and misleading the model. Furthermore, this study found that the ensemble model was outperformed compared to other algorithms, which were Boosted Regression Tree (BRT), Maximum Entropy (MXD), Random Forest (RF), and Support Vector Machine (SVM). The principle of the ensemble model is to aggregate the insights obtained from multiple learning models. This algorithm’s predictive performance is greater than any individual classifier [119], although most of the models showed a relatively good performance. Machine learning approaches could potentially be used for peatland management in wildfire mitigation strategies within peatland [45].
The vulnerability maps across Sumatran peatland suggest that further mitigation actions should consider the ENSO phases due to their different patterns. During El-Nino, high and very-high susceptibility were found in all provinces and mostly in Riau (49.82%), South Sumatra (40.41%), and Jambi (6.26%). Meanwhile, under La Nina condition, the areas with a high level of vulnerability were only found in Riau (95.87%) (Figure 6). Under the normal phase, areas with high and very-high vulnerability are relatively very low, and spread across Riau (64.24%), Jambi (16.71%), and South Sumatra (15.44%). In the past few decades, peat degradation and land cover change due to anthropogenic pressures in Sumatera led to catastrophic fire events [120,121,122]. Our findings show the importance of intact forest in avoiding wildfires within the peatland. Moreover, we found that cultivation areas within the peatland were considerably responsible for their high fire vulnerability. Other study also revealed that agricultural practices within the peatland can enhance recurrent fires activities and extensive burning [34]. The greenhouse-gas measurement within Sumatran peatland also revealed that degraded peatland had a greater carbon dioxide emission than undisturbed peatland [114]. Thus, preserving the remaining undisturbed forest within the peatland is crucial to reducing greenhouse-gas emissions [114]. By ascertaining the locations of each PHU, mitigation actions can be more efficient.
We found that NBR was the most essential variable in the assessment of peatland vulnerability to fires in all ENSO phases. NBR is a variable that is widely used in fire studies [123,124,125]. A recent study also revealed that NBR can effectively depict burned areas within the tropical region [110]. The NBR value is influenced by climatic conditions since it is related to the water content of vegetation or soil [126]. If the vegetation is under stress due to drought, the reflectance of NIR value will be very low, while the SWIR value is high; therefore, the NBR value will be low or even negative [127,128]. Mitigation actions that can be taken is to keep the peat in wet conditions, for example, by blocking canals to avoid over-draining, especially during El-Nino [129,130].
KBDI has commonly been used as a fire warning indicator due to its sensitivity in response to hydrological drought [66,117]. KBDI and SPI have shown a high level of performance in depicting different ENSO phases (Figure 3). Understanding the fire behaviors within peatlands related to hydrological and meteorological parameters is crucial to fire risk management [131]. Recent studies also revealed the importance of coupled observational water table data with climatic indices used for drought-fire assessment [66,131]. Although we do not rely on groundwater level data in this study, our results plausibly demonstrate peatland’s susceptibility to fire under various ENSO phases.
Anthropogenic (human disturbances) activities based on a human population, accessibility to roads, and human modification index had an important effect on peatland’s susceptibility to fires. The demand for more food rises as the population increases, leading to human modifications such as fossil fuel combustion [132] while clearing land for agricultural purposes. A previous study also confirmed that fire occurrences over the forest areas in the local region of Sumatra were mostly influenced by human activities [133]. The slash-and-burn technique that was commonly used by the most Sumatran traditional community that can lead to wildfires and thick haze [134]. Both small-holders and massive industrial plantations, such as the palm oil, timber (pulp and paper), and logging industries with concession covering 21% of land area, are commonly considered to contribute to fire events in Sumatra, particularly in the peatland [135].
Understanding peatland’s resilience to anthropogenic activities plays a pivotal role in reducing the harmful impacts from peatland degradation through mitigation strategies [1]. Our findings highlight Riau’s peatland as the most vulnerable area to fires in Sumatra Island. The previous study showed that powerful government and business actors could strongly alter socio-environmental factors within the complex Sumatran peatland ecosystem [121]. The Peat Restoration Agency of Indonesia was developed in 2016 to tackle multifaceted problems in the peatland through restoration, i.e., rewetting, revegetation, and revitalization of the local community [136]. Canal blocking became the first safeguard for degraded peatland restoration [120], particularly in areas with high susceptibility to fire. Afterwards, in the areas with recurrent historical fires (i.e., very-high susceptibility), revegetation is needed using native species to manage peat properties before planting [137]. Moreover, local communities in the surrounding peatlands have already conducted the slash-and-burn activities for more than a century [122]. Thus, effective revitalization should be implemented to enhance community livelihood, such as paludiculture [138]. Our studies provide spatially explicit information to support the management of wildfires in peatland, and particularly to identify the priority of peat restoration. Protecting undisturbed peatland based on the model through strong policies such as imposing a moratorium is also crucial to coping with global climate change [1,114].

5. Conclusions

Calculating peatland vulnerability to fires and understanding the underlying drivers are essential to developing sustainable peatland management and mitigation strategies. However, several previous studies have failed to capture inter-seasonal climatic variations due to their limitation in providing an excellent temporal dataset for the model. Previous studies on peatland fire vulnerability have relied on subjective approaches and lack statistical robustness. Therefore, this study used multiple dimensions of drivers (i.e., climatic, biophysics, and anthropogenic) to capture peatland susceptibility to fires based on ensembled machine learning approaches.
An ensemble model based on various machine learning algorithms (i.e., random forest, support vector machine, maximum entropy, boosted regression tree) showed a great performance in depicting fire vulnerability within Sumatran peatlands compared to a single algorithm. The results showed that NBR made the highest contribution to the fire’s susceptibility within the Sumatran peatland in all ENSO phases, followed by distance to roads, human modification, and population for the El-Nino, Normal, and La-Nina periods, respectively. We found that the high to very-high susceptibility of peatlands to fires increases during El-Nino conditions, and most of this area is agricultural area and shrubs. The peatland ecosystem in Riau Province is the area most vulnerable to fires on Sumatra Island. Furthermore, we also found shifting patterns of fire vulnerability under various ENSO conditions, which implies the dependency of climate variability (i.e., ENSO) on fire susceptibility within peatland.
We reflect on this study’s potential to have a significant impact on the peatland regulations. Our peatland susceptibility to fire maps can be used by the government (i.e., the Peat Restoration Agency of Indonesia) as a spatial recommendation plan in the national commitment to achieving the GHGs’ reduction target (i.e., net sinks by 2030) by eradicating emissions from fire and peat decomposition by enhancing peatland management systems. Moreover, the sustainable cultivation activities within the existing peatland and restoration efforts (i.e., canal blocking, revegetation, and revitalization) should be performed in the appropriate areas to minimize the negative impacts of peat degradation. Further investigation of the other atmospheric oscillations that could potentially increase peatland susceptibility to fires (e.g., Indian Ocean Dipole) should be conducted in future studies.

Supplementary Materials

The following are available online at www.mdpi.com/article/10.3390/f13060828/s1. Figure S1: Response curves depicting the relationship between peatland vulnerability to fires (in probability) and all predictors during El-Nino, Normal, and La-Nina phases, Table S1. The areas with high and very-high vulnerability classes of peatland fires under all ENSO conditions based on peat hydrological units, Table S2: Variable contribution scores for the peatland vulnerability to fires under different ENSO phases based on ensemble model.

Author Contributions

Conceptualization, L.B.P., E.I.P. and D.M.; methodology, L.B.P., Y.S., K.K. and E.I.P.; software, N.H. and A.A.C.; formal analysis, K.K., A.A.C., N.H., A.R. and A.K.W.; writing—original draft preparation, Y.S. and A.A.C.; writing—review and editing L.B.P. and D.M.; visualization, A.A.C., A.R. and Y.S.; supervision, D.M.; funding acquisition, D.M. All authors have read and agreed to the published version of the manuscript.

Funding

This research was funded by the United States Agency for International Development (USAID) (AID-BFS-G-11-00002) through the Sustainable Wetlands Adaptation and Mitigation Program (SWAMP) of the Center for International Forestry Research (CIFOR).

Institutional Review Board Statement

Not applicable.

Informed Consent Statement

Not applicable.

Data Availability Statement

The data presented in this study are available on request from the corresponding author.

Acknowledgments

We would like to express our gratitude towards: (1) NASA/GSFC/Earth Science Data and Information System (ESDIS) for providing near real-time active fire data from MODIS and VIIRS; and (2) Marliana Tri Widyastuti from the Sydney Institute of Agriculture, The University of Sydney, Sydney, Australia for the insightful comments and suggestions to a draft of the manuscript.

Conflicts of Interest

The authors declare no conflict of interest.

References

  1. Murdiyarso, D.; Lilleskov, E.; Kolka, R. Tropical peatlands under siege: The need for evidence-based policies and strategies. Mitig. Adapt. Strateg. Glob. Chang. 2019, 24, 493–505. [Google Scholar] [CrossRef] [Green Version]
  2. Page, S.E.; Rieley, J.O.; Banks, C.J. Global and regional importance of the tropical peatland carbon pool. Glob. Chang. Biol. 2011, 17, 798–818. [Google Scholar] [CrossRef] [Green Version]
  3. Cochard, R. Scaling the Costs of Natural Ecosystem Degradation and Biodiversity Losses in Aceh Province, Sumatra. In Redefining Diversity and Dynamics of Natural Resources Management in Asia; Elsevier Inc.: Amsterdam, The Netherlands, 2017; Volume 1, pp. 231–271. ISBN 9780128104705. [Google Scholar]
  4. Page, S.E.; Rieley, J.O.; Shotyk, W.; Weiss, D. Interdependence of peat and vegetation in a tropical peat swamp forest. Philos. Trans. R. Soc. Lond. B. Biol. Sci. 1999, 354, 1885–1897. [Google Scholar] [CrossRef]
  5. Noon, M.L.; Goldstein, A.; Ledezma, J.C.; Roehrdanz, P.R.; Cook-Patton, S.C.; Spawn-Lee, S.A.; Wright, T.M.; Gonzalez-Roglich, M.; Hole, D.G.; Rockström, J.; et al. Mapping the irrecoverable carbon in Earth’s ecosystems. Nat. Sustain. 2021, 5. [Google Scholar] [CrossRef]
  6. Warren, M.; Frolking, S.; Dai, Z.; Kurnianto, S. Impacts of land use, restoration, and climate change on tropical peat carbon stocks in the twenty-first century: Implications for climate mitigation. Mitig. Adapt. Strateg. Glob. Chang. 2017, 22, 1041–1061. [Google Scholar] [CrossRef] [PubMed] [Green Version]
  7. Wösten, J.H.M.; Clymans, E.; Page, S.E.; Rieley, J.O.; Limin, S.H. Peat-water interrelationships in a tropical peatland ecosystem in Southeast Asia. Catena 2008, 73, 212–224. [Google Scholar] [CrossRef]
  8. Page, S.E.; Baird, A.J. Peatlands and Global Change: Response and Resilience. Annu. Rev. Environ. Resour. 2016, 41, 35–57. [Google Scholar] [CrossRef]
  9. Page, S.E.; Hooijer, A. In the line of fire: The peatlands of Southeast Asia. Philos. Trans. R. Soc. B Biol. Sci. 2016, 371, 20150176. [Google Scholar] [CrossRef] [Green Version]
  10. Ritzema, H.; Limin, S.; Kusin, K.; Jauhiainen, J.; Wösten, H. Canal blocking strategies for hydrological restoration of degraded tropical peatlands in Central Kalimantan, Indonesia. Catena 2014, 114, 11–20. [Google Scholar] [CrossRef] [Green Version]
  11. Wösten, J.H.M.; Van Den Berg, J.; Van Eijk, P.; Gevers, G.J.M.; Giesen, W.B.J.T.; Hooijer, A.; Idris, A.; Leenman, P.H.; Rais, D.S.; Siderius, C.; et al. Interrelationships between Hydrology and Ecology in Fire Degraded Tropical Peat Swamp Forests. Int. J. Water Resour. Dev. 2006, 22, 157–174. [Google Scholar] [CrossRef]
  12. Miettinen, J.; Shi, C.; Liew, S.C. Deforestation rates in insular Southeast Asia between 2000 and 2010. Glob. Chang. Biol. 2011, 17, 2261–2270. [Google Scholar] [CrossRef]
  13. Usup, A.; Hashimoto, Y.; Takahashi, H.; Hayasaka, H. Combustion and thermal characteristics of peat fire in tropical peatland in Central Kalimantan, Indonesia. Tropics 2004, 14, 1–19. [Google Scholar] [CrossRef] [Green Version]
  14. Hooijer, A.; Page, S.; Canadell, J.G.; Silvius, M.; Kwadijk, J.; Wösten, H.; Jauhiainen, J. Current and future CO 2 emissions from drained peatlands in Southeast Asia. Biogeosciences 2010, 7, 1505–1514. [Google Scholar] [CrossRef] [Green Version]
  15. Huijnen, V.; Wooster, M.J.; Kaiser, J.W.; Gaveau, D.L.A.; Flemming, J.; Parrington, M.; Inness, A.; Murdiyarso, D.; Main, B.; Van Weele, M. Fire carbon emissions over maritime southeast Asia in 2015 largest since 1997. Sci. Rep. 2016, 6, 1–8. [Google Scholar] [CrossRef] [Green Version]
  16. Page, S.; Hoscilo, A.; Langner, A.; Tansey, K.; Siegert, F.; Limin, S.; Rieley, J. Tropical peatland fires in Southeast Asia. In Tropical Fire Ecology: Climate Change, Land Use, and Ecosystem Dynamics; Springer: Heidelberg, Germany, 2009; pp. 263–287. ISBN 978-3-540-77380-1(H). [Google Scholar]
  17. Crippa, P.; Castruccio, S.; Archer-Nicholls, S.; Lebron, G.B.; Kuwata, M.; Thota, A.; Sumin, S.; Butt, E.; Wiedinmyer, C.; Spracklen, D.V. Population exposure to hazardous air quality due to the 2015 fires in Equatorial Asia. Sci. Rep. 2016, 6, 1–9. [Google Scholar] [CrossRef] [Green Version]
  18. Harrison, M.E.; Ottay, J.B.; D’Arcy, L.J.; Cheyne, S.M.; Anggodo; Belcher, C.; Cole, L.; Dohong, A.; Ermiasi, Y.; Feldpausch, T.; et al. Tropical forest and peatland conservation in Indonesia: Challenges and directions. People Nat. 2020, 2, 4–28. [Google Scholar] [CrossRef] [Green Version]
  19. Syaufina, L.; Hamzah, A.A. Changes of tree species diversity in peatland impacted by moderate fire severity at Teluk Meranti, Pelalawan, Riau Province, Indonesia. Biodiversitas 2021, 22, 2899–2908. [Google Scholar] [CrossRef]
  20. Chisholm, R.A.; Wijedasa, L.S.; Swinfield, T. The need for long-term remedies for Indonesia’s forest fires. Conserv. Biol. 2016, 30, 5–6. [Google Scholar] [CrossRef]
  21. Wich, S.A.; Singleton, I.; Nowak, M.G.; Atmoko, S.S.U.; Nisam, G.; Arif, S.M.; Putra, R.H.; Ardi, R.; Fredriksson, G.; Usher, G.; et al. Land-cover changes predict steep declines for the Sumatran orangutan (Pongo abelii). Sci. Adv. 2016, 2, 1–9. [Google Scholar] [CrossRef] [Green Version]
  22. Certini, G.; Moya, D.; Lucas-Borja, M.E.; Mastrolonardo, G. The impact of fire on soil-dwelling biota: A review. For. Ecol. Manage. 2021, 488, 118989. [Google Scholar] [CrossRef]
  23. Hamada, J.-I.; Yamanaka, M.D.; Matsumoto, J.; Fukao, S.; Winarso, P.A.; Sribimawati, T. Spatial and Temporal Variations of the Rainy Season over Indonesia and their Link to ENSO. J. Meteorol. Soc. Japan 2002, 80, 285–310. [Google Scholar] [CrossRef] [Green Version]
  24. Latif, M.; Keenlyside, N.S. El Niño/Southern Oscillation response to global warming. Proc. Natl. Acad. Sci. USA 2009, 106, 20578–20583. [Google Scholar] [CrossRef] [PubMed] [Green Version]
  25. McPhaden, M.J.; Busalacchi, A.J.; Cheney, R.; Donguy, J.-R.; Gage, K.S.; Halpern, D.; Ji, M.; Julian, P.; Meyers, G.; Mitchum, G.T.; et al. The Tropical Ocean-Global Atmosphere observing system: A decade of progress. J. Geophys. Res. Ocean. 1998, 103, 14169–14240. [Google Scholar] [CrossRef]
  26. Wang, H.J.; Zhang, R.H.; Cole, J.; Chavez, F. El Niño and the related phenomenon southern oscillation (ENSO): The largest signal in interannual climate variation. Proc. Natl. Acad. Sci. USA 1999, 96, 11071–11072. [Google Scholar] [CrossRef] [Green Version]
  27. Murdiyarso, D.; Adiningsih, E.S. Climate anomalies, Indonesian vegetation fires and terrestrial carbon emissions. Mitig. Adapt. Strateg. Glob. Chang. 2007, 12, 101–112. [Google Scholar] [CrossRef]
  28. Condro, A.A.; Pawitan, H.; Risdiyanto, I. Predicting drought propagation within peat layers using a three dimensionally explicit voxel based model. IOP Conf. Ser. Earth Environ. Sci. 2018, 149. [Google Scholar] [CrossRef] [Green Version]
  29. Parker, R.J.; Boesch, H.; Wooster, M.J.; Moore, D.P.; Webb, A.J.; Gaveau, D.; Murdiyarso, D. Atmospheric CH4 and CO2 enhancements and biomass burning emission ratios derived from satellite observations of the 2015 Indonesian fire plumes. Atmos. Chem. Phys. 2016, 16, 10111–10131. [Google Scholar] [CrossRef] [Green Version]
  30. Tacconi, L. Fires in Indonesia: Causes, Costs and Policy Implications. Available online: https://www.cifor.org/knowledge/publication/1130 (accessed on 18 May 2022).
  31. Chen, Y.; Morton, D.C.; Andela, N.; Van Der Werf, G.R.; Giglio, L.; Randerson, J.T. A pan-tropical cascade of fire driven by El Niño/Southern Oscillation. Nat. Clim. Chang. 2017, 7, 906–911. [Google Scholar] [CrossRef]
  32. Murdiyarso, D.; Lebel, L.; Gintings, A.N.; Tampubolon, S.M.H.; Heil, A.; Wasson, M. Policy responses to complex environmental problems: Insights from a science-policy activity on transboundary haze from vegetation fires in Southeast Asia. Agric. Ecosyst. Environ. 2004, 104, 47–56. [Google Scholar] [CrossRef] [Green Version]
  33. Sakti, A.D.; Fauzi, A.I.; Takeuchi, W.; Pradhan, B.; Yarime, M.; Vega-Garcia, C.; Agustina, E.; Wibisono, D.; Anggraini, T.S.; Theodora, M.O.; et al. Spatial Prioritization for Wildfire Mitigation by Integrating Heterogeneous Spatial Data: A New Multi-Dimensional Approach for Tropical Rainforests. Remote Sens. 2022, 14, 543. [Google Scholar] [CrossRef]
  34. Vetrita, Y.; Cochrane, M.A. Fire frequency and related land-use and land-cover changes in Indonesia’s Peatlands. Remote Sens. 2020, 12, 5. [Google Scholar] [CrossRef] [Green Version]
  35. Moritz, M.A.; Parisien, M.-A.; Batllori, E.; Krawchuk, M.A.; Van Dorn, J.; Ganz, D.J.; Hayhoe, K. Climate change and disruptions to global fire activity. Ecosphere 2012, 3, art49. [Google Scholar] [CrossRef]
  36. Aldersley, A.; Murray, S.J.; Cornell, S.E. Global and regional analysis of climate and human drivers of wildfire. Sci. Total Environ. 2011, 409, 3472–3481. [Google Scholar] [CrossRef] [PubMed]
  37. Bradstock, R.A. A biogeographic model of fire regimes in Australia: Current and future implications. Glob. Ecol. Biogeogr. 2010, 19, 145–158. [Google Scholar] [CrossRef]
  38. Marlon, J.R.; Bartlein, P.J.; Carcaillet, C.; Gavin, D.G.; Harrison, S.P.; Higuera, P.E.; Joos, F.; Power, M.J.; Prentice, I.C. Climate and human influences on global biomass burning over the past two millennia. Nat. Geosci. 2008, 1, 697–702. [Google Scholar] [CrossRef]
  39. Forzieri, G.; Girardello, M.; Ceccherini, G.; Spinoni, J.; Feyen, L.; Hartmann, H.; Beck, P.S.A.; Camps-Valls, G.; Chirici, G.; Mauri, A.; et al. Emergent vulnerability to climate-driven disturbances in European forests. Nat. Commun. 2021, 12, 1–12. [Google Scholar] [CrossRef]
  40. IPCC. Summary for Policymakers. In Climate Change 2014: Impacts, Adaptation, and Vulnerability; IPCC: Geneva, Switzerland, 2014; pp. 1–32. ISBN 978-1-107-64165-5. [Google Scholar]
  41. Chuvieco, E. Wildland Fire Danger Estimation and Mapping; Series in Remote Sensing; World Scientific: Alcalá de Henares, Spain, 2003; Volume 4, ISBN 978-981-238-569-7. [Google Scholar]
  42. Rather, M.A.; Farooq, M.; Meraj, G.; Dada, M.A.; Sheikh, B.A.; Wani, I.A. Remote Sensing and GIS Based Forest Fire Vulnerability Assessment in Dachigam National Park, North Western Himalaya. Asian J. Appl. Sci. 2018, 11, 98–114. [Google Scholar] [CrossRef] [Green Version]
  43. Tomar, J.S.; Kranjčić, N.; Đurin, B.; Kanga, S.; Singh, S.K. Forest Fire Hazards Vulnerability and Risk Assessment in Sirmaur District Forest of Himachal Pradesh (India): A Geospatial Approach. ISPRS Int. J. Geo-Information 2021, 10, 447. [Google Scholar] [CrossRef]
  44. Bourgeau-Chavez, L.L.; Grelik, S.L.; Billmire, M.; Jenkins, L.K.; Kasischke, E.S.; Turetsky, M.R. Assessing Boreal Peat Fire Severity and Vulnerability of Peatlands to Early Season Wildland Fire. Front. For. Glob. Chang. 2020, 3, 1–13. [Google Scholar] [CrossRef]
  45. Jain, P.; Coogan, S.C.P.; Subramanian, S.G.; Crowley, M.; Taylor, S.; Flannigan, M.D. A review of machine learning applications in wildfire science and management. Environ. Rev. 2020, 28, 478–505. [Google Scholar] [CrossRef]
  46. Adab, H. Landfire hazard assessment in the Caspian Hyrcanian forest ecoregion with the long-term MODIS active fire data. Nat. Hazards 2017, 87, 1807–1825. [Google Scholar] [CrossRef]
  47. Bisquert, M.; Caselles, E.; Sánchez, J.M.; Caselles, V. Application of artificial neural networks and logistic regression to the prediction of forest fire danger in Galicia using MODIS data. Int. J. Wildl. Fire 2012, 21, 1025. [Google Scholar] [CrossRef]
  48. Jafari Goldarag, Y.; Mohammadzadeh, A.; Ardakani, A.S. Fire Risk Assessment Using Neural Network and Logistic Regression. J. Indian Soc. Remote Sens. 2016, 44, 885–894. [Google Scholar] [CrossRef]
  49. Song, C.; Kwan, M.-P.; Song, W.; Zhu, J. A Comparison between Spatial Econometric Models and Random Forest for Modeling Fire Occurrence. Sustainability 2017, 9, 819. [Google Scholar] [CrossRef] [Green Version]
  50. Peters, M.P.; Iverson, L.R. Incorporating fine-scale drought information into an eastern US wildfire hazard model. Int. J. Wildl. Fire 2017, 26, 393. [Google Scholar] [CrossRef]
  51. Rodrigues, M.; de la Riva, J. An insight into machine-learning algorithms to model human-caused wildfire occurrence. Environ. Model. Softw. 2014, 57, 192–201. [Google Scholar] [CrossRef]
  52. Gigović, L.; Pourghasemi, H.R.; Drobnjak, S.; Bai, S. Testing a new ensemble model based on SVM and random forest in forest fire susceptibility assessment and its mapping in Serbia’s Tara National Park. Forests 2019, 10, 408. [Google Scholar] [CrossRef] [Green Version]
  53. Osaki, M.; Nursyamsi, D.; Noor, M.; Wahyunto; Segah, H. Peatland in Indonesia. In Tropical Peatland Ecosystems; Springer: Tokyo, Japan, 2016; pp. 49–58. [Google Scholar]
  54. Silvius, B.M.; Diemont, H. Peatlands, Climate Change, Poverty, Biofuels, Pulp and Reduced Emissions from Deforestation and Degradation. Available online: https://bit.ly/3G0NzO8 (accessed on 18 May 2022).
  55. Siegert, F.; Ruecker, G.; Hinrichs, A.; Hoffmann, A.A. Increased damage from fires in logged forests during droughts caused by El Niño. Nature 2001, 414, 437–440. [Google Scholar] [CrossRef]
  56. Cochrane, M.A. Synergistic Interactions between Habitat Fragmentation and Fire in Evergreen Tropical Forests. Conserv. Biol. 2001, 15, 1515–1521. [Google Scholar] [CrossRef]
  57. Rossita, A.; Nurrochmat, D.R.; Boer, R.; Hein, L.; Riqqi, A. Assessing the monetary value of ecosystem services provided by Gaung—Batang Tuaka Peat Hydrological Unit (KHG), Riau Province. Heliyon 2021, 7, e08208. [Google Scholar] [CrossRef]
  58. Veloz, S.D. Spatially autocorrelated sampling falsely inflates measures of accuracy for presence-only niche models. J. Biogeogr. 2009, 36, 2290–2299. [Google Scholar] [CrossRef]
  59. Aiello-Lammens, M.E.; Boria, R.A.; Radosavljevic, A.; Vilela, B.; Anderson, R.P. spThin: An R package for spatial thinning of species occurrence records for use in ecological niche models. Ecography (Cop.) 2015, 38, 541–545. [Google Scholar] [CrossRef]
  60. Glantz, M.H.; Ramirez, I.J. Reviewing the Oceanic Niño Index (ONI) to Enhance Societal Readiness for El Niño’s Impacts. Int. J. Disaster Risk Sci. 2020, 11, 394–403. [Google Scholar] [CrossRef]
  61. Funk, C.; Peterson, P.; Landsfeld, M.; Pedreros, D.; Verdin, J.; Shukla, S.; Husak, G.; Rowland, J.; Harrison, L.; Hoell, A.; et al. The climate hazards infrared precipitation with stations—A new environmental record for monitoring extremes. Sci. Data 2015, 2, 1–21. [Google Scholar] [CrossRef] [PubMed] [Green Version]
  62. Navarro-Racines, C.; Tarapues, J.; Thornton, P.; Jarvis, A.; Ramirez-Villegas, J. High-resolution and bias-corrected CMIP5 projections for climate change impact assessments. Sci. Data 2020, 7, 1–14. [Google Scholar] [CrossRef] [PubMed] [Green Version]
  63. Karger, D.N.; Schmatz, D.R.; Dettling, G.; Zimmermann, N.E. High-resolution monthly precipitation and temperature time series from 2006 to 2100. Sci. Data 2020, 7, 1–10. [Google Scholar] [CrossRef]
  64. Guttman, N.B. Accepting the standardized precipitation index: A calculation algorithm. J. Am. Water Resour. Assoc. 1999, 35, 311–322. [Google Scholar] [CrossRef]
  65. Yamamoto, Y.; Takeuchi, K. The Potential for REDD+ in Peatland of Central Kalimantan, Indonesia, In Tropical Peatland Ecosystems; Springer: Tokyo, Japan, 2016; pp. 599–612. ISBN 978-4-431-55680-0. [Google Scholar]
  66. Taufik, M.; Setiawan, B.I.; van Lanen, H.A.J. Modification of a fire drought index for tropical wetland ecosystems by including water table depth. Agric. For. Meteorol. 2015, 203, 1–10. [Google Scholar] [CrossRef] [Green Version]
  67. Van, A.N.; Oo, K.S.; Takeuchi, W. Development of an advanced global field survey system (GFSS) for terrestrial monitoring and mapping with a demonstration for agricultural cropland mapping in Asia. Photogramm. Eng. Remote Sensing 2012, 78, 875–884. [Google Scholar] [CrossRef]
  68. Gorelick, N.; Hancher, M.; Dixon, M.; Ilyushchenko, S.; Thau, D.; Moore, R. Google Earth Engine: Planetary-scale geospatial analysis for everyone. Remote Sens. Environ. 2017, 202, 18–27. [Google Scholar] [CrossRef]
  69. Harrison, M.E.; Page, S.E.; Limin, S.H. The global impact of Indonesian forest fires. Biologist 2009, 56, 156–163. [Google Scholar]
  70. Nyhus, P.; Tilson, R. Agroforestry, elephants, and tigers: Balancing conservation theory and practice in human-dominated landscapes of Southeast Asia. Agric. Ecosyst. Environ. 2004, 104, 87–97. [Google Scholar] [CrossRef] [Green Version]
  71. Siegert, F.; Hoffmann, A.A. The 1998 Forest Fires in East Kalimantan (Indonesia). Remote Sens. Environ. 2000, 72, 64–77. [Google Scholar] [CrossRef]
  72. Verburg, P.H.; Ritsema van Eck, J.R.; de Nijs, T.C.M.; Dijst, M.J.; Schot, P. Determinants of land-use change patterns in the Netherlands. Environ. Plan. B Plan. Des. 2004, 31, 125–150. [Google Scholar] [CrossRef] [Green Version]
  73. Gaveau, D.L.A.; Epting, J.; Lyne, O.; Linkie, M.; Kumara, I.; Kanninen, M.; Leader-Williams, N. Evaluating whether protected areas reduce tropical deforestation in Sumatra. J. Biogeogr. 2009, 36, 2165–2175. [Google Scholar] [CrossRef]
  74. Farr, T.G.; Rosen, P.A.; Caro, E.; Crippen, R.; Duren, R.; Hensley, S.; Kobrick, M.; Paller, M.; Rodriguez, E.; Roth, L.; et al. The shuttle radar topography mission. Rev. Geophys. 2007, 45. [Google Scholar] [CrossRef] [Green Version]
  75. OSM Indonesia Open Street Map Dataset. Available online: https://www.geofabrik.de/data/download.html (accessed on 14 March 2022).
  76. Margono, B.A.; Potapov, P.V.; Turubanova, S.; Stolle, F.; Hansen, M.C. Primary forest cover loss in indonesia over 2000–2012. Nat. Clim. Chang. 2014, 4, 730–735. [Google Scholar] [CrossRef]
  77. Kennedy, C.M.; Oakleaf, J.R.; Theobald, D.M.; Baruch-Mordo, S.; Kiesecker, J. Managing the middle: A shift in conservation priorities based on the global human modification gradient. Glob. Chang. Biol. 2019, 25, 811–826. [Google Scholar] [CrossRef]
  78. WorldPop Indonesia 100 m Population. Available online: http://esa.un.org/wpp/ (accessed on 4 February 2022).
  79. Soto-Navarro, C.; Ravilious, C.; Arnell, A.; De Lamo, X.; Harfoot, M.; Hill, S.L.L.; Wearn, O.R.; Santoro, M.; Bouvet, A.; Mermoz, S.; et al. Mapping co-benefits for carbon storage and biodiversity to inform conservation policy and action. Philos. Trans. R. Soc. B Biol. Sci. 2020, 375. [Google Scholar] [CrossRef] [Green Version]
  80. Spawn, S.A.; Sullivan, C.C.; Lark, T.J.; Gibbs, H.K. Harmonized global maps of above and belowground biomass carbon density in the year 2010. Sci. Data 2020, 7, 1–22. [Google Scholar] [CrossRef]
  81. Setiawan, Y.; Kustiyo, K.; Darmawan, A. A simple method for developing near real-time nationwide forest monitoring for Indonesia using MODIS near- and shortwave infrared bands. Remote Sens. Lett. 2016, 7, 318–327. [Google Scholar] [CrossRef]
  82. Huete, A.; Didan, K.; Miura, T.; Rodriguez, E.P.; Gao, X.; Ferreira, L.G. Overview of the radiometric and biophysical performance of the MODIS vegetation indices. Remote Sens. Environ. 2002, 83, 195–213. [Google Scholar] [CrossRef]
  83. Gao, B.-C. NDWI—A Normalized Difference Water Index for Remote Sensing of Vegetation Liquid Water From Space. Remote Sens. Environ. 1996, 58, 257–266. [Google Scholar] [CrossRef]
  84. Huete, A.R. A soil-adjusted vegetation index (SAVI). Remote Sens. Environ. 1988, 25, 295–309. [Google Scholar] [CrossRef]
  85. Mahecha, M.D.; Martínez, A.; Lischeid, G.; Beck, E. Nonlinear dimensionality reduction: Alternative ordination approaches for extracting and visualizing biodiversity patterns in tropical montane forest vegetation data. Ecol. Inform. 2007, 2, 138–149. [Google Scholar] [CrossRef]
  86. Zhao, N.; Xu, Q.; Tang, M.; Jiang, B.; Chen, Z.; Wang, H. High-dimensional variable screening under multicollinearity. Stat 2020, 9, e272. [Google Scholar] [CrossRef]
  87. Dormann, C.F.; Elith, J.; Bacher, S.; Buchmann, C.; Carl, G.; Carré, G.; Marquéz, J.R.G.; Gruber, B.; Lafourcade, B.; Leitão, P.J.; et al. Collinearity: A review of methods to deal with it and a simulation study evaluating their performance. Ecography (Cop.) 2013, 36, 27–46. [Google Scholar] [CrossRef]
  88. Toothaker, L.E.; Aiken, L.S.; West, S.G. Multiple Regression: Testing and Interpreting Interactions. J. Oper. Res. Soc. 1994, 45, 119. [Google Scholar] [CrossRef]
  89. Farrar, D.E.; Glauber, R.R. Multicollinearity in Regression Analysis: The Problem Revisited. Rev. Econ. Stat. 1967, 49, 92. [Google Scholar] [CrossRef]
  90. O’brien, R.M. A Caution Regarding Rules of Thumb for Variance Inflation Factors. Qual. Quant. 2007, 41, 673–690. [Google Scholar] [CrossRef]
  91. Tu, Y.-K.; Clerehugh, V.; Gilthorpe, M.S. Collinearity in linear regression is a serious problem in oral health research. Eur. J. Oral Sci. 2004, 112, 389–397. [Google Scholar] [CrossRef] [PubMed]
  92. Graham, M.H. Confronting Multicollinearity in Ecological Multiple Regression. Ecology 2003, 84, 2809–2815. [Google Scholar] [CrossRef] [Green Version]
  93. Mason, C.H.; Perreault, W.D. Collinearity, Power, and Interpretation of Multiple Regression Analysis. J. Mark. Res. 1991, 28, 268. [Google Scholar] [CrossRef]
  94. Fekedulegn, B.D.; Colbert, J.J.; Hicks, R.R., Jr.; Schuckers, M.E.; Service, F.; Fekedulegn, B.D.; Colbert, J.J.; Hicks, R.R.; Schuckers, M.E. Coping with Multicollinearity: An Example on Application of Principal Components Regression in Dendroecology; United States Department of Agriculture: Newton Square, PA, USA, 2002. [CrossRef]
  95. Stewart, G.W. Collinearity and Least Squares Regression. Stat. Sci. 1987, 2, 68–84. [Google Scholar] [CrossRef]
  96. Gordon, R.A. Issues in Multiple Regression. Am. J. Sociol. 1968, 73, 592–616. [Google Scholar] [CrossRef]
  97. Feng, X.; Park, D.S.; Walker, C.; Peterson, A.T.; Merow, C.; Papeş, M. A checklist for maximizing reproducibility of ecological niche models. Nat. Ecol. Evol. 2019, 3, 1382–1395. [Google Scholar] [CrossRef] [Green Version]
  98. de Andrade, A.F.A.; Velazco, S.J.E.; De Marco Júnior, P. ENMTML: An R package for a straightforward construction of complex ecological niche models. Environ. Model. Softw. 2020, 125, 104615. [Google Scholar] [CrossRef]
  99. Breiman, L. Random forests. Mach. Learn. 2001, 45, 5–32. [Google Scholar] [CrossRef] [Green Version]
  100. Hastie, T.; Tibshirani, R.; Friedman, J. The Elements of Statistical Learning: Data Mining, Inference, and Prediction, 2nd ed.; Springer: New York, NY, USA, 2009; ISBN 978-0-387-84858-7. [Google Scholar]
  101. Karatzoglou, A.; Hornik, K.; Smola, A.; Zeileis, A. kernlab—An S4 package for kernel methods in R. J. Stat. Softw. 2004, 11, 1–20. [Google Scholar] [CrossRef] [Green Version]
  102. Phillips, S.J.; Anderson, R.P.; Schapire, R.E. Maximum entropy modeling of species geographic distributions. Ecol. Modell. 2006, 190, 231–259. [Google Scholar] [CrossRef] [Green Version]
  103. Barbet-Massin, M.; Jiguet, F.; Albert, C.H.; Thuiller, W. Selecting pseudo-absences for species distribution models: How, where and how many? Methods Ecol. Evol. 2012, 3, 327–338. [Google Scholar] [CrossRef]
  104. Owens, H.L.; Campbell, L.P.; Dornak, L.L.; Saupe, E.E.; Barve, N.; Soberón, J.; Ingenloff, K.; Lira-Noriega, A.; Hensz, C.M.; Myers, C.E.; et al. Constraints on interpretation of ecological niche models by limited environmental ranges on calibration areas. Ecol. Modell. 2013, 263, 10–18. [Google Scholar] [CrossRef]
  105. Mendes, P.; Velazco, S.J.E.; de Andrade, A.F.A.; De Marco, P. Dealing with overprediction in species distribution models: How adding distance constraints can improve model accuracy. Ecol. Modell. 2020, 431, 109180. [Google Scholar] [CrossRef]
  106. Thuiller, W.; Brotons, L.; Araújo, M.B.; Lavorel, S. Effects of restricting environmental range of data to project current and future species distributions. Ecography (Cop.) 2004, 27, 165–172. [Google Scholar] [CrossRef]
  107. Leroy, B.; Delsol, R.; Hugueny, B.; Meynard, C.N.; Barhoumi, C.; Barbet-Massin, M.; Bellard, C. Without quality presence–absence data, discrimination metrics such as TSS can be misleading measures of model performance. J. Biogeogr. 2018, 45, 1994–2002. [Google Scholar] [CrossRef]
  108. Hartley, A.J.; MacBean, N.; Georgievski, G.; Bontemps, S. Uncertainty in plant functional type distributions and its impact on land surface models. Remote Sens. Environ. 2017, 203, 71–89. [Google Scholar] [CrossRef]
  109. Verburg, P.H.; Neumann, K.; Nol, L. Challenges in using land use and land cover data for global change studies. Glob. Chang. Biol. 2011, 17, 974–989. [Google Scholar] [CrossRef] [Green Version]
  110. Gaveau, D.; Descals, A.; Salim, M.; Sheil, D.; Sloan, S. Refined burned-area mapping protocol using Sentinel-2 data increases estimate of 2019 Indonesian burning. Earth Syst. Sci. Data Discuss. 2021, 17, 974–989. [Google Scholar] [CrossRef]
  111. Wang, S.; Zhuang, Q.; Jin, X.; Yang, Z.; Liu, H. Predicting Soil Organic Carbon and Soil Nitrogen Stocks in Topsoil of Forest Ecosystems in Northeastern China Using Remote Sensing Data. Remote Sens. 2020, 12, 1115. [Google Scholar] [CrossRef] [Green Version]
  112. Alademomi, A.S.; Okolie, C.J.; Daramola, O.E.; Agboola, R.O.; Salami, T.J. Assessing the Relationship of LST, NDVI and EVI with Land Cover Changes in the Lagos Lagoon Environment. Quaest. Geogr. 2020, 39, 87–109. [Google Scholar] [CrossRef]
  113. Feng, X.; Park, D.S.; Liang, Y.; Pandey, R.; Papeş, M. Collinearity in ecological niche modeling: Confusions and challenges. Ecol. Evol. 2019, 9, 10365–10376. [Google Scholar] [CrossRef] [PubMed] [Green Version]
  114. Deshmukh, C.S.; Julius, D.; Desai, A.R.; Asyhari, A.; Page, S.E.; Nardi, N.; Susanto, A.P.; Nurholis, N.; Hendrizal, M.; Kurnianto, S.; et al. Conservation slows down emission increase from a tropical peatland in Indonesia. Nat. Geosci. 2021, 14, 484–490. [Google Scholar] [CrossRef]
  115. Lin, S.; Liu, Y.; Huang, X. Climate-induced Arctic-boreal peatland fire and carbon loss in the 21st century. Sci. Total Environ. 2021, 796, 148924. [Google Scholar] [CrossRef] [PubMed]
  116. Ribeiro, K.; Pacheco, F.S.; Ferreira, J.W.; Sousa-Neto, E.R.; Hastie, A.; Krieger Filho, G.C.; Alvalá, P.C.; Forti, M.C.; Ometto, J.P. Tropical peatlands and their contribution to the global carbon cycle and climate change. Glob. Chang. Biol. 2021, 27, 489–505. [Google Scholar] [CrossRef] [PubMed]
  117. Taufik, M.; Torfs, P.J.J.F.; Uijlenhoet, R.; Jones, P.D.; Murdiyarso, D.; Van Lanen, H.A.J. Amplification of wildfire area burnt by hydrological drought in the humid tropics. Nat. Clim. Chang. 2017, 7, 428–431. [Google Scholar] [CrossRef] [Green Version]
  118. Hansen, J.V. Combining predictors: Comparison of five meta machine learning methods. Inf. Sci. 1999, 119, 91–105. [Google Scholar] [CrossRef]
  119. Chawla, N.V.; Sylvester, J. Exploiting Diversity in Ensembles: Improving the Performance on Unbalanced Datasets. In Proceedings of the 7th International Workshop, MCS 2007, Prague, Czech Republic, 23–25 May 2007; Volume 4472. [Google Scholar]
  120. Miettinen, J.; Liew, S.C. Status of peatland degradation and development in Sumatra and Kalimantan. Ambio 2010, 39, 394–401. [Google Scholar] [CrossRef] [Green Version]
  121. Thorburn, C.C.; Kull, C.A. Peatlands and plantations in Sumatra, Indonesia: Complex realities for resource governance, rural development and climate change mitigation. Asia Pac. Viewp. 2015, 56, 153–168. [Google Scholar] [CrossRef] [Green Version]
  122. Hirano, T.; Segah, H.; Kusin, K.; Limin, S.; Takahashi, H.; Osaki, M. Effects of disturbances on the carbon balance of tropical peat swamp forests. Glob. Chang. Biol. 2012, 18, 3410–3422. [Google Scholar] [CrossRef]
  123. Escuin, S.; Navarro, R.; Fernández, P. Fire severity assessment by using NBR (Normalized Burn Ratio) and NDVI (Normalized Difference Vegetation Index) derived from LANDSAT TM/ETM images. Int. J. Remote Sens. 2008, 29, 1053–1073. [Google Scholar] [CrossRef]
  124. Chen, X.; Vogelmann, J.E.; Rollins, M.; Ohlen, D.; Key, C.H.; Yang, L.; Huang, C.; Shi, H. Detecting post-fire burn severity and vegetation recovery using multitemporal remote sensing spectral indices and field-collected composite burn index data in a ponderosa pine forest. Int. J. Remote Sens. 2011, 32, 7905–7927. [Google Scholar] [CrossRef]
  125. Hoscilo, A.; Page, S.E.; Tansey, K.J.; Rieley, J.O. Effect of repeated fires on land-cover change on peatland in southern Central Kalimantan, Indonesia, from 1973 to 2005. Int. J. Wildl. Fire 2011, 20, 578. [Google Scholar] [CrossRef]
  126. Ryu, J.-H.; Han, K.-S.; Hong, S.; Park, N.-W.; Lee, Y.-W.; Cho, J. Satellite-Based Evaluation of the Post-Fire Recovery Process from the Worst Forest Fire Case in South Korea. Remote Sens. 2018, 10, 918. [Google Scholar] [CrossRef] [Green Version]
  127. Ghulam, A.; Li, Z.-L.; Qin, Q.; Yimit, H.; Wang, J. Estimating crop water stress with ETM+ NIR and SWIR data. Agric. For. Meteorol. 2008, 148, 1679–1695. [Google Scholar] [CrossRef]
  128. Wang, L.; Qu, J.J.; Hao, X. Forest fire detection using the normalized multi-band drought index (NMDI) with satellite measurements. Agric. For. Meteorol. 2008, 148, 1767–1776. [Google Scholar] [CrossRef]
  129. Herawati, H.; Ali Akbar, A.; Farastika, D. Azmeri Water Table Evaluation Post the Construction of Canal Blocks on Peatland in West Kalimantan, Indonesia. In Proceedings of the 4th International Conference on Rehabilitation and Maintenance in Civil Engineering (ICRMCE 2018), Solo, Indonesia, 11–12 July 2018; Volume 195. [Google Scholar]
  130. Sutikno, S.; Nasrul, B.; Gunawan, H.; Jayadi, R.; Rinaldi; Saputra, E.; Yamamoto, K. The effectiveness of canal blocking for hydrological restoration in tropical peatland. In Proceedings of the International Conference on Advances in Civil and Environmental Engineering (ICAnCEE 2018), Bali, Indonesia, 24–25 October 2018; Volume 276. [Google Scholar] [CrossRef] [Green Version]
  131. Taufik, M.; Widyastuti, M.T.; Sulaiman, A.; Murdiyarso, D.; Santikayasa, I.P.; Minasny, B. An improved drought-fire assessment for managing fire risks in tropical peatlands. Agric. For. Meteorol. 2022, 312, 108738. [Google Scholar] [CrossRef]
  132. Erisman, J.W.; Galloway, J.N.; Seitzinger, S.; Bleeker, A.; Dise, N.B.; Petrescu, A.M.R.; Leach, A.M.; de Vries, W. Consequences of human modification of the global nitrogen cycle. Philos. Trans. R. Soc. B Biol. Sci. 2013, 368, 20130116. [Google Scholar] [CrossRef] [Green Version]
  133. Nurhayati, A.D.; Hero Saharjo, B.; Sundawati, L.; Syartinilia, S.; Cochrane, M.A. Forest and Peatland Fire Dynamics in South Sumatra Province. For. Soc. 2021, 5, 591–603. [Google Scholar] [CrossRef]
  134. Ketterings, Q.M.; Tri Wibowo, T.; van Noordwijk, M.; Penot, E. Farmers’ perspectives on slash-and-burn as a land clearing method for small-scale rubber producers in Sepunggur, Jambi Province, Sumatra, Indonesia. For. Ecol. Manage. 1999, 120, 157–169. [Google Scholar] [CrossRef]
  135. Marlier, M.E.; DeFries, R.S.; Kim, P.S.; Koplitz, S.N.; Jacob, D.J.; Mickley, L.J.; Myers, S.S. Fire emissions and regional air quality impacts from fires in oil palm, timber, and logging concessions in Indonesia. Environ. Res. Lett. 2015, 10, 085005. [Google Scholar] [CrossRef]
  136. Yuwati, T.W.; Rachmanadi, D.; Pratiwi; Turjaman, M.; Indrajaya, Y.; Nugroho, H.Y.S.H.; Qirom, M.A.; Narendra, B.H.; Winarno, B.; Lestari, S.; et al. Restoration of degraded tropical peatland in indonesia: A review. Land 2021, 10, 1170. [Google Scholar] [CrossRef]
  137. Tan, Z.D.; Lupascu, M.; Wijedasa, L.S. Paludiculture as a sustainable land use alternative for tropical peatlands: A review. Sci. Total Environ. 2021, 753, 142111. [Google Scholar] [CrossRef] [PubMed]
  138. Sayer, J.; Chokkalingam, U.; Poulsen, J. The restoration of forest biodiversity and ecological values. For. Ecol. Manage. 2004, 201, 3–11. [Google Scholar] [CrossRef]
Figure 1. Map of the study area of the Sumatran peatland, Indonesia.
Forests 13 00828 g001
Figure 2. Degree of collinearity for the model under (a) El-Nino, (b) Normal, and (c) La-Nina phase using variables selection (|r| ≤ 0.7). Significant pairwise variables indicate a strong multicollinearity between pair of variables, thus we considered to eliminate one of them.
Forests 13 00828 g002
Figure 3. Annual precipitation (a); Standardized Precipitation Index (b); and Keetch-Byram Drought Index (c) under various ENSO phases. The red dashed line depicts the average value from the data for each ENSO phase.
Forests 13 00828 g003
Figure 4. Box and whisker plots depicting the effects on discrimination metrics related to fire vulnerability algorithms. The whisker represents the mean ± standard deviation, and the box represents the mean ± standard error (BRT, boosted regression tree; MXD, maximum entropy; RDF, random forest; SVM, support vector machine; ENS, ensemble).
Forests 13 00828 g004
Figure 5. Spatial Sumatran peat vulnerability probability to fire based on the ensemble model (a) and relationships between number of fire density and vulnerability to fire probability (b) during various ENSO phases.
Forests 13 00828 g005
Figure 6. Categorical Sumatran peat vulnerability to fire spatial distribution based on the ensemble model (a) and area of each vulnerability class during various ENSO phases (b).
Forests 13 00828 g006
Figure 7. High and very-high peatland vulnerability to fires under ENSO phases within different land cover types. The size of dots indicates total area of vulnerability classes in squared km.
Forests 13 00828 g007
Figure 8. Area with high and very-high vulnerability classes in all ENSO phases, located in Nanggroe Aceh Darussalam Province (A), Riau Province (B), and South Sumatera Province (C).
Forests 13 00828 g008
Figure 9. Variable contribution under different ENSO phases.
Forests 13 00828 g009
Table 1. ENSO year classification used in this study.
ENSO PhasesPeriod
El-Nino (dry weather)2014, 2015, 2018
La-Nina (wet weather)2016, 2017
Normal2012, 2013, 2019
Publisher’s Note: MDPI stays neutral with regard to jurisdictional claims in published maps and institutional affiliations.

